
Abstract
Respiratory syncytial virus (RSV) is a commonly occurring pathogen that can cause severe disease in children, the elderly, and immunocompromised individuals with a large, unmet clinical need. We developed a high-throughput, primary cell-based antiviral RSV assay to enable identification of small molecules using cytopathic effect (CPE) as a phenotypic end point. To provide increased biological relevance, we developed our assay with primary human small airway epithelial cells (SAECs), which originate from known sites of RSV infection and replication instead of a more traditional immortalized cell line. Using purchased low-passage cells, cost-effective large-scale culture methods were developed to provide assay-ready frozen SAECs. A high-throughput screening campaign using the GSK Screening Collection was performed. The screen was executed in 384-well plates over a 12-week period with an average Z′ of 0.5. The screen yielded 17 post-entry hits with activity in the primary cells, which were not active in immortalized cells. Potencies for this class of compounds were equal between the primary and immortalize cell lines. For entry inhibitors, the number was much lower, with increased potency observed in immortalized cells. This is the first known use of frozen primary human cells for an RSV high-throughput screening phenotypic campaign.
Keywords
Introduction
Globally, respiratory syncytial virus (RSV) disease causes a significant medical and economic burden. RSV is a common pathogen that causes lower respiratory tract infection in children. It also affects the elderly and high-risk adults, including immunocompromised patient populations.
In 2005, there were an estimated 33.8 million new episodes of RSV-associated, acute, lower respiratory infections in children globally, with 99% of the deaths from those infections occurring in developing countries. 1 In addition, children born prematurely or identified as high risk due to underlying conditions such as chronic lung disease or congenital heart disease have an increased risk of mortality due to RSV infection. 2
There is a significant economic impact due to RSV disease. Viral infection is associated with substantial morbidity in children in the United States, and annual direct medical costs are estimated to be in excess of $625 million. 3 For the elderly in the United States, RSV-associated hospitalization costs alone are estimated to exceed $1 billion annually. 4
Over the past two decades, several research groups have used high-throughput screening (HTS) to identify small-molecule inhibitors of RSV. Many screens have resulted in the identification of RSV fusion inhibitors, notably BMS-433771, JNJ-2408068, TMC353121, and a series of inhibitors discovered by Biota.5–9 While exhibiting good potency against the virus in vitro, these inhibitors have failed in clinical development. 10 Yamanouchi Pharmaceuticals and Arrow Therapeutics have discovered small-molecule RSV replication inhibitors, YM-53403 and RSV-604, from high-throughput screens using RSV cytopathic effect assays in HeLa and Vero cells, respectively.11,12 A recent collaboration between the Universities of Louisville, and Kansas, and the screening center at Southern Research Institute, measured inhibition of the cytopathic effect (CPE) caused by RSV infection in HEp-2 cells to screen approximately 300,000 compounds from the Molecular Libraries Small Molecule Repository. The screen identified a novel chemotype, ML275, which is reported to act as a post-entry inhibitor of RSV. 13 It is also notable that Novartis (Basel, Switzerland) completed a high-throughput RSV screen of 1.7 million compounds using HEp-2 cells and reported the discovery of an inhibitor of the de novo pyrimidine biosynthesis pathway, which, although active in vitro, did not show efficacy in an animal model of RSV. 14
These previous screening campaigns have all relied on the use of immortalized cells, from diverse origins (examples, HeLa and HEp-2 cells from human cervical carcinoma, A549 cells from human lung carcinoma, and Vero cells from monkey kidney cells). To diversify from previous screens and enable identification of novel RSV replication inhibitors with potential increased human disease relevance, we report the screening of 1.98 million compounds using a phenotypic assay in a primary cell line derived from human lung small airway epithelium cells (SAECs). SAECs originate from known sites of RSV infection and replication in the lung.
Active compounds were analyzed for inhibition of RSV-mediated CPE in primary SAECs from multiple donors and in immortalized A549 cells to evaluate if the primary cells identified a diverse set of hits. Mode of action studies were carried out to characterize CPE as entry versus post-entry inhibition.
Materials and Methods
Normal human lung primary SAECs were purchased from Lonza (CC-2547; Allendale, NJ), where appropriate consent for research use of cells isolated from donated material is documented. SAECs from two adult donors (both male, aged 33 and 51 years) were used for separate frozen cell batches. Small airway basal media (SABM) were purchased from Lonza (CC-4124) and supplemented with Lonza SingleQuot kit supplements and growth factors (CC-4124) to make small airway growth media (SAGM). Human lung adenocarcinoma epithelial cells (A549) have been authenticated as identical to CCL-185 (A549 from ATCC, Manassas, VA). RSV virus strain long (VR-26) was purchased from ATCC. The following cell culture reagents were purchased from Life Technologies (Grand Island, NY): Dulbecco’s modified Eagle’s medium (DMEM) high glucose (11965-092); fetal bovine serum, heat inactivated (16140-071); penicillin-streptomycin solution (15140-122); phosphate-buffered saline (PBS) calcium and magnesium free (14190-136); and GlutaMax-1 solution 200 nM (35050-061). CellTiter-Glo Luminescent Cell Viability Assay (CTG) was purchased from Promega (G7573; Madison, WI). A 37% formaldehyde solution was purchased from Sigma-Aldrich (F8775; St. Louis, MO). Hoechst 33342 nuclear stain was purchased from Life Technologies (H3570). Costar 384-well assay plates, black with clear bottoms, were purchased from Corning Life Sciences (3712; Tewksbury, MA). The rgRSV (green fluorescent protein) was provided by Mark Peeples, under license from the National Institutes of Health. 15 Biota-2 entry inhibitor (compound 2 from patent W02012/068622), BMS 433771, ribavirin, RSV 604, and YM-53403 were prepared in house.
Frozen SAEC Supply for HTS
Normal human SAECs were received at passage 2. Cells were thawed quickly in a 37 °C water bath and aseptically pipetted into a 50-mL conical tube, and 9 mL prewarmed SAGM was added dropwise while gently swirling the cells. Without centrifugation or counting, 5 mL of the cell mixture was added to each of two T75 flasks containing 30 mL prewarmed SAGM. Media were changed the following day to remove traces of DMSO from the freezing medium.
SAECs were passaged at approximately 70% to 80% confluence and never allowed to reach confluency. Media were mixed as needed, filter sterilized using Nalgene Rapid Flow (Nalgene Thermo Scientific Labware, Lima, Ohio) sterile disposable filter units with a 0.2-µM membrane 90 PES filter, protected from light, stored at 4 °C, and used within 2 weeks of mixing. During passage, only the amount of media required was aliquoted and warmed to 37 °C. Cells were passaged by washing twice with room temperature PBS, followed by trypsinization with prewarmed 37 °C trypsin/EDTA solution; incubated at room temperature for 5 to 10 min; and monitored for detachment. Culture vessels were tapped to dislodge cells, and room temperature trypsin neutralizing solution was added to rinse cells from the plasticware into conical tubes. Tubes were centrifuged at 300 × g for 20 min. Supernatants were discarded, and cells were gently triturated to resuspend in fresh media. Cells were counted using a Vi-CELL Cell Counter and Cell Viability Analyzer (Beckman Coulter, Brea, CA). Depending on cell recovery, one vial could be expanded after approximately 4 days in culture from two T75 flasks to seed up to 1 × 2–chamber CellSTACKs (Corning) at 4000 to 5000 cells/cm2, then up to 2 × 10–chamber CellSTACKs within 4 days in culture, with a final yield of approximately 3 × 10e8 cells/CellSTACK. In all culture vessels, media were replaced every other day.
To establish frozen cell protocols for an assay-ready cell supply, cells were expanded and tested at different passages/doubling times. For each of the two donors used, cells were frozen at doubling times under 15 h. Harvested cells were resuspended in 80% SAGM, 10% Hybri-Max DMSO, and 10% fetal bovine solution (FBS) and aliquoted into Thermo Fisher Nunc 2D corded Cryobank vials, 96 vials per rack, with a Fill-It Automated Cryovial Processor (TAP Biosystems, Royston, UK). Racks of vials were frozen using a Planer (Middlesex, UK) controlled-rate freezer. At thaw, cells had good viability and performance in the RSV CPE assay.
The HTS required approximately 6 million cells to complete the primary HTS. Cells were scaled in two batches using nine and seven 10-chamber CellSTACKs, respectively. It took 7 to 10 days to generate enough cells to seed the 10-chamber vessels. The observed variability was greater between cell batches compared with within a batch, as measured by total cells collected per stack (batch 1, 3.30 ± 0.41; batch 2, 2.77 ± 0.37 [×108/mL]) and percent viable (batch 1, 90.28 ± 1.97; batch 2, 83.66 ± 2.63) (
Frozen A549 Supply for Post-HTS Follow-up
A549 cells are a nonrecombinant, immortalized human lung carcinoma cell line with characteristics similar to type II alveolar epithelial cells. Frozen vials of cells were thawed quickly in a 37 °C water bath and aseptically pipetted into a 50-mL conical tube, and 9 mL prewarmed DMEM containing 10% FBS was added dropwise while gently swirling the cells. Cells were counted using a Vi-CELL and then centrifuged for 5 min at 500 × g. The cell pellet was gently titrated with fresh media, and cells were seeded into T225 flasks at 20,000 cells/cm2.
A549 cells were passaged at approximately 80% to 90% confluency, using 0.05% trypsin/EDTA to detach the cells. Cells were seeded into Cell STACKs for expansion at a seeding density of 20,000 cells/cm2 to provide assay-ready frozen cells. Cells were seeded at 30,000 cells/cm2 into T225 flasks for amplification of RSV stock.
Harvested cells were pelleted at 500 × g, resuspended in Recovery Cell Freezing Media (Invitrogen), and aliquoted into Thermo Fisher Nunc 2D corded Cryobank vials, 96 vials per rack, with a Fill-It Automated Cryovial Processor. Racks of vials were frozen using a Planer controlled-rate freezer. At thaw, cells had high viability and performance in the RSV CPE assay.
RSV Virus Preparation
A T225 cm2 flask of A549 cells was seeded the day prior to virus infection to be approximately 80% confluent by the following day. Then, 0.5 mL RSV was added in a small volume of media (3 mL) and transferred to a flask containing A549 cells. Virus was allowed to attach for 1 h at 37 °C, and then media were replaced to a final volume of 20 mL. Virus stock was harvested 3 days postinfection when good CPE was observed. The stock was filtered (0.45 µM), aliquoted, and stored at −80 °C. Three milliliters of this master stock was used to infect additional A549 cells to create a working stock for the screen, and 1-mL aliquots were generated and stored at −80 °C.
The titer of the working stock was determined by plaque assay. Six-well tissue culture plates were seeded with 1 million A549 cells per well and incubated overnight to form a confluent monolayer. The working stock of virus was diluted by 10-fold serial dilution in PBS. Then, 0.5 mL of viral dilutions was added to each well of the 6-well plates and allowed to attach for 1 h. After viral adsorption, the inoculum was removed and a 0.4% agarose overlay solution was added to facilitate plaque formation. The plates were incubated for 7 days, and then RSV anti–F protein immunocytochemistry staining was used to detect plaques. Plaques were counted and the titer was expressed as pfu/mL.
The viral titer expressed as pfu/mL was used to calculate the MOI (multiplicity of infection) used in the assay. The MOI is calculated by dividing the volume of virus used (pfu) as a function of the number of cells infected.
The quantity of virus used in the assay was determined experimentally. Cells, SAECs or A549, were seeded the day prior to infection at 5000 cells per well in 100 µL media in a 96-well plate. Undiluted virus stock (100 µL) was added to wells A to F in column 1 and mixed to give a 1:2 dilution. Further 1:2 dilutions were carried out across the plate to column 12 (final dilution of 1 in 4000) with uninfected cells only in rows G and H. Cells were incubated at 37 °C for 6 days, and then 50 µL Cell TiterGlo (CTG) was added per well and luminescence measured using an EnVision (PerkinElmer, Waltham, MA) plate reader. The lowest concentration (i.e., highest dilution) of virus for use in this assay was selected that exhibited >90% virus-induced CPE at 6 days postinfection. Using a low concentration of virus in the assay is both to allow multiple rounds of virus replication to take place and to conserve virus stocks.
CPE Assays
Assay-ready compound plates containing 0.25 µL compound were removed from the freezer, equilibrated to room temperature (RT), and centrifuged at 1000 rpm for 5 min. A positive control compound was placed in column 18, yielding a high control (100% CPE protection), and a second control of 0.5% DMSO in column 6, yielding a low control (100% cell death). Test compounds were profiled at single concentration (5 µM final for HTS) or serially diluted in a 1:3 schema across the plates in columns 1 through 12 (excluding column 6) and columns 13 through 24 (excluding column 18) for concentration-response curve (CRC) assays.
Using an aseptic technique, thawed SAECs were pipetted from the cryovial into a 50-mL conical tube containing prewarmed (37 °C) SAGM. The cells were pelleted by centrifugation at 1000 rpm for 10 min. The resulting supernatant was removed and the cell pellet resuspended in SAGM. Cell density and viability were determined using a Vi-CELL. The cell suspension was diluted to a density of 2 × 10⁴ cells/mL.
Virus stock (2 × 10⁶ pfu/mL) was thawed and diluted (1:100) in assay media and mixed with the SAECs by gently swirling and rocking the containment vessel. The cell/virus mix was then dispensed into a 384-well microtiter plate containing compounds (Nunc) at 50 µL/well, using a primed Combi Multidrop (Thermo Electron Corporation, Waltham, MA) at a density of 1000 cells/well, and then placed in a 37 °C incubator at 5% CO2 for 6 days.
Following the incubation period, CTG was mixed and warmed to RT and added to the plates using a primed Combi Multidrop dispenser at 20 µL/well. The plates were then sealed with a Topseal A (Perkin Elmer, Waltham, MA) clear seal, shaken gently for 5 s, and read on an EnVision (PerkinElmer) plate reader following a 10-min equilibration delay at RT.
A similar method was followed for SAEC cytotoxicity and A549 CPE assays as described above. For toxicity determination, the exact procedure was followed, omitting the addition of RSV virus. For A549 CP, DMEM was used instead of SAGM.
Data Analysis for CPE and Toxicity Assays
Raw counts obtained from the plate reader were normalized and expressed as percent inhibition using the following formula:
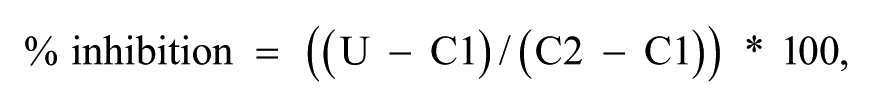
where U is the unknown value, C1 is the average of the low control (0% effect) wells, and C2 is the average of the high control (100% inhibition) wells.
Hits were defined as compounds that generated percent inhibition three times the standard deviation (3SD), calculated from the mean of the low control.
CRCs were fitted using the four-parameter equation:
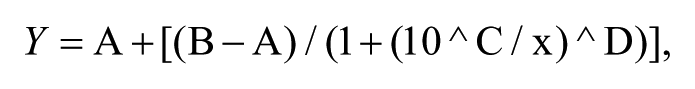
where
A = minimum response,
B = maximum response,
C = log10 * XC50,
D = slope factor, and
x = log10 compound concentration [M].
Time of Addition Assay
A549 cells were suspended in media at a density of 2 × 10⁵ cells/mL in suspension culture flasks and placed on a shaking platform in an incubator at 37 °C, 5% CO2, for 20 min while the virus aliquots thawed in preparation for infection. RSV–green fluorescent protein (GFP) 15 virus was taken out of a −80 °C freezer, thawed, and added to the cells in suspension culture at an MOI of 3 virus particles per cell (achieved with a 1:10 dilution of viral stock). After either 0 h (immediately after adding virus) or 2 h of incubation with virus at 37 °C, cells were dispensed in 50-µL aliquots per well onto 384-well black culture plates (781091; Greiner Bio-One, Monroe, NC) containing tool and test compounds in full-curve 1:3 dilutions across the plate (as listed above for the CPE assay).
CRCs curves were generated by pipetting 0.25 µL of 3-fold serial compound dilutions in 100% DMSO in culture plates. Two groups of three-plate replicates each were used when running the assay (i.e., 0-h and 2-h infection per group). Column 18 of the plate contains a post-entry inhibitor standard at 50 µM concentration. Column 6 of the plate contains only DMSO for an infected low control.
After 24 h of culture at 37 °C in the presence of virus and compound, media were aspirated from the wells of the cell plates; cells were fixed for 10 min with 100 µL per well 3% paraformaldehyde diluted in PBS. Paraformaldehyde was removed and replaced with 100 µL per well PBS and left on the cells. The cell plates were sealed and wiped down with bleach to kill any live virus remaining on the outside of the plates.
The cells were stained with Hoechst 33342 nuclei stain (1:10,000 dilution in PBS for 10 min at RT; 50 µL added per well). The Hoechst stain was removed and the cells washed twice with 50 µL per well PBS. PBS (100 µL per well) was left on the cells. The plate was read on an InCell Analyzer 2000 (GE Healthcare Life Sciences, Piscataway, NJ). A channel for nuclei stain was read and a channel for GFP was also read. One field of view was obtained for each well at 10× magnification.
Data Analysis for Time of Addition Assay
Pictures from the InCell Analyzer 2000 were segmented into individual nuclei and GFP-positive cells with the accompanying InCell Analyzer software. Nuclei count and fluorescence cell intensity metrics were exported. The resulting cell-by-cell summary data file was processed with the R programming language 16 to summarize the fluorescence metrics from infected cells only by the following process.
The R script calculates a cutoff threshold for background fluorescence of nonexpressing cells based on data from the column 18 control wells. The median and MAD (median absolute deviation) are calculated for each well of column 18. The cutoff is then calculated using the following equation:

where X is the average median value of all 16 control wells from column 18, and Y is the average of the squared MAD values from all 16 control wells from column 18 and given by the following equation:
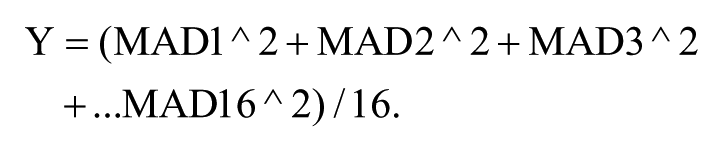
MAD1 = MAD from the first well of column 18, and MAD16 = MAD from the 16th well of column 18. All cells with fluorescence intensity below this cutoff value are removed from the data set. Then, on a per well basis, the cell fluorescence intensity of the remaining cells is summed and divided by the cell count metric (determined from counting Hoechst-stained nuclei). This newly calculated value for each well is tabulated and exported in an Abase XE compatible .txt format for further analysis (plate normalization and curve fitting) using Abase XE. 17
Results
SAEC Assay Development
We sought to develop an HTS-capable assay using human primary cells that measured inhibition of CPE caused by RSV. SAECs were chosen based on their biological relevance and potential to identify novel small molecules. Initial efforts with 1536-well formats proved unsuccessful due to variations from well volume evaporation and the required long incubation times. Development efforts shifted focus to a 384-well plate format using frozen cell batches from two separate donors. Assay conditions were optimized for cell densities (250, 500, and 1000 cells/well), DMSO tolerance (0%, 0.25%, 0.5%, and 1.0%), and virus MOIs at 0.0, 0.1, 0.2, 0.3, 0.4, and 0.5. Incubation times tested started at 3 days and were followed up to 6 days, optimizing for Z′.
Cellular assays in the presence of DMSO were optimized at 0.25% and 0.5% DMSO based on initial results. It is noteworthy that the highest signals and best windows were observed at 0.0% and 0.25% DMSO, but these could not be selected based on the expected percent DMSO for the compound concentration chosen for the screen (data not shown). Cell density exhibited optimal results at 1000 cells/well at 0.5% DMSO. Under these conditions, an 8-fold window was achieved at an optimal MOI of 0.3. Based on assay performance criteria, a 6-day incubation of the cells infected with virus was selected. Five days was acceptable but with a diminished Z′ value increasing risk of plate failure. During the incubation time, there was no media change, nor did the cells reach confluency. Overall, the best conditions proved to be 1000 cells/well at 0.5% DMSO with a 6-day incubation using an MOI of 0.3 (
A group of literature standards ( Table 1 ) was used in addition to internal standards as part of the CPE assay validation and cell line comparison. Compounds were tested as 11-point curves.
Comparison of Compounds with Known Mode of Action Activity in Various Cell Lines Using the CPE Assay.
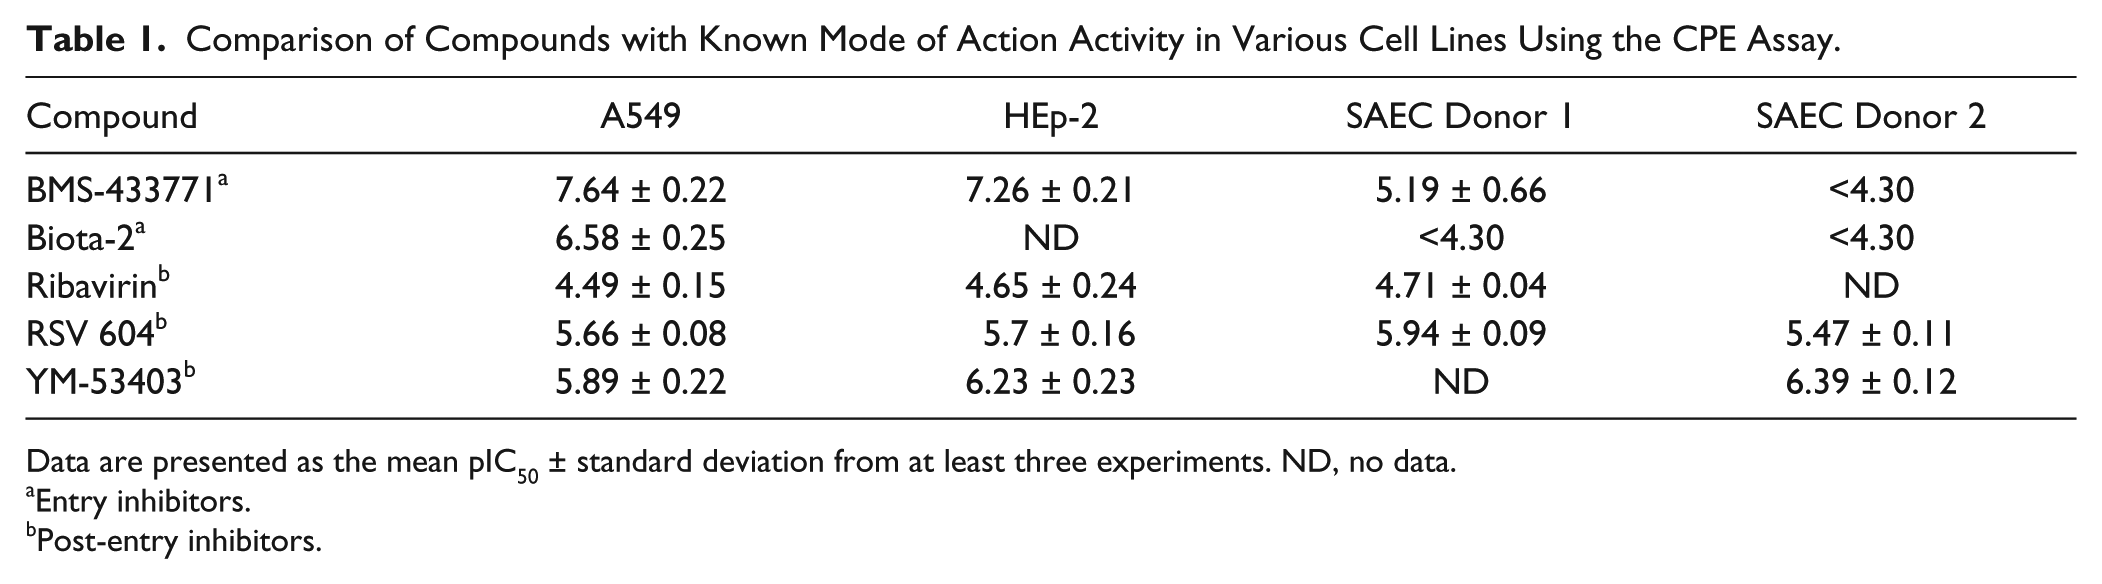
Data are presented as the mean pIC50 ± standard deviation from at least three experiments. ND, no data.
Entry inhibitors.
Post-entry inhibitors.
HTS Assay Campaign
A total of 5805 (384-well) plates were processed in single-shot format (1,988,393 unique compounds) in batches of 85 plates per batch with an additional standards plate with each batch run. Column 6 (low control) and column 18 (high control) were used in calculating the robust Z′ for each plate. The average Z′ for the campaign was 0.5, with 82% of the plates displaying a value greater than 0.4. Z′ values recorded for the assay ranged from 0 to 0.9 (
The HTS yielded 40,229 robust active hits based on a 3 standard deviation statistical cutoff at 16% response or greater, a 2.02% hit rate. The number of actives significantly decreased to 3614 at a cutoff of >20% CPE protection, a 0.18% hit rate. The number of actives was further reduced to 203 at a cutoff of >50% CPE protection (0.01%). Comprehensive review of the actives resulted in the selection of 6000 compounds for pIC50 determination testing as curves for compounds that exhibited desirable structure, primary activity, structure-activity relationship, and preferred physiochemical properties. Rather than employing a single-concentration confirmation step, the team decided to progress to curves in multiple assays to optimize hit confirmation, reduce resources, and shorten cycle times. Of the 6000 compounds selected, 3614 yielded activity >20% (CPE protection), and 203 yielded >50% maximal inhibition. The observed confirmation rate based on percent activity from the curve follow-up was 61%.
CRC Follow-up
Compounds of interest identified from the primary screen were progressed for pIC50 determination. Assays were performed with two separate donors of SAECs and immortalized A549 lung epithelial cells for comparison and profiled in parallel. An additional assay to measure cellular toxicity (no virus) was included to facilitate data interpretation. pIC50s were determined using 11-point CRCs tested in duplicate. A Venn diagram (
Fig. 1
) was constructed to depict the compound overlap and uniqueness between donor 1, donor 2, and the A549 cell lines for active molecules. Compound potencies for donor 1 ranged from inactive to pIC50 of 8.66. For donor 2, the range was from inactive to 8.57. As determined by quantifiable pIC50s, there were 308 and 266 active molecules for donor 1 and donor 2, respectively. Of the donor 1 actives, 97 were inactive at donor 2 (32%). Of the donor 2 actives, 55 (20%) were inactive at donor 1. A correlation analysis comparing pIC50s for donor 1 and donor 2 is depicted in
Figure 2
. In every subset greater than or equal to a pIC50 of 5.0, there was a 2-fold increase in the number of active compounds in SAECs compared with the A549 cells (
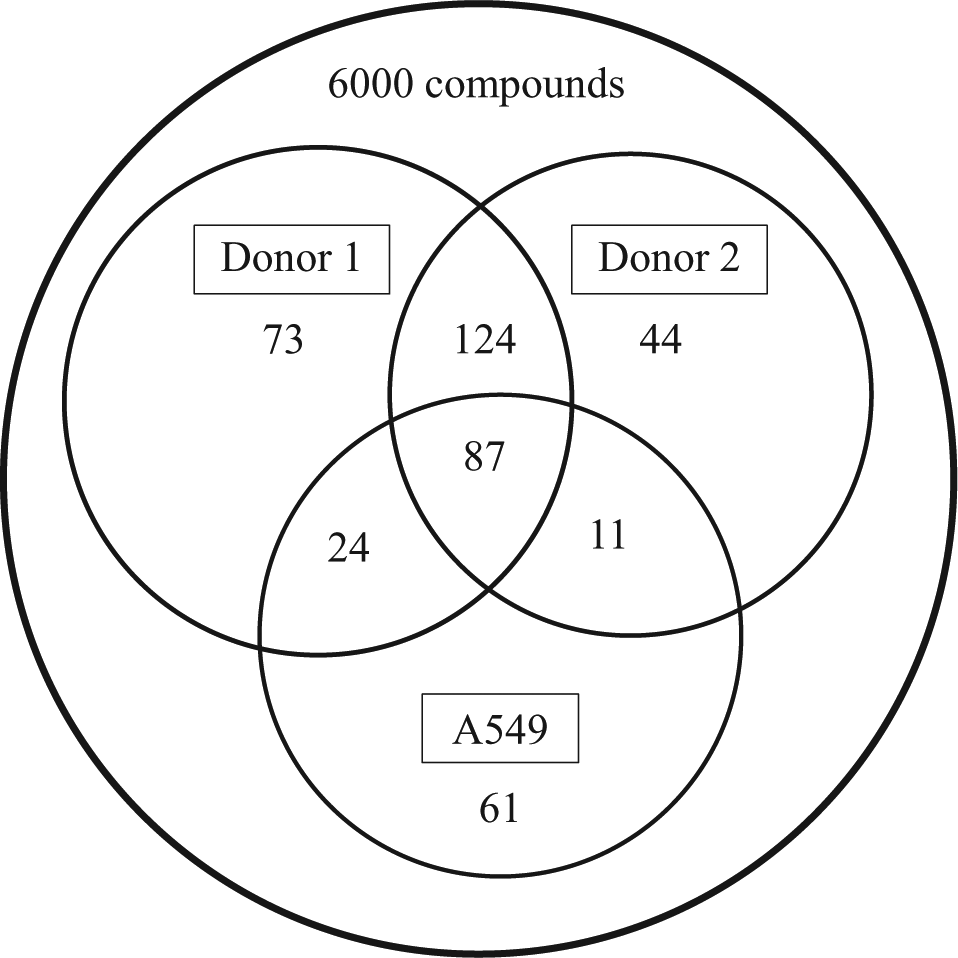
Venn diagram depicting distribution of active compounds followed up from high-throughput screening as a function of cell line type. Numbers of active molecules from each assay after pIC50 determination by concentration-response curve from the common set of compounds.
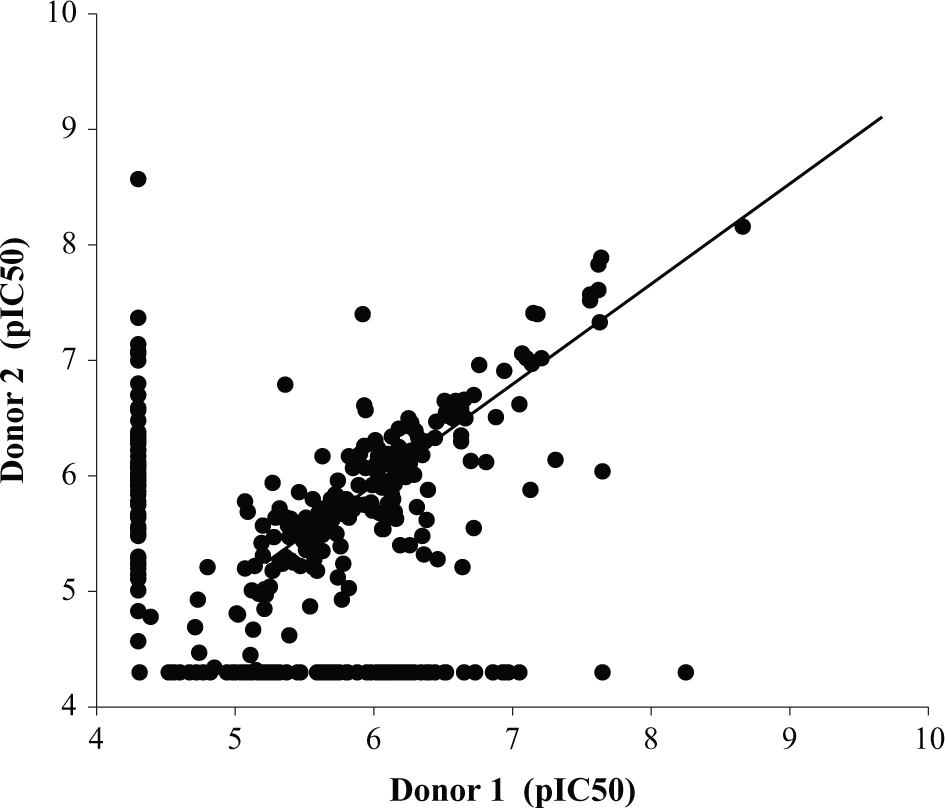
Correlation comparison between small airway epithelial cell donor 1 and donor 2. Data are plotted as pIC50 determined from cytopathic effect assay for donor 1 compared with donor 2. Correlation for active molecules resulted in an R2 of 0.67.
Figure 3 depicts a comparison of a few of the selective and active results from the CRC follow-up. Compound A represents antiviral activity in A549 and donor 1 (SAEC) and slightly diminished activity in donor 2 (SAEC) with no observed toxic effects. Compound B represents a compound active in donor 1 and donor 2, inactive in the A549 cells with toxicity at lower concentrations compared with CPE activity. Compound C depicts cytotoxic activity and no protection for A549 cells and diminished activity in the SAEC donors. This result brings into question whether compound C possesses antiviral activity or if the observed activity is a function of the toxicity and the cells’ inability to support viral replication. These data are meant for a qualitative comparison only. There were additional compounds within each type of activity described confirming the finding (data not shown).
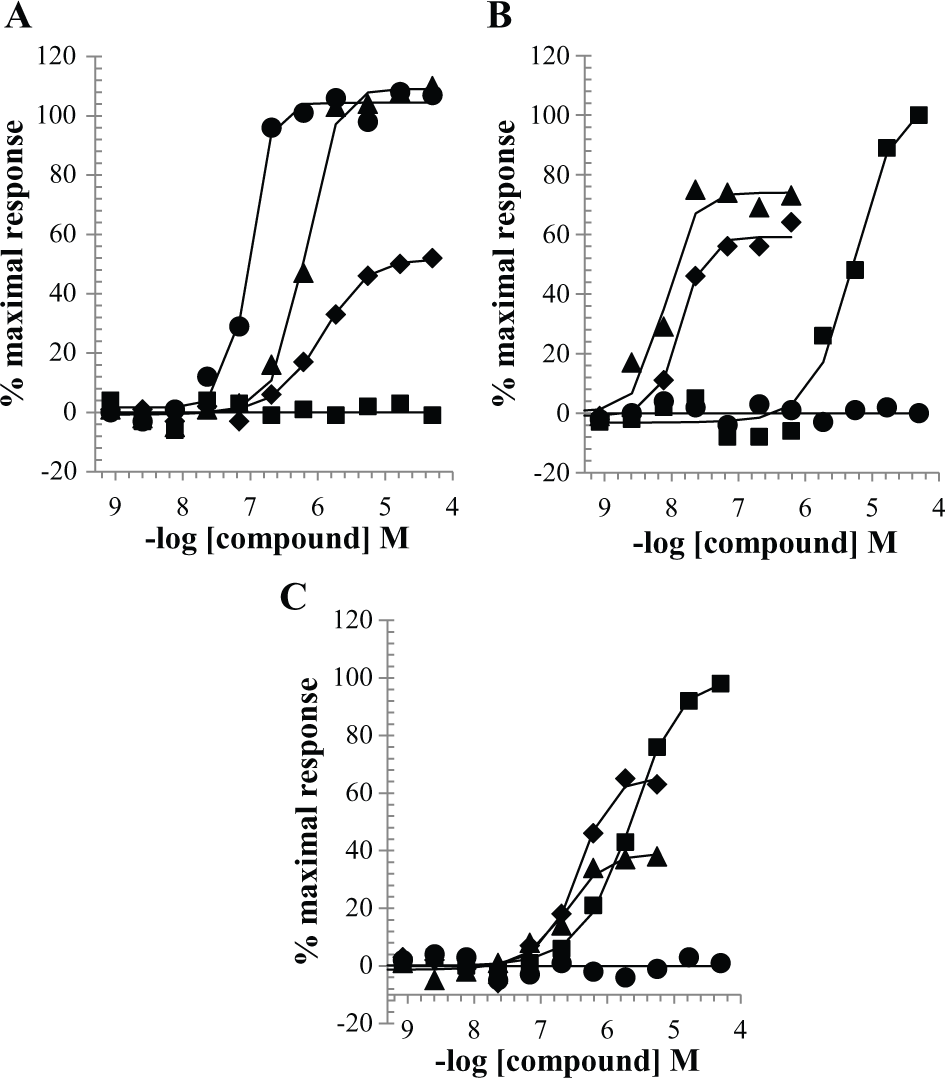
Representative graphs for compound response depicting different modalities identified by the screen. Data are plotted as percent maximal effect versus molar concentration of compound. Each graph displays data for respiratory syncytial virus infection with small airway epithelial cell (SAEC) donor 1(▲), SAEC donor 2(♦), A549 (●), and SAEC donor 1 toxicity (■). Compound (
Time of Addition Assay
For this assay, we define entry inhibitors as molecules that block initial infection but not subsequent viral replication. Classification of mode of action is performed by comparing compound activity at time 0 compared with time 0 + 2 h after virus addition. Compounds with equal potency at both time points are characterized as post-entry inhibitors, whereas those with a reduced activity upon preincubation of virus with cells are termed entry inhibitors. Data for standard molecules used for assay validation are presented in Table 2 and graphically ( Fig. 4 ).
Time of Addition Assay Standard Molecules.
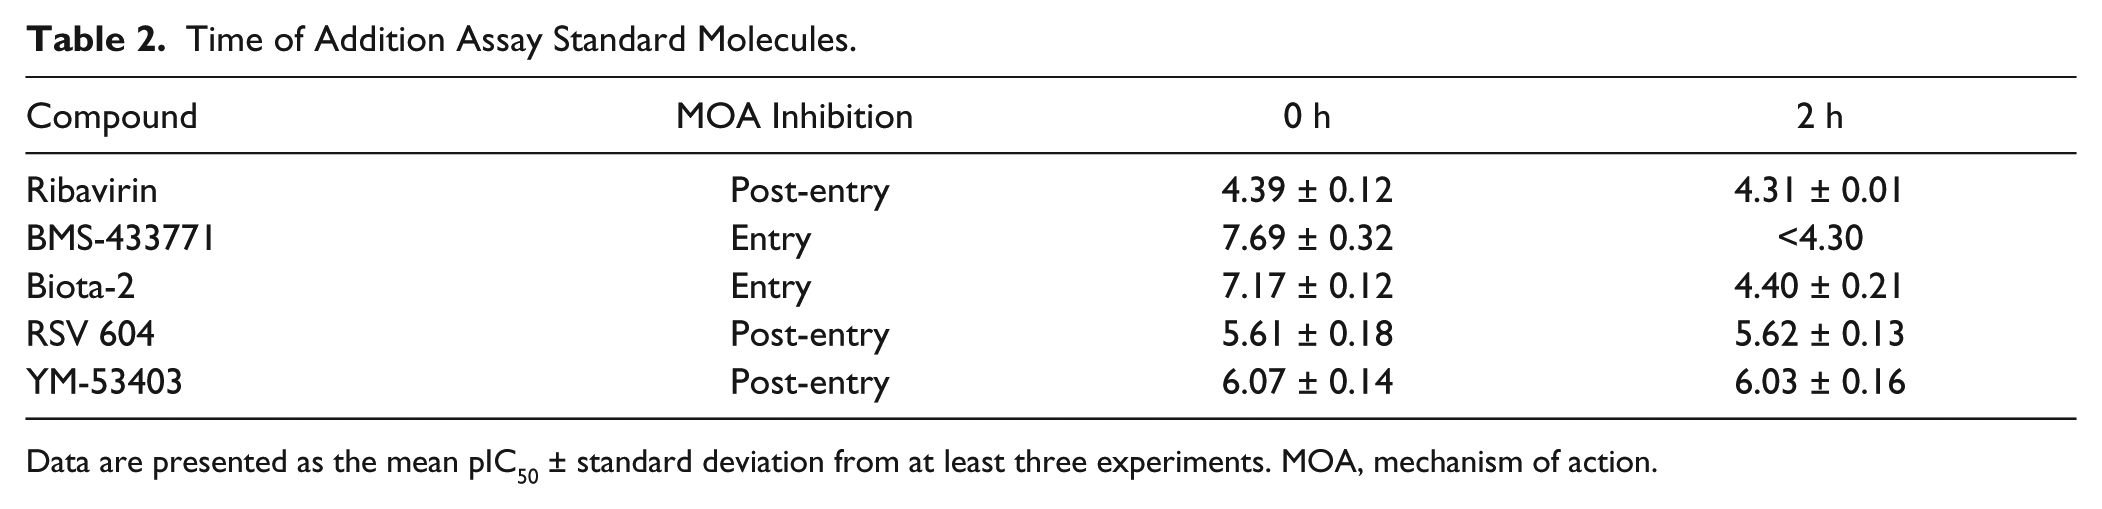
Data are presented as the mean pIC50 ± standard deviation from at least three experiments. MOA, mechanism of action.
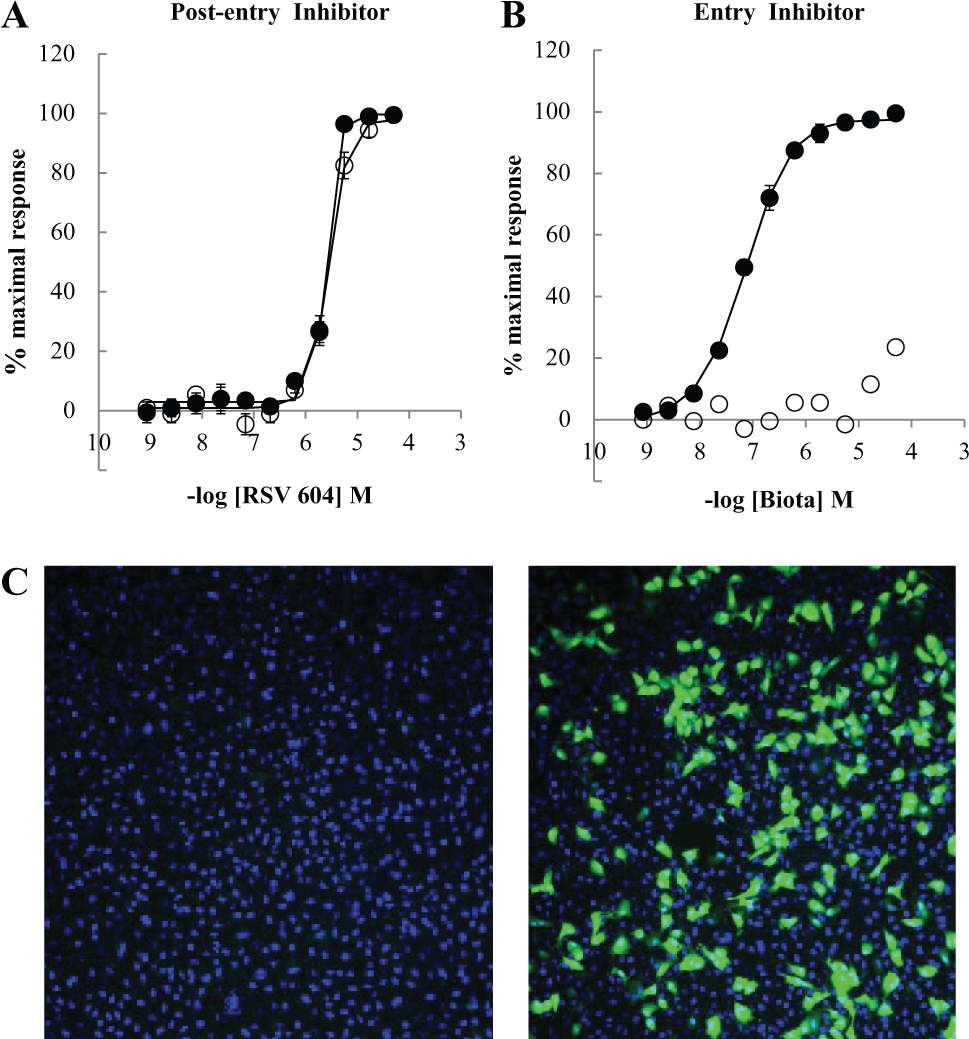
Determination of mechanism of action (MOA) comparing post-entry versus entry inhibitor. Representative graphs (
In total, 165 compounds of interest were evaluated for determination of mode of action in this assay. Based on potency and maximal response, there was an 88% confirmation rate from the post-HTS CRC compound set to this set. Of those tested, 30% were categorized as putative entry inhibitors with activity separate from cytotoxicity; 28% were categorized as post-entry inhibitors. The remaining compounds were deprioritized due to toxicity, lack of potency, and/or undesirable chemical structures.
Of the compounds identified as “entry inhibitors,” a further comparison of potency was performed between SAECs and A549 cells. There were four unique compounds with quantifiable potency (pIC50 > highest concentration tested) in SAECs compared with A549 cells. For this set of entry inhibitors with activity in both cell lines, compounds were less potent (~1.0 log units) in SAECs compared with A549. These findings contrasted with results obtained for “post-entry inhibitors.” For these compounds, there were 17 unique compounds with quantifiable potency (pIC50 > highest concentration tested) in SAECs compared with A549 cells. For this set of post-entry inhibitors with activity in both cell lines, molecular compound potencies were equal between the two cell lines. Similar findings were observed for the standard molecules ( Table 2 ).
From those compounds categorized as post-entry inhibitors, 13 compounds were selected for additional compound progression activities as possible viral replication inhibitors. These assays included viral load reduction (VLR), RSV A mutant viruses, and RSV B strain.
Discussion
Historically, high-throughput cell-based antiviral screens using immortalized cell lines (e.g., A549 carcinoma cells) with cytopathic effect as a phenotypic end point have identified small-molecule inhibitors of RSV. However, these efforts have failed to progress compounds as marketable therapeutics for potentially various reasons such as biological relevance of screening paradigm, lack of exposure, metabolism, toxicity and/or other developability issues. Our team hypothesized that the use of biologically relevant primary SAECs may improve the likelihood to identify compounds that target both viral and/or host cell proteins required for viral entry, replication, and viral egress, resulting in successful candidate selection with improved efficacy in downstream systems. The decision was made to explore the feasibility of alternative cell options, including primary human cells. Through these efforts, primary human SAECs that originate from known sites of RSV infection were selected for evaluation, assay development, and ultimately for the HTS campaign.
Considerable assay development was performed leading to the use of primary SAECs for performing the HTS. Methods for cell growth scalability and creation of frozen SAEC stocks did not exist and required creation and validation. Extensive efforts were extended to scale frozen cells with adequate supply from a common (single) donor to perform the HTS of approximately 2 million compounds with focused compound progression follow-up. Once it was determined the team could provide sufficient cells for the campaign, the creation of a robust assay process to support the HTS was undertaken.
Assay development focused on optimization of signal by measuring titrations of cell number, DMSO concentration, virus concentration, and incubation times. Initial studies focused on implementation of a 1536-well assay format but proved unsuccessful. Achievement of a robust signal suitable for hit identification activities required 5- to 6-day incubation. It was observed that evaporation rates in 1536-well plates (particularly at the plate edge) were significant and typically resulted in completely dry wells. However, this effect was not significant in 384-well plates and resulted in assay parameters suitable and robust enough for an HTS campaign. A logistical plan was developed to optimize plate throughput, reagent usage, and assay performance for the screening team while managing resource limitations in the context of incubator space in our live virus suite. The result was the final schedule requiring 12 weeks to complete the primary screen.
With the required 6-day incubation, the team predicted that the likelihood of observing cytotoxicity would increase, potentially masking hits of interest. In addition, based on past experience, we knew the potential for cytotoxicity increased at a 10-µM compound concentration. To account for both concerns, the HTS was performed at a final concentration of 5 µM. For CRC experiments, an additional CTG assay was performed using cells only (no virus) in parallel to the SAEC from two donors and A549 cells. Also for consideration was the potential contribution of cytotoxicity due to observed inhibition of robust viral replication activity in the primary assay. We used the cytotoxicity assay results to provide additional annotation to determine if observed compound inhibition activity was based on viral cycle inhibition or due to compound toxicity.
In many cases, the outcomes were clear: either there was no observed cytotoxicity, or significant cytotoxicity masked any antiviral effect. Most of the more active inhibitors of CPE were fairly well delineated from any toxic effects. There was a third case, in which both a CPE protective effect and a cytotoxicity effect were observed with potency values within 0.5 log units of each other. In these cases, the team questioned if the lack of CPE was driven mechanistically by the molecule or whether the CPE protection was a consequence of cytotoxicity that affected cell health and prevented robust viral replication leading to CPE. Several compounds in this category were progressed into secondary antiviral assays and determined to be inactive, solidifying the role of the cytotoxicity assay in the compound progression plan.
To facilitate the analysis and determination of impact from performing the screen with primary cells, we included SAECs from a second donor and immortalized A549 cells during the hit potency determination phase of compound progression. There was concern that utilization of a single donor would possibly identify compounds with unique, donor-specific activity with reduced application to an entire population. Data analysis revealed a good correlation of results obtained from the two SAEC donors for compounds that displayed activity in both cell lines. However, there were significant numbers of compounds (~30%) in which compounds were active only in one of the two donor cell lines. Because of resource constraints, schedule delays, and availability, the team did not consider pooling the two donors into a single-cell batch for use to perform the primary HTS. Based on the curve data obtained, the authors would recommend a donor pooling strategy for future screening campaigns using primary cells where feasible.
To categorize molecules as either entry or post-entry inhibitors, we developed a time of addition (TOA) assay with a modified RSV virus expressing GFP and employed it as part of the compound progression plan. Entry inhibitors block initial infection but not subsequent viral replication. After viral entry and replication, cells would process the viral genome, generating functional GFP. If GFP fluorescence was reduced after compound treatment, the compound inhibited viral entry or replication. An entry inhibitor cannot block an established infection and will be active only at the 0-h time point; a post-entry inhibitor will be active and equipotent at 0 and 2 h. To differentiate between entry and post-entry mechanisms, cells were infected at a 0-h time point in the presence of test compounds and also 2 h prior to compound addition (2-h time point). Replication of GFP was then quantified and measured using a high-content imager, the GE InCell Analyzer 2000. The entry inhibitors would exhibit a clear delineation between time 0-h and 2-h curves, indicating separation via the time of addition. If a post-entry inhibitor was present, then the curves would exhibit very similar or almost superimposable results.
The team hypothesized that performing the screen with primary cells would result in identification of “different” molecules compared with historical immortalized lines. Evaluation of pIC50 results supported this hypothesis. For compounds with pIC50s >7.0, only 57% of compounds with observed activity in SAECs resulted in quantifiable activity in A549s. For pIC50s between 6.0 and 7.0, this percentage dropped to 39%. Overall, for all compounds generating a quantifiable pIC50 in the SAEC assay, only 60% generated a comparable result in the A549 assay. These results confirmed that using primary cells yielded a different set of molecules. It is yet to be determined if this will translate into a clinical candidate.
These differences were further observed when evaluating the mode of inhibition exhibited by compounds when characterized as either entry or post-entry inhibitors. Through the assay development phase, it was observed that compounds characterized in the literature as entry inhibitors consistently were more potent in the immortalized cell lines than in the SAECs. Conversely, for those compounds characterized as post-entry inhibitors, the potencies were nearly identical between the different cell types. This observation was further substantiated in the post-HTS phase of the screening campaign for the compounds progressed into the TOA assay. The output from the HTS resulted in the identification of unique inhibitors of CPE in the SAECs with no observable activity in A549. There was a preponderance of evidence for these unique SAEC inhibitors to be classified as post-entry inhibitors versus entry inhibitors at a 4 to 1 ratio. This observation was not consistent with the overall classification of compounds profiled in the TOA after HTS. Overall, the ratio of compounds identified was 1 to 1 for entry versus post-entry inhibition.
In conclusion, we have completed an RSV CPE high-throughput assay using primary SAECs. Methods for large-scale frozen SAEC supply and a robust primary cell assay were developed. Biologically relevant SAECs may improve the capacity to identify compounds that target both viral and/or host cell proteins required for viral entry, replication, and egress, resulting in successful, clinically active RSV therapeutics. The screen yielded several RSV replication inhibitor series that have been investigated further for potential transition from hits to leads. To date, these compounds have demonstrated positive results in our tertiary assays. This will enable initiation of a new lead optimization program.
Footnotes
Declaration of Conflicting Interests
The authors declared no potential conflicts of interest with respect to the research, authorship, and/or publication of this article.
Funding
The authors received no financial support for the research, authorship, and/or publication of this article.
References
Supplementary Material
Please find the following supplemental material available below.
For Open Access articles published under a Creative Commons License, all supplemental material carries the same license as the article it is associated with.
For non-Open Access articles published, all supplemental material carries a non-exclusive license, and permission requests for re-use of supplemental material or any part of supplemental material shall be sent directly to the copyright owner as specified in the copyright notice associated with the article.