
Abstract
Numerous investigations have linked mitochondrial dysfunction to adverse health outcomes and drug-induced toxicity. The pharmaceutical industry is challenged with identifying mitochondrial liabilities earlier in drug development and thereby reducing late-stage attrition. Consequently, there is a demand for reliable, higher-throughput screening methods for assessing the impact of drug candidates on mitochondrial function. The extracellular flux (XF) assay described here is a plate-based method in which galactose-conditioned HepG2 cells were acutely exposed to test compounds, then real-time changes in the oxygen consumption rate and extracellular acidification rate were simultaneously measured using a Seahorse Bioscience XF-96 analyzer. The acute XF assay was validated using marketed drugs known to modulate mitochondrial function, and data analysis was automated using a spline curve fitting model developed at GlaxoSmithKline. We demonstrate that the acute XF assay is a robust, sensitive screening platform for evaluating drug-induced effects on mitochondrial activity in whole cells.
Introduction
Mitochondria generate 95% of cellular adenosine triphosphate (ATP) via oxidative phosphorylation and are central to intermediary metabolism, free radical generation, and regulating apoptosis. Loss of mitochondrial function is tolerated by most cells until a threshold is reached, when lack of ATP generation potentially endangers the cell. Glycolytic flux accelerates to compensate, but this is finite, and at some point, the cell will die via necrosis or apoptosis; the point at which this occurs is unique for different cells.1,2 More than 75 diseases and metabolic disorders are caused by mitochondrial dysfunction, demonstrating how mitochondrial impairment can yield adverse health outcomes. 3 Their crucial role in maintaining cell viability and in many other metabolic pathways renders mitochondrial integrity a key target for compound toxicity. Many compounds including pesticides, antivirals, antibiotics, anticancer agents, nonsteroidal anti-inflammatory drugs, and diabetic treatment drugs have been reported to induce mitochondrial dysfunction.4,5 Drug-induced mitochondrial dysfunction has been shown to contribute to liver, heart, kidney, skeletal muscle, and the central nervous system toxicities. 3 Because of the serious implications of drug-induced mitochondrial toxicity, the development of applicable, in vitro higher-throughput assays is particularly important to predict mitochondrial toxicity and identify compounds with mitochondrial liabilities early in the drug discovery process as part of a strategy to reduce attrition.
Various methods have been employed to assess mitochondrial function. One noteworthy method that is well documented in the literature is to measure mitochondrial oxygen consumption. 6 Traditionally, this method was conducted using a Clark electrode, 7 which lacks the throughput required for screening a large number of compounds on a daily basis. The recently developed multiwell, plate-based Seahorse XF96 Extracellular Flux Analyzer 8 and dual-parameter bead-based MitoXpress 9 assay address the need for more flexible and higher-throughput detection technologies in adherent cells in culture. However, the MitoXpress bead-based assay system has limitations of collecting data at 30 °C, a nonphysiological temperature; data analysis in kinetic mode was not suitable for screening applications; and there was the potential to miss uncouplers in end-point mode. Furthermore, compounds such as phenformin can have a delayed effect on mitochondrial function 10 therefore, it was in our interest to monitor compound effects for at least 1 h from the start of treatment.
The noninvasive nature of the Seahorse XF analyzer allows the simultaneous measurements of the oxygen consumption rate (OCR) and extracellular acidification rate (ECAR) of cells as indicators of mitochondrial respiration and glycolysis, respectively. If a drug displays a mitochondrial liability, oxygen consumption would be affected and extracellular acidification may increase concomitantly as cells try to circumvent the mitochondrial insult through increased glycolytic flux. 9 Such measurements allow analysis of the alterations and interplay of these pathways in cells and also facilitate mechanistic studies of compound effects on these energy pathways.
An extracellular flux (XF) assay has been developed for assessing mitochondrial function in HepG2 cells during an acute 1h exposure to compound. This protocol uses the injection ports of the XF96 Analyzer to directly introduce the test compounds into the wells and monitor the OCR and ECAR after compound injection. A software package developed by GlaxoSmithKline enabled automated data processing from multiple plates. The assay is robust and reproducible with low intra- and interassay variations, and it illustrates full statistical characterization of signal strength and random errors. Fifteen compounds were evaluated, the majority of which are known from published studies to acutely impair mitochondrial function. The acute XF assay described in this article can be a valuable tool to identify compounds with potential mitochondrial liabilities in a higher-throughput screening format.
Materials and Methods
Materials
All chemicals were purchased from Sigma-Aldrich (St. Louis, MO). Cell culture media and supplements for HepG2 cells were purchased from Gibco (Grand Island, NY). Dulbecco’s modified Eagle’s media (DMEM) XF Assay media, XF96 sensor cartridges, XF96-well plates, and calibration buffer were obtained from Seahorse Bioscience (North Billerica, MA).
HepG2 Cell Culture and Assay Media Conditions
ATCC HepG2 cells (Princen Laboratory, TNO-PG, Leiden, the Netherlands) were maintained in DMEM (Gibco 11966) supplemented with 10% fetal bovine serum (Gibco 16000), 10 mM galactose, 2 mM GlutaMAX, 5 mM HEPES, and 0.1 mM pyruvate. XF96-well microplates (Seahorse 101104-004) were coated with rat tail collagen, type 1 (Corning 354236), according to the manufacturer’s instructions. The automated cell culture system SelectT from TAP Biosystems (Hertfordshire, UK) was used to culture the HepG2 cell line so that the cell splitting and assay cycles could be synchronized based on the growth parameters. HepG2 cells were dissociated enzymatically using 0.05% trypsin (Gibco) and plated at 20,000 cells (100 µL) per well into XF96 microplates in columns 1 through 11. Column 12 received media only. Cells were incubated overnight at 37 °C in a 5% CO2 humidified atmosphere. Unbuffered XF assay media supplemented with 10 mM galactose, 0.1 mM pyruvate, and 0.5% (w/v) fatty acid–free bovine serum albumin (BSA) was prepared in advance, warmed to 37 °C, and the pH adjusted to 7.4 prior to use.
Automated Media Exchange Using Beckman Coulter Biomek FX
A microplate-based Biomek FX liquid handler (Beckman Coulter, Wycombe, UK) with an AP-96 multichannel head was used to remove all but 15 µL of the initial 100 µL of media from the cells in the XF96 microplate. Prewarmed (37 °C) XF assay media (210 µL) were transferred from a robotic-compatible flat-bottom reservoir onto the cells in the XF96 microplate using a custom pipetting template such that the tips moved slowly down the sides of the wells. Liquid aspiration and dispense speeds were slow and gentle (no more than 30% of maximum pipetting speed) to prevent cell disruption/adherence issues. This process of removing all but 15 µL of media from the cells and replacing with fresh media was repeated at least twice. The final volume of assay media on the cells was 225 µL. A box of fresh Axygen P250 tips (Beckman Coulter) was used for the final transfer of assay media into the XF96 microplate containing cells.
Preparation of Compound Plates
To create mother plates, all test compounds with the exception of carbonyl cyanide 4-(trifluoromethoxy) phenylhydrazone (FCCP) were prepared as 250× stock solutions of 50 mM in DMSO, and nine subsequent twofold serial dilutions were prepared across 96-well, V-bottom polypropylene plates (Greiner, 651201) in columns 1 through columns 10. Column 11 received DMSO only. Aliquots (2 µL) of each dilution series were transferred into 96-well V-bottom polypropylene compound plates, giving an intermediate concentration (10× of final assay concentration) range between 2 mM and 3.91 µM by adding 48 µL of unbuffered XF assay respiration media using Biomek FX. For FCCP, intermediate concentrations ranging between 256 µM and 0.5 nM were manually prepared. Columns 11 and 12 of the compound plates were reserved for the high and low controls, respectively. The high control wells contained 2 µL of DMSO but no compound, whereas the low control wells received media only, no DMSO. Wells A12 and H12 were designated as background correction control wells. Compounds (except FCCP) and DMSO were dispensed using the Echo acoustic dispenser (Labcyte, Sunnyvale, CA).
Acute XF Assay Protocol
After overnight incubation in DMEM maintenance media, HepG2 cells were washed three times in XF assay media, which were prewarmed to 37 °C. The cells were then maintained in 225 µL/well of XF assay media at 37 °C, in a non-CO2 incubator for 1 h. During the cell incubation time, 25 µL of 10× concentrated compounds or DMSO in XF assay media were loaded into injection port A of each well in the XF96 sensor cartridge using the Biohit pipette (Sartorius Biohit, Neptune, NJ). The final concentration of DMSO in each well after reagent injection was 0.4%. The XF assay protocol was started by initial calibration of the cartridge in the XF96 Analyzer followed by measurement of OCR and ECAR from the cell plate. Three initial measurements of OCR and ECAR were made using 2 min mix and 3 min measurement cycles. At immediate postinjection assessment, three OCR and ECAR measurements were made using the same mix and measure cycles. Following a wait period of about 40 min (four cycles of 30 s mix/10 min wait), three more measurements were recorded as above.
Signal Processing
For each OCR and ECAR measurement, data were processed to create three response variables: basal, acute, and 1 h. The basal response is denoted as the third initial measurement just prior to compound injection. The acute response is defined as the signal value taken from the three measurements made immediately after compound injection that shows the maximal absolute response from the basal rate. The 1 h response is defined as the signal value from the final three post–compound injection measurements showing the maximal absolute value from the basal response. Of primary interests were the values ECAR[acute], OCR[acute], ECAR[1 hr], and OCR[1 hr].
Assay signals were normalized at both the well level and the plate level. The basal measurement serves as a well-level normalization variable for acute and 1 h responses, given by (acute signal)/(basal signal) and (1 h signal)/(basal signal) for both ECAR and OCR. These were further normalized platewise by computing a percentage of the mean DMSO values on a plate and are labeled as “% control.” A small minority of data points were removed as outliers through a visual inspection method that approximately corresponded to a three-sigma rule.
Data Analysis
Plate Quality Metric
Eight DMSO (in column 11) and six media-only (in column 12) wells reside as controls on every plate. For each analyte, a plate-level quality-control statistic, Z′, is computed using log-transformed values. For the log-transformed response variables ECAR[acute] and ECAR[1 hr],
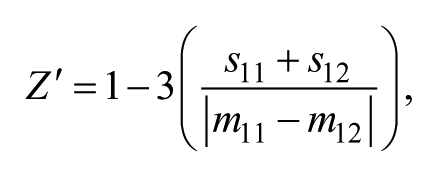
where m11, m12, s11, and s12, respectively, denote the mean of column 11, the mean of column 12, the standard deviation of column 11, and the standard deviation of column 12 on a per-plate basis. For OCR[acute] and OCR[1 hr], because an overwhelming majority of column 12 signal values were very small (truncated to 1.0 to avoid nonsensical ratios), for these analytes, the Z′ values are
Single-Shot Reproducibility
A single-shot analysis was performed separately for each analyte by examining the % control values from columns 2 and 4 on each plate, which respectively correspond to the high and low concentrations 12.8 µM and 3.2 µM for FCCP and 100 µM and 25 µM for all other compounds.
Potency Reproducibility
A spline curve 11 was fitted to the concentration-response data of each compound on each plate, separately for each analyte using the smooth.spline function in R 3.0.0. 12 A spline curve is a continuous and flexible curve created by joining several polynomials. To control the level of flexibility, we set the degrees of freedom in the smooth.spline function to six. The fitting equation was (% control) = spline (log (concentration + Δ) ) + error, where Δ = (minimum concentration)/4.
In our experience, the % control of DMSO generally lies between 70% and 130% on the normalized signal scale (see the Materials and Methods section), and so these values were chosen as cutoffs for measuring potency. We defined the minimum effective concentration (MEC) as the first concentration at which the predicted value from the spline curve first crosses 70% (inhibition) or 130% (activation). The pMEC, or negative log10-transformed MEC, was used as a metric for potency. High pMEC values denoted very potent compounds, and low pMEC values denoted compounds of low potency. If the concentration-response curve did not cross 70% or 130%, the pMEC value was reported as the negative log10 of the highest concentration in the experiment.
Details and results of thorough statistical analyses of the controls, single-shot, and potency data are given in the
Results and Discussion
Increasing evidence suggests that mitochondria play key roles in cell survival and cell death. Assays for testing compound mitochondrial activity would hasten the identification of compounds with mitochondrial liability as well as the discovery of compounds that may lead to novel therapeutics. Here, we describe a higher-throughput, cell-based, acute assay and evaluate its utility for identifying acute compound effects on mitochondrial function. To determine the optimal cell seeding density of HepG2 cells for measuring OCR and ECAR, a cell density titration was performed, and it was determined that 20,000 cells/well was in the linear range of detection and gave optimal detection of response (data not shown). To achieve stringent quality assurance and consistent cell physiology for screening, we found that the cell culture conditions described in the Materials and Methods section provided maximal signal windows and consistent basal OCR and ECAR values when the passage number was up to 13 and cell confluence was approximately 75%. A final assay concentration of 0.4% DMSO was selected for all experiments performed for this article
To evaluate assay performance, assay Z′ factors, coefficient of variation (CV%), single-shot reproducibility, and pMEC values for potency reproducibility were tracked on two mother plates with seven unique compounds per mother plate and FCCP on both mother plates, for a total of 15 compounds on three separate days. Per each mother plate, three replicate plates were run per day. Mother plate 1 was run on days 1, 2, and 3, and mother plate 2 was run on days 4, 5, and 6. A graph of the control wells for all plates is shown in
Figure 1A
shows the % control values of single shot for OCR[acute]. The estimates of CV% (
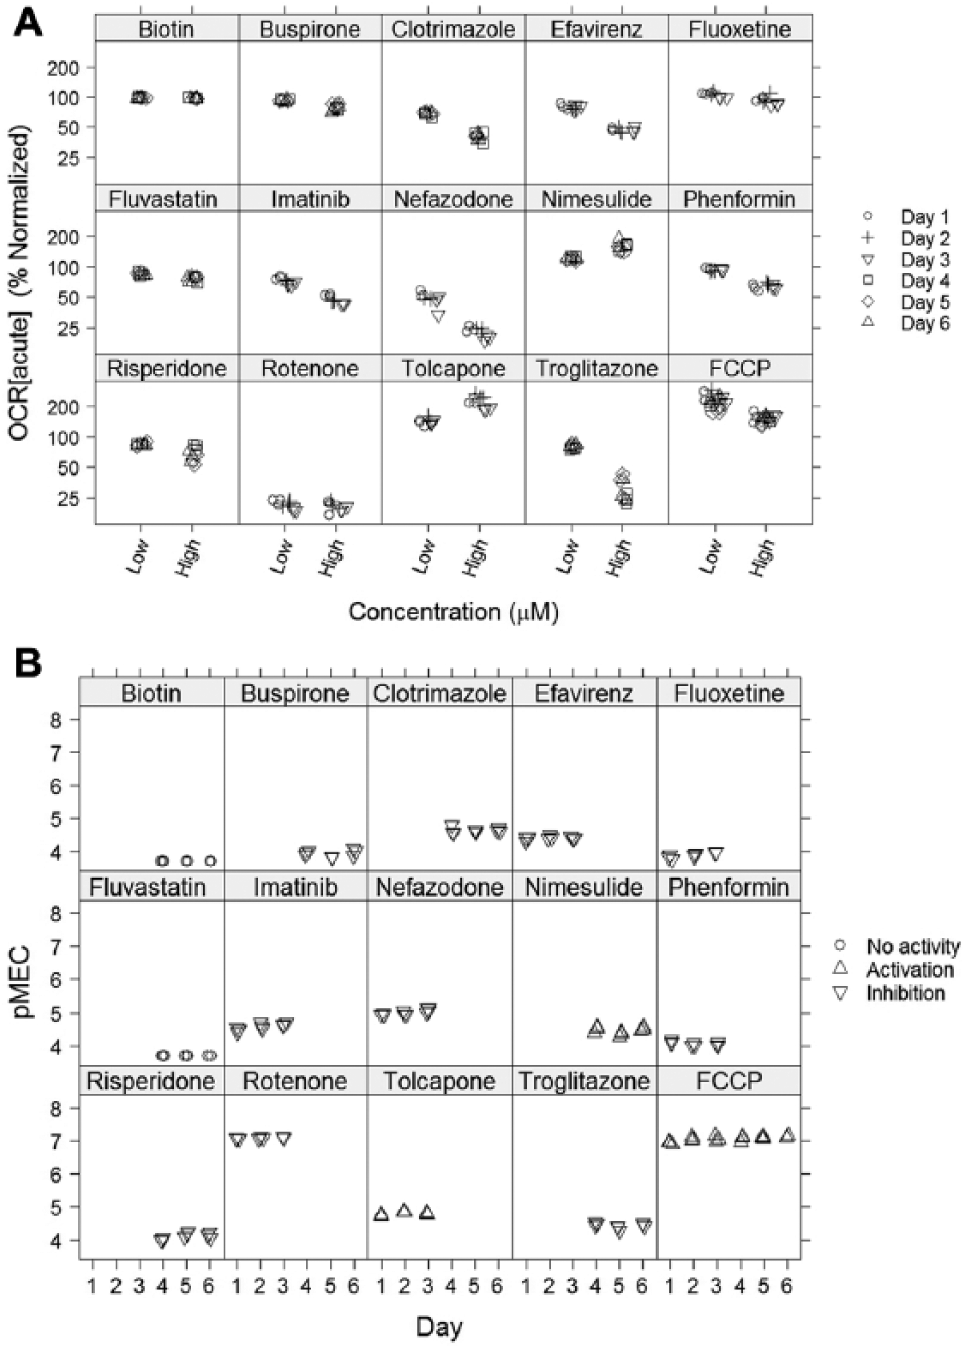
XF96 acute assay reproducibility.
Mean pMEC values for compounds tested in this study. a
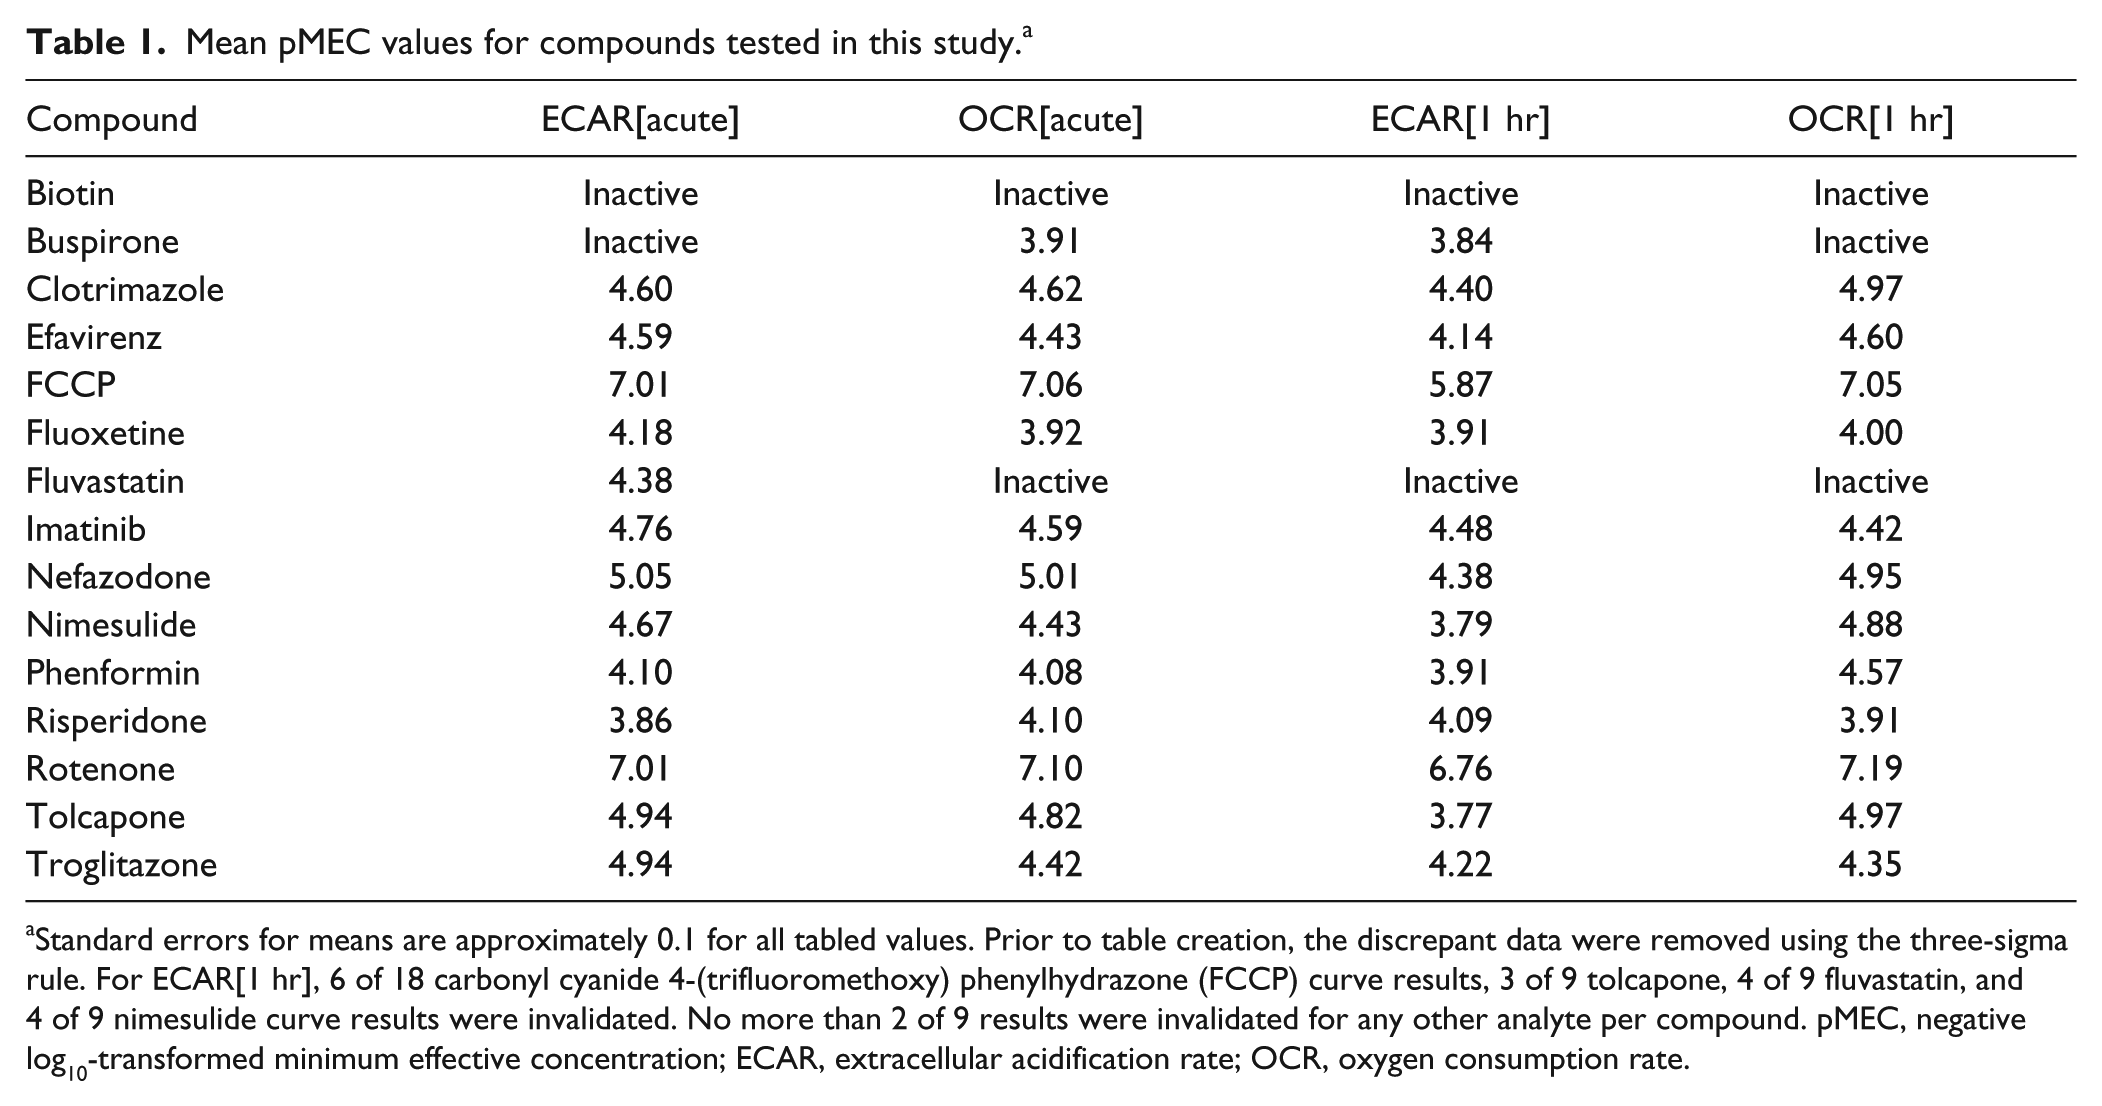
Standard errors for means are approximately 0.1 for all tabled values. Prior to table creation, the discrepant data were removed using the three-sigma rule. For ECAR[1 hr], 6 of 18 carbonyl cyanide 4-(trifluoromethoxy) phenylhydrazone (FCCP) curve results, 3 of 9 tolcapone, 4 of 9 fluvastatin, and 4 of 9 nimesulide curve results were invalidated. No more than 2 of 9 results were invalidated for any other analyte per compound. pMEC, negative log10-transformed minimum effective concentration; ECAR, extracellular acidification rate; OCR, oxygen consumption rate.
By integrating novel technology and assay process design, we enabled a higher-throughput assay to measure mitochondrial activities. We found that the XF assay can easily incorporate automation, which ensured a consistent treatment of each assay plate from day to day, thus enhancing downstream data reliability. The assay as configured in this study demonstrated a reasonable signal window, low coefficient of variation, and excellent Z′ factors, characteristics that are suitable for cell-based, higher-throughput screening. This platform allows for dose-response determination of eight compounds over 10 concentrations within the same plate. We chose to run triplicate curves for each compound as a standard experiment based on both the practicality of laboratory capacity and time considerations, as well as the requirement of the precision of pMEC statistics. The high reproducibility and consistency of the examination of single concentration data from the dose-response curves demonstrated the feasibility of single-shot screening up to 80 compounds per plate, therefore further increasing the assay throughput.
One goal of this study was to assess drug-induced mitochondrial dysfunction in whole cells using this acute method. Fourteen compounds, reported to acutely affect mitochondrial function, were selected for testing. In addition, biotin was selected as a negative control. Galactose was chosen as the cell respiratory substrate, and 0.5% BSA was included in the XF assay media. The work by Marroquin et al 13 demonstrated that HepG2 cells cultured in glucose-containing media primarily derive their energy from glycolysis rather than mitochondrial oxidative phosphorylation, a phenomenon known as the Crabtree effect. 14 Because of their high glycolytic capacity, HepG2 cells are more resistant to mitochondrial toxicants. In contrast, HepG2 cells conditioned in galactose media are more reliant on oxidative phosphorylation for their energy needs (no net cytoplasmic ATP production when using galactose), thereby becoming more susceptible to mitochondrial toxicants. As such, galactose-conditioned cells are theoretically better suited for assessments of drug-induced mitochondrial dysfunction.
Each compound was tested in triplicate on the same testing day, and a total of nine replicates were generated during three different days, with the exception of FCCP, which was tested for 6 d and had a total of 18 replicates. OCR and ECAR measurements were made immediately and 1 h after compound addition to cells. Six different OCR and ECAR profiles were observed (
Fig. 2
;
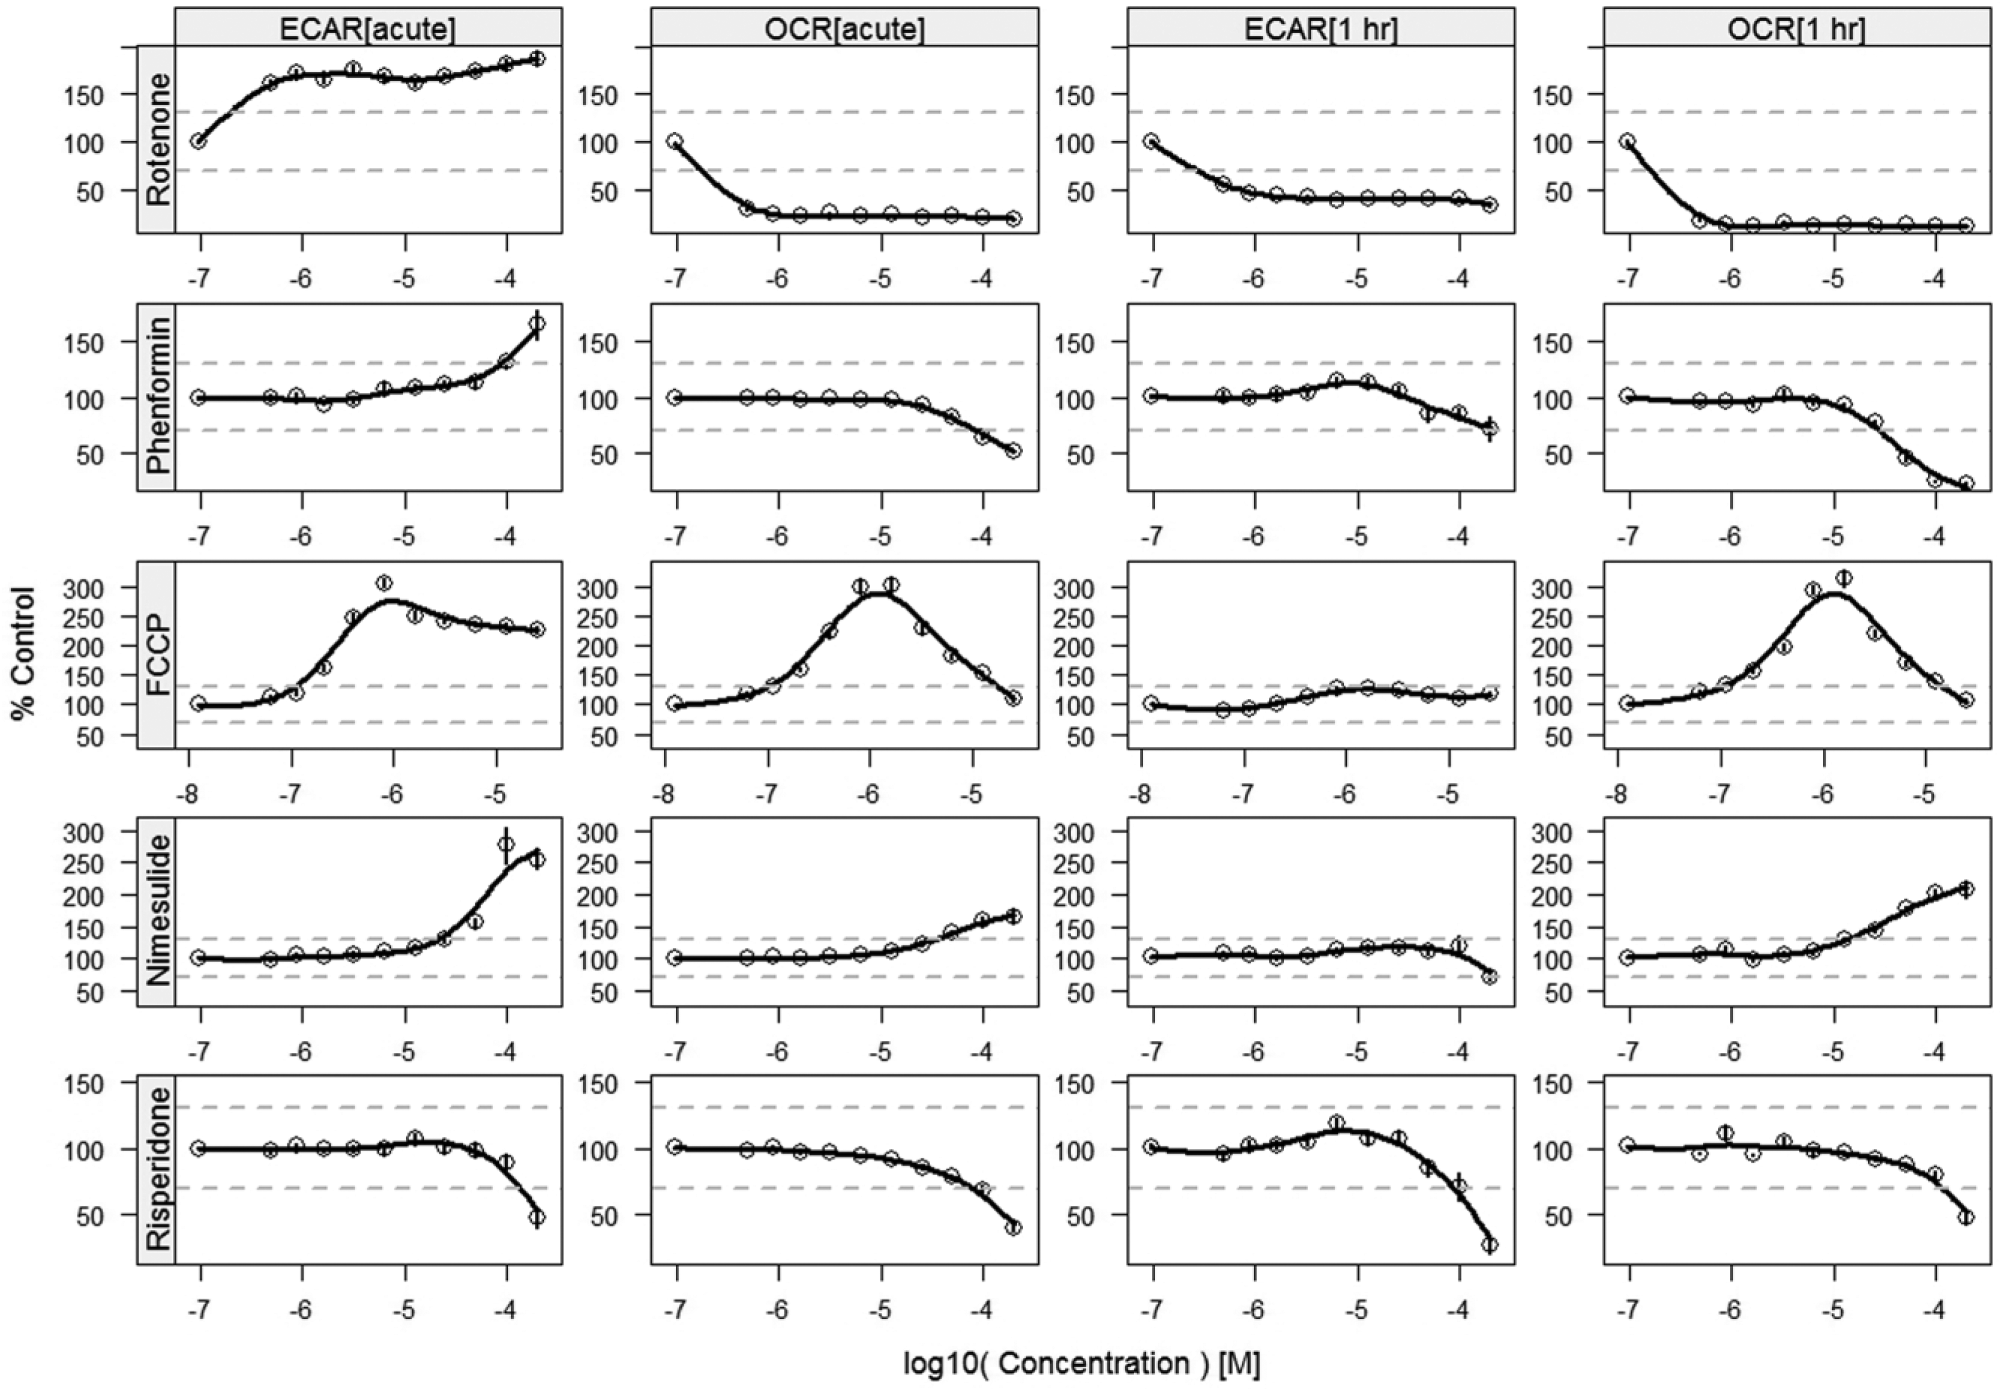
A summary dose-response graph for selected compounds. Circles are mean values across 9 (18 for FCCP) replicates with spline curve fits. In each panel, zero concentration (DMSO only) is shown as the leftmost circle, essentially pushed downward by two log-scaled dilutions. Vertical segments within the circles show ±1 standard error of the mean. Dashed lines are drawn at 70% and 130% to illustrate potency.
Inhibitors of electron transport and oxidative phosphorylation, rotenone, phenformin, efavirenz, nefazodone, imatinib, fluoxetine, troglitazone, with exception of clotrimazole, displayed an acute dose-dependent decrease in OCR, accompanied by a dose-dependent increase in ECAR. At the 1 h time point, a decrease in ECAR occurred, and in some cases, further inhibition of OCR was observed.
Uncouplers of oxidative phosphorylation, FCCP, tolcapone, and nimesulide, demonstrated an acute dose-dependent increase in both OCR and ECAR until a threshold concentration was reached, at which OCR or ECAR (or both) started to decline. At the 1 h measurement, the bell-shaped concentration-response curve of OCR remained, whereas the activity of ECAR was attenuated or disappeared. Fluvastatin, which was reported to reduce mitochondrial membrane potential and to cause mitochondrial swelling on rat skeletal muscle mitochondria, 15 showed a dose-dependent increase in ECAR but no acute effect on OCR. No effect on OCR or ECAR was seen at the 1 h measurement. It is common for ECAR values to become more variable during uncoupled conditions. As a result, the ECAR data for these compounds at 1 h postinjection were more variable and resulted in more invalidated curves.
Buspirone, a weak inhibitor of mitochondrial ETC complex I, 16 caused no change in ECAR acutely but decreased OCR at 200 µM, the highest concentration tested. At the 1 h measurement, a decrease in ECAR occurred while the acute decrease of OCR was attenuated. Risperidone, a neuroleptic treatment drug that inhibited ETC complex I 3 , displayed a dose-dependent decrease in both OCR and ECAR acutely and at the 1 h measurement. The negative control compound, biotin, showed no observable effect on OCR or ECAR acutely or at the 1 h measurement and thus is characterized as inactive.
Although the assay can be performed across larger samples of time points for a kinetic analysis of data, to simplify data analysis, only two time-point measurements were collected: immediately after compound injection and 1 h after injection. We chose to monitor OCR and ECAR change for up to 1 h based on empirical results that an hour-long treatment time enabled us to detect the activity of most of compounds. It was generally found that compounds had greater potency at the 1 h postinjection measurement than the measurement made immediately after injection. It should also be mentioned that our initial assessment of these compounds was conducted with BSA-free XF assay media. There was not a statistically significant difference in potency and curve profiles for compounds tested in the presence and absence of BSA (
It would be very useful to be able to translate in vitro pMEC values to clinical exposure concentrations. Downstream mechanism of action work with compounds identified by this screen could be evaluated in a more physiologically relevant cell line, such as primary heptatocytes or stem cells. However, such a correlation in practice could be challenging, as many factors such as compound solubility, protein binding, metabolites, metabolic activation, metabolic stability, and temporal relationships could influence the concentration at which chemical-induced toxicity will occur in vivo.
In summary, a 96-well plate-based assay that is sensitive, robust, and reproducible to perform higher-throughput screening of compounds for identifying mitochondrial dysfunction in whole cells is presented. Using this assay, positive identification of compounds known to cause mitochondrial impairment was performed. We propose that this assay can serve as a valuable, feasible, and efficient tool to identify compounds with potential mitochondrial liability. In addition, this assay platform may be modified to use primary cells or stem cells and adapted to further characterize compounds with mechanism-of-action studies.
Footnotes
Acknowledgements
We thank Kendra Hightower and Jon Lyon for valuable discussions and David Morris for support and sponsorship of the study. We thank Brian Hardy, Jennifer Patterson, Melissa Mantilla, and Dudley Rose of the GSK Sample Management Technology Group for helping with compound plating and dispensing. We also thank Andrea Ayscue for HepG2 cell supplies.
Declaration of Conflicting Interests
The authors declared no potential conflicts of interest with respect to the research, authorship, and/or publication of this article.
Funding
The authors received no financial support for the research, authorship, and/or publication of this article.
References
Supplementary Material
Please find the following supplemental material available below.
For Open Access articles published under a Creative Commons License, all supplemental material carries the same license as the article it is associated with.
For non-Open Access articles published, all supplemental material carries a non-exclusive license, and permission requests for re-use of supplemental material or any part of supplemental material shall be sent directly to the copyright owner as specified in the copyright notice associated with the article.