
Abstract
The success of high-throughput screening (HTS) strategies depends on the effectiveness of both normalization methods and study design. We report comparisons among normalization methods in two titration series experiments. We also extend the results in a third experiment with two differently designed but otherwise identical screens: compounds in replicate plates were either placed in the same well locations or were randomly assigned to different locations. Best results were obtained when randomization was combined with normalization methods that corrected for within-plate spatial bias. We conclude that potent, reliable, and accurate HTS requires replication, randomization design strategies, and more extensive normalization than is typically done and that formal statistical testing is desirable. The Statistics and dIagnostic Graphs for HTS (SIGHTS) Microsoft Excel Add-In software is available to conduct most analyses reported here.
High-throughput screening (HTS) of small molecules is a method commonly used in both academic and industrial settings to identify new pharmacological agents with which to manipulate protein function or expression. These screens are intended to identify rare biological events—the small number of active features from hundreds to hundreds of thousands of features in the screen. Various commentaries and editorials on the two approaches currently in use (target-based screening and phenotypic screening) have provided guidelines for improving the scientific merit of published findings. 1 Similarly, a recent commentary on phenotype screening argued for more robust assay designs and analysis so as to improve the biological relevance of results and to minimize false-positive “wild goose chases.”2(p207) These and other efforts have focused on the reliability of readouts, assay robustness, and acceptable signal-to-noise ratios. There has been much less discussion of proper statistical design as a means to minimize false positives and increase true positives. Even the most carefully performed screens contain two types of measurement error, which makes it difficult to distinguish between biological and spurious events for all but the largest effects (“low-hanging fruit”): inherent random variability of assay measurements and systematic errors (bias) introduced by procedures, equipment, and materials. Biological effects for some features within a screen will necessarily be more difficult to detect than for others because of intrinsic differences among features and because of the difficulties optimizing detection of all features simultaneously. Random variability in small-molecule screens, for example, has been shown to be compound specific. 3 Systematic errors are also typically present within plates, across wells, and across plates within a screening run, 4 creating additional feature-specific errors. Despite advances in normalization procedures,4–10 statistical testing, 3 and plate manufacture, 11 frequent failures to validate primary screen results have added to the concerns about the accuracy, reliability, and cost-effectiveness of HTS platforms. 12 The current underexploitation of the results due to inadequate design and analysis represents a waste of funds, time, and labor.
Weak to moderate effects are particularly difficult to detect and validate. This has become an important issue in contexts such as fragment-based screens (which examine low-potency, low-molecular-weight ligands that bind to biologically significant macromolecules 13 ), RNA interference (RNAi) screens in which weak but genuine phenotypes can be caused by partial knockdown of a gene with a strong effect or a strong knockdown of a gene with a weak effect, 14 low-abundance compounds in natural extract screens, 15 and pharmaceutical screens for maximizing discovery of new chemical series or scaffolds for drug development. 16
The current state of the field suggests that more extensive normalization and more sophisticated study designs may be necessary for improving accuracy in HTS applications. It has become clear, for example, that bias patterns extend beyond the well-known edge effects3,4 and are often characterized by gradients toward the center of the plate, affecting activity measurements of both controls and features of interest. 11 Moreover, choice of normalization method is well known to have a large effect on the generation of lists of active features in gene expression microarrays, 17 an observation that is increasingly being recognized in HTS.3,7,18
Study design and data analysis have been linked since the statistician and geneticist Ronald Fisher’s seminal work in the 1920s. His work with agricultural plots has a direct parallel with data derived from HTS microplates. Fisher’s elegant idea was to randomly assign treatments (e.g., different types of fertilizer) to replicated plots to ensure that differences among treatments could be unambiguously attributed to treatment effects rather than to extraneous variables such as drainage, wind, and soil fertility. In the context of HTS, randomly assigning features to different well locations across replicated plates would remove confounding of biological activity with well location and associated extraneous variables such as evaporation, air humidity, UV exposure, incubator stack position, and liquid handling. Randomization of primary screens would improve their accuracy (any biases that remain after normalization would be spread approximately equally among the features) and internal validity and, consequently, their validation success rate.
We use the quantitative HTS (qHTS) method of Inglese et al. 19 to establish “gold-standard” activity levels and to show that while randomization and better normalization individually improve detection of rare biological events, their combination provides maximum benefit. We also report results of an online survey that indicate that most HTS studies do not randomize feature placement across replicate plates or use the most effective normalization methods available. The Statistics and dIagnostic Graphs for HTS (SIGHTS) Microsoft Excel Add-In software is available to conduct most analyses reported here (http://nadon-mugqic.mcgill.ca/Welcome.html).
Materials and Methods
CMBA Setup (Titration Series and Randomization Experiments)
Reagents and materials
Bovine serum albumin (BSA), colchicine, DMSO, EDTA, ethylene glycol tetraacetic acid (EGTA), anhydrous glycerol, Hoechst 33258 (Hoechst), magnesium chloride (MgCl2), phosphate-buffered saline (PBS), 1,4-Piperazinediethanesulfonic acid (PIPES), Triton X-100, and Tween 20 were purchased from Sigma-Aldrich (St. Louis, MO). RPMI 1640 medium with Glutamax-I, penicillin-streptomycin solution, and trypsin-EDTA were obtained from Gibco (Invitrogen, Carlsbad, CA). Fetal bovine serum was obtained from Perbio (Brebieres, France). Sodium azide was purchased from Merck (Darmstadt, Germany). Methanol was from VWR Prolabo (Fontenay-sous-Bois, France). The monoclonal Tyr-tubulin antibody (clone YL1/2) was obtained from Abcam (Cambridge, UK). The cyanine 3 (Cy3)–conjugated goat anti–rat antibody was obtained from Rockland (Tebu-bio, Le Perray en Yvelines, France). Black polystyrene flat-bottom 96-well tissue culture microplates (655086) were purchased from Greiner Bio-One (Kremsmuenster, Austria).
Compounds
Colchicine and DMSO were used as bioactive control and bioinactive control, respectively. The other test titration compounds were purchased from ChemBridge Corporation library (San Diego, CA) and Sigma-Aldrich or were obtained from the proprietary Institut Curie–CNRS, University of Orleans–CNRS, University of Strasbourg–CNRS, and University Joseph Fourier Grenoble I–CNRS libraries. All compounds were dissolved in DMSO such that the final concentration of DMSO in wells during the assay did not exceed 0.5%. Placement of compounds and controls for both l’Equipe Criblage pour des Molécules Bio-Actives (CMBA) experiments are shown in
Cells
HeLa cells were purchased from American Type Culture Collection (Rockville, MD) and were grown at 37 °C, 5% CO2 in RPMI 1640 medium with Glutamax, supplemented with 10% fetal bovine serum and 1% penicillin-streptomycin (complete medium).
Instrumentation
Biological assays on 96-well microplates were performed using a fully automated platform, which is described in Vassal et al. 21 They were completed with a TECAN Te-MO 3/3-96 96-channel pipetting module (TECAN, Lyon, France). The platform was controlled using the TECAN Gemini 4.00 and FACTS 4.81 software. Fluorescence was measured using the FLUOstar Optima plate reader (BMG Labtechnologies, Offenburg, Germany). For Cy3 and Hoechst measurements, 544-ex and 355-ex filters as excitation filters and 580-12 and 460-em filters as emission filters were used, respectively.
CMBA Titration Series Experiment
Compound selection
On the basis of previous results, 32 compounds were classified as potentially active and 128 as inactive. Sixteen of the potentially active and 64 of the inactive compounds were placed randomly on each of two plates using a constrained Latin hypercube method. 22 Each plate was first divided conceptually into four orthogonal segments consisting of the first and last four rows and top and bottom five columns, resulting in four blocks of 20 wells. The well locations of the 16 active compounds were chosen such that there were no more than two active compounds in any row or column as well as ensuring that there were four active compounds in each orthogonal segment.
Each of the 32 potentially active compounds was assayed at nine concentration levels (0.02, 0.04, 0.10, 0.26, 0.64, 1.6, 4, 10, and 25 µM). The screen was run at each concentration in triplicate for a total of 54 plates. Compounds were deposited in the middle 10 columns of two 96-well plates (labeled A and B) with the first and last columns used for controls. One complete concentration series of nine plates was run for either the A or B plate over a period of 6 days. Compounds were labeled as active based on their fit to a linear, quadratic, or cubic regression curve and had at least a 50% efficacy score based on normalized percent inhibition (NPI). 3 Twenty-two of the 32 potentially active compounds were identified as active by these criteria.
Fully automated procedure for 96-well format assay
The assay was performed as described in Vassal et al. 21 Twenty-four hours following test microplate preparation, each well was robotically supplemented with 10 µL of RPMI containing compounds at the required concentration. As bioactive control, the final concentration of colchicine was 2 µM. The final concentration of DMSO was 0.5%. The final concentrations of other test compounds were 25, 10, 4, 1.5, 0.64, 0.256, 0.1024, and/or 0.04096 µM. For bioactive controls, the final concentration was 5 µM for paclitaxel and 2 µM for colchicine. After compounds were dispensed, cells were incubated 2 h at 37 °C, 5% CO2 in the workstation incubator. Cells were then permeabilized 10 min with 100 µL of lysis buffer at 37 °C (80 mM PIPES, 1 mM EGTA, 1 mM MgCl2, 0.5% Triton X-100 [v/v], and 10% glycerol [pH 6.8]) and fixed at least 6 min with 100 µL of methanol. After three washes with 200 µL of PBS Tween 0.1% (2.7 mM KCl, 1.5 mM KH2PO4, 136 mM NaCl, 8 mM Na2HPO4, and 0.1% Tween [pH 7.4]), cells were incubated overnight at 37 °C with a solution (50 µL per well) of YL1/2 (tyrosinated-tubulin antibody) at a 1:4000 dilution in PBS BSA 0.3% sodium azide 0.02%. The next day, cells were rinsed three times with 200 µL of PBS Tween 0.1% and then incubated 1 h at 37 °C with a mixture (50 µL/well) of Cy3 antibody at 1:500 dilution and Hoechst (1 µg/mL) in PBS BSA 0.3% sodium azide 0.02%. After three rinses with PBS Tween 0.1% (200 µL), a 50% glycerol-PBS solution (50 µL) was added into each well. Fluorescence was measured using the FLUOstar Optima microplate reader.
CMBA Randomization Experiment
Compound selection
Based on previous results, 480 inactive compounds were obtained from the ChemBridge Corporation library (San Diego, CA). The remaining 80 compounds (40 active and 40 inactive) were chosen based on results from the CMBA titration series experiment. There were, however, only 32 unique active compounds; six of these 32 were deposited in two concentrations, and one was deposited in three concentrations, mimicking compounds of varying biological activity levels. The concentrations of the active compounds were chosen so that they would exhibit moderate biological activity. Twenty-five of the active compounds and one putatively inactive compound, however, were sufficiently strong to be ranked ahead of all other compounds by the five best-performing normalization methods (Well Correction, 7 Z, R, 9 Median Filter, 6 and SPAWN 23 ) in both the confounded and randomized designs.
Each of the 560 test compounds in DMSO solution was picked once from stock microplates and then divided into eight replicates of equal volume into empty 96-well microplates. Compounds were deposited in the middle 10 columns, with the first and last columns spared for controls. Each compound replicate was dispensed at the same well position across eight microplates, leading to the generation of eight identical microplates for every set of 80 different compounds and a total number of 56 compound-microplates.
Test microplate preparation
HeLa cells were seeded at a density of 36,000 cells per well of 96-well tissue culture microplates in 90 µL of medium and allowed to grow for 24 h in a 37 °C, 5% CO2 incubator, as described above.
Fully automated procedure for 96-well format assay
The screening of the 56 compound-microplates was divided into eight daily runs; for each run, seven different compound microplates were screened, so that the 560 different test compounds were screened once during each of the eight daily runs. Four DMSO control plates were included in each daily run.
Active and inactive compound placement was performed using an orthogonal Latin hypercube method (five or six active compounds per plate). Each plate was first split conceptually into four orthogonal segments consisting of the first and last four rows and top and bottom five columns, resulting in four blocks of 20 wells. The well locations of the 40 active and the 40 inactive compounds were chosen such that there was no more than one active or inactive compound in any row or column and no more than two active or inactive compounds in each orthogonal segment. The orthogonal Latin hypercube method was run once for each plate and applied identically to the four replicate plates in the confounded design. The method was applied four times, once for each of the replicates of the randomized design assay.
Twenty-four hours following test microplate preparation, the test microplates were transferred to the automated-platform cell incubator, and then each well was robotically supplemented with 10 µL of RPMI containing test compounds at the required concentration, according to two experimental designs. In the confounded design, each compound was dispensed into the test microplate to the same well position as in the compound microplate. In the randomized design, the compound placement was randomized for all test microplates. The two experimental designs were alternated for each daily run, and the order of the compound microplate processing was randomized for each daily run for both designs.
Each of the test compounds was deposited in a specific concentration (range, 41 nM–25 µM), with the goal of obtaining a moderate activity level for each compound. As bioactive control, the final concentration of colchicine was 2 µM. The final concentration of DMSO was 0.5%. After drug dispensement, the assay was conducted as described above.
Inglese et al. 19 Experiment
The Inglese et al. 19 qHTS assay screened the 1280 compounds of the Prestwick library for pyruvate kinase activity at 14 concentration levels, ranging from 0.73 × 10⁻³ to 25 µM, with three replicate plates at each concentration. The entire library was screened on a single 1536-well plate for each concentration with the compounds placed in the same well location across replicates and concentration groups. Bidirectional active compounds were detected based on analysis of their concentration-response curves using four criteria: efficacy, curve fit, number of asymptotes, and presence of an inflection point. Ninety-eight compounds were defined as active.
Results
Titration Series Experiments
We examine six normalization strategies with two small-molecule screens: the Inglese et al. 19 14-point titration series curves for a pyruvate kinase assay arrayed on 1536-well plates and an in-house 9-point titration series of a 96-well plate cell-based assay (CMBA) that screens for small molecules that affect microtubule dynamics21,24 (see Materials and Methods). For the latter experiment, intracellular concentrations of the compounds are unknown because they reflect both affinities with their targets and the equilibrium between the uptake and efflux of the compounds. 25 Accordingly, these data are potentially more variable and less accurate than the enzymatic Inglese et al. data, providing greater algorithmic challenges.
The six examined normalization methods are Z score, R,
9
Loess,
10
Median Filter,
6
Mean Filter + Loess,
5
and a new method, SPAWN,
23
which extends the trim polish approach
8
by adding an optional well correction procedure. We note that Z scores are linear transformations of other normalization methods, which likewise apply within-plate arithmetic operations (e.g., percent of control, normalized percent inhibition/activation, and plate median normalization), and as such, all of these methods correlate 1.0 with each other. We note also that Z scores are not to be confused with the quality control Z and Z′ factor scores
20
commonly used by HTS screeners. With the exception of Z scores, all methods attempt to correct within-plate spatial bias (see
Figure 1a
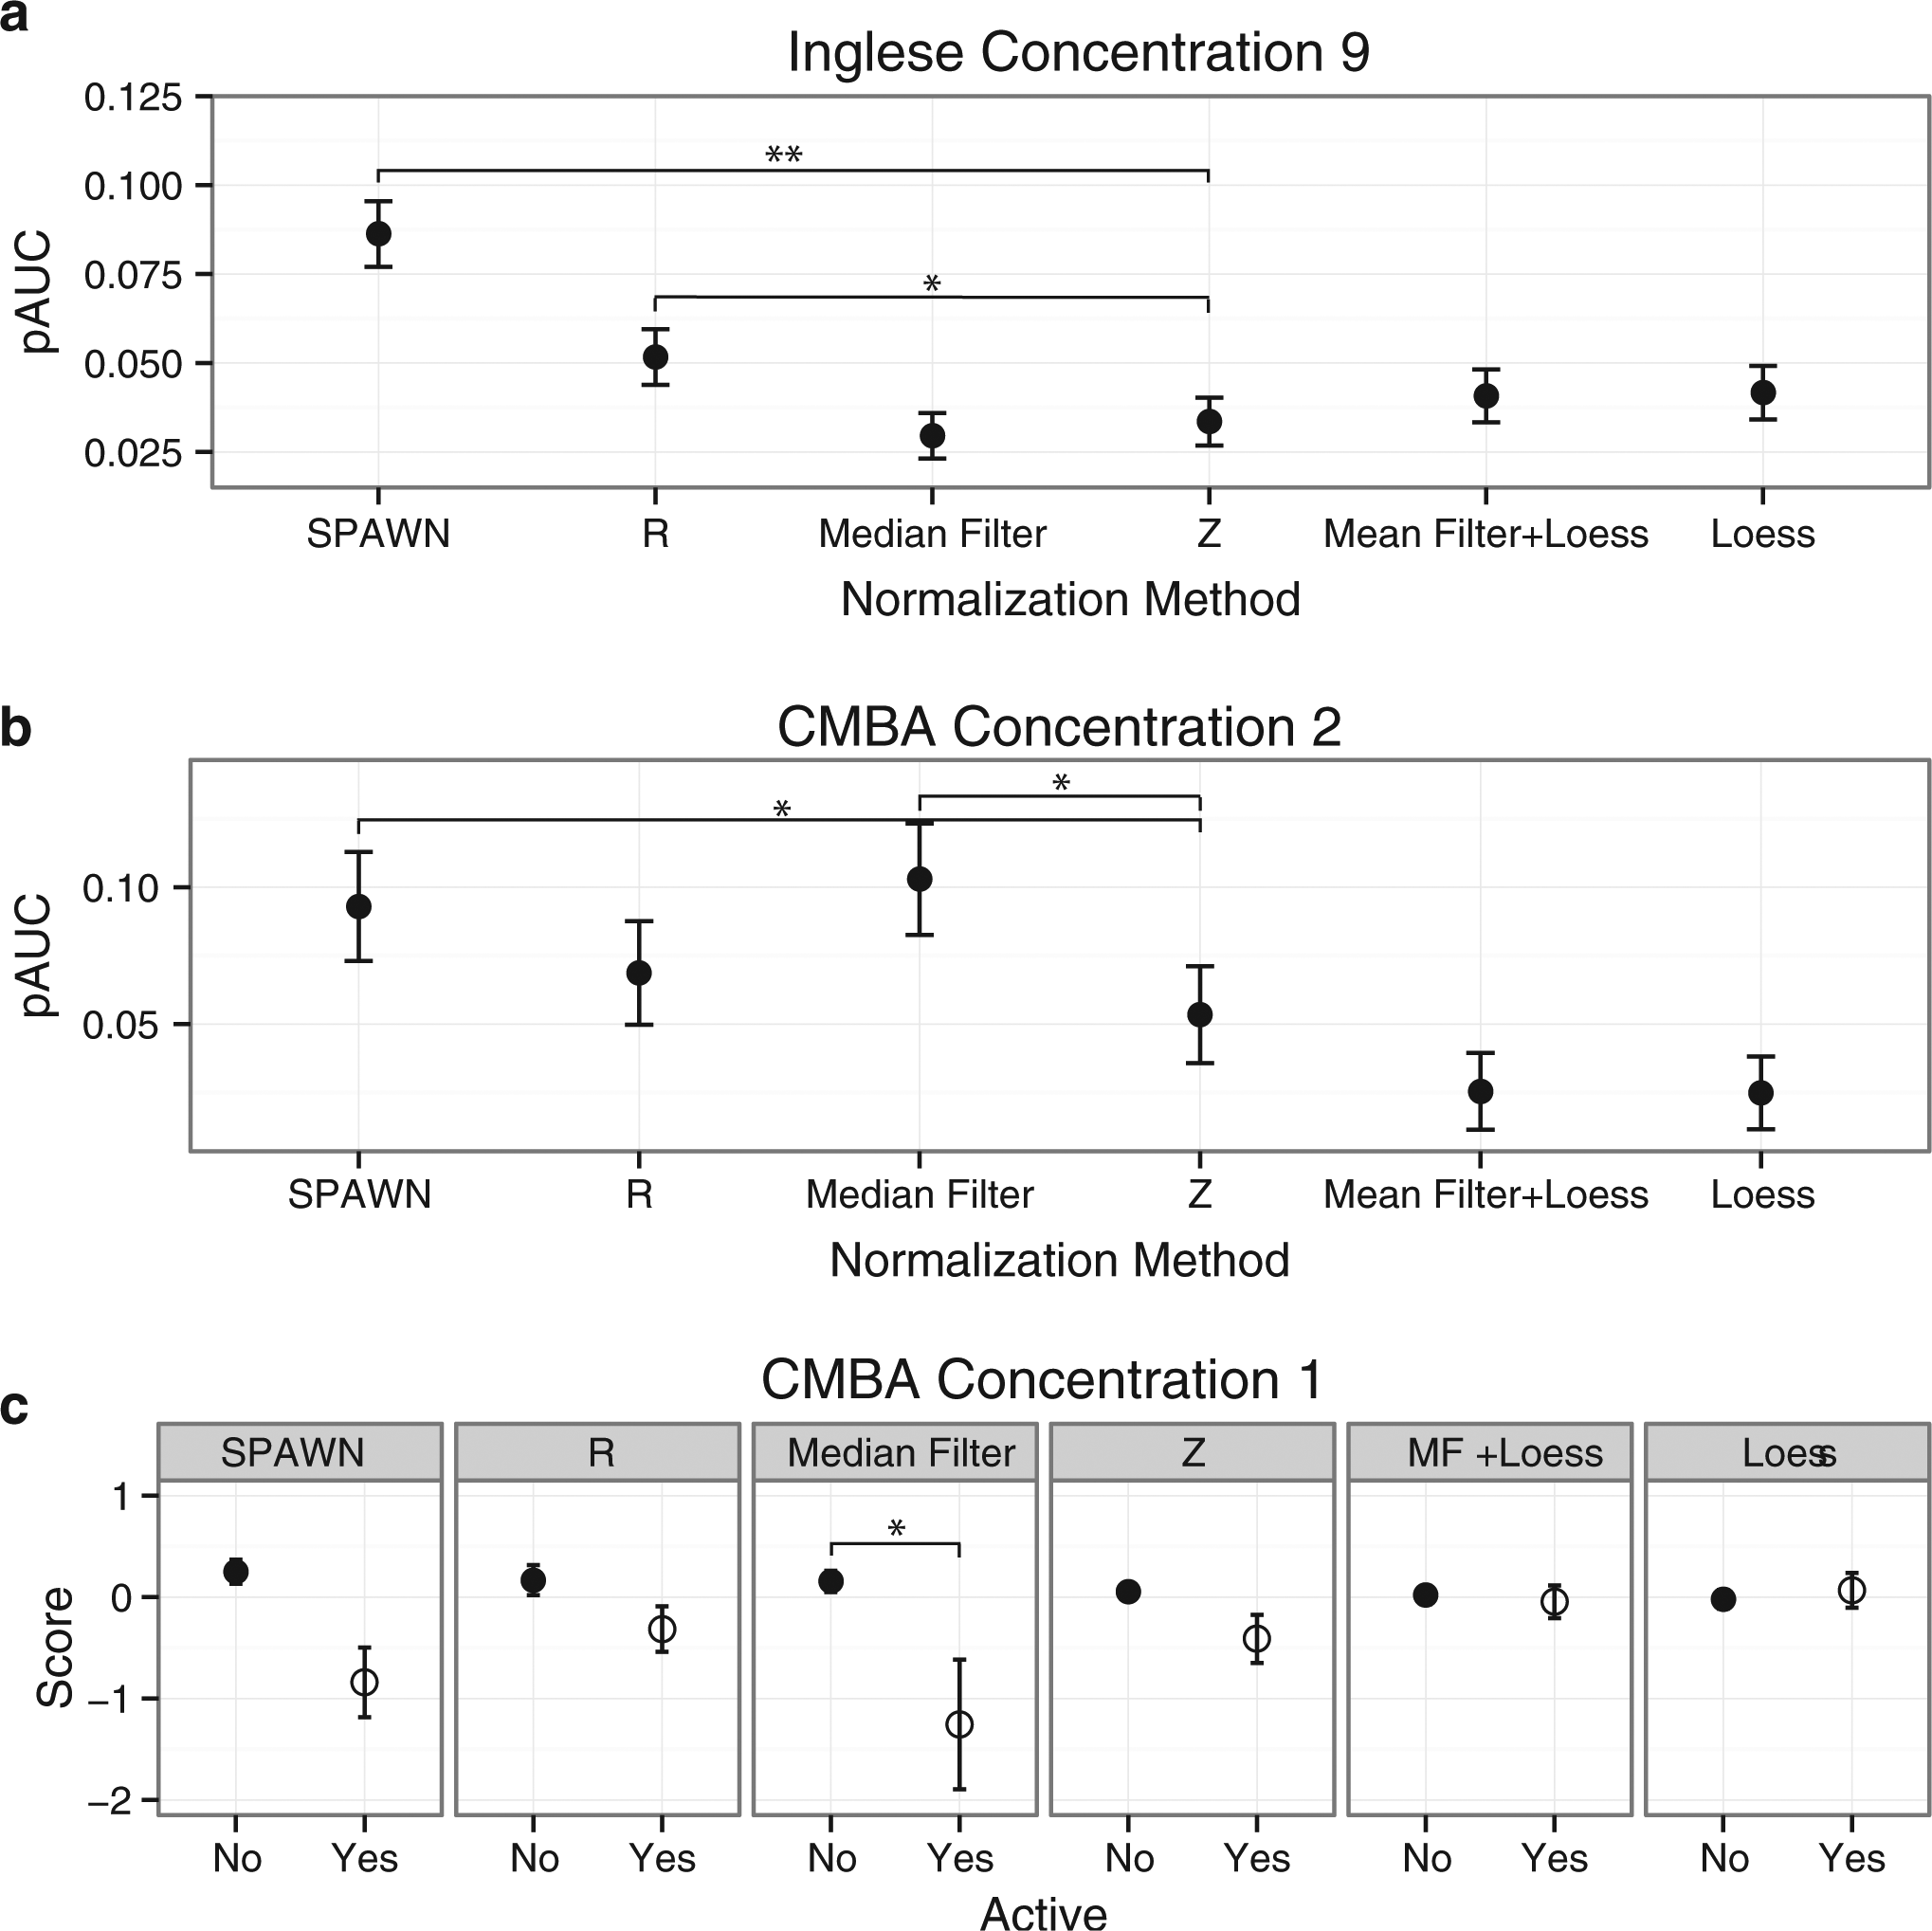
Partial area under the curve (pAUC) and normalized data values for six normalization methods in the two titration series experiments at the lowest concentrations that showed significant improvement relative to Z scores by at least one of the other methods. (
Higher pAUC values relative to Z scores were observed at concentrations 9 to 14 for both SPAWN and R for the Inglese et al.
19
data (concentration 9 is shown in
Fig. 1a
); improvements were also observed for Loess at concentrations 10 to 13 and for Mean Filter + Loess at concentration 13. At concentration 14, Median Filter and Mean Filter + Loess performed worse than Z scores. For the CMBA data, Median Filter and SPAWN performed better than Z scores (concentration 2 shown in
Fig. 1b
and at concentrations 4 and 8 for SPAWN and at concentration 5 for Median Filter). R was the only other method to show higher pAUC values relative to Z scores (at concentration 7). Poorer performance than Z scores was shown by Loess at concentrations 4 and 7 to 9 and by Mean Filter + Loess at concentration 9. ANOVA tables, post hoc comparisons, and graphs for all data sets at all concentrations for pAUC and graphs for AUC indices are shown in
An alternative analysis approach is possible for assays that show one-tailed effects as with the CMBA data (low scores indicate activity). For these analyses, 2 (Compound Activity Status) × 5 (Normalization Method) within-subjects ANOVAs were performed on the medians of the compound replicates of the normalized data at each concentration of the CMBA data. These analyses, which were not possible for the two-tailed effects in the Inglese et al.
19
data, are potentially more sensitive because they are based on the measurements rather than on their ranks as with the pAUC index. Indeed, results for these analyses were more consistent across concentrations than were the pAUC results.
Figure 1c
shows these results at the lowest concentration that showed a statistically significant overall Activity × Method interaction and a significant interaction between at least one of the normalization methods and Z scores. Median Filter showed larger differences between active and inactive compounds than did Z scores at concentration 1 (
Fig. 1c
) and at concentrations 2 to 4 and 6 to 9. R and SPAWN showed similar effects (concentrations 2–9) as did Loess (concentrations 5 and 7–9). Mean Filter + Loess performed inconsistently (better at concentration 5 but worse at concentration 9). All methods correctly showed near-zero mean values for inactive compounds across all concentrations, indicating that the superior performance of various methods was due primarily to better detection of active compounds. See
Figure 2
shows that the methods’ relative effectiveness in removing both within- and across-plate measurement biases underlies their respective performance differences.
Figure 2a–d
shows within-plate autocorrelation plots at various lags for two plates from the two titration series experiments. These plots can reveal spatial bias patterns that are difficult to detect with the more commonly used heatmaps and other shading-based representations such as 3D wire plots. Nonzero autocorrelations indicate that proximal wells within plates are correlated and that a feature’s measured intensity depends in part on where it is located on the plate (lag 1 indicates correlation between adjacent wells, lag 2 indicates correlation between wells separated by one well, etc.). Linear or cyclical patterns in the autocorrelations across lags in particular indicate systematic bias, while Moran’s I statistic provides an estimate of overall spatial autocorrelation (see
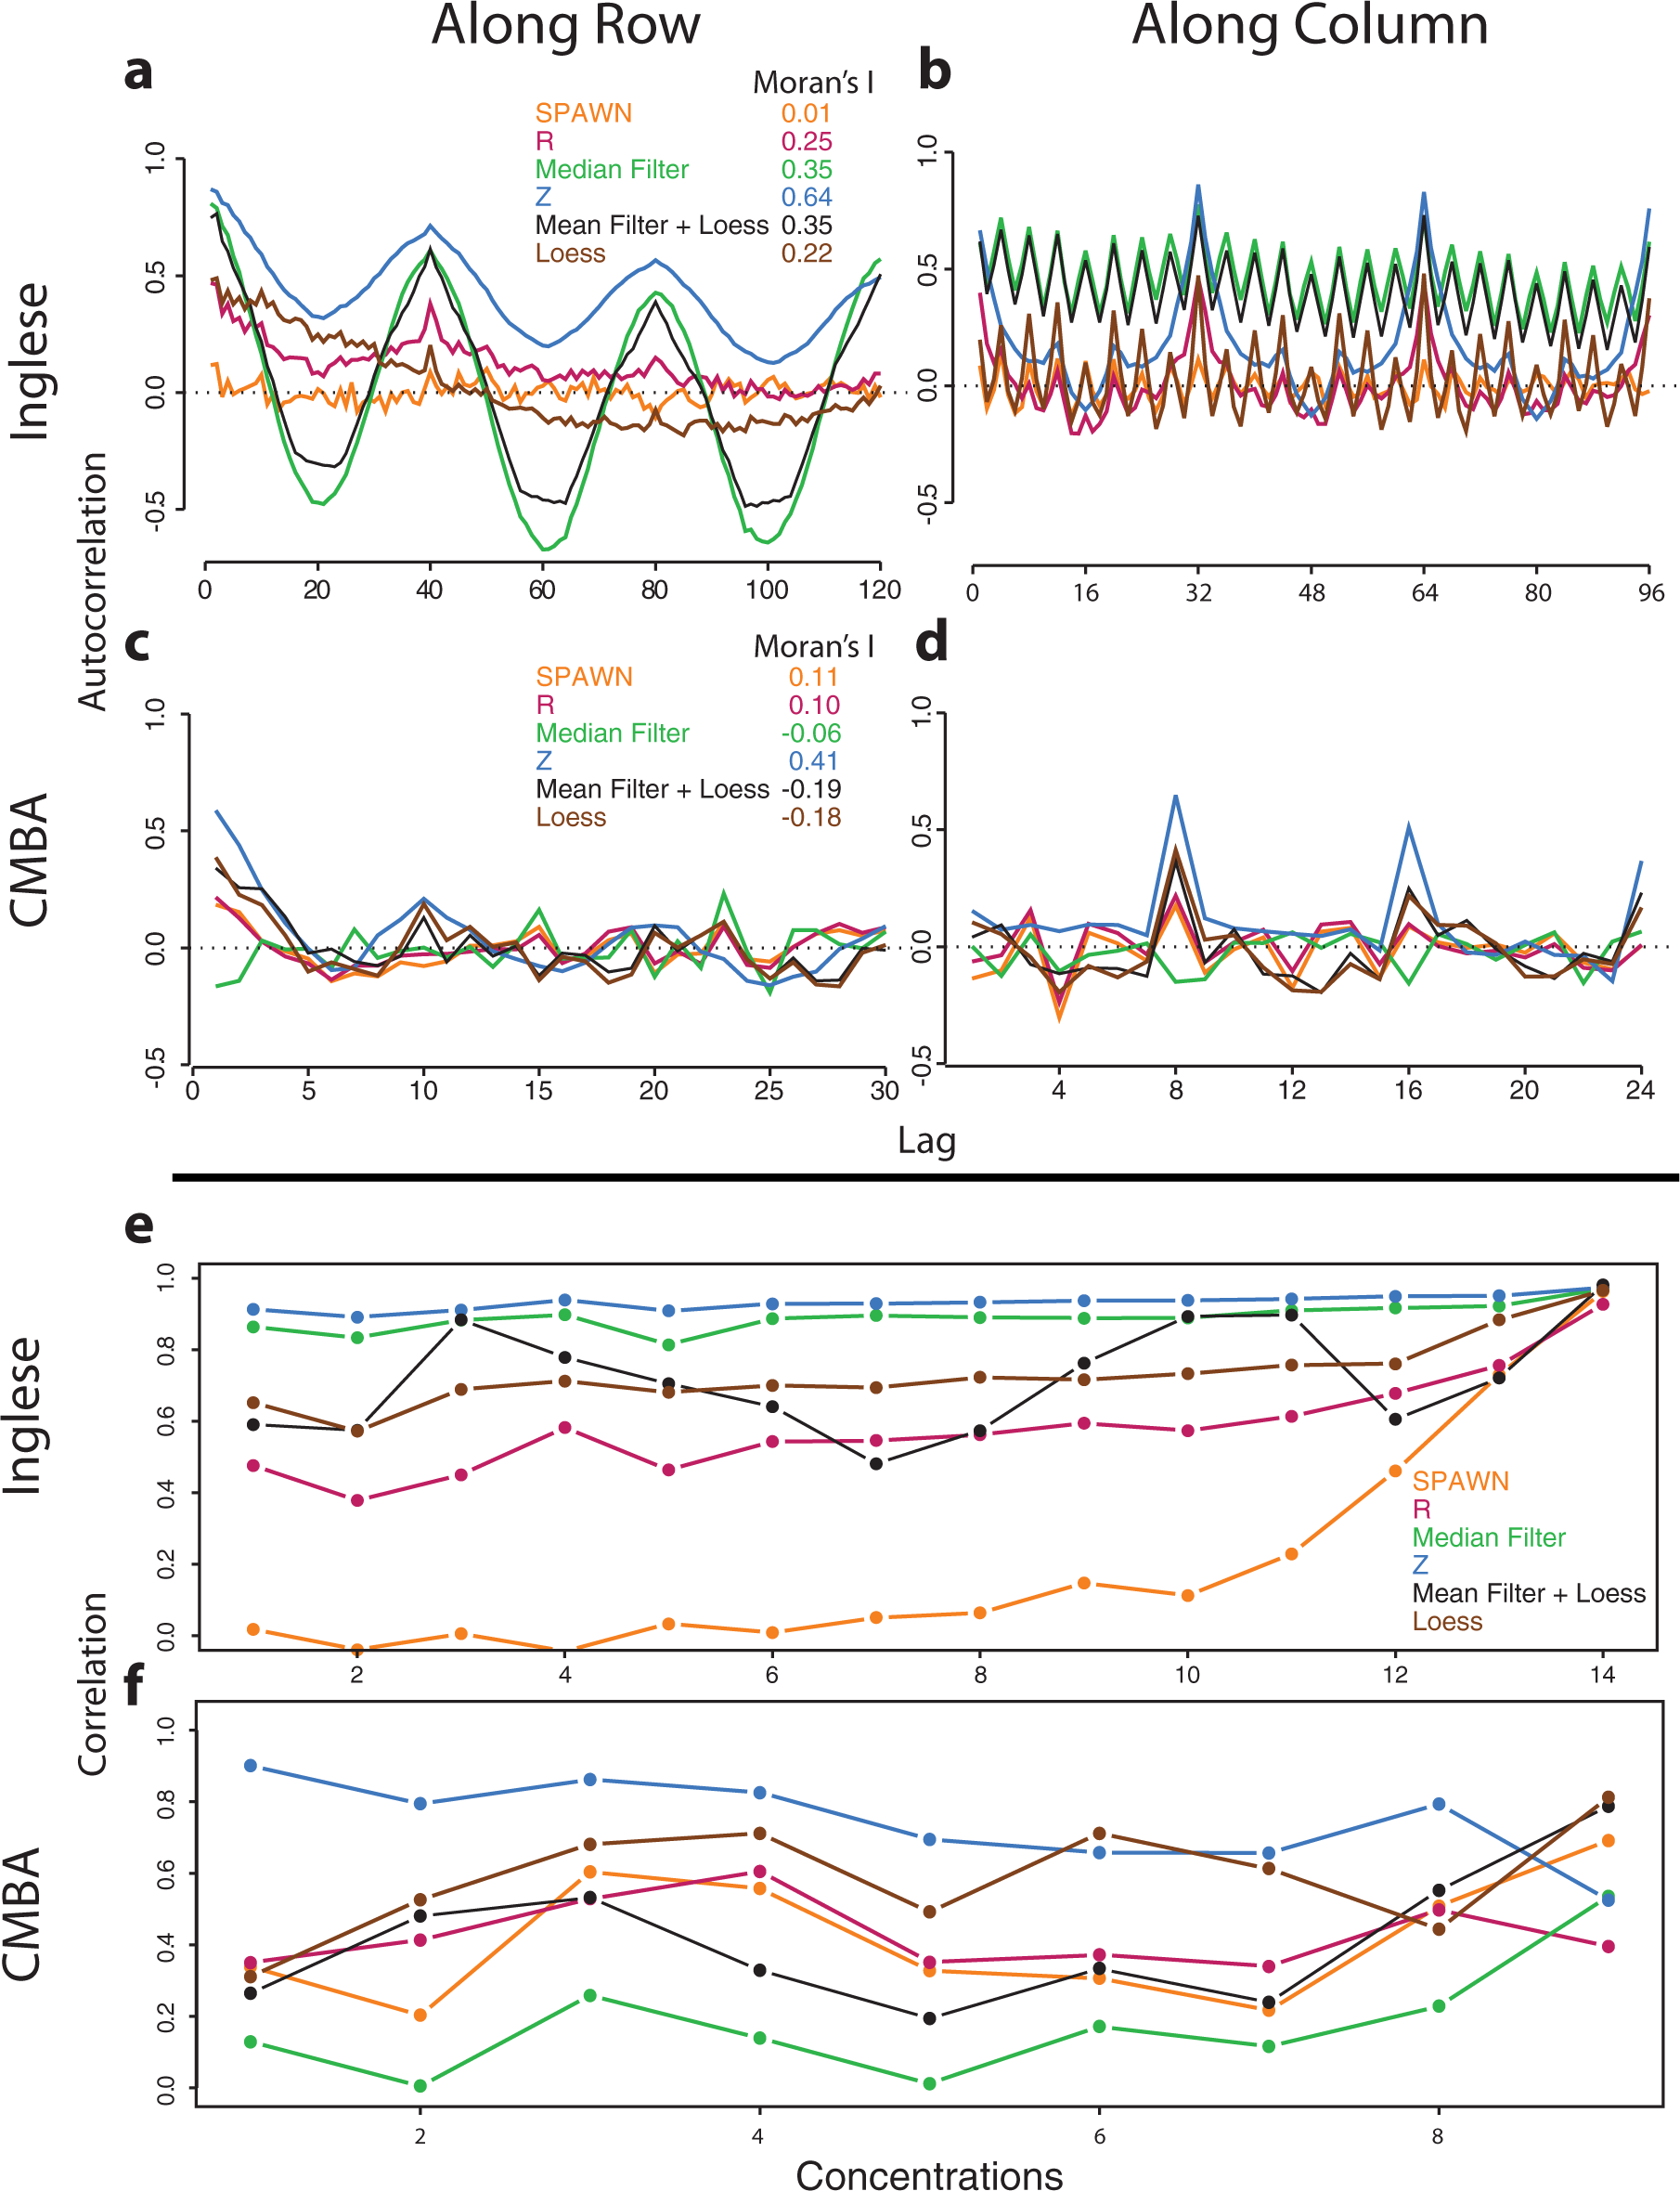
Within-plate autocorrelations and across-plate correlations of six normalization methods for the two titration series experiments. (
Correlation values between replicate plates for inactive compounds at all concentrations are shown in Figure 2e–f . Contrary to what has sometimes been reported in the literature, high correlations between replicate plates in primary screens with few active compounds and with replicates placed in the same well locations (as is typically done and as was done in the two titration series experiments) are not evidence of good reproducibility. Rather, they indicate well location bias. Absent high leverage data points, correlations between replicate plates should be approximately zero within the inactive range when there is no well bias because these measurements are expected to vary randomly around the same null value; correlations between replicate plates should be positive only for the subset of active features. Moreover, across-plate bias acts independently of within-plate bias and cannot be detected by autocorrelation plots or other within-plate graphical methods such as heatmaps.
For the Inglese et al.
19
data, correlations near 1 were observed for Z and Median Filter across all concentrations. Mean Filter + Loess, Loess, and R showed moderate correlations across all concentrations. For SPAWN, the correlations were near zero except at the highest concentrations. For the CMBA data, Z scores showed the highest correlations and Median Filter the lowest correlations, with the remaining four methods showing low to moderate correlations. As with the autocorrelation plots, these indications of bias proved to correspond to the methods’ respective performances in distinguishing between active and inactive compounds. More detailed information can be gleaned from scatterplots of all compounds and inactive compounds only (see
Figure 3a
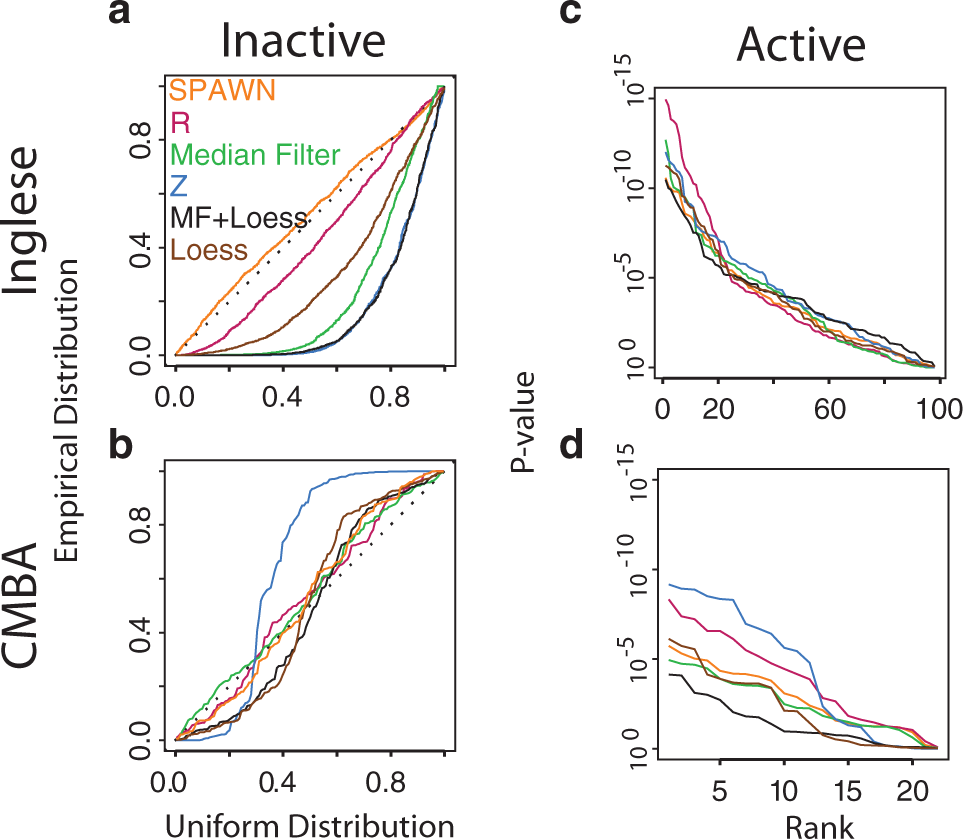
Random variance model (RVM) one-sample t-test p-values (n = 3) of six normalization methods for the two titration series experiments. Quantile-quantile (QQ) plots of p-values for inactive compounds at the lowest concentration for the (
Randomization Experiment
Some 560 compounds (40 active and 520 inactive) were deposited on seven 96-well plates and were run against an immunofluorescence HTS cell-based assay that probes for microtubule depolymerization agents. Compounds were randomly assigned to plates and individual wells in one of two designs. In the confounded design, the same randomly assigned well locations were used for each of four replicate plates. In the randomized design, random assignment of compounds to well locations was done independently for each of the four replicate plates (see Materials and Methods: CMBA Randomization Experiment). In each design, plate order processing was randomized for each run. We also examined the performances of the six normalization methods evaluated in the titration series experiments and that of two additional methods (B-score
4
and Well Correction,
7
which were not appropriate for the titration series experiments). The B-score, Loess, and Mean Filter + Loess methods performed poorly, however, and were excluded from further analysis (see
Figure 4a shows the pAUC results for the five remaining methods. A 2 (Study Design) × 5 (Normalization Method) within-subjects ANOVA revealed only a significant main effect for normalization method (F(4, 2236) = 3.89; p < 0.005), although post hoc comparisons indicated no significant difference between Z and any of the other normalization methods. Analyses of the medians of the compound replicates for the normalized data, however, revealed a significant three-way (Study Design × Normalization Method × Compound Activity Status) mixed-model ANOVA interaction (F(4, 2232) = 12.26; p < 0.0001) ( Fig. 4b ). Significant 2 (Study Design) × 2 (Compound Activity Status) post hoc interactions were found for Median Filter (F(1, 558) = 4.04; p < 0.05), SPAWN (F(1, 558) = 24.60; p < 0.0001), and Well Correction (F(1, 558) = 4.04; p < 0.05), indicating better performance in the randomized design. Median Filter, SPAWN, and R each showed significantly better performance than Z in both the confounded and the randomized designs (all Fs (1, 40) > 100; p < 0.0001). Well Correction performed significantly worse than Z in the confounded design (F(1, 40) = 35.77; p < 0.0001) but better in the randomized design (F(1, 40) = 9.00; p < 0.005).
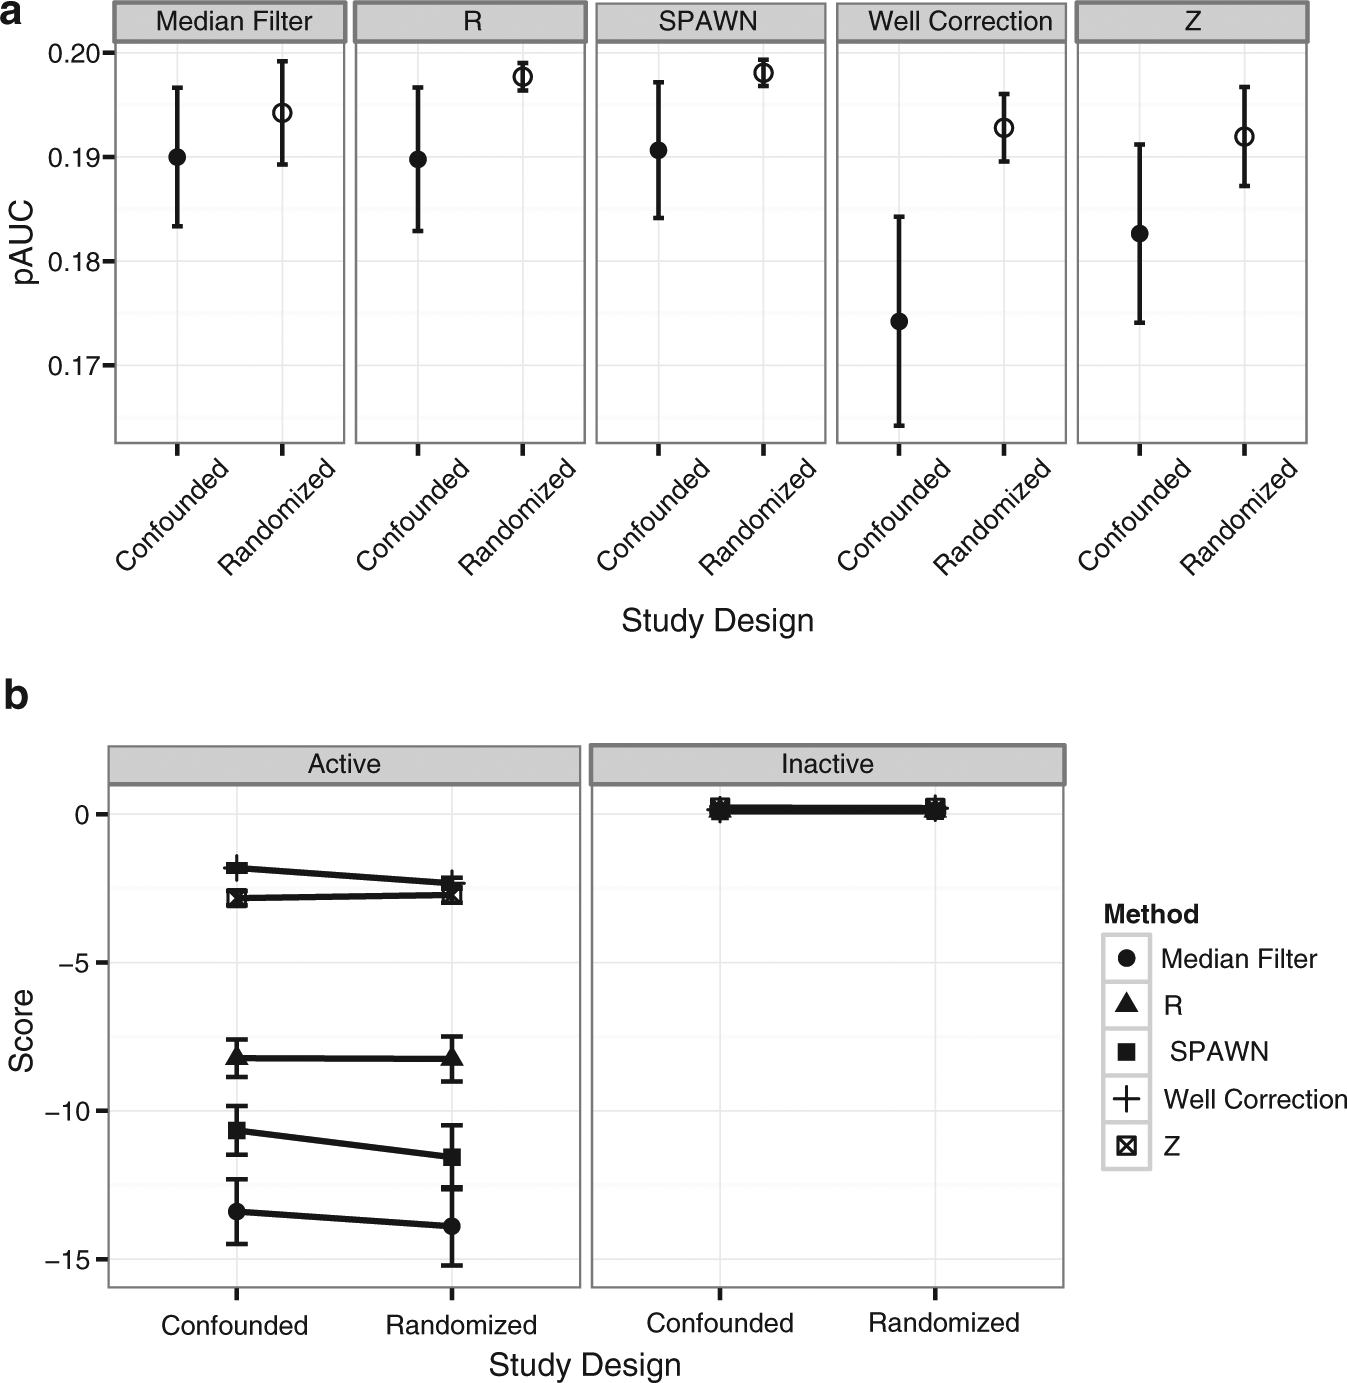
Equipe Criblage pour des Molécules Bio-actives (CMBA) randomization experiment. (
Figure 5a–d
shows autocorrelation plots for each design’s bias template, which is a robust estimate of within-plate spatial bias across all plates (see
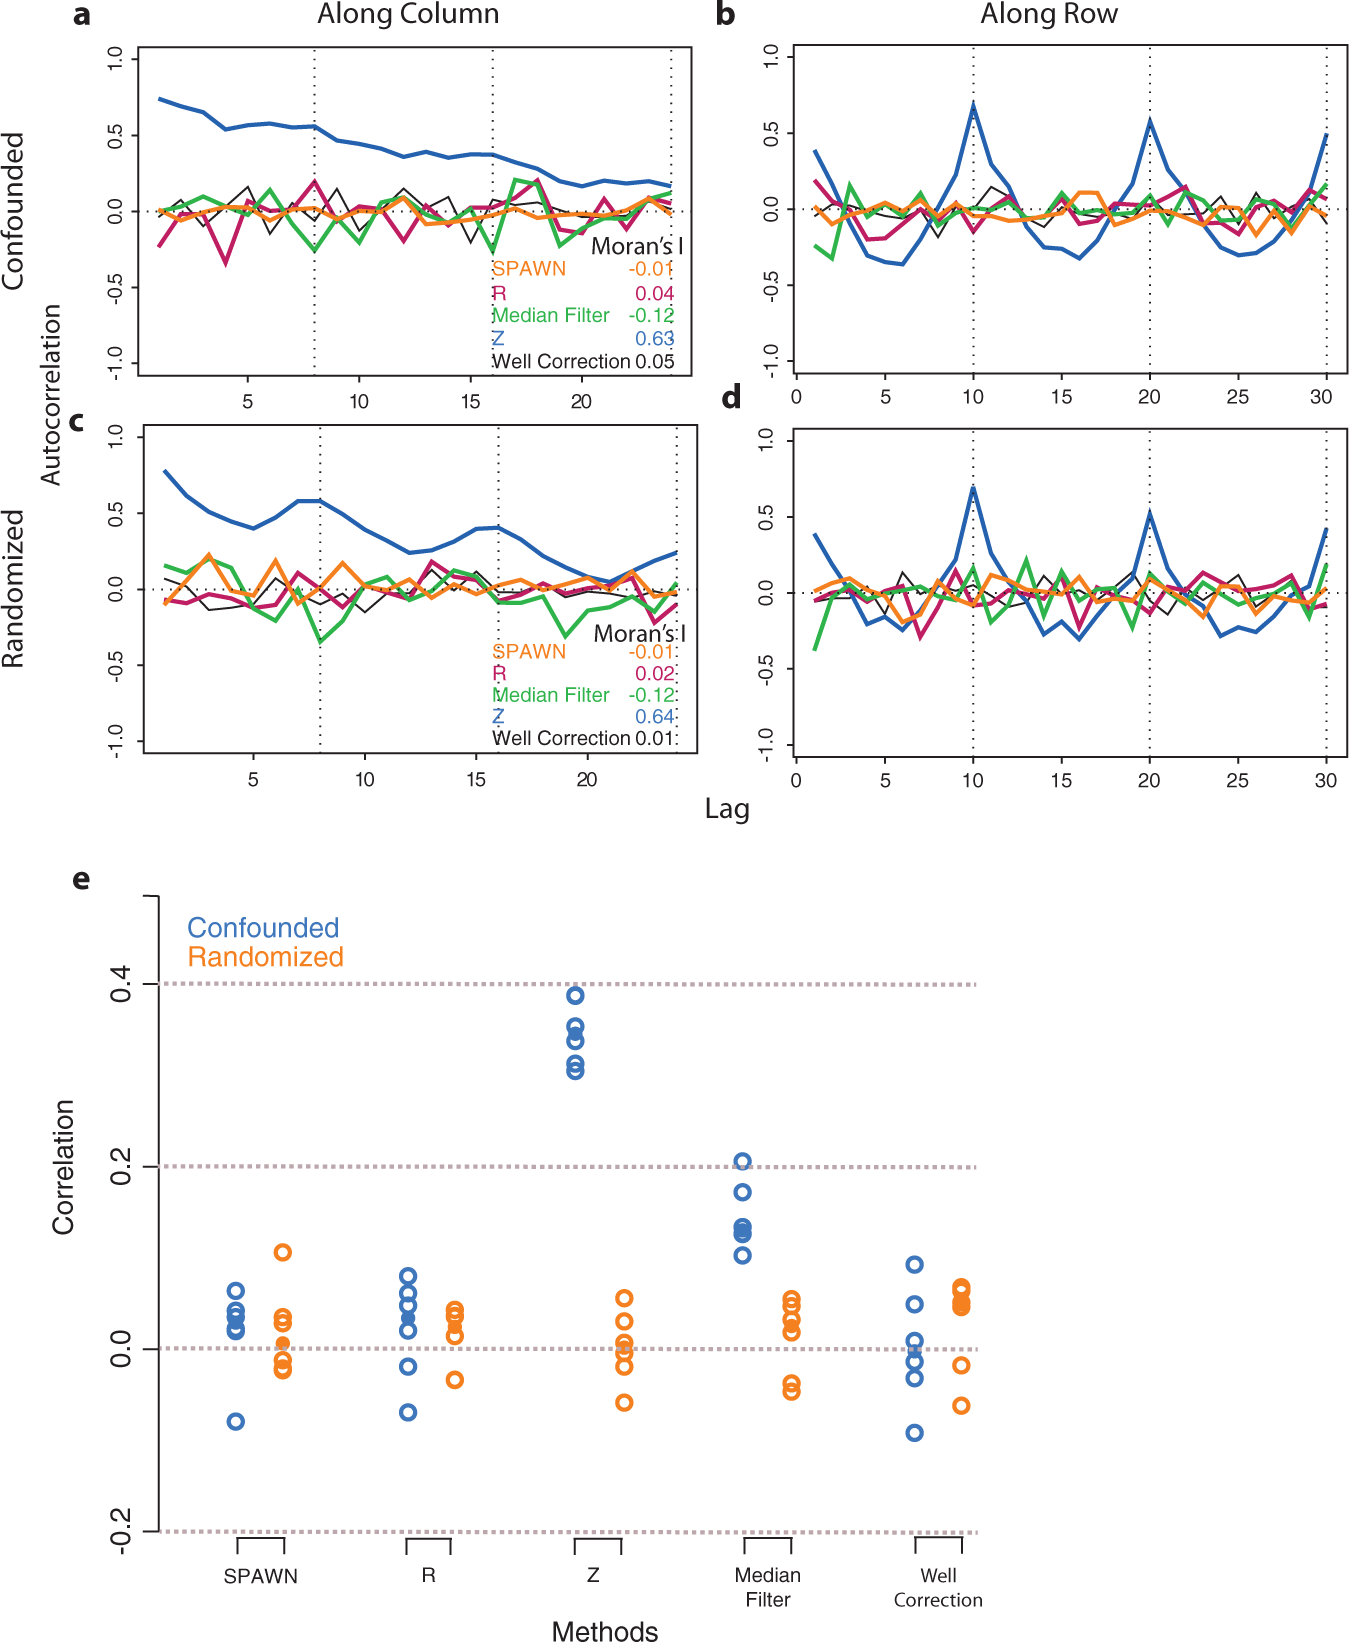
Within-plate autocorrelations and across-plate correlations of five normalization methods for the randomized and confounded designs. (
Figure 6a
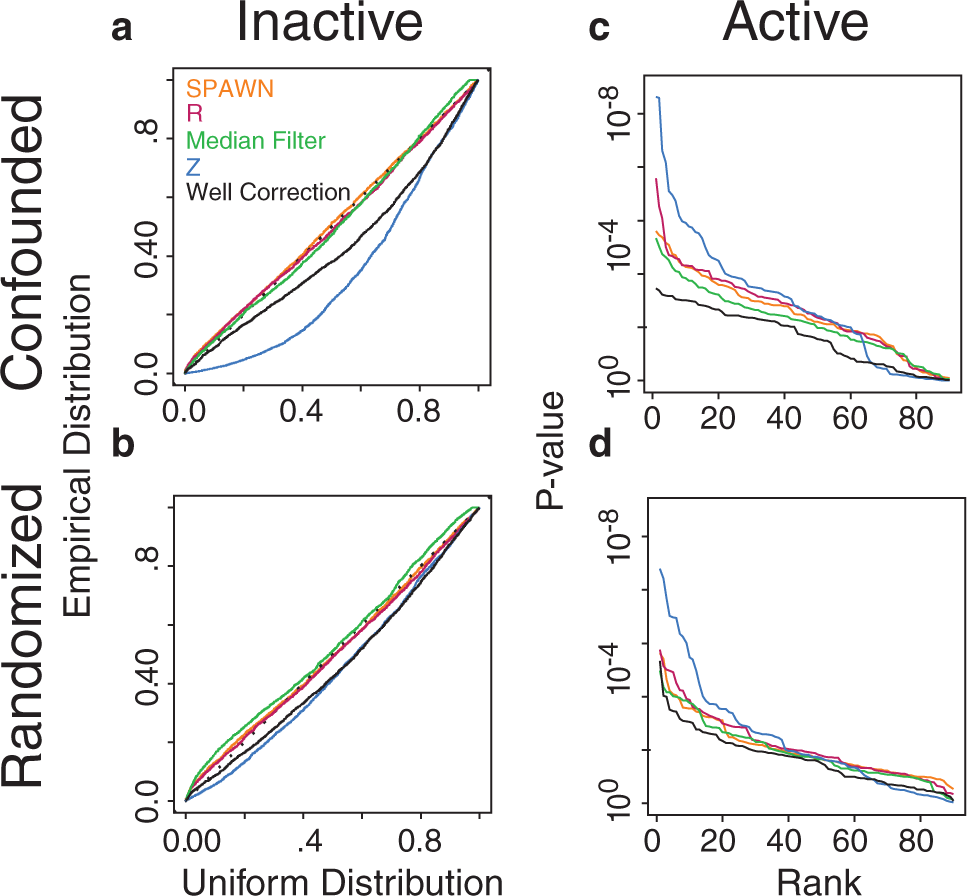
Random variance model (RVM) one-sample t-test p-values for all n = 2 replicate combinations of five normalization methods for the randomized and confounded designs. Quantile-quantile (QQ) plots of p-values for inactive compounds in the (
Online Survey
Thirty-six individuals participated in an online survey about HTS practice (
Discussion
Systematic error in HTS measurements is of at least three forms: plate-specific bias, within-plate bias, and across-plate well location bias. Only plate-specific bias is addressed by commonly used normalization methods such as Z scores or equivalent normalization methods that use internal controls. This is an important consideration inasmuch as Z score normalization performed poorly in the four screens.
Analyses of single-concentration data, using titration series results for establishing gold-standard activity levels, indicted that SPAWN 23 and Median Filter 6 were the best-performing normalization methods. SPAWN was the most consistent method, performing well in all experiments. Although Median Filter did not perform well in the Inglese et al. 19 experiment, it often outperformed SPAWN in both CMBA experiments. Although results were generally not as strong as with the two best performers, R also provided consistently good performance across the experiments.
The question arises, however, about which of these three methods one should choose when running a screen in the typical configuration (i.e., at a single concentration without gold-standard benchmarks). Until more extensive data are available, one recommended strategy is to determine which of the choices best minimizes systematic error according to the autocorrelation and scatterplot methods we describe. Although this does not guarantee best performance because in theory bias may be minimized at the expense of adding large random variation, our results suggest that this is nonetheless a reasonable strategy for estimating the relative effectiveness of competing methods.
The effects of randomizing compound placement in replicate plates, although statistically significant, were considerably smaller than the effects of the normalization method. This is encouraging to the extent that good results can be achieved even in confounded designs when a powerful normalization is used. This is doubling encouraging because applying normalization algorithms requires substantially less effort than the randomization procedures used in this study. The SIGHTS software we provide in particular should facilitate the use of normalization methods that can provide superior screening results.
It is important to note, however, that our results also indicate that randomizing compound placement in replicate plates is nonetheless a recommended strategy when attempting to detect small effects. Our results showed that randomization resulted in statistically significant superior performance for both Median Filter and SPAWN over their already best performance in the confounded design. We note also that plate processing order was randomized in both the confounded and randomized study designs. By spreading out sources of variation, this strategy is more likely to capture the genuine variability of the assay relative to, for example, running replicate plates either in the same order in different runs or, even less optimally, running them contiguously. By minimizing genuine variability, the consequence of these latter two strategies is to make the assay appear more reliable than it actually is. Fortunately, randomizing plate order is a simple procedure to implement.
Underestimation of genuine variability by lack of randomization of various types in primary screens is almost certainly a major reason why putatively active features frequently fail to be confirmed in follow-up screens, especially if technical rather than biological replicates are used in the primary screen. Thus, fully randomized screens with biological replication as in our studies provide better estimates of true biological activity and consequently better chances at validation.
We appreciate that the randomized design we are advocating may be difficult to implement. One solution to this dilemma would be to generate randomized copy plates from mother plates when the screening platform is not otherwise in use or to use a dedicated pipetting system for this purpose. Another solution would be for manufacturers to supply differently randomized mother plates to remove the need for customers to implement randomization schemes when transferring from mother to test plates. In both cases, researchers would need only to adopt randomization and blocking strategies for plate processing order appropriate to the screen.
The increased use of replicates indicated in our survey and in other sources3,14,29 (see also http://iccb.med.harvard.edu/screening-information/overview-and-guidelines/#replicates) offers increases in precision due to averaging but also improves accuracy when feature locations are varied across replicate plates. Although half of the survey respondents who used replicates indicated that they altered replicate feature placements at least some of the time, to be most effective, the procedure must be implemented in such a way that every feature has an equal probability of being assigned to a particular well location (e.g., by a random-number generator). Other methods, such as the technician assigning well locations haphazardly in an attempt to emulate randomness or inverting a duplicate plate, do not meet the required standard for randomization and are susceptible to uncontrolled sources of bias.
Our results also suggest that statistical testing of feature activity levels, which has been slow to take hold in HTS studies, offers advantages over current practice. The slow adoption is understandable for at least two reasons. In part, the superior reproducibility of robotic relative to manual screens may have masked the requirement of appropriate statistical experimental design and analysis. The consistently poor performance of the standard t-test may have also discredited formal statistical testing. Instead, most researchers have opted for alternative strategies such as selecting features for follow-up based on biologically meaningful thresholds (e.g., particular percentage inhibition or activation), ranking, visual judgments of data distributions, or requiring that features show values beyond some threshold in a majority of replicated n = 1 experiments (e.g., two of three). The false-positive and false-negative rates, however, are unknowable with these strategies. Our results show that the RVM t-test, available in the SIGHTS software, is a good alternative that provides all of the advantages of formal statistical testing with as few as two replicates, although a minimum of three is generally recommended. The p-values generated from the statistical tests can then be used to balance false positives and false negatives based on objective statistical benchmarks. We conclude that potent, reliable, and accurate HTS requires replication, randomization design strategies, and more extensive normalization than is typically done and that formal statistical testing is desirable.
Footnotes
Acknowledgements
We thank James Inglese for providing data and information, Richard Simon and George Wright for permission to incorporate some of their original RVM code into the SIGHTS software, and Zhijin Wu for information on the R normalization algorithm. We thank Delphine Filiputti for technical assistance.
Declaration of Conflicting Interests
The authors declared no potential conflicts of interest with respect to the research, authorship, and/or publication of this article.
Funding
The authors disclosed receipt of the following financial support for the research, authorship, and/or publication of this article: This work was supported by Le Fonds Québécois de la Recherche sur la Nature et les Technologies (FQRNT) grants 119258 and 173878, the Centre National pour la Recherche Scientifique (CNRS) and the Commissariat à l’Energie Atomique (CEA), grants from the French National Genopole and from the French GIS IBiSA, and a Walter Sumner Foundation Fellowship to C.M.
References
Supplementary Material
Please find the following supplemental material available below.
For Open Access articles published under a Creative Commons License, all supplemental material carries the same license as the article it is associated with.
For non-Open Access articles published, all supplemental material carries a non-exclusive license, and permission requests for re-use of supplemental material or any part of supplemental material shall be sent directly to the copyright owner as specified in the copyright notice associated with the article.