
Abstract
Neuroblastoma (NB) is a common solid tumor in children. Outcomes for advanced stage NB have not improved, at least in part because of multimodality therapy resistance. Better comprehension of novel molecular targets will likely lead to improved therapies with specific cytotoxic agents. For instance, the role of deregulated IGF-1R/AKT/PI3K/mTOR (PI3K) pathway activity has attracted much attention across several tumors, including NB. Thus, modulating this pathway via anti-PI3K drugs has taken center stage in many cancer clinical trials. However, varied clinical effects have hampered the precise application of these agents. Tumor PI3K pathway profiling may reveal a method to enhance the efficacy of these inhibitors. To this end, solid-phase antibody-based array platforms have emerged as a direct, rapid means of profiling intracellular signaling pathways. We tested the efficacy of four PI3K inhibitors against a panel of human NB cell lines using Luminex xMAP bead array technology to establish PI3K phosphoprotein profiles. We demonstrate the utility of the xMAP approach in following intracellular signaling signatures specific for PI3K targeted therapy. Further validation is required before xMAP is used routinely for clinical PI3K pathway evaluation, but this method may eventually be personalized by taking into account each child’s basal NB pathway status.
Keywords
Introduction
Childhood neuroblastoma (NB) is a common malignant solid tumor accounting for approximately 10% of all pediatric cancer yet disproportionately represents 15% of pediatric cancer deaths. 1 As these tumors can arise anywhere along the sympathetic nervous system, most occur in the adrenal medulla. Clinically, NB treatment is based on risk stratification into very-low-, low-, intermediate-, and high-risk groups. These risk groups are determined by both clinical and biologic factors, which include age at diagnosis, stage, histology, MYCN status, and DNA ploidy. In general, the prognosis for patients with low- or intermediate-risk NB is excellent with conventional treatment modalities, whereas the prognosis for those with high-risk NB is very poor with conventional treatment alone, with a 5-year event-free survival rate of about 40%. Strategies to improve the outcomes in high-risk NB include the implementation of biologic therapies, including antiganglioside antibodies targeting GD2, differentiation-inducing agents (retinoids), meta-Iodo-benzyl-guanidine (MIBG) therapy, anaplastic lymphoma kinase (ALK) inhibitors, and aurora kinase A inhibitors. Other novel beneficial therapeutics have been extensively reviewed, 2 and future treatments may eventually incorporate the pharmacologic modulation of growth-promoting signaling networks for advanced-stage NB.
One signaling module attracting significant attention in NB is the IGF-1R/AKT/PI3k/mTOR (PI3K) cascade. The PI3K mechanism is a key evolutionary, conserved pathway mediating cellular processes, including growth, motility, survival, and metabolism. The deregulation of PI3K is an important theme in cancer biology and, as a result, has garnered considerable interest for targeting this pathway as a viable anticancer option. Support for inhibiting this pathway is the rapidly accumulating evidence that suggests the PI3K mechanism is activated in NB. For instance, Opel et al. 3 showed that high phosphorylation of AKT correlates with reduced survival of NB patients and that activation of AKT protects NB cells in vitro against chemotherapy-induced apoptosis. Others have used agents targeting the PI3K pathway (OSU03012 and the dual class I PI3K/mammalian target of rapamycin [mTOR] inhibitor PI103) and show profound effects on NB survival in vitro and in vivo. Both compounds significantly inhibited the growth of established, subcutaneous MYCN-amplified NB xenografts in nude mice. The notion that PI3K pathway inhibitors may be effective in the treatment of aggressive MYCN-amplified NB has been documented via findings that small-molecule inhibitors of PI3K, LY294002, or wortmannin lead to the destabilization of MYCN and significant NB growth suppression. 4 Recent translational efforts by Chanthery and colleagues 5 using the dual PI3K/mTOR inhibitor NVP-BEZ235 support the concept of a PI3K-targeted therapeutic approach in MYCN-amplified NB. Testing the idea that inhibitors of PI3K might block angiogenesis in MYCN-driven NB, they found that blockade of MYCN strongly contributed to the antiangiogenic effects of PI3K inhibitors and led to decreased tumor burden and improved survival in genetically engineered mice and primary orthotopic xenograft models of MYCN-driven NB. Collectively, these data suggest activation of PI3K leads to tumorigenesis in a subset of NB and warrants further investigation for clinical drug trials in children.
Moreover, several small-molecule PI3K inhibitors are currently approved for the treatment of a number of solid tumors. Yet the therapeutic benefit of these inhibitors is limited in clinical trials and may vary depending on the activation state of the various components of the PI3K pathway. Thus, it seems clear that predicting sensitivity to these specific drugs in different cancers will likely require assessing multiple molecular markers related to the PI3K signaling pathway. For example, PTEN, pAKT, p27, and pS6 were found to be informative markers of the mTOR pathway for patient selection in predicting the response to mTOR inhibitors for renal cell carcinoma. 6 Other molecular patterns useful in evaluating the effects of mTOR inhibitors include overexpression of antiapoptotic proteins (Bcl2) that may serve as a surrogate marker for rapalog resistance. 7 Lastly, the activation of alternative survival pathways such as deregulated KRAS has been shown to bypass everolimus-mediated mTOR inhibition. 7 Given the challenges associated with identifying validated predictive biomarkers for PI3K therapy, it is obvious that molecular parameters need to be defined to better select patients more likely to respond to these targeted pathway antagonists.
Conventional protocols used for detection of signaling pathway components include real-time reverse transcription–polymerase chain reaction, Western blotting (WB) and enzyme-linked immunosorbent assay (ELISA), flow cytometry (cells), and indirect immunofluorescence in cells and tissues. Limitations of these procedures include being labor intensive and having limited throughput, as none allow for simultaneous detection of all major proteins in one assay. In addition, small sample volumes may prohibit performing multiple tests on a single sample. The development of solid-phase assays that use capture antibodies immobilized on microspheres offers a novel platform for high-throughput protein detection and enables measurement of multiple analytes simultaneously. Multiplexing provides data on a large number of analytes, even when sample volumes are limited. Currently available multiplex immunoassays have mainly been used for the quantification of various cytokine, chemokine, and growth factor concentrations, but other widely applied biomedical uses include antibody-based phosphoproteomics, 8 identification of major enteric viral pathogens, 9 identification of multiple yeast species, 10 and measurement of cerebrospinal fluid biomarkers of Alzheimer’s disease. 11
In this work, we evaluated the utility of the Luminex multianalyte profiling (xMAP) platform as a high-throughput screening approach to determine whether the efficacy of anti-PI3K compounds could be accurately profiled in human NB through two major objectives. The primary objective was to disturb the NB PI3K pathway at multiple regulatory nodes as single agents and in combination with each other. The secondary objective was to establish molecular markers to monitor the response to these compounds using a multiplex immunoassay approach. These data provide the initial groundwork for establishing whether testing of PI3K antagonists using Luminex xMAP technology is a viable method for establishing a reliable molecular pattern for predicting drug sensitivity in high-risk NB.
Materials and Methods
NB Cell Lines and Culture
An established panel of nine NB cell lines was used. Human NB cell lines SK-N-SH, SH-SY5Y, SK-N-BE(2), SK-N-AS, SK-N-FI, SK-N-MC, and IMR-32 were purchased from the American Type Culture Collection (ATCC; Manassas, VA). Cell lines NB5 12 and NB1691 13 were established at St. Jude Children’s Research Hospital. All cell lines were maintained as monolayer culture at 37 °C in a humidified atmosphere with 5% CO2 according to ATCC recommendations. NB5 and NB1691 were cultured and maintained in Dulbecco’s modified Eagle’s medium supplemented with 10% fetal bovine serum and nonessential amino acids.
Chemotherapeutic Agents
OSI-906 (OSI; insulin-like growth factor–1 receptor inhibitor) and NVP-BEZ235 (BEZ; PI3K/mTOR inhibitor) were purchased from ChemieTek (Indianapolis, IN), NVP-BKM120 (BKM; PI3K inhibitor) was obtained from Novartis (Basel, Switzerland), and everolimus (mTOR inhibitor) was purchased from Selleck (Houston, TX).
Cell Treatments
All compounds were dissolved in DMSO to obtain stock solutions of 20 mM, which were diluted appropriately at the time of use in culture medium. The final concentration of DMSO did not exceed 0.5% and did not alter cell viability.
Cell Viability Dose-Response Curves
Exponentially growing cells were plated in 96-well microtiter plates at 2.5 × 10³ cells/well. The day after plating, the medium was replaced with medium containing increasing concentrations of specific PI3K compounds along with the appropriate controls (DMSO only at 0.5% final concentration as a negative control and staurosporine at 10 µM as a positive control). Cells were incubated in the presence of drugs for 72 h followed by addition of an equal volume CellTiter-Glo reagent (Promega, Madison, WI) according to the manufacturer’s protocol. Plates were rocked on a rotator for 2 min, and total luminescence was measured 10 min later on a BioTek Synergy 2 plate reader (BioTek, Winooski, VT). Readings were converted to percentage inhibition relative to the DMSO-only control, dose-response (DR) curves were constructed, and IC50 values were calculated using a four-parameter logistic model curve fit built into the GraphPad Prism software package. Each point on the curves represents the mean value of readings from eight wells.
Assessment of PI3K Pathway by WB and Luminex Bead Assays
Whole-cell extracts of untreated and treated NB cell lines (SK-N-AS, SK-N-FI, IMR-32, and NB5) were prepared by lysis on ice using the following buffer: 10 mM Tris-HCl (pH 7.5), 100 mM NaCl, 1 mM EDTA, 1 mM EGTA, 1% (v/v) Triton X-100, 0.5% (w/v) sodium deoxycholate, 0.1% (w/v) sodium dodecyl sulfate, and 10% (v/v) glycerol. Immediately before use, one protease inhibitor cocktail tablet (Roche, Indianapolis, IN) and one PhosSTOP tablet (Roche) were added per 10 mL of buffer, and phenylmethanesulfonyl fluoride was added to 1 mM final concentration. Total protein (40 µg) was electrophoresed at 160 V for 65 min (PowerPac 200; Bio-Rad, Hercules, CA) on 10% sodium dodecyl sulfate–polyacrylamide gels followed by transfer to nitrocellulose membranes (Li-Cor Biosciences, Lincoln, NE) in a Mini Trans-Blot cell (Bio-Rad) at 80 mA for 60 min. Nonspecific binding was blocked with Tris-buffered saline containing 5% (w/v) dry milk for 1 h at room temperature. Blots were then incubated overnight at 4 °C with primary antibodies (Cell Signaling Technology, Danvers, MA) specific for AKT, glycogen synthase kinase-3β (GSK-3β), p70S6K, and PRAS40 (both total protein and phosphorylation site–specific forms). All primary antibodies were used at conditions recommended by the manufacturer. Glyceraldehyde-3-phosphate dehydrogenase (GAPDH) was used as an internal loading control. The membranes were washed and incubated with secondary antibodies coupled to IRDye 680LT or IRDye 800 (Li-Cor Biosciences). Immunoreactive proteins were visualized and signal intensity was quantified using Odyssey Infrared Imaging System (Li-Cor Biosciences).
Luminex xMAP assays were performed on a Bio-Plex 200 instrument (Bio-Rad). Analyte-specific bead kits and required reagents were obtained from Invitrogen (Carlsbad, CA) or EMD Millipore (Darmstadt, Germany), and assays were performed as recommended by the manufacturer. Single-analyte kits (AKT[pS473], PRAS40[pT246], p70S6K[pT389], and GSK-3β[pS9]; total protein or phosphorylation site–specific forms) were used. All kits used were obtained from Invitrogen with the exception of p70S6K[pT389], which was obtained from EMD Millipore. In preliminary tests, we determined that 10 µg of protein was the optimum input amount per assay to be able to detect low amounts of the protein of interest and stay below signal saturation. The data output gives the mean fluorescence intensity (mFI) as a measure of protein abundance. We calculated the ratio of phosphoprotein mFI to total protein mFI as a measure of PI3K pathway activity.
To demonstrate the equivalency of WB and Luminex xMAP data, a Pearson correlation calculation was performed with the aid of a function built into the GraphPad Prism software package.
Results
Baseline Level of PI3K Pathway Activation in NB Cell Lines
Extracts from nine NB cell lines were tested for the presence and activation of key components of the PI3K pathway with WB. Figure 1A shows the results of probing with antibodies specific for the survival kinase AKT, 14 the fully activated form of AKT phosphorylated at serine 473 (pS473-AKT), and GAPDH, which was used as an internal normalization standard. Although all cell lines contained significant levels of total AKT protein, the level of AKT activation as measured by phosphorylation at serine 473 varied significantly among the NB cell lines. We quantified the signal intensity for total AKT and pS473-AKT and adjusted that intensity to the strength of the GAPDH signal. The adjusted signals for total protein were then normalized to the highest signal and plotted to get the relative total AKT protein level for all nine cell lines ( Fig. 1B ). The adjusted signals for the phosphorylated protein were then divided by the corresponding total protein signal for each cell line to obtain a measure of phosphorylation. The ratios were also normalized to the highest ratio and plotted to obtain the relative level of AKT phosphorylation for all cell lines ( Fig. 1C ). The same experiments and analyses were also completed for the mTORC1 regulator and AKT target PRAS40 15 and the regulatory kinases GSK-3β, 16 also an AKT target, and for p70S6K, 17 a target of mTORC1 and indicator of mTORC1 activity. 18
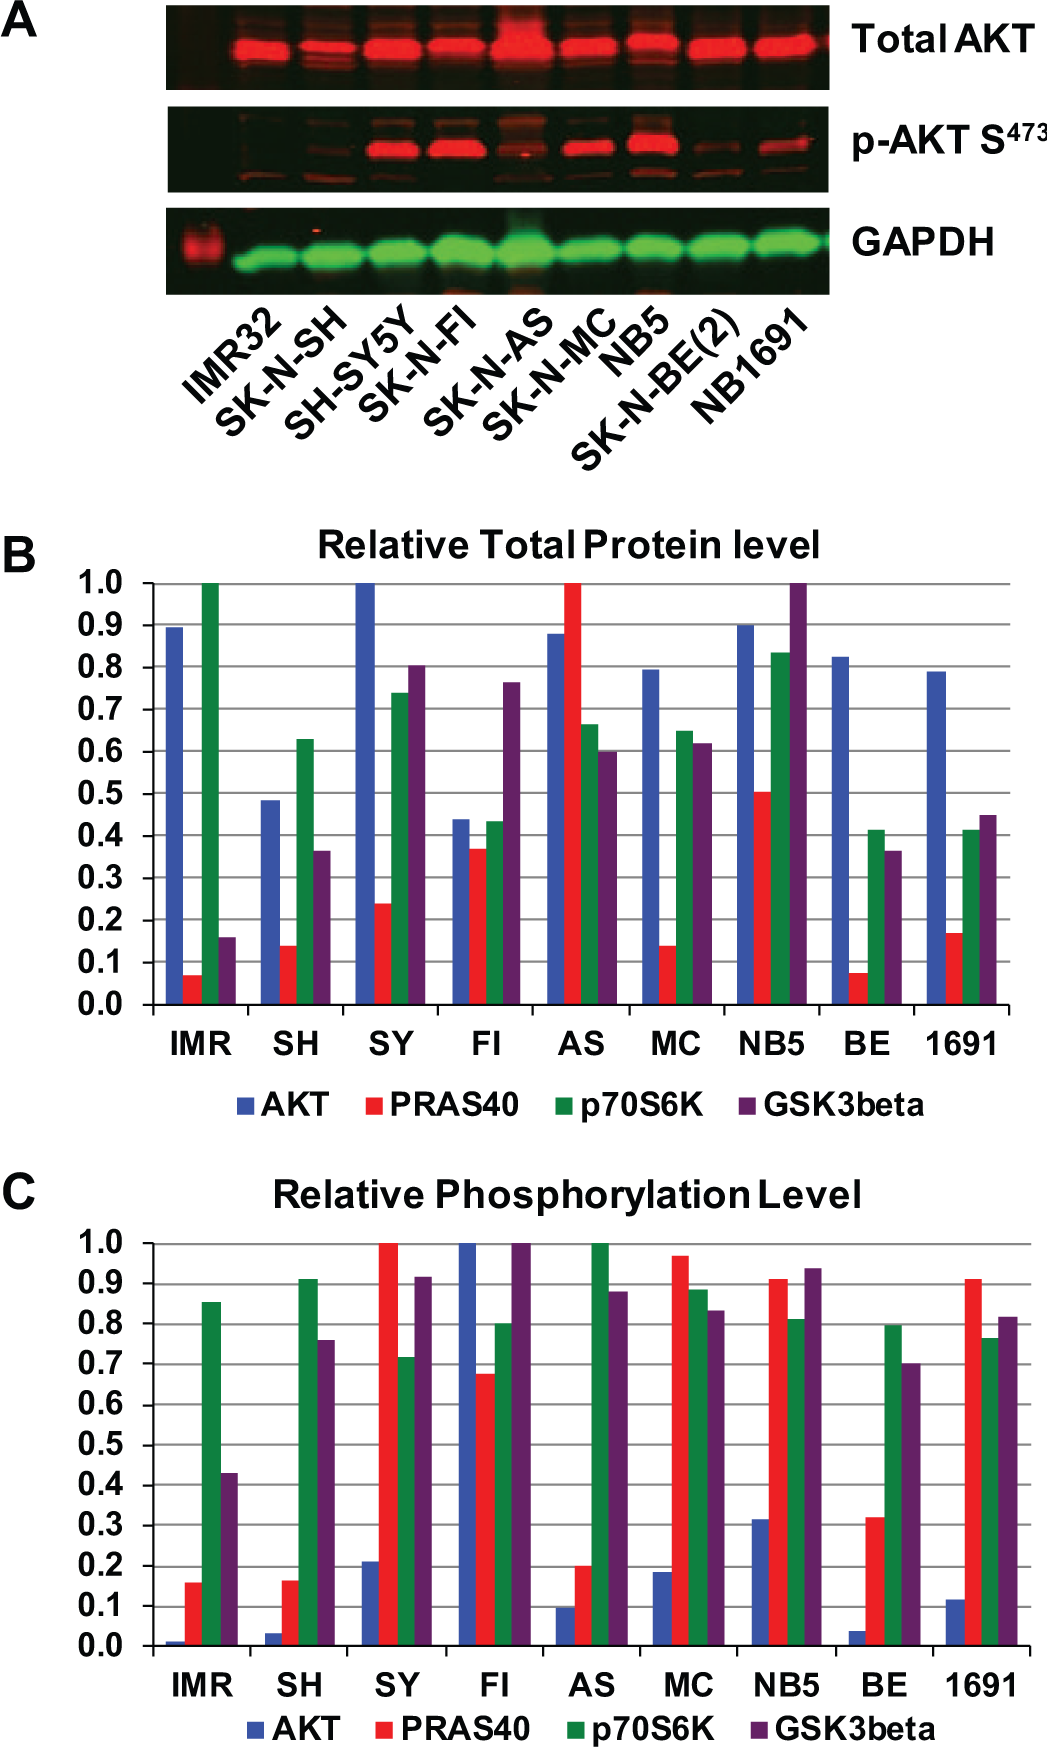
AKT pathway activation in neuroblastoma (NB) cell lines. (
As shown in Figure 1B , the levels of total AKT and p70S6K protein varied up to approximately twofold among the cell lines. In contrast, GSK-3β levels vary 8-fold, and those of PRAS40 vary more than 10-fold. A distinct theme emerged when examining the relative phosphorylation levels ( Fig. 1C ). Phosphorylation of p70S6K and GSK-3β showed relatively minor variations (up to twofold), whereas the phosphorylation levels of PRAS 40 varied about eightfold. The most dramatic phosphorylation fluctuation was exhibited by AKT, with a robust 50-fold difference between IMR32 and SK-N-FI.
DRs of NB Cell Lines to Inhibitors Targeting the PI3K Pathway
To identify NB cell lines that are either sensitive or resistant to PI3K pathway inhibitors, DR curves for single agents (OSI, BEZ, BKM, and everolimus) were established using the panel of nine NB cell lines. The IC50 values obtained from these experiments are listed in
Table 1
. From this test cohort, we selected four representative cell lines that biochemically reflected the high and low end of the spectrum of both DR to the drugs used and activation levels of key PI3K components. The DR curves for the four cell lines selected are shown in
Cytotoxicity of PI3K pathway inhibitors to NB cell lines.
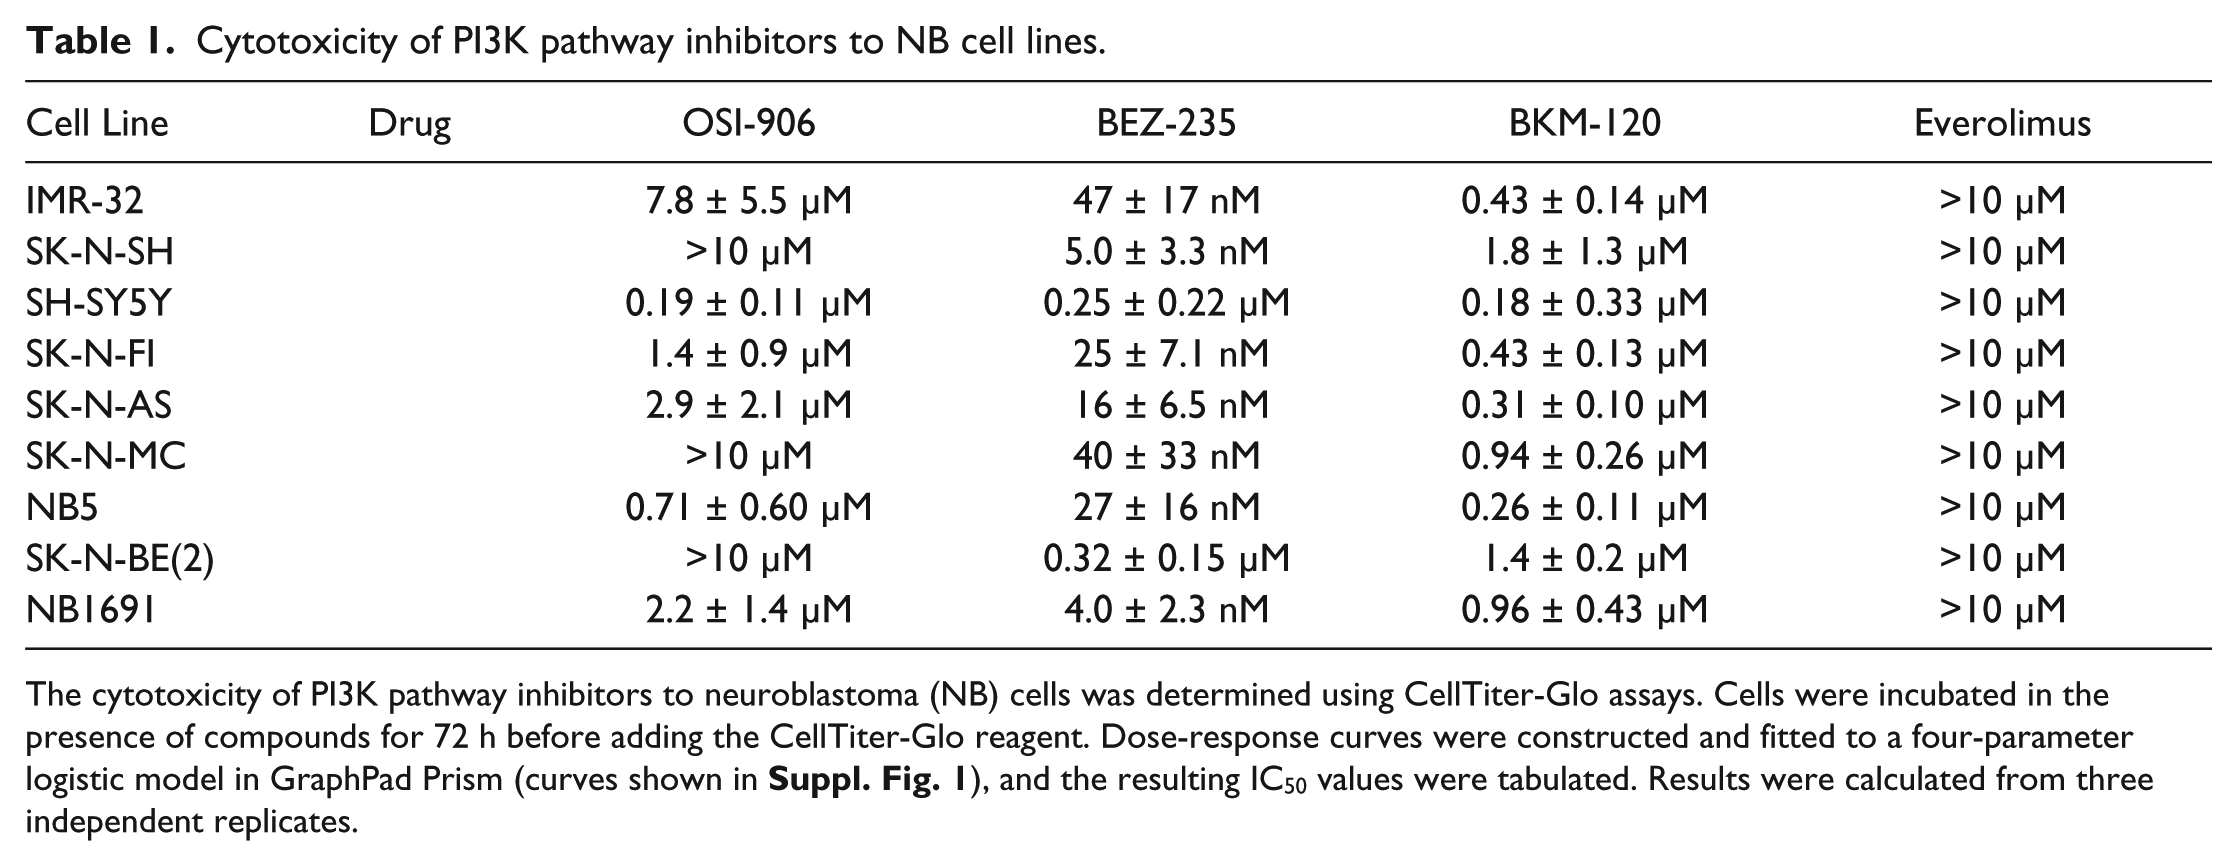
The cytotoxicity of PI3K pathway inhibitors to neuroblastoma (NB) cells was determined using CellTiter-Glo assays. Cells were incubated in the presence of compounds for 72 h before adding the CellTiter-Glo reagent. Dose-response curves were constructed and fitted to a four-parameter logistic model in GraphPad Prism (curves shown in
All NB cell lines were particularly sensitive to the dual PI3K/mTOR inhibitor BEZ, with IC50 values ranging from 4 nM (1691) to 260 nM (SK-N-BE(2);
Table 1
). They were less sensitive to the broad-spectrum PI3K inhibitor BKM, with IC50 values ranging from 0.18 µM (SH-SY5Y) to 1.8 µM (SK-N-SH). NB5, SK-N-AS, and SK-N-FI were sensitive to the IGF-1R inhibitor OSI, whereas IMR-32 was relatively insensitive to it (
Table 1
). All NB cell lines were insensitive to everolimus, judging solely by the IC50 values (
Table 1
). However, examination of the DR curves showed that all NB cell lines were sensitive to everolimus over a wide range of concentrations. All lines exhibit a reduction in growth to 60% to 70% control, with the drug becoming cytotoxic only at concentrations greater than 10 µM (
Changes in Phosphorylation Levels of PI3K Pathway Effectors in NB Cells upon Drug Application
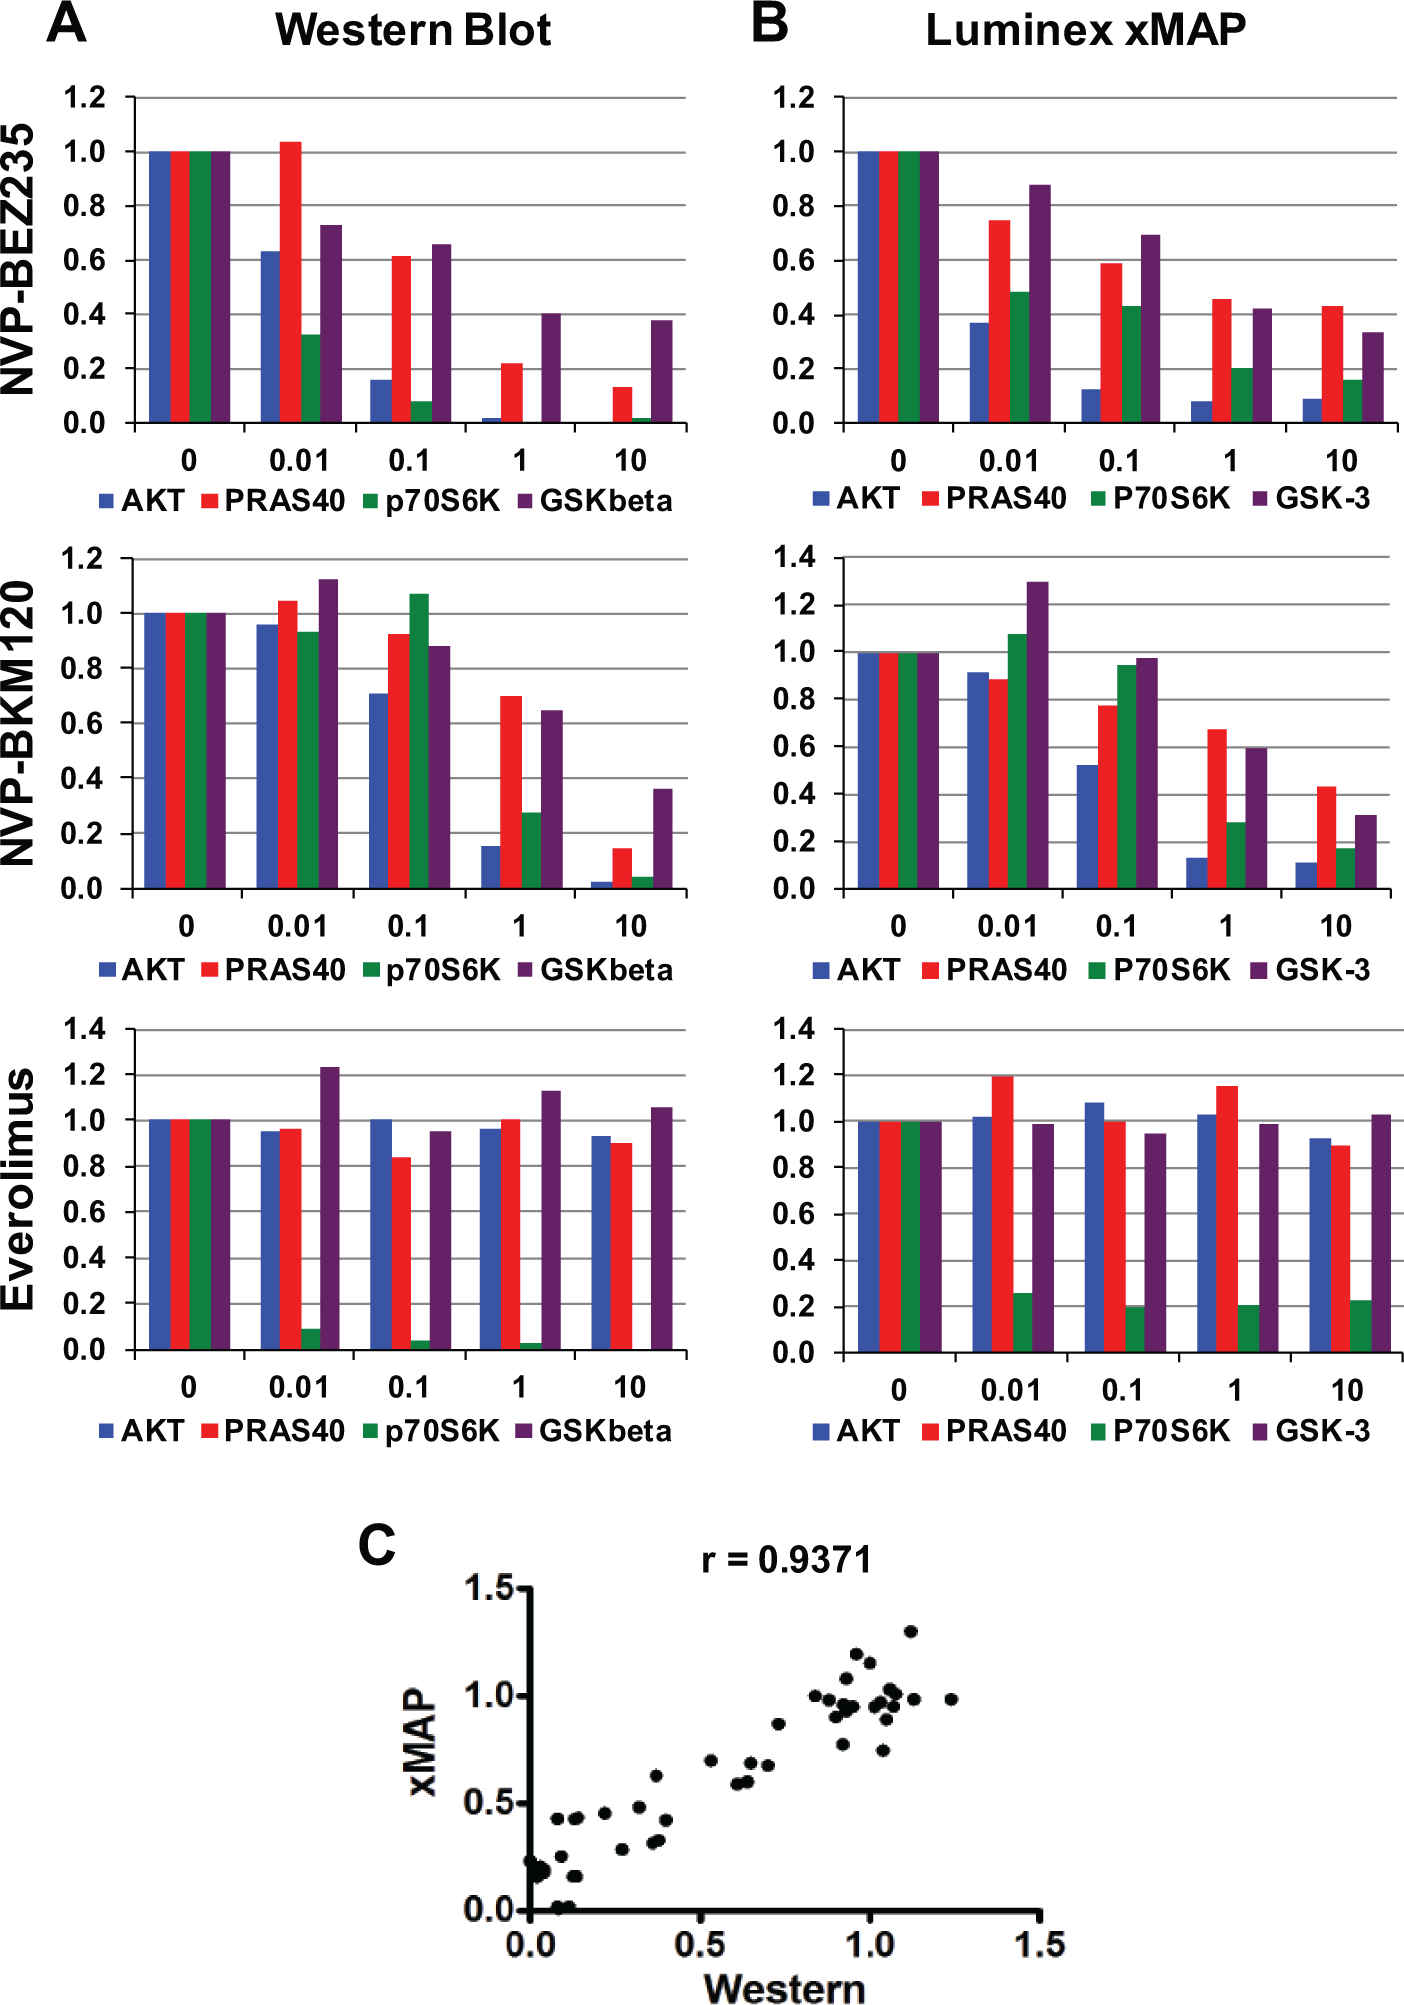
The alteration of phosphorylation levels of key PI3K components was next evaluated in response to treatment with the PI3K/mTOR dual inhibitor BEZ. We treated NB5 cells with increasing drug doses from 0.01 µM to 10 µM for 4 h and analyzed the changes in the levels of phosphorylation of AKT, PRAS40, p70S6K, and GSK-3β by WB. Results are shown in
Dose response of NB5 to PI3K pathway inhibitors. (
Whereas the signals for the level of the total protein in cell extracts remained unchanged, the phosphorylation level decreased with increasing drug concentrations for all four proteins. AKT phosphorylation at serine 473 decreased most dramatically and was nearly undetectable at higher concentrations. A decreased phosphorylation pattern was to be expected, because BEZ inhibits mTOR kinase and serine 473 is phosphorylated by the mTOR kinase complex mTORC2. 18 Similarly, a decline in p70S6K phosphorylation, which is a target of the mTOR kinase complex mTORC-1, 18 was also observed when cells were treated with BEZ.
Both PRAS40 and GSK-3β are targets of regulation by AKT, 14 and, as expected, reduction of both phosphoproteins was observed upon treatment with increasing BEZ concentrations. Phosphorylation of Ser473 is required for full AKT activation; therefore, a lack phosphorylation results in less active AKT and a subsequent decline in phosphoproteins that are direct AKT substrates. PRAS40 phosphorylation was more affected than GSK-3β phosphorylation, probably because, unlike PRAS40, GSK-3β can also be targeted by other cellular kinases.
Given that WB procedures are laborious and time-consuming and that our experimental outline required the processing and testing of a large number of samples, we validated the use of the Luminex xMAP assay using a BioPlex-200 Suspension array system from Bio-Rad with the same samples used in Figure 2A . The Luminex xMAP assay is a microplate-based multiplex immunoassay system that can simultaneously quantify multiple analytes in a single sample, combining aspects of ELISA, immunoprecipitation, and flow cytometry. The assay uses spectrally coded beads coupled with antibodies for capture of specific target proteins. Fluorescent tags conjugated to detection antibodies for the same targets are added in a second step. The fluorescence intensity readout measures the abundance of those targets. We measured the abundance of total and phosphorylated proteins with Luminex xMAP assays and processed the results in the same manner as described for Figure 2B above. Those results are shown in Figure 2B (top panel). Next, NB5 cells were treated with the PI3K inhibitor BKM ( Fig. 2A , B , middle panels) and the mTORC1 inhibitor everolimus ( Fig. 2 , bottom panels). As with BEZ, we observed a decrease in phosphorylation levels with increasing concentrations of BKM. Higher concentrations of BKM were required to produce similar levels of inhibition, correlating well with the higher IC50 value for BKM. As expected, treatment of the cells with the mTORC1 inhibitor everolimus inhibited only p70S6K phosphorylation, leaving AKT, PRAS40, and GSK-3β phosphorylation unchanged ( Fig. 2A , B , bottom panels).
We then tabulated the values for the phosphorylation levels obtained by WB versus those obtained with xMAP and performed a correlation analysis. The resulting plot is shown in Figure 2C . A Pearson correlation calculation gave us a correlation coefficient of 0.9371 with a two-tailed p value of <0.0001. Overall, the WB data correlate very well with the xMAP data. Although both methods give a decrease in both p70S6K and PRAS40 phosphorylation levels, the apparent decrease seen by WB is higher than that observed by xMAP assays. This may reflect a much higher signal-to-noise ratio for xMAP assays than for WB. The WB signals for the phosphorylated form of p70S6K and PRAS40 were very low and barely above background, whereas the signals obtained by xMAP were much stronger, which may very well explain the apparent discrepancy in the magnitude of the decrease in signal. Based on these observations, Luminex xMAP multiplex assays were used for the following DR studies.
DR Studies Using PI3K Cascade Inhibitors in NB Cell Lines
The NB cell lines NB5, SK-N-FI, SK-N-AS, and IMR32 were exposed to increasing doses of single agents (BEZ, BKM, OSI, and everolimus) at 0.01, 0.1, 1, and 10 µM concentrations, and the levels of AKT, PRAS40, p70S6K, and GSK-3β, both phosphorylated and total protein, were measured by xMAP 2, 4, 8, and 24 h after drug treatment. We calculated the ratio of the signal intensity of phosphorylated protein to total protein and normalized all values to the 2 h, 0.01 µM value to obtain a measure of change in the level of protein phosphorylation in response to an increase in drug concentration and time of exposure. The results for the treatment of NB5 with all four compounds are shown in Figure 3 .
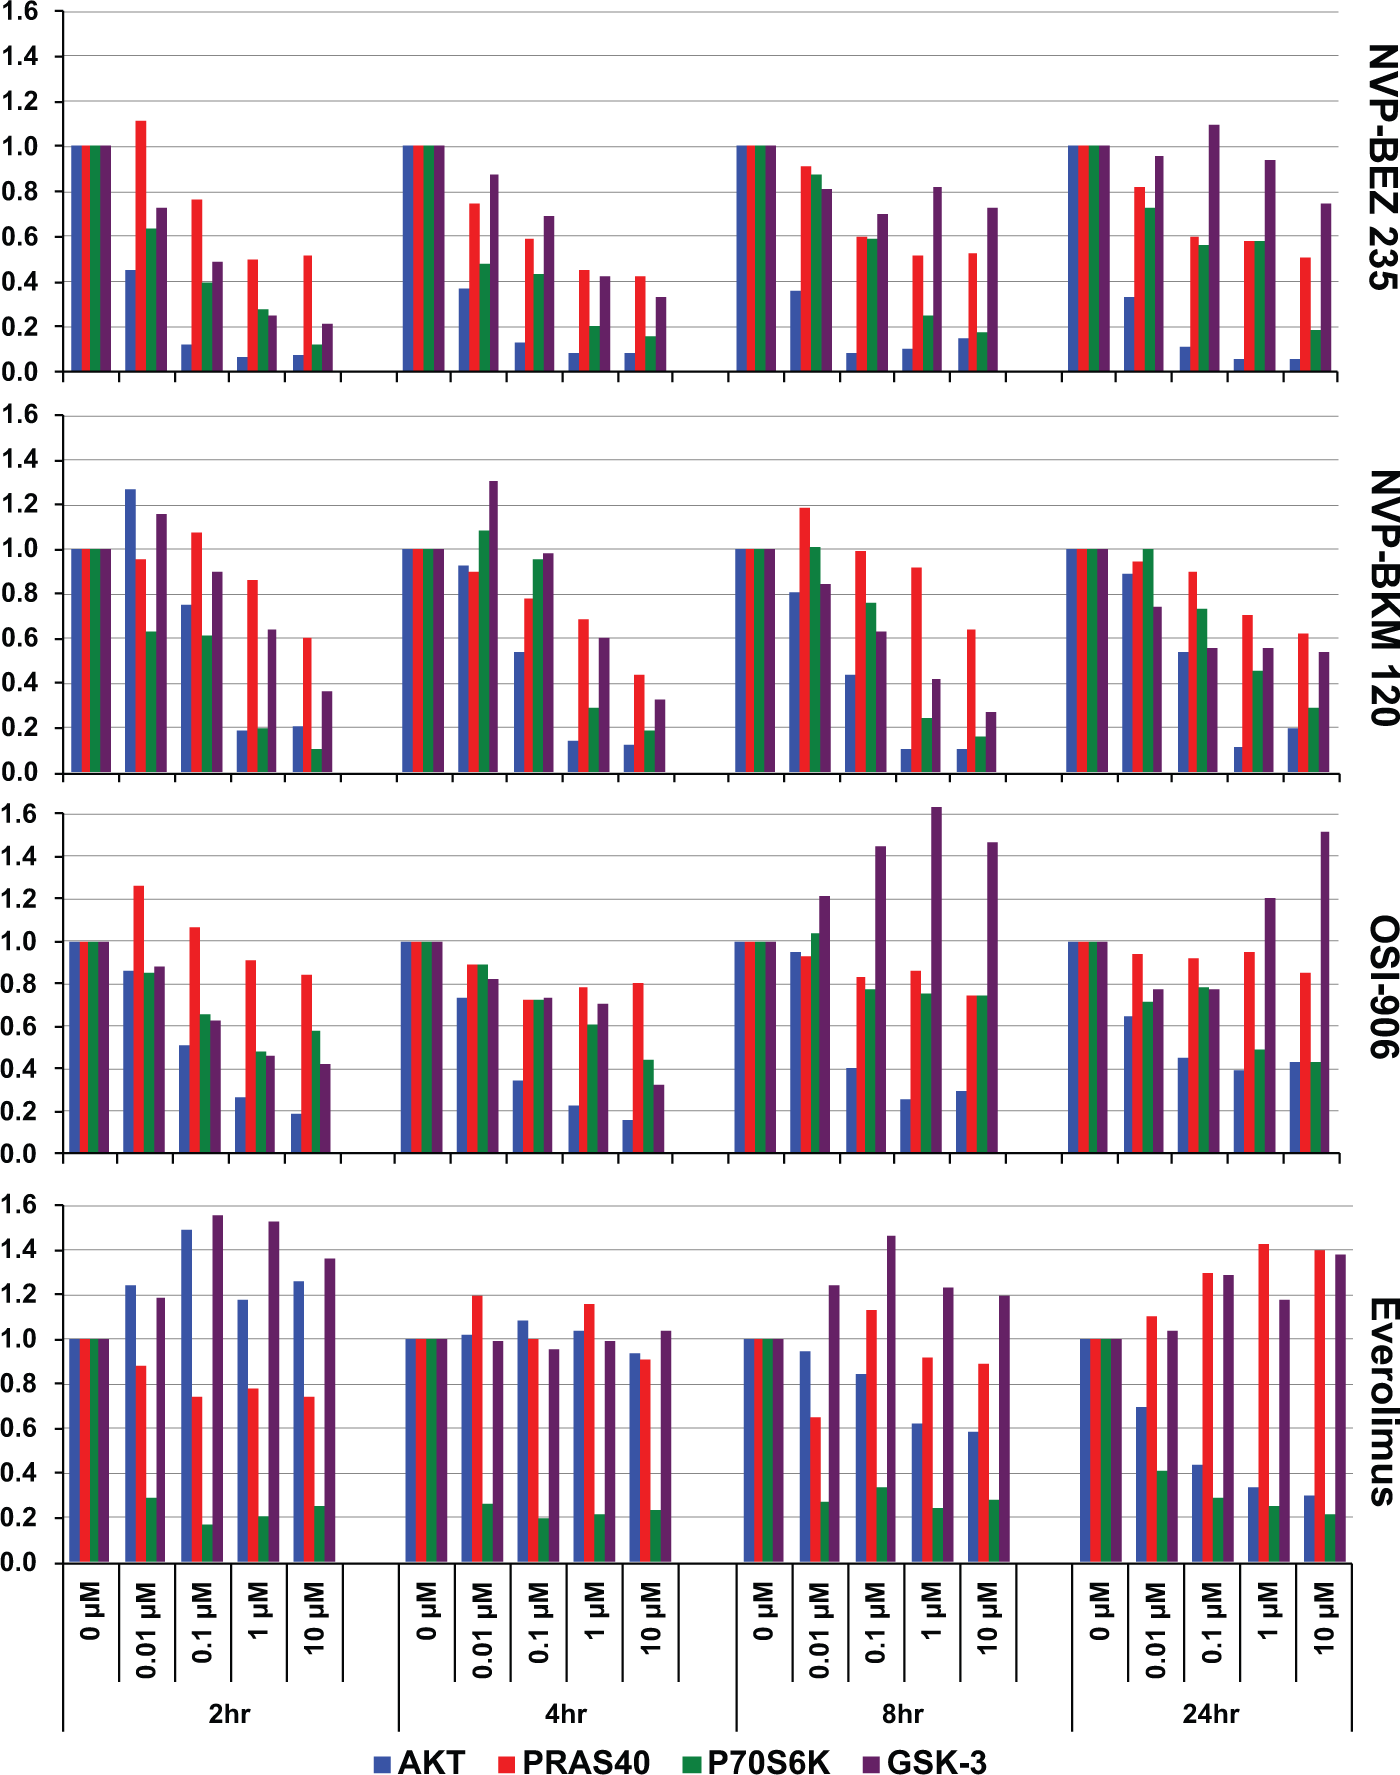
Pharmacodynamics of NB cell line NB5 exposed to PI3K pathway inhibitors. NB5 cells were treated with increasing doses of NVP-BEZ235, NVP-BKM120, OSI-906, and everolimus at 0.01, 0.1, 1, and 10 µM final concentrations. After 2, 4, 8, and 24 h of exposure to the inhibitors, cells were harvested and cell extracts prepared. The abundance of total and phosphorylated protein for AKT (blue bars), PRAS40 (red bars), p70S6K (green bars), and GSK-3β (purple bars) in those extracts was measured by xMAP assay, and ratios of phosphorylated protein to total protein were calculated and normalized to the solvent-only control for each analyte at each time point.
The level of pS473-AKT ( Fig. 3 , blue bars) was affected the most by increasing doses of BEZ. At a 0.1 µM concentration of the inhibitor, a 90% loss of phosphorylation was observed and showed clear dose dependence. This effect was immediate and did not change much from 2 to 24 h. AKT serine 473 was phosphorylated by mTORC2, 18 and the decrease in phosphorylation was likely a reflection of the inhibition of the mTOR kinase by BEZ. Inhibition of the second mTOR kinase containing complex mTORC1 by BEZ was apparent due to loss of phosphorylation at threonine 389 of p70S6K, a direct mTORC1 target ( Fig. 3 , green bars). The level of phospho-PRAS40 ( Fig. 3 , red bars) also decreased with increasing drug concentration. PRAS40 is a direct substrate of AKT, 15 and therefore a decrease in cellular AKT phosphorylation (and its kinase activity) should result in the observed decrease of PRAS40 phosphorylation as expected. GSK-3β is also an AKT substrate and, as expected, we observed a decrease in its phosphorylation at the 2 and 4 h time points ( Fig. 3 , purple bars). However, at later time points, the GSK-3β phosphorylation levels rebounded. Because GSK-3β serine-9 can also be phosphorylated by cellular kinases other than AKT (e.g., p90RSK), the rebound in GSK-3β phosphorylation levels may reflect this activity.
A similar pattern emerged from treatment of NB5 with the PI3K inhibitor BKM ( Fig. 3 , second panel from top). Higher concentrations of BKM were needed to achieve a similar decrease in phosphorylation of all four proteins tested, not surprising considering the higher IC50 value of this compound. With the exception of AKT, phosphorylation levels recovered slightly at the 24 h time point. Unlike what was observed for treatment with BEZ, GSK-3β phosphorylation levels did not recover as much at the 8 and 24 h time points when cells were treated with BKM, suggesting other pathways targeting serine-9 of GSK-3β are also inhibited by BKM.
Likewise, it would be expected that the IGF-1R inhibitor OSI would inhibit the PI3K pathway as well ( Fig. 3 , third panel from top). However, only AKT phosphorylation at Ser473 was strongly suppressed initially (by more than 80%). Although both p70S6K and GSK-3β were reduced by as much as 60%, PRAS40 phosphorylation was practically not affected at the measurement time points. Although reduced initially at 2 h, the abundance of GSK-3β phosphoprotein recovered at 4 h and increased at 8 and 24 h, perhaps due to secondary activation of a compensating pathway.
The mTORC1 inhibitor everolimus strongly reduced p70S6K phosphorylation, as would be expected, at all concentrations ( Fig. 3 , bottom panel). This effect was immediate and persisted at all time points. Aside from diminutive fluctuations, little effect on the phosphorylation levels of PRAS40 and GSK-3β was seen. AKT phosphorylation was not affected initially but decreased in a dose-dependent manner at 8 h, and the nadir was at 24 h.
Next, we treated the NB cell line SK-N-FI with the four PI3K antagonists. The results are shown in
A distinctively different and unpredictable phosphoprotein pattern emerged when SK-N-AS and IMR32 were subjected to anti-PI3K treatment. Both cell lines showed attenuated basal levels of activated AKT expression, and although the phospho-AKT signal was well above background in SK-N-AS cells, it was barely detectable by WB (
Fig. 1
) or xMAP in IMR32 cells. For these reasons, phospho-AKT levels in IMR32 are not displayed in
Additive Effects Using Combinations of PI3K Pathway Inhibitors
The additive effects of dual combinations of the four drugs on NB5 cell growth were evaluated. Based on our IC50 results shown in
Synergistic effects of PI3K/mTOR pathway inhibitors.
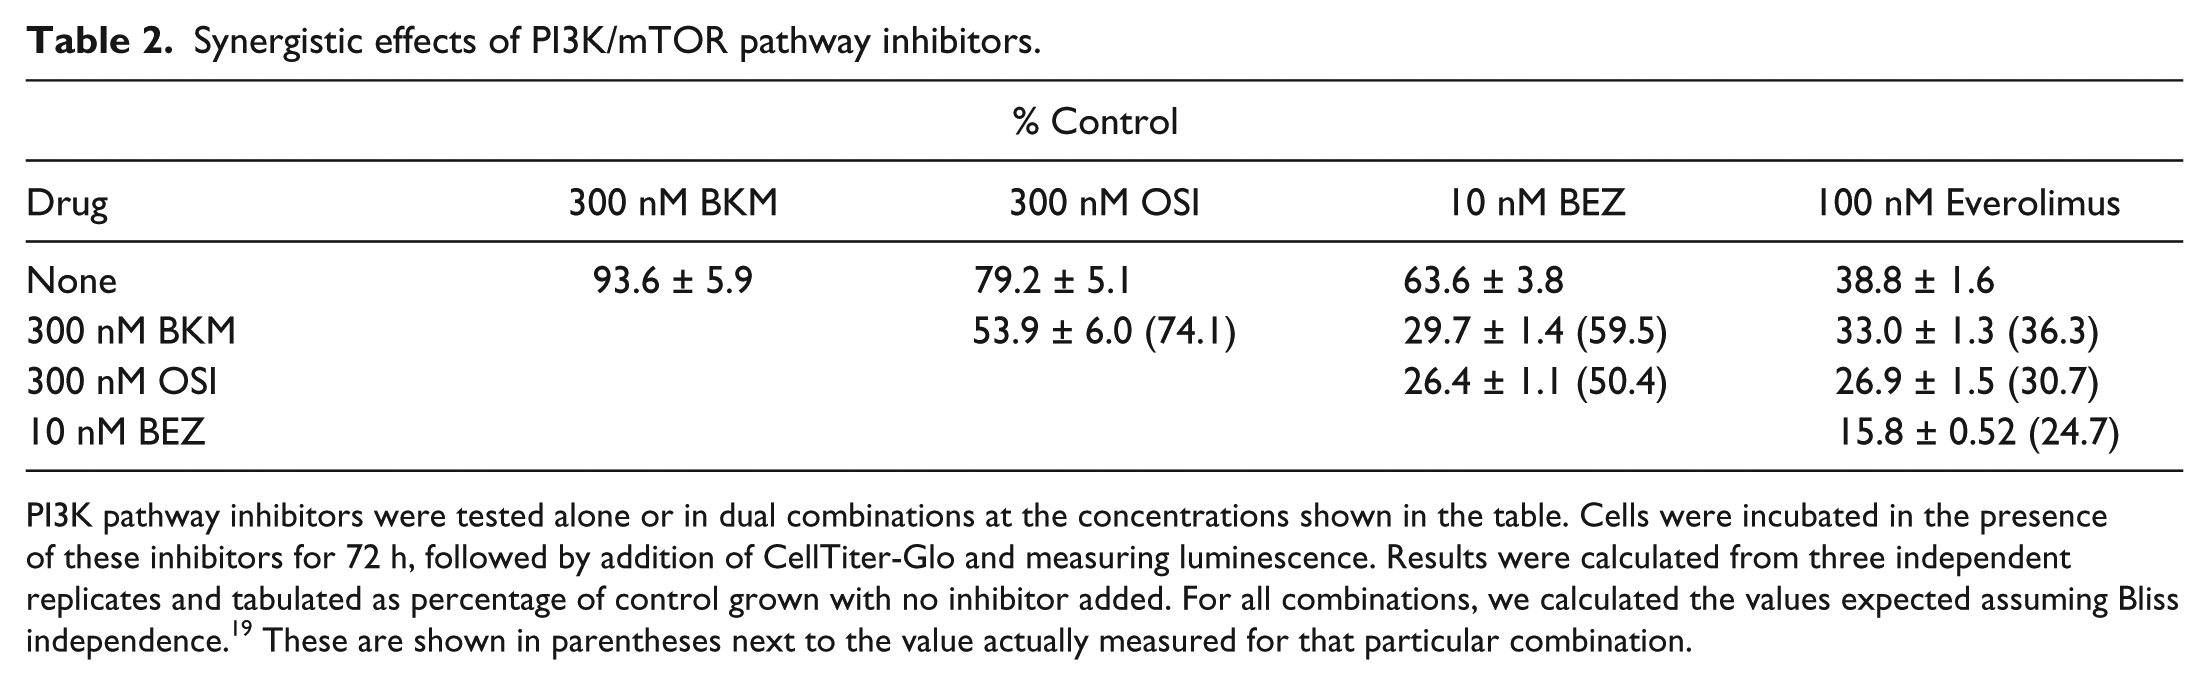
PI3K pathway inhibitors were tested alone or in dual combinations at the concentrations shown in the table. Cells were incubated in the presence of these inhibitors for 72 h, followed by addition of CellTiter-Glo and measuring luminescence. Results were calculated from three independent replicates and tabulated as percentage of control grown with no inhibitor added. For all combinations, we calculated the values expected assuming Bliss independence. 19 These are shown in parentheses next to the value actually measured for that particular combination.
Comparative Phosphoproteomic Profiles of NB5 Cells Treated with PI3K Antagonist Combinations
NB5 cells were treated with double and triple combinations of all four drugs at the same concentrations used in Table 2 for 4 and 24 h. Quantitative information on NB5 PI3K phosphoprotein profiles in response to combinatorial PI3K blockade is shown in Figure 4 . At 4 h, AKT phosphorylation was the most sensitive to treatment with three of the four PI3K inhibitors, with no response to everolimus. This is in agreement with the results shown in Figure 3 . Further blockage of AKT phosphorylation was achieved by combining anti-PI3K drugs with the exception of everolimus. The most effective combination at reducing AKT phosphorylation was BKM and OSI (>95%). This confirmed the results we obtained measuring the cytotoxicity of these combinations ( Table 2 ). Phosphorylation of PRAS40 largely followed the pattern for AKT and decreased by up to 80%. GSK-3β phosphorylation was reduced by only up to 50%, even when using inhibitor combinations, suggesting other PI3K-independent pathways are involved in its regulation. After 24 h, AKT phosphorylation remained suppressed; however, the phosphorylation levels of the other three analytes had rebounded or even increased slightly. This was certainly the case for PRAS40 and to a lesser extent for p70S6K, whose phosphorylation levels increased twofold over the levels at the 4 h time point.
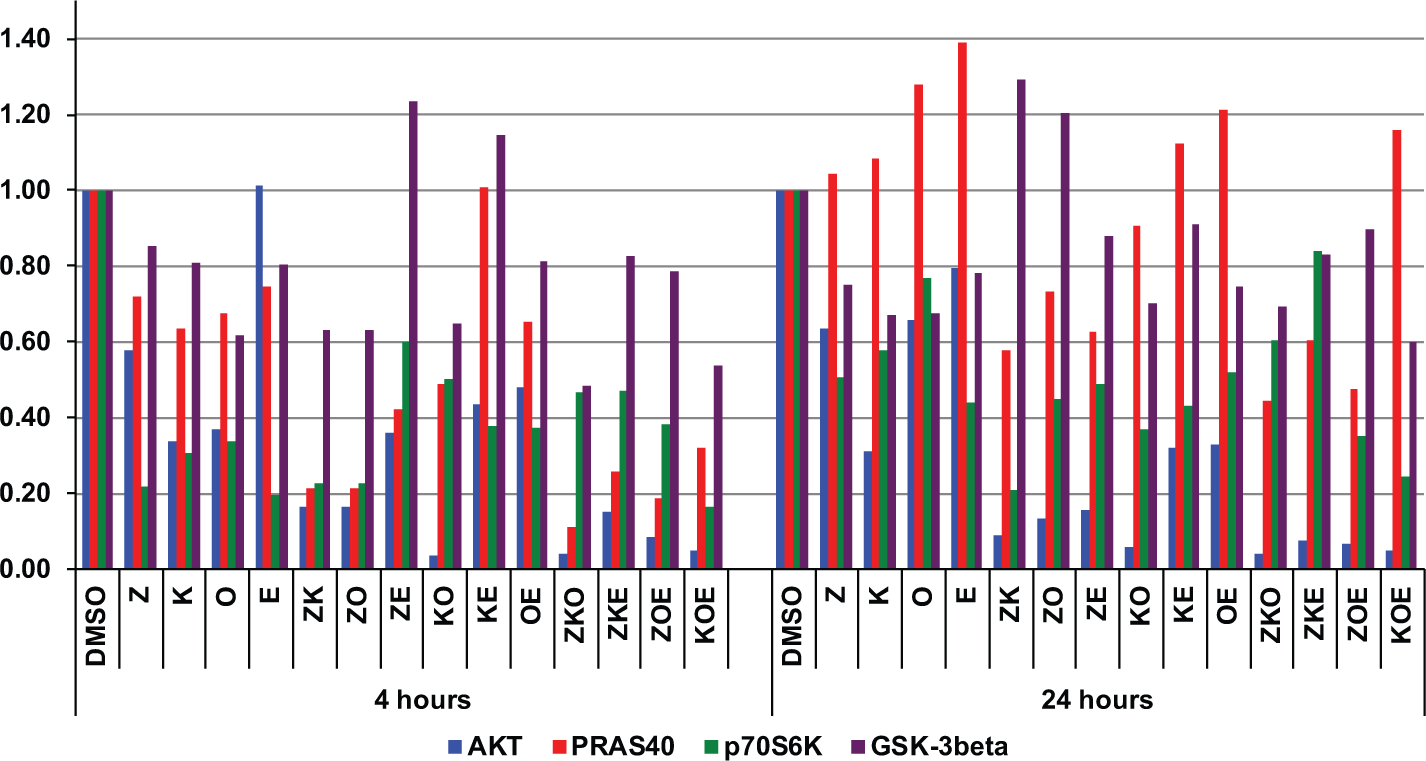
Comparative phosphoproteomic profiles of NB5 cells treated with PI3K antagonist combinations. NB5 cells were incubated with NVP-BEZ235, NVP-BKM120, OSI-906, and everolimus alone or in double and triple combinations at concentrations below the IC50 value for each drug. The following concentrations were used: 10 nM NVP-BEZ235 (Z), 300 nM NVP-BKM120 (K), 300 nM OSI-906 (O), and 10 nM everolimus (E). Extracts were prepared 4 or 24 h after compound addition to the growth medium. The abundance of total and phosphorylated protein for AKT (blue bars), PRAS40 (red bars), p70S6K (green bars), and GSK-3β (purple bars) in each sample was measured by xMAP assay, and ratios of phosphorylated protein to total protein were calculated and normalized to the solvent-only control for each analyte at both time points.
Discussion
The PI3K pathway is now understood in reasonable detail, and a current translational anticancer strategy includes small-molecule antagonists to block signal propagation in tumors. Although the pathway appears to be deceptively simple at its core, there are a number of nodal proteins that, in various ways, affect PI3K signaling. Because of the diverse nodal components regulating PI3K signaling, a number of challenges using these targeted inhibitors include identifying the most optimal component(s) for pharmaceutical intervention, targeting the specific PI3K molecular profiles for focused therapy on patients, and developing assays to monitor pathway modulation in response to the effects of inhibitors.
In recent years, it has become increasingly apparent that the PI3K signaling may be an attractive treatment option for high-risk NB. 20 One goal of this study was to identify candidate biomarkers to predict and monitor response to treatment with PI3K pathway inhibitors in NB. The survival kinase AKT 14 and the mTORC1 regulator and AKT target PRAS40 15 were suitable candidates, since both proteins are activated in NB. 20 We also analyzed the regulatory kinases GSK-3β, 16 also an AKT target, and p70S6K, 17 a target of mTORC1 and indicator of mTORC1 activity, 18 for their constitutive phosphorylation or activation status in a panel of nine NB cell lines.
Based on the results shown in Figure 1 , we stratified the nine cell lines into two groups: high PI3K activity (SK-N-FI, SH-SY5Y, SK-N-MC, and NB5) and low PI3K activity (IMR32, SK-N-SH, SK-N-AS, 1691, and SK-N-BE2(C)). Our cohort was further refined into four NB cell lines after testing the cytotoxic effects of OSI, BEZ, BKM, and everolimus. We selected two high PI3K activity (SK-N-FI and NB5) and two low PI3K activity (IMR-32 and SK-N-AS) cell lines for further testing. The highest cytotoxic potential against all NB cell lines was achieved by BEZ, whereas the drug with the weakest potency as measured by the IC50 was everolimus. Both OSI and BKM had intermediate sensitivities. These findings are in agreement with previous studies showing that dual inhibitors of PI3K and mTOR more efficiently inhibit the PI3K pathway than mTOR or PI3K inhibitors alone and therefore result in higher cytotoxicity. 21
A second objective of this study was to evaluate the Luminex xMAP technology for monitoring responses of PI3K pathway components to small-molecule inhibitors. Multiplex bead-based assays have been used for testing a broad spectrum of cytokine levels in serum, plasma, and cell culture supernatants.21–23 xMAP technology has now been expanded to test intracellular signaling proteins and can potentially provide the capability of monitoring up to 100 different components at a time, potentially allowing monitoring of the activation status of multiple signaling pathways in a single sample. The efficiency along with the ability to test many different samples in a 96-well plate format would make it a superior alternative to the traditional WBs, which are laborious, time-consuming, and require considerably more sample for testing. The utility of xMAP technology translates into a simultaneous, rapid, sensitive, and specific intracellular protein detection system for high-throughput analysis.
Given the broad spectrum of activity to the inhibitors in the selected NB cell cohort, we next assessed the phosphorylation levels of AKT, PRAS40, p70S6K, and GSK-3b as a measure of PI3K activation status. Testing was initially performed in NB5 using both WB and the Luminex xMAP (
Fig. 2A
;
Active PI3K together with mTORC2 phosphorylates and activates AKT, which in turn phosphorylates GSK-3b and PRAS40. Phosphorylated PRAS40 dissociates from mTORC1, allowing for activation and phosphorylation of p70S6K. Inhibition of PI3K by BEZ, BKM, and OSI is expected to decrease phosphorylation of AKT, PRAS40, GSK-3b, and p70S6K, whereas mTORC1 inhibition by everolimus decreases only p70S6K phosphorylation. 24
In summary, the NB PI3K pathway responds to targeted treatment largely as expected across the four cell lines. The potency of PI3K inhibition is most pronounced in the high PI3K activity lines (NB5 and SK-N-FI) and least effective in the low PI3K activity lines (SK-N-AS and IMR32). The low basal state likely contributes to the unpredictable pattern of downstream substrate modulation when treated with PI3K antagonists and further suggests that attenuated basal PI3K activity may be less sensitive to targeted pathway modulation compared with cells expressing higher levels. All four cell lines respond to everolimus treatment. There are notable exceptions: one is the reduction in p70S6K phosphorylation upon treatment of SK-N-AS with BKM; because neither AKT nor PRAS40 phosphorylation changes, mTORC1 activity should not be affected. We speculate that PI3K controls mTORC1 by a different pathway not involving the route through AKT in SK-N-AS. The second exception is loss of GSK-3b phosphorylation upon everolimus treatment in IMR32. At the 8 and 24 h time intervals, the GSK-3b phosphorylation rebounds in the high PI3K activity lines. This presumably may represent a cellular stress response induced by the inhibitor treatment, which may activate MAP kinase or WNT pathways; the latter is known to regulate GSK-3b.20,25 Conversely, chronic exposure to everolimus attenuates AKT expression; the mechanism underlying the modulation is unknown.
These observations have important implications for clinical applications. NB tumors with low PI3K activation may not be acceptable candidates for treatment with PI3K inhibitors, whereas NB tumors with high PI3K activation may predict responders to targeted PI3K treatment. The rebound of GSK-3b phosphorylation may indicate the existence of escape mechanisms and adaptive responses that render inhibitors less effective during long-term treatment, allowing a significant fraction of tumor cells to survive and possibly lead to drug resistance, hence supporting the theme of combinatorial treatment and multitarget inhibition at several nodes within the PI3K cascade. 26
We provide preliminary evidence for co-treatment PI3K inhibition and show additive cascade inhibition of NB5 cell proliferation to the dual combinations of OSI/BKM, BEZ/BKM, BEZ/OSI, and BEZ/everolimus ( Fig. 4 ). Similar effects for the combination of suboptimal concentrations of combined PI3K and mTOR have been reported for adult solid tumors. 27 Although the mechanism for this additive effect may be the vertical blockade of PI3K signaling, another possibility proposed includes targeting different domains of the same protein to contribute to a synergistic effect. 28 However, with these combinations, we also observe a rebound of activation of PI3K pathway components after 24 h of compound exposure. Despite sustained inhibition of AKT, phosphorylation levels of PRAS40, p70S6K, and GSK-3b rebound at 24 h, providing further evidence of the existence of compensatory mechanisms to bypass PI3K pathway inhibition.
Our results validate Luminex xMAP methodology as a PI3K pathway profiling method to interrogate the response to targeted inhibition in NB. This body of work serves as a foundation for further in vitro and in vivo characterization of these biomarker patterns as predictors of sensitivity or resistance to PI3K inhibitors, as well as provide additional insights into the PI3K pathway and its role in NB pathogenesis. These data further suggest that the xMAP method is a reliable approach for intracellular PI3K antagonist screening and has the promise to emerge as a potential biomarker tool for response prediction to PI3K treatment in advanced-stage NB.
Footnotes
Declaration of Conflicting Interests
The authors declared no potential conflicts of interest with respect to the research, authorship, and/or publication of this article.
Funding
The authors disclosed receipt of the following financial support for the research, authorship, and/or publication of this article: This work was supported by the American Lebanese Syrian Associated Charities (ALSAC) and the St. Jude Cancer Center Core grant.
References
Supplementary Material
Please find the following supplemental material available below.
For Open Access articles published under a Creative Commons License, all supplemental material carries the same license as the article it is associated with.
For non-Open Access articles published, all supplemental material carries a non-exclusive license, and permission requests for re-use of supplemental material or any part of supplemental material shall be sent directly to the copyright owner as specified in the copyright notice associated with the article.