
Abstract
Pilot testing of an assay intended for high-throughput screening (HTS) with small compound sets is a necessary but often time-consuming step in the validation of an assay protocol. When the initial testing concentration is less than optimal, this can involve iterative testing at different concentrations to further evaluate the pilot outcome, which can be even more time-consuming. Quantitative HTS (qHTS) enables flexible and rapid collection of assay performance statistics, hits at different concentrations, and concentration-response curves in a single experiment. Here we describe the qHTS process for pilot testing in which eight-point concentration-response curves are produced using an interplate asymmetric dilution protocol in which the first four concentrations are used to represent the range of typical HTS screening concentrations and the last four concentrations are added for robust curve fitting to determine potency/efficacy values. We also describe how these data can be analyzed to predict the frequency of false-positives, false-negatives, hit rates, and confirmation rates for the HTS process as a function of screening concentration. By taking into account the compound pharmacology, this pilot-testing paradigm enables rapid assessment of the assay performance and choosing the optimal concentration for the large-scale HTS in one experiment.
Keywords
Introduction
Titration-based screening in which large chemical libraries are screened at multiple sample concentrations (known as quantitative high-throughput screening; qHTS) is a paradigm that has been applied to collections as large as 350,000 compounds over seven concentration ranges.1,2 A titration-based archive of compound samples enables capturing common but complex pharmacology such as low-efficacy and bell-shaped concentration-response relationships during the primary screen, which reduces false-positive (FP) and false-negative (FN) rates and provides a robust database to improve the understanding of structure-activity relationships. 1 To afford flexibility in the concentration range, as well as robustness to automation failures, compounds are titrated in an interplate manner to produce copies of the library at multiple concentrations. 2 Implementation of this paradigm greatly reduces the need to cherry-pick a large number of samples for hit confirmation post-HTS, thereby saving compound sample, time, and associated costs. The qHTS format also reduces scheduling of repeats due to plate-handling failures, identifies carryover effects by compounds that can occur from pin tool delivery, and enables characterization of a chemical series based on pharmacologic parameters in one HTS experiment.3–13 However, when dealing with very large compound collections, (e.g., a million compounds), a qHTS approach becomes less practical because of very large reagent and time consumption. Still, if titration-based screening were enabled to be just as fast and cost-effective as the current single-concentration paradigm, this format would be become the obvious choice for HTS.
In this study, we aimed to evaluate the utility of qHTS at the pilot stage of assay testing for large HTS campaigns. Pilot testing of an HTS assay is a necessary step in which the protocol and assay system is applied to small selected library sets to determine the robustness and hit rate of the assay protocol. 14 Traditionally, pilot testing is performed on the automated screening system with a small set of compounds (~10,000) in at least duplicate runs at one concentration to confirm screening logistics, screening feasibility, data quality, and hit rates. The identified hits are then validated in a titration-based format to confirm hits by dose-response analysis. At this point, the confirmation rate (CR), FP rate (FPR), and sometimes FN rate (FNR) are estimated. Oftentimes this becomes an iterative process. For example, if the hit rate is too high, the pilot tests may have to be repeated at lower concentrations. Given that qHTS provides both single-concentration and concentration-response data sets in one experiment, it seems that application of this method to assay pilot testing would greatly facilitate this necessary step in assay optimization and HTS adaptation.
For the purpose of assay pilot testing, we selected an asymmetric titration scheme covering a concentration range of >600-fold using eight titration points in 1536-well source plates. In these qHTS plate sets, the top four concentrations are similar to the typical concentrations used in our HTS process, and the bottom four concentrations are used to facilitate robust curve fitting. To date, we have employed three specialized small libraries for qHTS: the first is a “mechanism of action” library, in which the biological target/pathway has been annotated; the second is a so-called “random set”, which is constructed to represent the diversity within our larger compound-screening deck; and the third is a so-called “Challenge” library containing compounds known to interfere with a variety of detection technologies. We describe here the process for producing the interplate titration, analyzing the data with screening/curve-fitting data analysis software, and the treatment of experimental data sets to determine FPs, FNs, CRs, and hit rates as a function of screening concentration. A specific example is given for each of the three types of pilot libraries in which this approach enabled rapid collection of assay performance statistics and assessment of pharmacologic profiles.
Methods
Focus Libraries
The Challenge library contains 1408 compounds so as to fit within one 1536-well plate (at one concentration) and is based on frequent hitters in both biochemical and firefly luciferase (FLuc)-based reporter gene assays (RGAs). The mechanism of action (MoA) library contains 2641 compounds and represents drugs or compounds with well-validated molecular mechanisms. The random set was designed to represent our larger compound collection and is primarily used to estimate the hit rate. See the
Assays
Biochemical assays that were tested here included a purified enzyme assay using FLuc and a protease assay that monitored cleavage of a profluorescent substrate.15,16 Cell-based assays included two different RGAs employing FLuc as the reporter. Compounds were added from the 1536-well source plates to the assay plates using a 20 or 50 nL slotted pin tool (V&P Scientific, San Diego, CA). 17 All assays were optimized in 1536-well plates to show acceptable performance as measured by Z′ factors >0.5. 18 For all qHTS experiments, the plates were prepared starting with the lowest concentration plate and progressed to the highest concentration plate to limit carryover effects of the pin tool.
Construction of Interplate Dilution Series
The interplate dilution series was constructed in 1536-well plates with an Agilent Bravo liquid handler as described by Yasgar et al., 2 except an asymmetric titration series was used. Following stacking of four 384-well plates, a 1536-well plate was made containing 8 µL of compound sample. For the asymmetric titration series, two separate dilution protocols were then performed. In the first, the destination plates were prefilled with 4 µL of DMSO, and a 1:2 dilution was performed three times. The fourth plate (concentration 4, or “C4”) then becomes the source plate for the second dilution protocol, which dilutes the compound in half-log steps four more times. A certain volume of sample was removed from the C4 and C8 plates to keep the final volume the same for all plates (4 µL). The final volume uniformity was necessary to use these plates in acoustic-based replication protocols. For the Challenge and “random” sets, the resulting source plate compound concentrations were 2, 1, 0.5, 0.250, 0.080, 0.025, 0.008, and 0.0025 mM. For the MoA library, the resulting source plate compound concentrations were 9, 4.5, 2.25, 1.125, 0.356, 0.113, 0.036, and 0.011 mM.
Data Analysis
Normalization and curve fitting of qHTS data were performed in HELIOS (Novartis internal client software capable of performing plate-based pattern corrections, normalization, and curve-fitting routines). Analysis of qHTS data sets was performed in Pipeline Pilot v.8. True-positives (TPs) were taken as those compounds designated as a “hit” at the chosen activity threshold where concentration-response curves (CRCs) could be fitted to the titration-based data set and also met several criteria including annotation that the curve direction was either increasing or decreasing (depending on the desired assay mode of detection) and that the CRC was valid. Superactives (in which potent activity was observed through nearly the entire concentration range and could be misfitted to constant CRCs) were then rescued using our in-house CRC classification, which annotates such samples as “highly active.” For FNs, the same CRC criteria were used, but in this case, the compound is not identified as a hit at the chosen threshold value. Weak activity was treated in several categories. The 95% confidence interval (CI) for the activity obtained for all the constant-fit (inactive) samples was used to set the lower baselines for the variation in the activity data. Hits were tagged as weak TPs if the activity was >95% CI of the inactive baseline but the curve fit was constant (e.g., fitted as a flat line). This captures potential compounds that may have significant activity just outside the tested dose range. Compounds not found as hits at a given concentration but where curve fits were obtained (but of lower quality than the valid parametric set noted above) and where the maximum activity was >95% CI of the inactive baseline were tagged as weak FNs. Plate heat maps of the single-concentration data can be used in conjunction with the dose-response curves to identify systematic errors (e.g., a dispensing error), which can be excluded from the analysis to better judge the hit and CRs of the HTS.
For analysis, we calculated the diagnostic FP rate: FPR = (FP/FP + TN) × 100; FN rate: FNR = (FN/(TP + FN) × 100; and CR: CR = TP/(TP + FP) × 100. The FPR, CR, and FNR are the sum of the high confidence numbers and lower confidence numbers using a weighted factor.
Results and Discussion
Rationale and Overview of qHTS for Assay Pilot Testing
To validate an assay suitable for HTS, statistical parameters such as signal window and Z′ factor have been used as metrics to judge the quality of the data.18–20 However, two additional metrics that define the quality of an assay are the sensitivity, that is, the ability of the assay to determine all the TPs and minimize FNs, and the specificity, defined as the ability of the assay to distinguish true-negatives (TNs) from FPs. In typical assay pilot testing, the assay is performed in replicate tests at one concentration, and hits that replicate well are then tested as a dilution series to determine CRCs. From these data, the relative and absolute CR and FP rate can be calculated. An FNR can also be estimated if all the hits from both tests (regardless if the activity replicated) are chosen for CRC validation. Therefore, this process can define statistical performance factors as well as estimations of the assay’s sensitivity and specificity at a given screening concentration.
Application of a qHTS format for pilot testing offers a few important improvements on the above process. The qHTS process allows for simultaneous collection of single-concentration data sets at multiple concentrations so that hit rate, assay performance statistics, sensitivity, and specificity of the assay can be considered as a function of concentration. The data can be analyzed at any threshold value to define the hits and determine the effect on CR, FP rate, and FN rate. This should enable more informed choices on the screening concentration and the hit threshold value for large-scale screening. Typically, two iterations may be performed (a high and a low concentration) using the conventional approach, which can be very time-consuming. By collecting both single-concentration data sets and CRCs data sets in one experiment, pilot testing with the qHTS approach should not only save time but also compound samples as there is no need to order an additional sample to determine the CRCs, particularly when each compound ordered requires a certain dead volume, which is eventually discarded. As well, not every investigator is inclined to pick all the hits at the pilot stage for CRC testing (instead choosing only the hits that replicate), thereby preventing the assessment of FN rate. In addition, the larger number of data points obtained from a qHTS pilot versus single-concentration–based pilot screening should provide a better test of the automated protocol intended to screen hundreds of plates in a single run. Therefore, we believed it would be both interesting and important to examine a qHTS process to improve assay pilot testing.
Construction and Treatment of Asymmetrically Titrated Plate Sets
The general process for constructing the qHTS plate set and the data that are provided from screening these plates is outlined in Figure 1 . To create a titration-based archive for assay pilot testing, we employed an asymmetric titration protocol. In this case, the first four concentrations are diluted using a 1:2 dilution factor, which provides concentrations that are representative of typical single-screening concentration ranges. For example, using a 9 mM compound sample concentration as the source (in DMSO) and a 5 µL assay volume with a final DMSO concentration of 0.4% (v/v; using a 20 nL pin tool for compound transfer) provides screening concentrations of 36, 18, 9, and 4.5 µM for the top four concentrations. The last four dilutions are performed using a half-log dilution factor, which provides data for robust curve fitting. In the example above, the last four qHTS screening concentrations would be 1.42, 0.45, 0.14, and 0.045 µM.
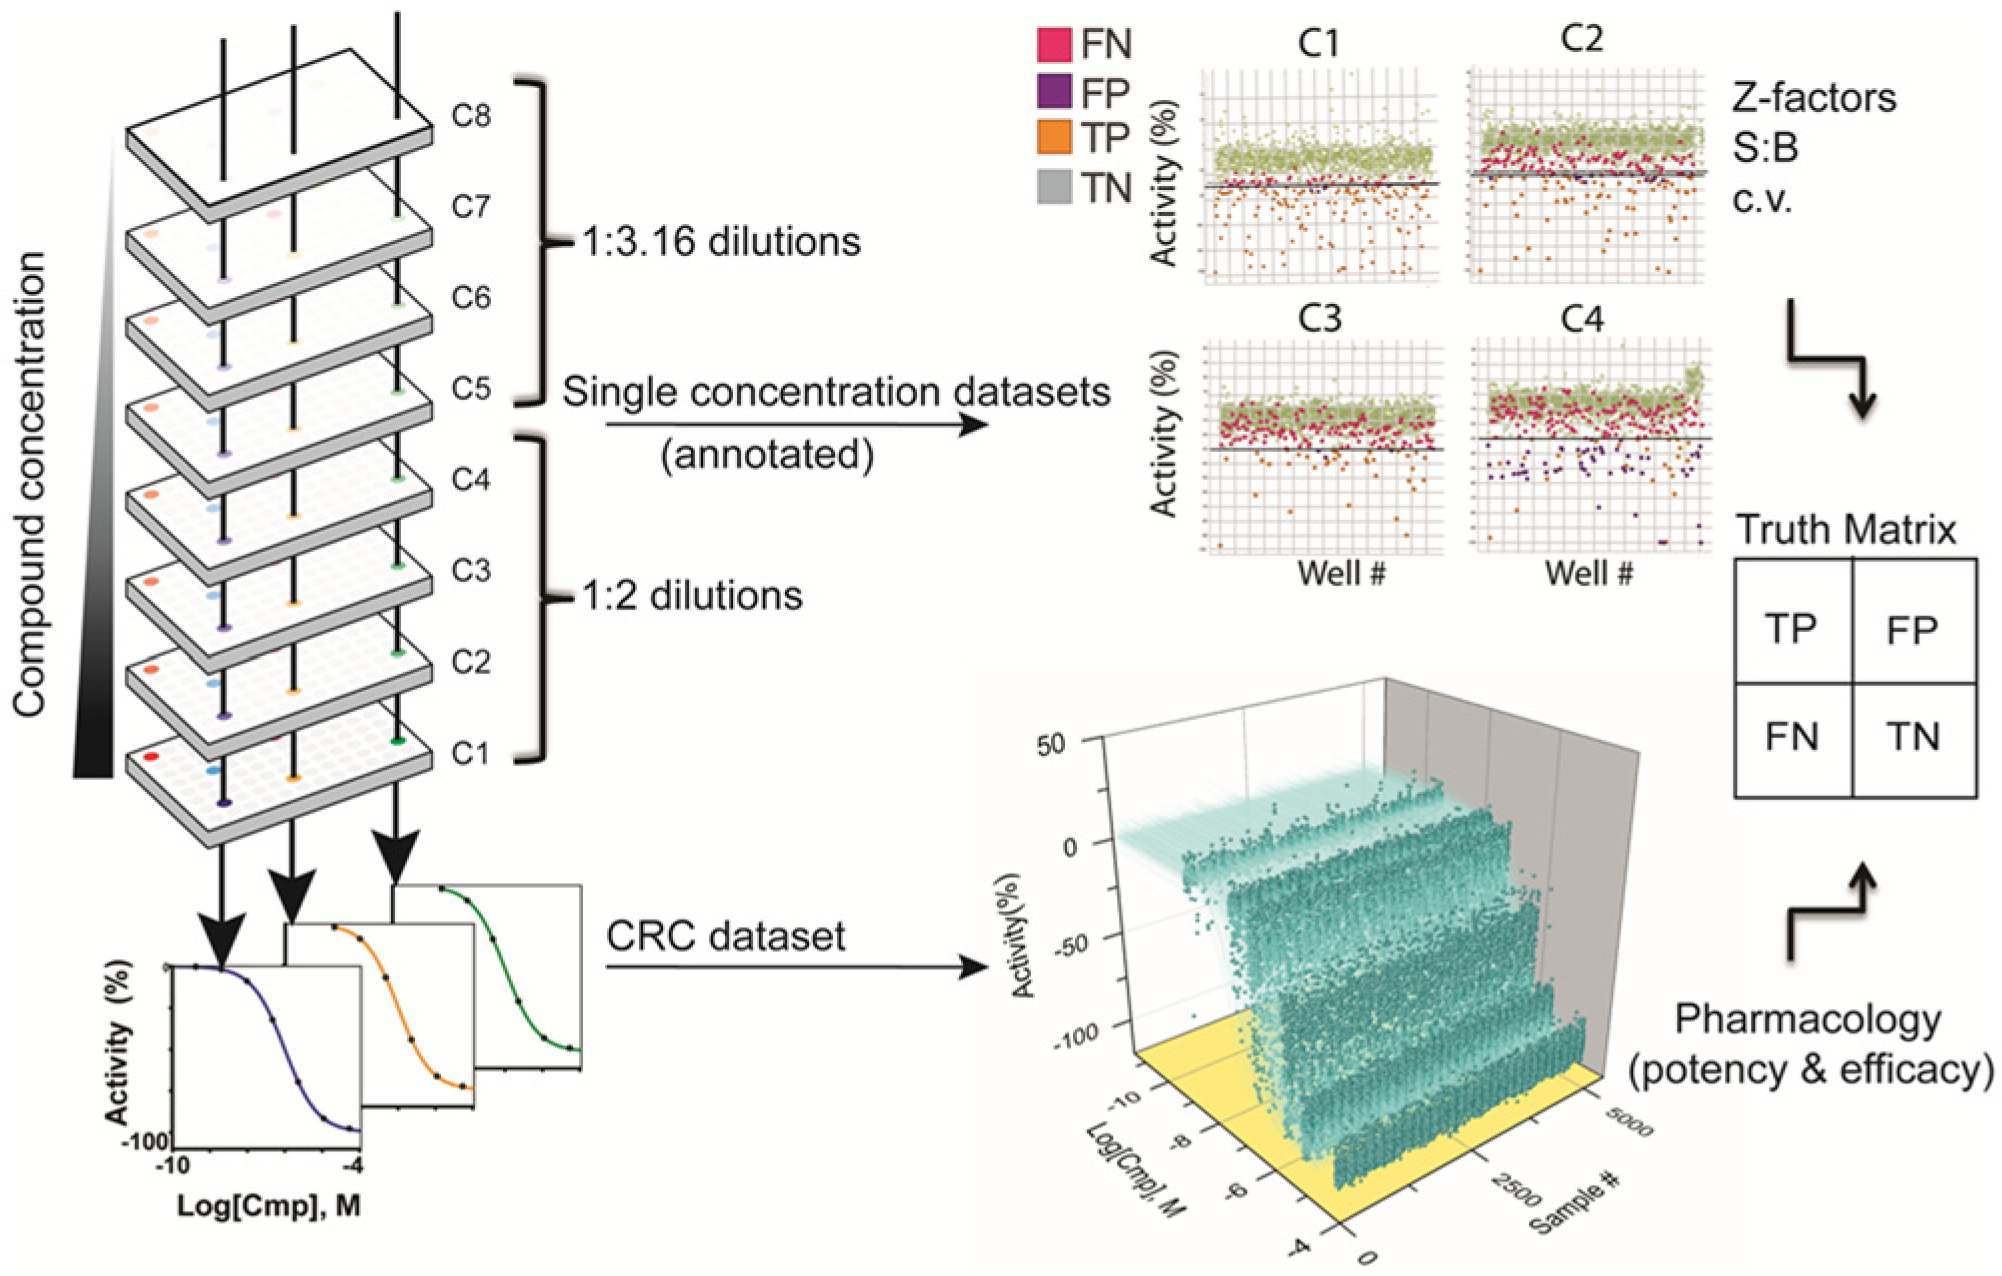
Interplate asymmetric dilution series and data types derived from the quantitative high-throughput screening (qHTS) process. (
Overall, the dilution process used in the qHTS process leads to a substantial efficiency gain over our standard approach for plating dilution series with an intraplate format when the number of samples exceeds 200. Upstream robotic sample picking into a dense format reduces processing time for that step by 25% to 33% (e.g., 352 versus 44 samples per 384-well plate;
Following screening of the qHTS plate set, the data are analyzed as both single-concentration plates and CRCs. A threshold value can be applied to each of the single-concentration data sets to determine the hits at that concentration, and this threshold can be varied to determine the effect on hit rate. The CRCs are fitted to the data by associating the concentration of each plate with the plate-based normalized activity data. This approach provides not only conventional assay performance statistics such as the Z factor and the hit rate for each screening concentration using a format with the samples and controls in the same position as in the HTS protocol but also hit validation data from the CRC data set. Here, we define a TP as a hit that is also found with a valid CRC with a certain maximum activity value, an FP as a hit in which the CRC is best fitted to an inactive curve, an FN is a compound sample not identified as a hit but with a valid “active” CRC, and TN compound samples as nonhits that are also fitted to “inactive” curves in the CRC data set (
Potential issues with the above analysis include that the results greatly depend on the robustness of the data quality and the curve-fitting routine. For example, a very weakly active sample can be fitted with either a curve or a constant line. As well, very highly active samples can also be fit to a constant line instead of a curve. Therefore, care must be given during curve fitting when dealing with such ambiguous titration data. On the other hand, curves with outlier data points at the highest testing concentrations could be fitted as a parametric curve or a bell-shaped curve depending on whether the outlier was rejected or not. Our analysis captured different activity types by using annotations based on classifications of the CRC data set. This curve classification is similar to the numerical classifications described previously to separate CRCs based on the quality of the curve fit to the data, number of data points around the asymptotes, and efficacy of the activity. 1 The curve-fitting and classification algorithm also needs to be sufficiently fast. Using our in-house software, we can fit, classify, and examine approximately 5000 CRCs in less than a day. Another caveat is that the truth matrix depends on the titration range coverage, particularly at the highest tested concentration. A curve’s active or inactive status can change if the titration concentration range is shifted to higher or lower concentrations.
Case I: Analysis and Visualization of an Example qHTS Data Set
As a first test of the qHTS piloting process, we used a biochemical assay measuring the activity of the FLuc enzyme (FLuc, an enzyme commonly used to construct RGAs) against the random set. The FLuc assay showed a Z′ = 0.85 ± 0.03, and a −26% threshold value (6SD of the DMSO control wells) was used for hit calling. This threshold value still shows a very high hit rate (3.4%) even at a ~4 µM screening concentration. The truth matrix (
A graphical representation of these data is given in
Figure 2
. In this analysis, we also enumerated compounds with lower confidence activity (weak activity). The TP data show a clear dose response with many potent compounds, but the lower confidence TPs show activity only at the higher tested concentrations (
Fig. 2a
,
b
). FPs in general are sporadic, except for those of lower confidence, which occur at the highest tested concentration and may be weak actives (see
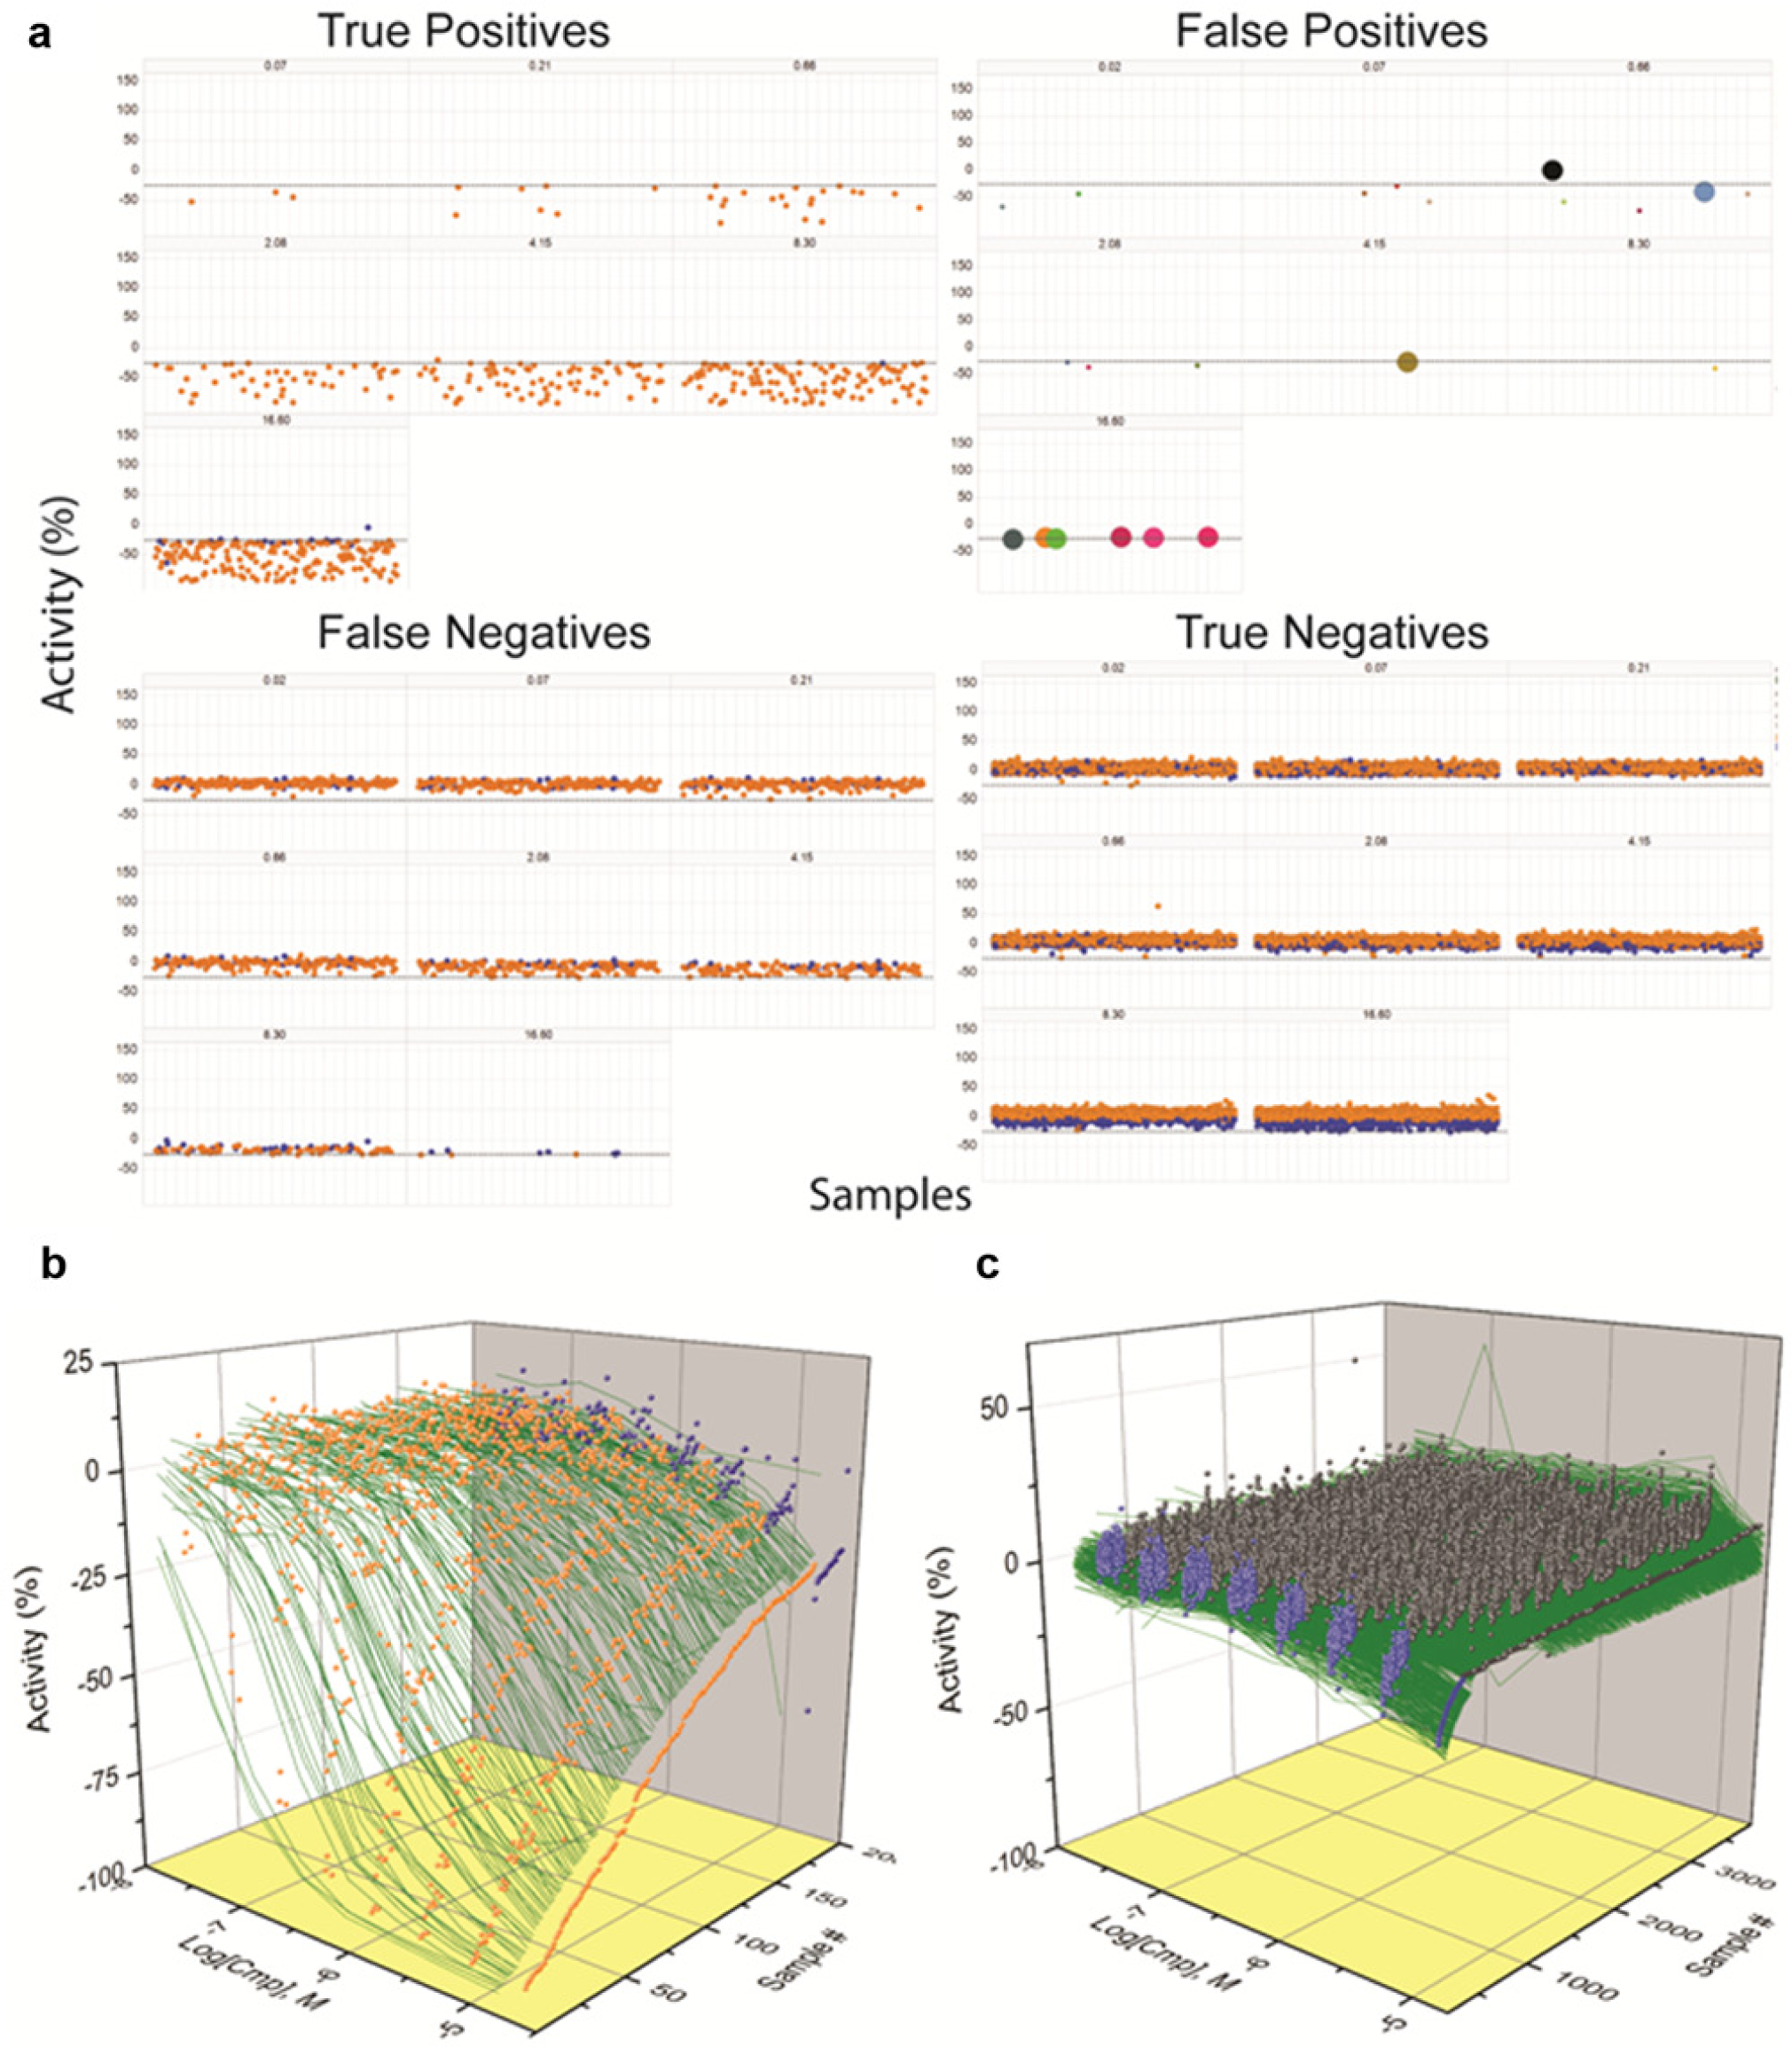
Representations of the qHTS data collected from a robust biochemical assay. (
Case II: Testing of the MoA Library by qHTS in an RGA Examining Antagonist Responses
We next applied the qHTS process to our MoA library in an RGA pilot screen. Figure 3 shows the results of this pilot screen with an FLuc-based RGA assay aimed at identifying compounds antagonizing a cellular oxidative pathway, and compounds that decreased the signal were of interest. The TPs were called based on decreasing CRCs, whereas inactive and increasing CRCs were placed in the negative category. The assay showed excellent performance in 1536-well plates with a Z′ = 0.73 ± 0.03 ( Fig. 3a ). For this cell-based qHTS pilot data set, the automated analysis again performed well in separating TP data ( Fig. 3b ) from FN ( Fig. 3c ) and TN data ( Fig. 3d ) using a −50% inhibition (~6SD) threshold for hit calling at the 11.2 µM data set (C4 of the qHTS set). In this analysis, <10 FPs ( Table 1 ) were found, and the FNs appeared to be associated with weaker activity that was narrowly missed by the hit threshold ( Fig. 4c ).
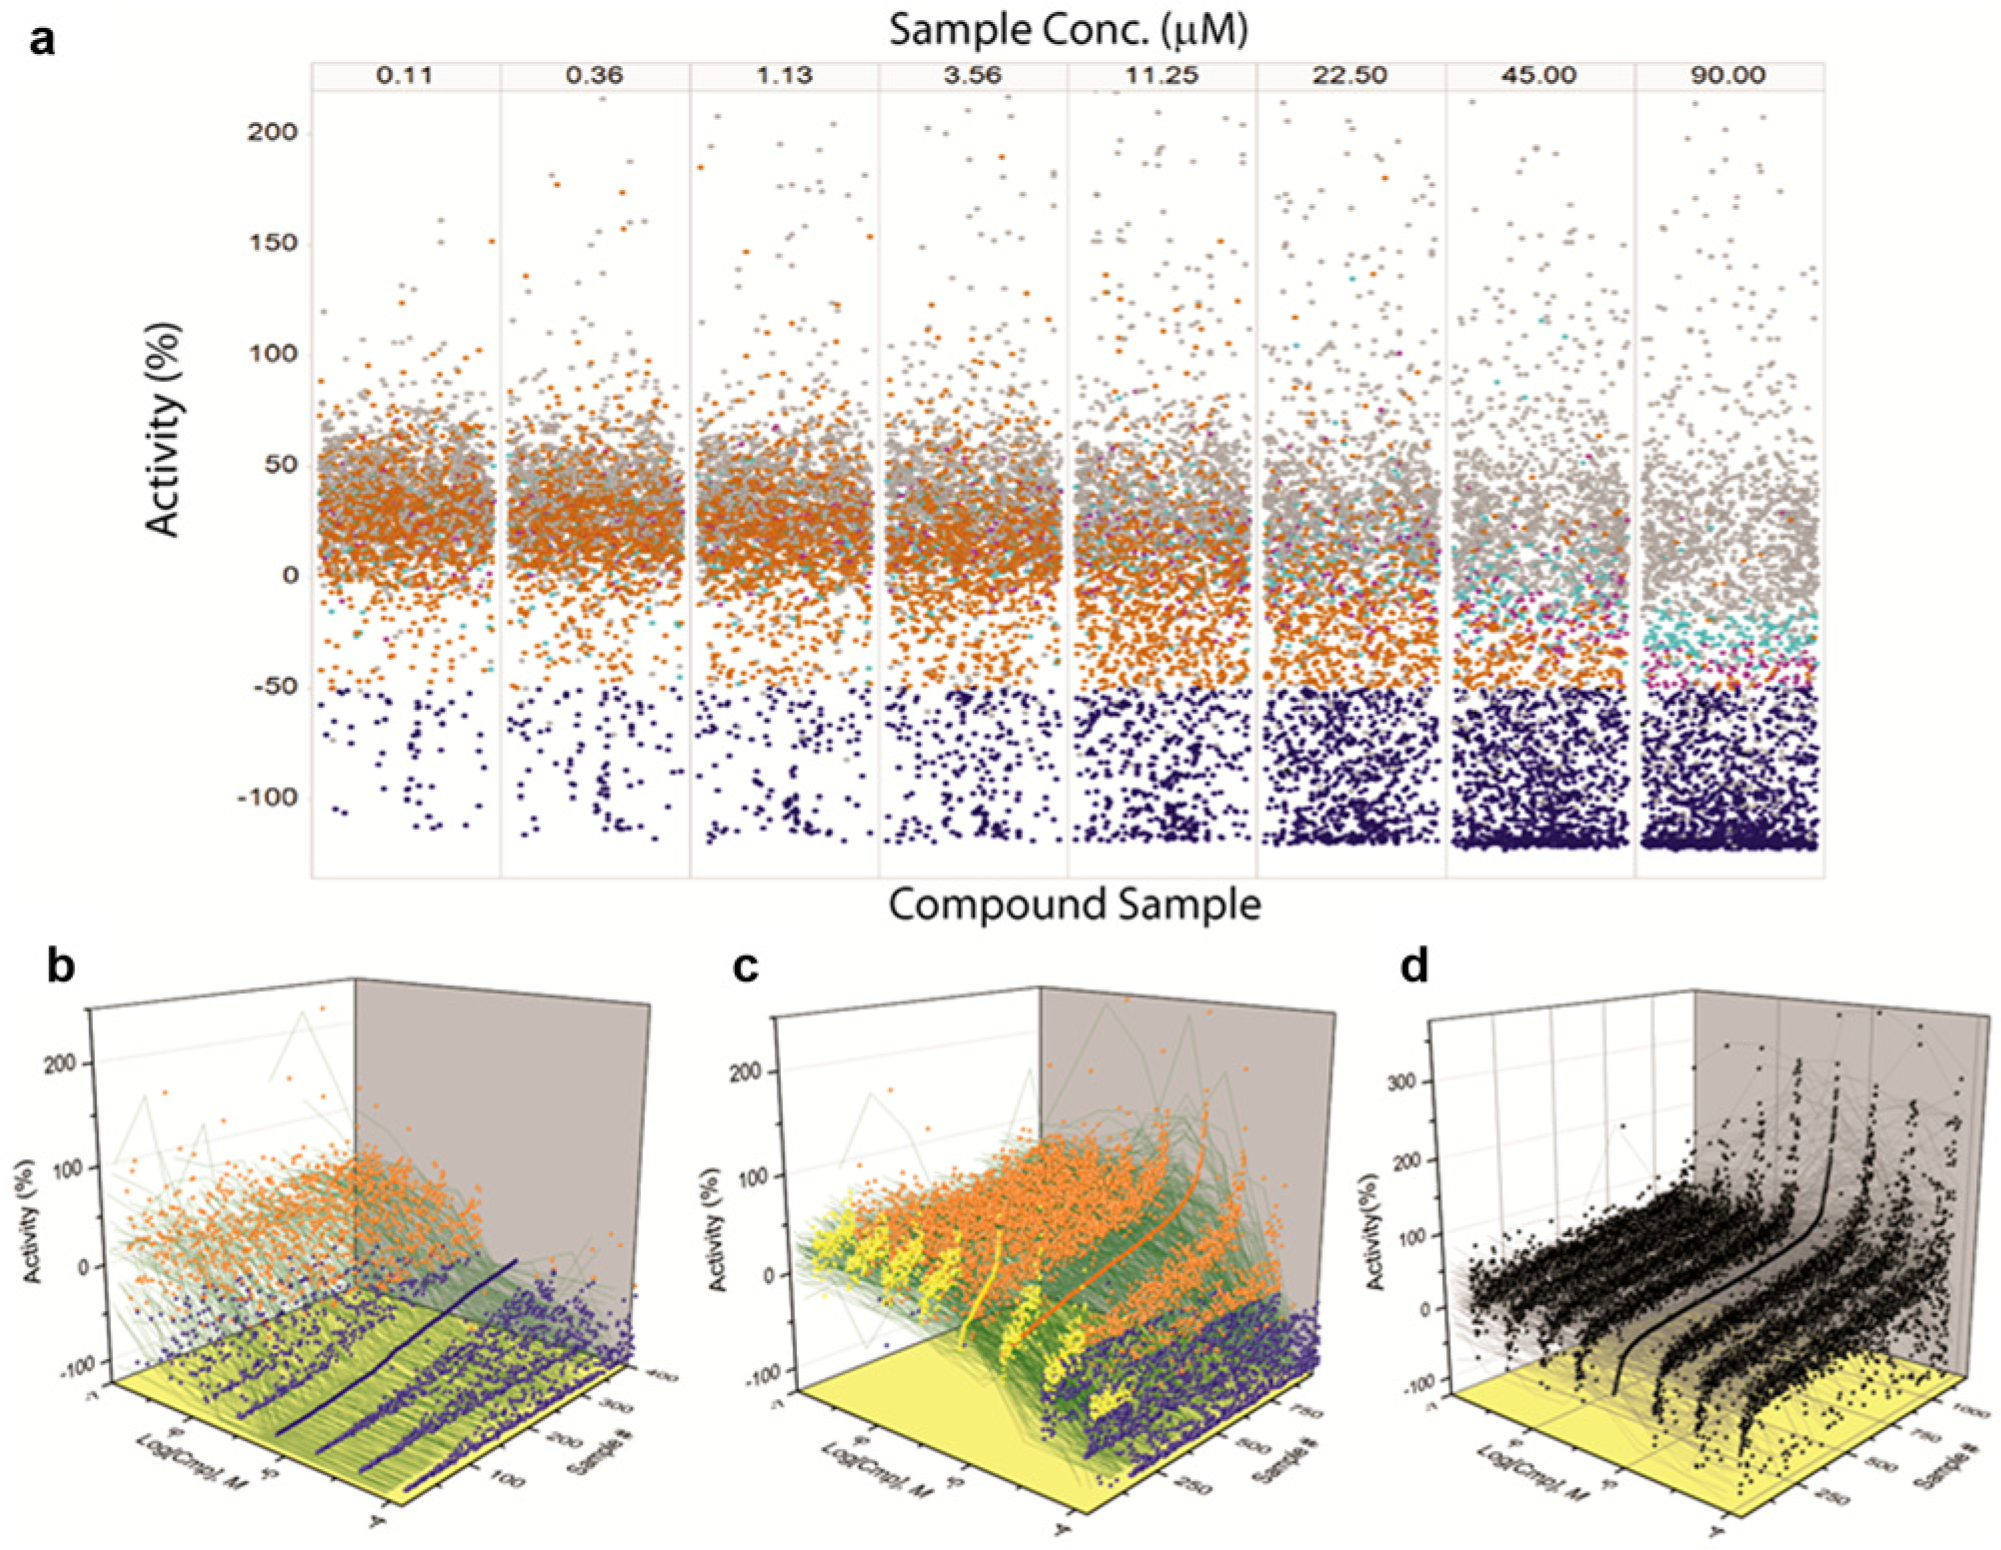
Data sets from analysis of the mechanism of action library qHTS in an RGA aimed at identifying antagonists. (
Example truth matrix for an RGA aimed at antagonists. a
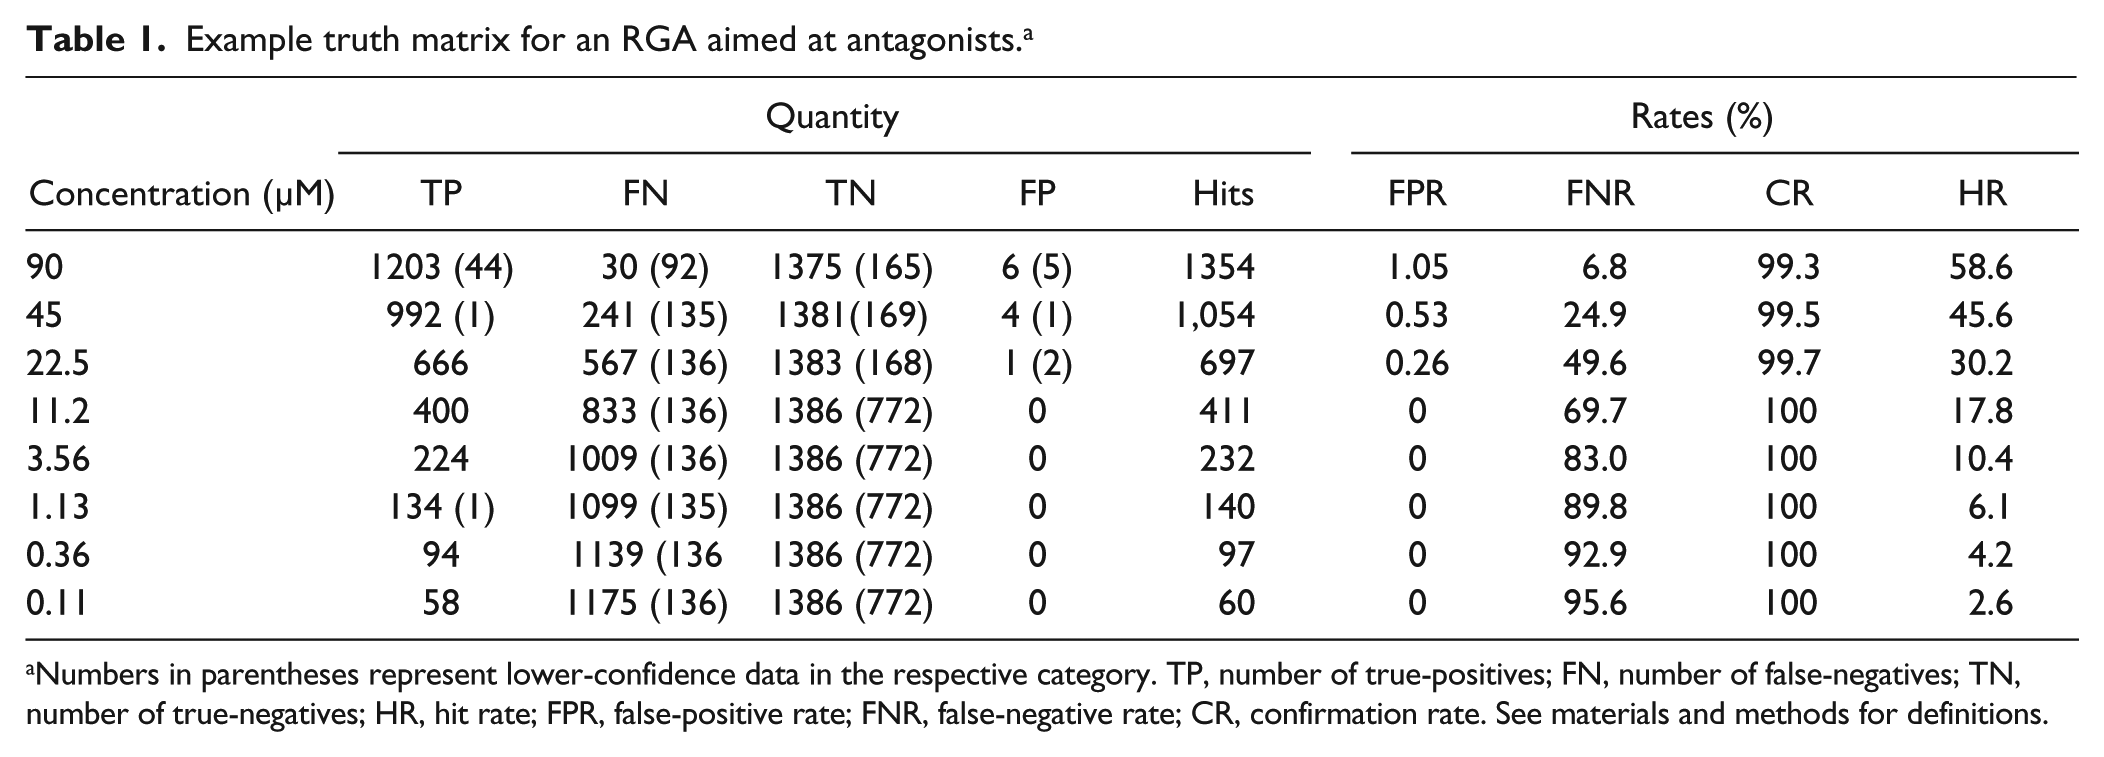
Numbers in parentheses represent lower-confidence data in the respective category. TP, number of true-positives; FN, number of false-negatives; TN, number of true-negatives; HR, hit rate; FPR, false-positive rate; FNR, false-negative rate; CR, confirmation rate. See materials and methods for definitions.
Quantitative high-throughput screening (qHTS) data for representative false-negatives (FNs) found in an RGA aimed at identifying agonists. Data shown are for an RGA expressing firefly luciferase in which compounds that increase expression of this reporter are desirable. (
The MoA library showed a high hit rate in this RGA (17.8% at 11.2 µM; Table 1 ), although this is not unusual for a library of bioactive compounds in a cell-based assay. Of the 411 hits identified at the 11.2 µM concentration, 400 were found to be TPs; however, 833 FNs were revealed in this analysis at this concentration (FNR = 69.6%). Such a large number of FNs could adversely affect construction of pathway hypotheses if only one of the single-concentration data sets was used. For example, if too few hits are identified for a particular target, then an enrichment analysis will fail to identify this target and related pathways as being relevant in the assay, which is valuable information for anticipating secondary assays to determine on- and off-target effects.
Although we used a very high compound titration concentration range (90 µM to 0.11 µM) for the MoA subset to maximize pharmacologic profiling of pathways, for the rest of the large-scale screening, we selected a moderate concentration of 8 µM to balance the hit rate for the larger random collection containing more than a million compounds and to minimize general cytotoxic effects. The full HTS yielded a ~3% hit rate at 8 µM that agrees well with the random set data, which showed a 3% to 4% hit rate at 11.2 µM.
Case III: Determining Optimal Screening Concentration with qHTS in an RGA Examining Agonist Responses
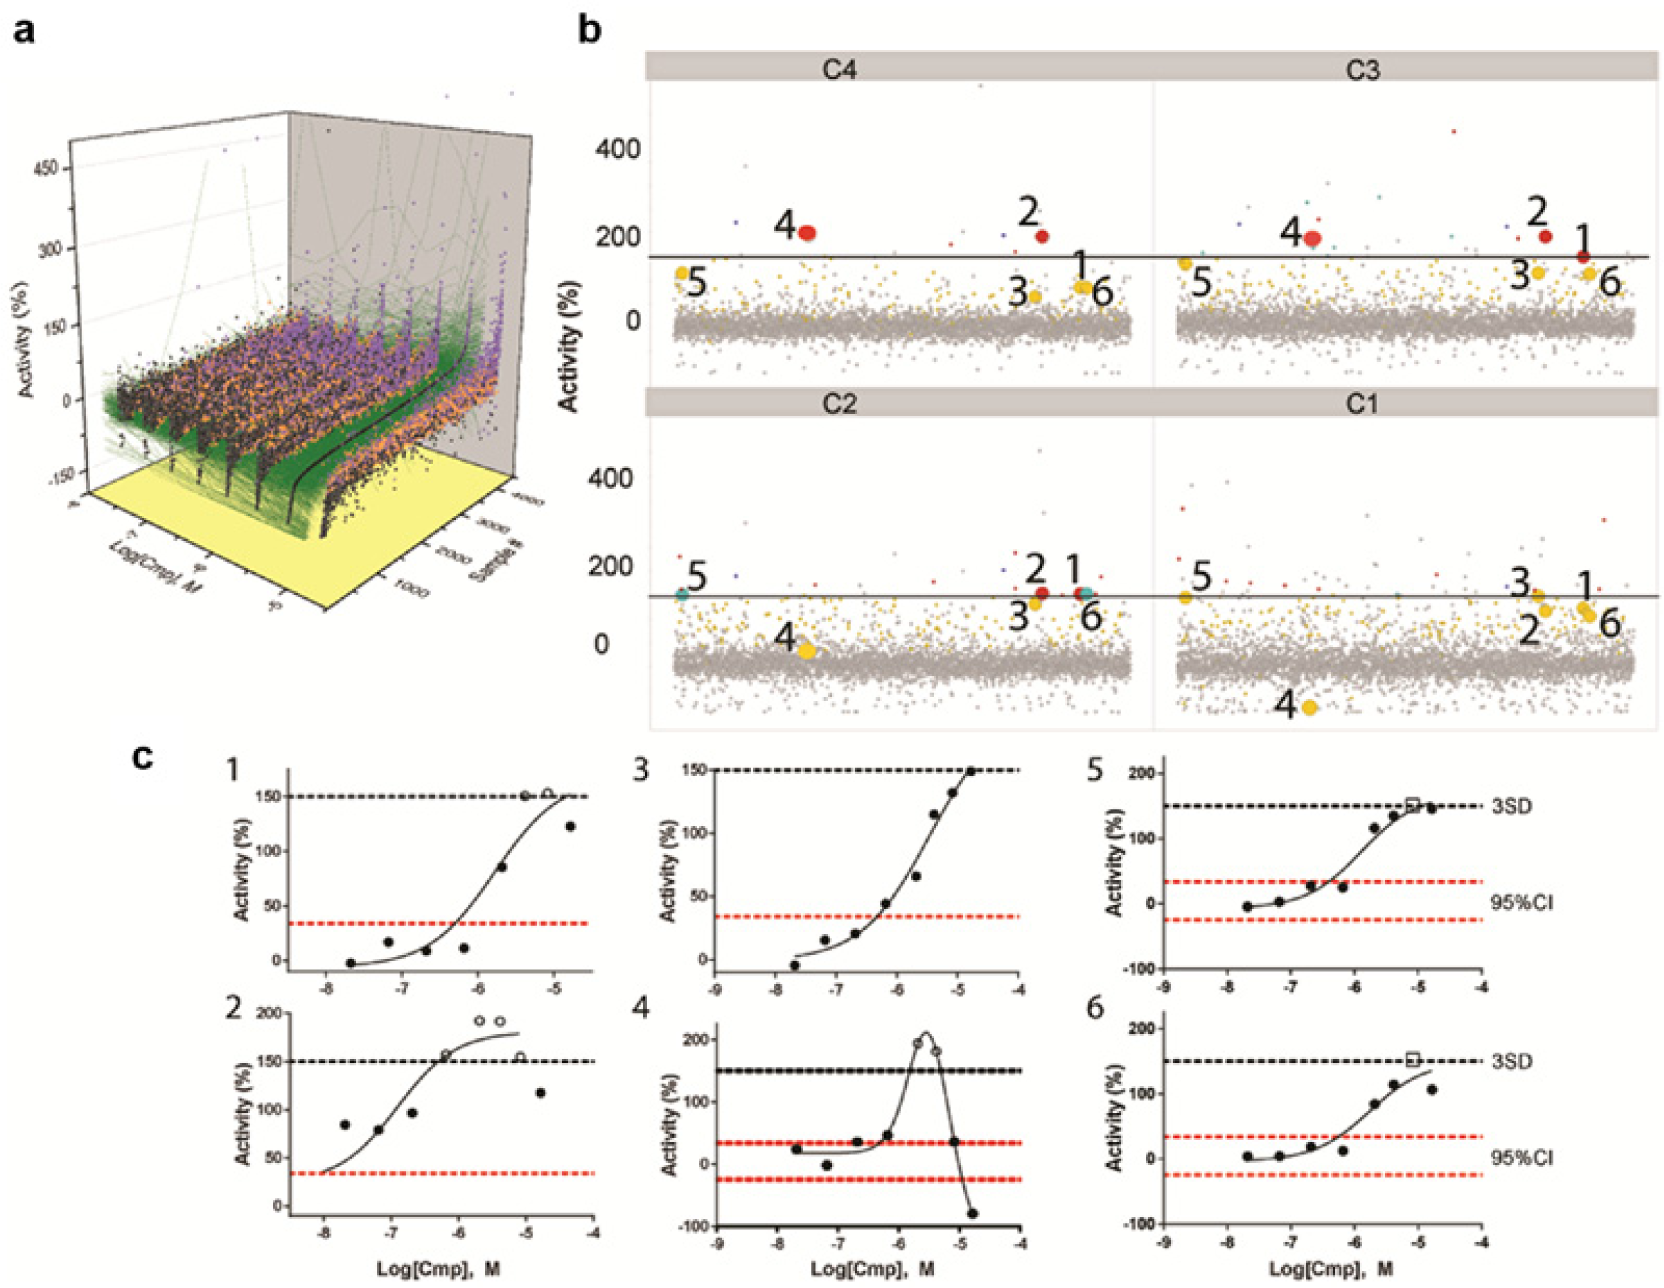
The random set of pilot plates was screened against an RGA to estimate hit rate and assay performance factors. This RGA was designed to measure FLuc expression under the control of an epigenetically silenced promoter, and the goal was to identify compounds that activated expression of FLuc via this promoter. The assay showed a very low basal signal, but the Z′ was 0.5 ± 0.2 using a histone deacetylase inhibitor as the active control. The analysis of this pilot test is shown in Table 2 . We noted that a significant amount of activity in this assay was found as low-confidence TN or as invalid curves (samples classified as “not determined”), but the CRCs showed a flat dose response for these samples, supporting that these are inactive samples ( Fig. 4a ). TNs showed a flat response or were generally inhibitors of the signal (taken as TN in the agonist assay; Fig. 4a ). A few compounds, for which a category could not be determined, showed spurious strong activation activity (violet data Fig. 4a ) that would have to be confirmed in subsequent tests. Many of the weak hits ended up in this category, reflective of the variation of the response.
Example truth matrix for an RGA aimed at agonists. a
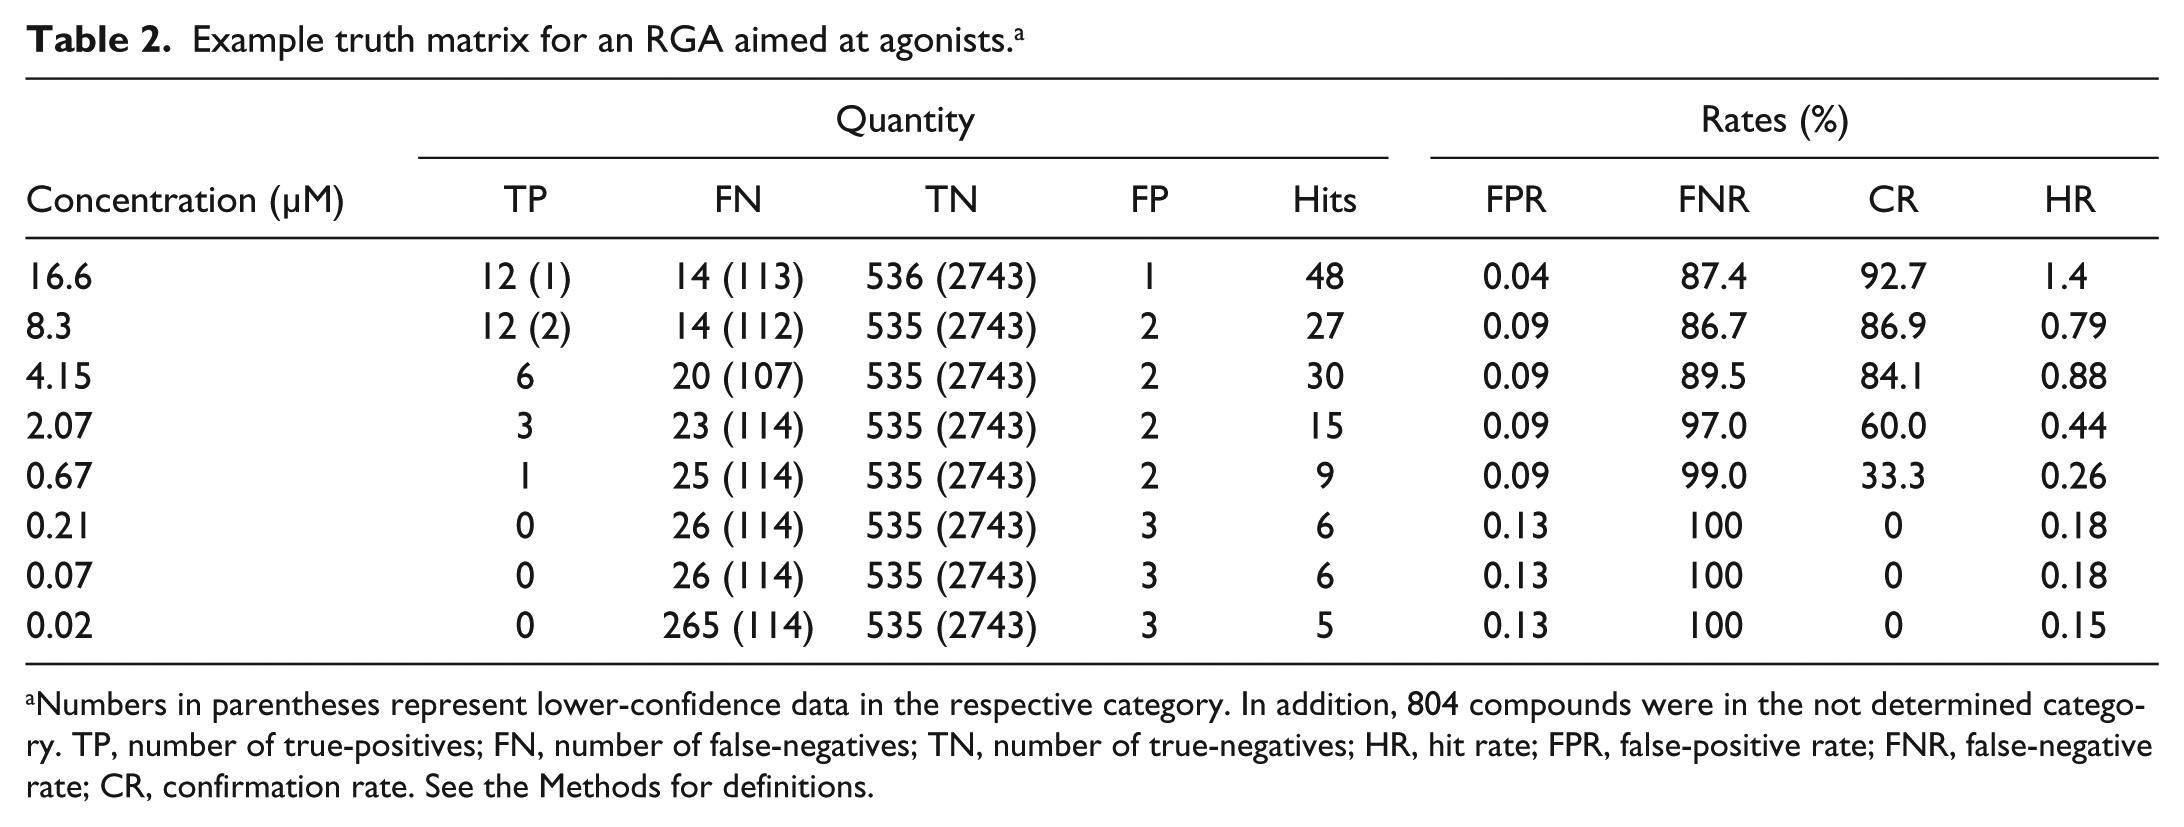
Numbers in parentheses represent lower-confidence data in the respective category. In addition, 804 compounds were in the not determined category. TP, number of true-positives; FN, number of false-negatives; TN, number of true-negatives; HR, hit rate; FPR, false-positive rate; FNR, false-negative rate; CR, confirmation rate. See the Methods for definitions.
A common pharmacologic response observed in agonist assays is bell-shaped activity in which low activity is observed at both low and high compound concentrations, but intermediate compound concentrations often show stronger activity.21,22 For this RGA pilot test, FNs were often due to such bell-shaped activity ( Fig. 4b , c ). For example, compounds 1, 2, and 4 ( Fig. 4b , c ) showed an activity that was below the 150% threshold cutoff at the highest tested concentration (C1, 16.6 µM), but at lower testing concentrations (C2–C3, Fig. 4 ), activity from these compounds is captured above the threshold. One exception is compound 3, which shows a sigmoidal CRC that is entirely below the 150% threshold value (maximum activity was 149%) but the activity is above the 95% CI of the inactive data ( Fig. 4c ), and this activity replicated well between two independent runs (data not shown). Compound 3 would have been missed at all tested concentrations by conventional single-point pilot testing. Such actives could possibly be rescued with post-HTS data-mining techniques aimed at identifying latent hits.23,24 Both compounds 5 and 6 were annotated as weak TP at the 8.3 µM screening concentration but found as FN at all other doses ( Fig. 4b , c ). In contrast to antagonists’ assays, agonists’ assays showing such pharmacology may benefit from screening at intermediate concentrations as opposed to testing at the highest possible compound concentration, and we chose the 8 µM concentration for our larger HTS based on this analysis.
Case IV: Application of qHTS to Identify an Optimal Assay Buffer
A portion of the Challenge library is based on frequent hitter analysis of biochemical assays. The Challenge library showed an average hit rate of 5% in past screens, with many compounds hitting in >10% of the tests. Therefore, this library provides a means to test for different modes of compound interference with biochemical assays (e.g., aggregation, fluorescence, quenching phenomena). The Challenge library was screened against a biochemical protease assay as a qHTS to measure conditions that reduced unwanted interference in the assay. Specifically, the goal was to compare two different assay buffer systems. The “modified buffer” (20 mM Tris-HCl, 0.005% (v/v) Tween20, 120 mM NaCl) showed a hit rate that was consistently lower (average = 1.1% lower) than the original buffer used for the assay (20 mM Tris-HCl, 0.005% (v/v) Tween20), whereas the CR was similar at the higher screening concentration (
Summary
A major advantage of using qHTS for assay pilot testing is that both assay performance statistics (e.g., Z′ factor) and hit validation data are obtained in one experiment, which saves time, cost, and compound sample. Besides this advantage, the qHTS pilot data set can be used to enable the understanding of complex compound pharmacology such as bell-shaped behavior and to select suitable screening concentrations and conditions. Although the qHTS pilot provides a better data set for evaluation of the screening assay, a disadvantage of the approach is that the size of the pilot testing is larger, which requires more reagents. However, the availability of the titration-based archive allows researchers to choose fewer concentrations if reagents or resources are limiting.
For high-quality assays, the hit rate and FN rate shed light on the pharmacology of the compounds. For example, in our study of case I and case II, qHTS pilot results showed that FN were primarily due to low-potency compounds, with also a very low FPR and high CR. The lower CR obtained at lower screening concentrations can be explained by the enrichment of FPs in the hit lists derived from lower concentrations; the FPR, being stochastic in nature, does not change with concentration, whereas the number of TPs decreases with lower concentrations, thus yielding a lower CR. Assays demonstrating such high specificity and sensitivity can be screened at high compound concentrations, which will capture most of the true actives. However, several factors that can affect the screening outcome also need to be considered: (1) interferences at high compound concentrations, (2) compound precipitation occurring at high testing concentrations, (3) the hit follow-up assays (counterscreens and orthogonal assays) required, and (4) the balance of maximizing hit finding versus time and cost of the process. These factors should be considered along with the data available from the qHTS to choose the optimal screening concentration. For example, in an RGA aimed at agonists (case III), FNs were often found to be associated with bell-shaped CRCs where the activity dropped below the chosen threshold. In a case like this, an intermediate concentration range is more optimal for the screen. We also found the qHTS pilot testing approach to be useful to compare and select optimal screening conditions for a biochemical assay (case IV), but such analysis can also be expanded to cell-based assays in which the assay quality, hit rate, sensitivity, and specificity of different cell lines could be compared. Application of this approach to focused or enriched libraries in which high hit rates are anticipated, libraries containing structurally similar chemical matter such as combinatorial collections, and natural product mixtures should also enable rapid hit validation along with efficient use of precious compound samples.
Footnotes
Acknowledgements
We thank Johannes Ottl, Basel (Novartis, Basel, Switzerland) for construction of the Challenge library; Meir Glick, Ansgar Schuffenhauer, and Jeremy Jenkins for constructing the MoA library and random sets; and Greg Wendel for advice and help in constructing the qHTS plate sets.
Declaration of Conflicting Interests
The authors declared no potential conflicts of interest with respect to the research, authorship, and/or publication of this article.
Funding
The authors received no financial support for the research, authorship, and/or publication of this article.
References
Supplementary Material
Please find the following supplemental material available below.
For Open Access articles published under a Creative Commons License, all supplemental material carries the same license as the article it is associated with.
For non-Open Access articles published, all supplemental material carries a non-exclusive license, and permission requests for re-use of supplemental material or any part of supplemental material shall be sent directly to the copyright owner as specified in the copyright notice associated with the article.