
Abstract
The actin cytoskeleton plays an important role in most, if not all, processes necessary for cell survival. Given the fundamental role that the actin cytoskeleton plays in the progression of cancer, it is an ideal target for chemotherapy. Although it is possible to image the actin cytoskeleton in a high-throughput manner, there is currently no validated method to quantify changes in the cytoskeleton in the same capacity, which makes research into its organization and the development of anticytoskeletal drugs difficult. We have validated the use of a linear feature detection algorithm, allowing us to measure changes in actin filament organization. Its ability to quantify changes associated with cytoskeletal disruption will make it a valuable tool in the development of compounds that target the cytoskeleton in cancer. Our results show that this algorithm can quantify cytoskeletal changes in a cell-based system after addition of both well-established and novel anticytoskeletal agents using either fluorescence microscopy or a high-content imaging approach. This novel method gives us the potential to screen compounds in a high-throughput manner for cancer and other diseases in which the cytoskeleton plays a key role.
Introduction
The actin cytoskeleton is a dynamic and complex system involved in a broad range of cellular functions including adhesion, cytokinesis, cell motility, contractile force, cellular signalling, endocytosis, intracellular transport, and apoptosis. Actin microfilaments are able to fulfill such a vast array of functions through their ability to form a variety of compositionally distinct filaments. This unique property arises through interactions with a number of actin binding proteins (ABPs). 1 These ABPs are under further regulation by signaling pathways such as those regulated through small GTPases, which include cdc42, Rac, and Rho. 2 Throughout the progression of cancer, there are a number of changes in actin cytoskeletal organization that correspond to changes in ABP expression and aberrant cell signaling. These are well documented and contribute to tumorigenic properties acquired by cancer cells. 3 Because of this, the actin cytoskeleton and its regulators have long been recognized as potential targets for chemotherapeutic agents. Research into these regulators and drug development targeting the actin cytoskeleton have, however, been difficult, as currently beyond biochemical analysis, the standard method of evaluating changes in the cytoskeleton is through subjective evaluation of immunofluorescent images.
Of the six actin isoforms identified, 4 the two cytoskeletal isoforms are ubiquitously expressed in all cells, where they act as a scaffold providing structure and shape. 5 Cytoskeletal actin exists in either its monomeric/globular form (G-actin) or as a filament (F-actin) and polymerizes into two helical strands wound around each other forming F-actin in a head-to-tail fashion. 6 This continuous polymerization and dissociation is a dynamic process referred to as treadmilling, which is critical for cell survival. 7 Unfortunately, the similarities between muscle actin and cytoskeletal actin make the use of anti-actin–targeting processes too toxic for clinical use. 8 However, many of these compounds such as the G-actin sequestering agent latrunculin A 9 and the F-actin stabilizing agent jasplakinolide have been well characterized. 10 The profound impact they have on the actin cytoskeleton make them useful tools in studying actin dynamics.
Signaling pathways such as the Rho signaling pathway have long been known to regulate cytoskeletal organization, particularly in the formation of higher-order structures. 11 There is also a large body of literature reviewing the association of Rho proteins with tumorigenesis; however, there is still a lack of a general consensus as to which proteins are crucial and thus best to target in cancer. 12
The targeting of ABPs represents another promising way of selectively disabling the cytoskeleton in tumorigenic cells without widespread toxicity. There are several ABPs that could be potentially targeted in tumorigenic cells, including the Arp2/3 complex, myosin II motors, the ADF/cofilin family, gelsolin, and cortactin. 8 One family of ABPs that is of particular importance is the tropomyosin family, consisting of more than 40 isoforms that do not possess the same structural similarities as actin. 13 Current research suggests that tropomyosins act as gatekeepers whereby their binding to filaments regulates access of other ABPs. 14 The differences in the spatial and temporal regulation of isoforms are seen not only between tissues 15 but also at the subcellular level. 13 In cellular transformation, the loss of the high-molecular-weight isoforms is accompanied by the increased reliance on the low-molecular-weight isoforms, making them ideal targets in chemotherapy. 16
Quantifying changes in F-actin is routinely done through measuring the change in total fluorescence or through the biochemical G-actin/F-actin assay. There are two main ways of quantifying total fluorescence, and these are done either by using a fluorescently conjugated phalloidin, 17 which binds only to F-actin, or detecting relative amounts of G-actin/F-actin through laser-scanning cytometry, whereby relative intensities of fluorescently conjugated-DNAse 1, which binds G-actin, 18 and phalloidin stains are quantified. 19 A major limitation with these fluorescence-based methods is that they do not account for differences in cell area, and as cells round up following drug treatments, background phalloidin staining and thus overall intensity appears to increase, making the results difficult to interpret. Recently, a number of novel methodologies to measure different types of actin reorganization were described; however, these approaches were not investigated for high-throughput assays. 20
A more indirect approach has been described whereby cells were stained with conjugated-phalloidin, the excess was washed away, and the remainder bound to F-actin was dissolved in methanol and fluorescence intensity measured. 21 This laborious method has been refined and is still used as a measure of cytoskeletal organization. 22 The G-actin/F-actin assay is based on separation of actin through ultracentrifugation, whereby F-actin is pelleted and the G-actin remains in the supernatant. 23 The major limitations with these methods are that they are both laborious and variable and thus not suitable for high-throughput analysis. Further to this, they are suitable only for quantifying changes in G-actin/F-actin levels, so any changes in cytoskeletal organization independent of changes in the G-actin/F-actin levels cannot be detected.
Technology surrounding image analysis has advanced to a stage at which it is possible to use algorithms to quantify protein subcellular localization and classify cells phenotypically with great success. 24 Despite this, the ability to quantify changes in the actin cytoskeleton in a high-throughput manner has been largely unachievable. Recently, an algorithmic approach was used to quantify filament length and number; however, this was validated using artificially generated filament networks. 25
In collaboration with CSIRO, we have developed an algorithm for analyzing actin cytoskeletal organization in a cell-based system using two tumor cell lines, the U2OS osteosarcoma cells and SK-N-SH neuroblastoma cells. These cell lines have been extensively studied and have a well-defined cytoskeleton, making them ideal for imaging. In this study, we assessed the limitations of an established technique, the G-actin/F-actin assay, compared with the algorithm and evaluated the effectiveness of both approaches in quantitating changes in the actin cytoskeleton. We then demonstrated that this algorithm is capable of quantifying actin filaments with the use of a number of different compounds in a high-content imaging (HCI) imaging system. We conclude that this algorithm is able to rapidly quantify changes in cytoskeletal organization across multiple images when cells were treated with anticytoskeletal compounds.
Materials and Methods
Cell Culture
Human osteosarcoma (U2OS) and neuroblastoma (SK-N-SH) cells were cultured in Dulbecco’s Modified Eagle Medium (DMEM)/high glucose supplemented with 10% (v/v) fetal bovine serum (Merck, Millipore, Bedford, MA) and grown in a humidified atmosphere with 5% CO2 at 37 °C.
Antibodies and Phalloidins
For Western blotting, the primary antibody used was mouse monoclonal anti-actin, clone C4 (1:1000; Merck, Millipore), 26 followed by a horseradish peroxidase (HRP)–conjugated goat anti-mouse secondary antibody (1:5000; GE Healthcare, Little Chalfont, UK).
For immunofluorescence, two phalloidin-conjugates were used to visualize F-actin: tetramethylrhodamine-phalloidin (TRITC-phalloidin; 1:1000; Sigma-Aldrich, St. Louis, Mo) 27 and, for higher resolution and z-stack imaging, Alexa Fluor 488-conjugated phalloidin (1:40; Invitrogen, Carlsbad, CA), which has been shown to exhibit brighter fluorescence and is more photostable than TRITC-conjugates. 28
Anticytoskeletal Compounds
Jasplakinolide (1 mM stock) and 1-(3,6-dibromo-9H-carbazol-9-ly)-3-(dimethylamino)propan-2-ol (N-WASP inhibitor; 50 mM stock) were purchased from Invitrogen and Vitas_M Laboratory (Moscow, Russia), respectively. Latrunculin A (1 mM stock) and etoposide (100 mM stock) were purchased from Sigma-Aldrich. We also used a lead antitropomyosin compound TR100 (50 mM stock), which was synthesized by Professor Adam McCluskey and Dr. Tim Hill, University of Newcastle. 29 All stock solutions were made up by reconstituting the drugs in anhydrous DMSO (Sigma-Aldrich). Relevant vehicle controls were used in all experiments.
Drug Treatments
U2OS cells were seeded at 2.5 × 10⁴ cells/mL in 10 cm plates, each containing two glass coverslips. Forty-eight hours postseeding, cells were treated for 4 h with either jasplakinolide (50 nM) or latrunculin A (500 nM) and left to incubate before cells were harvested and processed for a G-actin/F-actin assay or stained for immunofluorescence as outlined below. For TR100 (5 µM, 9 µM), treatment cells were incubated for 24 h.
For image acquisition with the Opera (PerkinElmer, Boston, MA) HCI system, SK-N-SH cells were plated at 2 × 10⁴ cells/mL in a CellCarrier-96 black plate (PerkinElmer). Twenty-four hours postseeding, cells were treated with either TR100 (5 µM), etoposide (10 µM), or 1-(3,6-dibromo-9H-carbazol-9-ly)-3-(dimethylamino)propan-2-ol (10 µM) and incubated for 24 h prior to staining.
Immunofluorescence Staining and Image Acquisition
Following drug treatment, cells were fixed in 4% (w/v) paraformaldehyde/phosphate-buffered saline (PBS) for 1 h. Cells were washed three times in PBS and permeabilized with 0.5% (v/v) Triton-X/PBS for 15 min. After three PBS washes, nonspecific binding was blocked with 1% (w/v) bovine serum albumin (BSA; Sigma-Aldrich)/PBS for 1 h. Cells were stained with TRITC-phalloidin or 488-phalloidin in 0.5% (w/v) BSA/PBS in the dark for 1 h or 20 min (respectively). Cells were counterstained with DAPI (Invitrogen) in PBS (1:10,000) for 5 min and were washed a further three times prior to mounting with either Immu-Mount (Thermo Fisher Scientific, Waltham, MA) or ProLong Gold Antifade Reagent (Invitrogen). All staining was carried out at room temperature (RT).
For the HCI, cells were fixed in 4% (w/v) paraformaldehyde/PBS for 15 min. Cells were washed three times in PBS and permeabilized in 0.5% (v/v) Triton-X/PBS for 5 min. Cells were then incubated with 488-phalloidin in 2% (v/v) fetal bovine serum (FBS)/PBS for 30 min followed by DAPI (1:10,000) in 2% (v/v) FBS/PBS for 5 min. Cells were washed a further three times and remained in PBS for imaging.
Epifluorescent images were taken using an Axioscope40 epifluorescent microscope (Zeiss, Oberkochen, Germany) using a 40× objective with AxioVision software (Zeiss). Confocal images were captured using a Leica SP5 2P STED confocal microscope (Leica Microsystems, Wetzlar, German) using a 63× objective (NA: 1.40) with Leica Application Suite Advanced Fluorescence software. For HCI, cells were imaged using the Opera High Content Screening System (PerkinElmer). Images were taken from randomly selected locations in each well using a 20× air objective.
Image Analysis
Image analysis was carried out with Workspace Image Analysis software, developed by the CSIRO. Workspace is a cross-platform framework for constructing workflows for a range of applications, including cellular analysis. Operations such as nucleus detection, cell detection, and filament detection can be combined flexibly into workflows customized for specific assays or experiments.
The novelty in our approach is not in the detection of nuclei or cells because there are many algorithms, both proprietary (trade secret) and published, for doing this. Our nucleus and cell detection operations have preprocessing steps to smooth the image, remove background intensity variation, and remove small bright structures (nucleoli for nucleus images and actin filaments for cell images). The automatic thresholding steps to segment the preprocessed nucleus and cell images are each controlled by a single sensitivity setting. The thresholding method, based on a bivariate histogram of input gray level versus gradient, is more reliable than methods based on the simple image histogram and is used in image normalization. 30 Touching cells are separated using a binary object-splitting technique with the labeled nuclei as seeds.
Our innovation is in quantifying the actin architecture by custom-designed linear structure measures, rather than by a texture analysis approach. In texture analysis, banks of features (such as Gabor filters) are calculated at different frequencies (or size) and orientations to characterize the range of linear structures that the actin architecture can form. Although this approach has the advantage that it can be applied to many different texture analysis applications, it requires many measures to be calculated, which makes it slow, and those measures have little meaning to biologists. We have chosen to detect the actin filaments using a sophisticated line detector and then to quantify the detected linear structures with a sparse set of custom features that are interpretable by biologists. These features are fast to calculate and hence more suited to the speed of processing required in high-throughput screening systems.
The filamentous structures are detected using a fast linear detection algorithm, which is an established technique for Neurite Outgrowth detection 31 in several commercial high-throughput cell-screening systems. This algorithm detects the actin filament bundles by finding the ridge lines of high local pixel intensity in the image using directional nonmaximum suppression. 32 Segmented lines tend to follow the path a human would trace, unlike methods that use thresholding followed by morphological thinning, or skeletonization, which do not necessarily lie at the brightest point within broad linear structures.
From the detected lines, the algorithm rapidly measures a small number of easily interpretable variables (
Each operation in the workflow includes a number of parameters that can be optimized to ensure that the analysis correlates with the biological truth. Changes in contrast between staining and background noise were adjusted for by changing background correction and threshold sensitivity settings, independent of parameters used in measuring cytoskeletal organization. For initial experiments, parameters were adjusted for each set of experiments being analyzed. When the antitropomyosin compound TR100 was tested, a less stringent set of parameters was used to test whether the algorithm was robust enough to compare multiple drug doses without further optimization. A number of parameters were optimized to achieve measurements that correlated most closely with filament bundle organization, which was confirmed by eye using an overlay of software output with the original image.
G-actin/F-actin In Vivo Assay
We used a second measure of cytoskeletal organization: the G-actin/F-actin in vivo assay (G-actin/F-actin assay) to detect the relative levels of G- and F-actin, as a measure of comparison for the linear feature algorithm. This was done using the G-actin/F-actin assay Biochem Kit according to the manufacturer’s instructions (Cytoskeleton Inc., Denver, CO). Briefly, cells were washed once in PBS and lysed with preheated (37 °C) F-actin stabilization and lysis buffer supplemented with 1 mM ATP and 1% protease inhibitor cocktail (Cytoskeleton Inc.). The lysates were incubated for 15 min at 37 °C and centrifuged at 2000 rpm for 5 min at 37 °C to pellet unbroken cells. Two hundred microliters of the supernatants were spun at 134,000g, 37 °C for 1 h in an ultracentrifuge (CS150NX Tabletop Micro Ultracentrifuge, Hitachi Koki Co. Ltd., Japan) to pellet the F-actin. Supernatants containing G-actin were removed, vortexed, and diluted with 4× sample buffer prior to being heated at 95 °C for 2 min. The F-actin pellets were resuspended in 200 µL of 8 M urea (Cytoskeleton Inc.) and incubated on ice for 1 h, vortexing every 15 min to allow for actin depolymerization. Sample was diluted in 4× sample buffer prior to heating at 42 °C for 5 min.
Gel Electrophoresis and Western Blot Analysis
Samples from the G-actin/F-actin assay were loaded onto 12.5% (w/v) acrylamide gels (10 µL G-actin, and 20 µL F-actin), with 5 µL of molecular mass markers (Precision Plus Protein Standards; Bio-Rad, Hercules, CA) and were run at 120 V for 2 h before proteins were electrophoretically transferred to PVDF membranes (Immunobilon-P; Millipore) at 80 V for 2 h on ice. Nonspecific binding was blocked with 5% (w/v) skim milk powder in TRIS buffered saline/0.1% (v/v) Tween-20 (TBST) overnight at 4 °C. Membranes were probed with the C4 antibody diluted in 2% (w/v) skim milk powder/TBST for 2 h at RT. After three 10 min washes in TBST, the membranes were incubated with an HRP-conjugated secondary antibody diluted in 2% (w/v) skim milk powder/TBST for 1 h at RT. Membranes were washed a further three times for 10 min in TBST, and protein bands were visualized using Western Lighting Chemiluminescent reagent (PerkinElmer Life Sciences) exposed on Fuji X-Ray Film (Kodak, Rochester, NY). Films were scanned using the LAS4000 (GE Healthcare), and densitometric analysis was performed using ImageJ 1.45s (National Institute of Health, Bethesda, MD). As there are no loading controls when doing the G-actin/F-actin assay, loading and transfer efficiency were checked by poststaining the membranes in Coomassie Brilliant Blue (Sigma-Aldrich).
Statistical Analysis
Statistical analysis was performed using a two-tailed t test in which two conditions were compared or a one-way analysis of variance in which three or more conditions were compared (GraphPad Prism 5.0; GraphPad, La Jolla, CA). Values are expressed as 95% confidence intervals (CIs), and values of p < 0.05 were considered statistically significant. For cells imaged on the Opera HCI, values of p < 0.001 were considered significant. The Z′ factor was calculated to measure the robustness of the assay, as described previously. 33
Results
Overview of Image Analysis Using the Algorithm
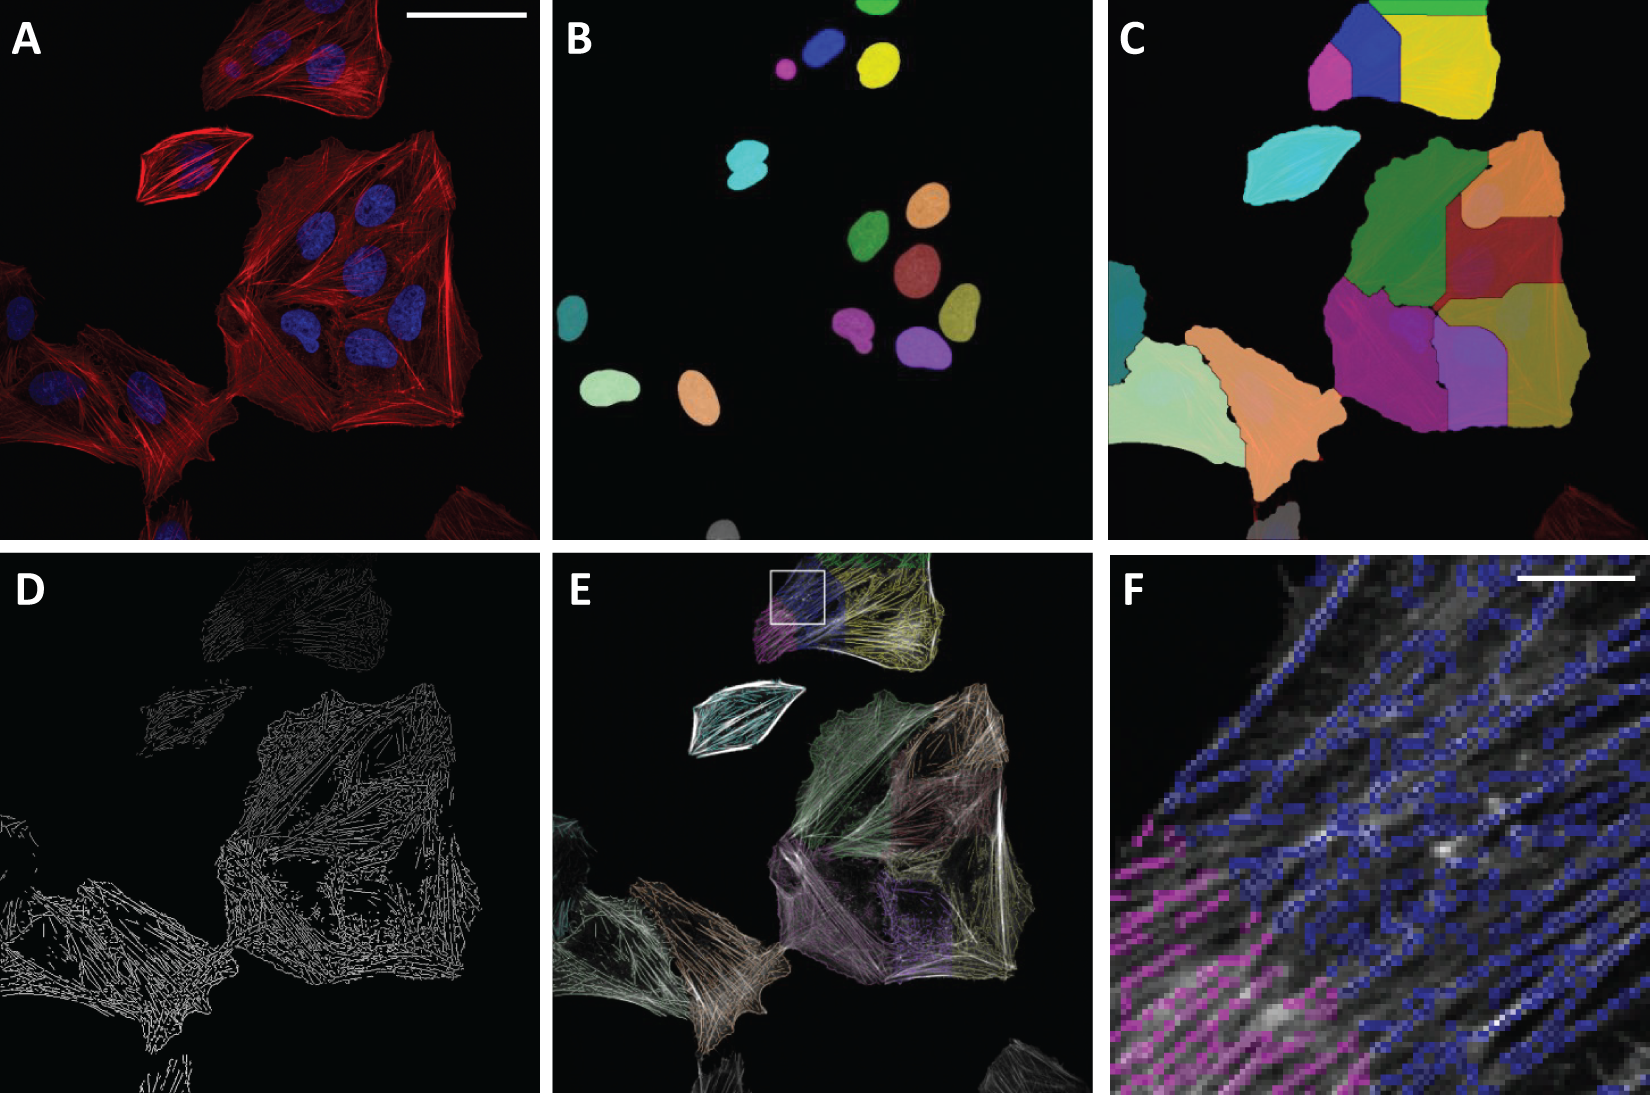
U2OS cells were chosen as a cell model as they had the most well-defined organization of the actin cytoskeleton, which showed consistent changes following drug treatments. Representative images of these cells (
Fig. 1A
) were analyzed using the algorithm. The software first segments the DAPI stained nuclei, producing separate labels for each nucleus and hence a count of the number of cells (
Fig. 1B
). The cells are then segmented, and touching cells are separated and labeled in accordance with the labeled nuclei (
Fig. 1C
). Filamentous structures, or bundles, are then detected by finding the ridge lines in local pixel intensity (
Fig. 1D
). These lines are labeled by cell number and can be overlaid on the original image (
Fig. 1E
) to enable a visual check of the accuracy of the filament segmentation (
Fig. 1F
; enlargement of inset
1E
). The measurements that quantify the linear structures, on a per-cell basis, are exported into a table (
Software flowchart. (
There Is No Significant Difference in Measurements Obtained from a Single Plane or z-Stack Image
We first determined whether an approach based on confocal or wide field microscopy would be more suitable for image analysis. Comparing images taken from both microscopes revealed that confocal imaging was necessary to provide the definition needed to quantify cytoskeletal organization. Images taken on a wide field microscope lacked definition, and only the thickest filament bundles could be distinguished; the high background noise within cells was often picked up as a linear feature when images were analyzed and was unsuitable for quantification (
One potential concern, however, surrounds imaging cells through a single focal plane. Actin filaments are not all located in one plane. In addition, the rounding of cells after drug treatment may result in a redistribution of filaments rather than their disruption. We therefore investigated whether analysis of filament disruption in a single plane was representative of total filament disruption within a cell through the use of latrunculin A, which causes profound disruption of actin filament organization. A series of images encompassing the entire volume of a cell (z-stack) was merged using a maximum projection and compared with an image taken in a single focal plane, where the most filament bundles were seen in both control and latrunculin A (500 nM) treated cells. We used the linear feature detection algorithm to quantify parameters representative of actin cytoskeletal organization actin filament length/cell area and actin filament intensity/cell area measured by averaging the intensity of pixels within filaments. Although there were more filaments and the staining was more intense in the z-stack compared with a single plane image ( Fig. 2A , C versus 2E , G ), image analysis revealed that both image types showed a comparable drop in number and intensity of filaments between the two treatment groups ( Fig. 2I , J ).
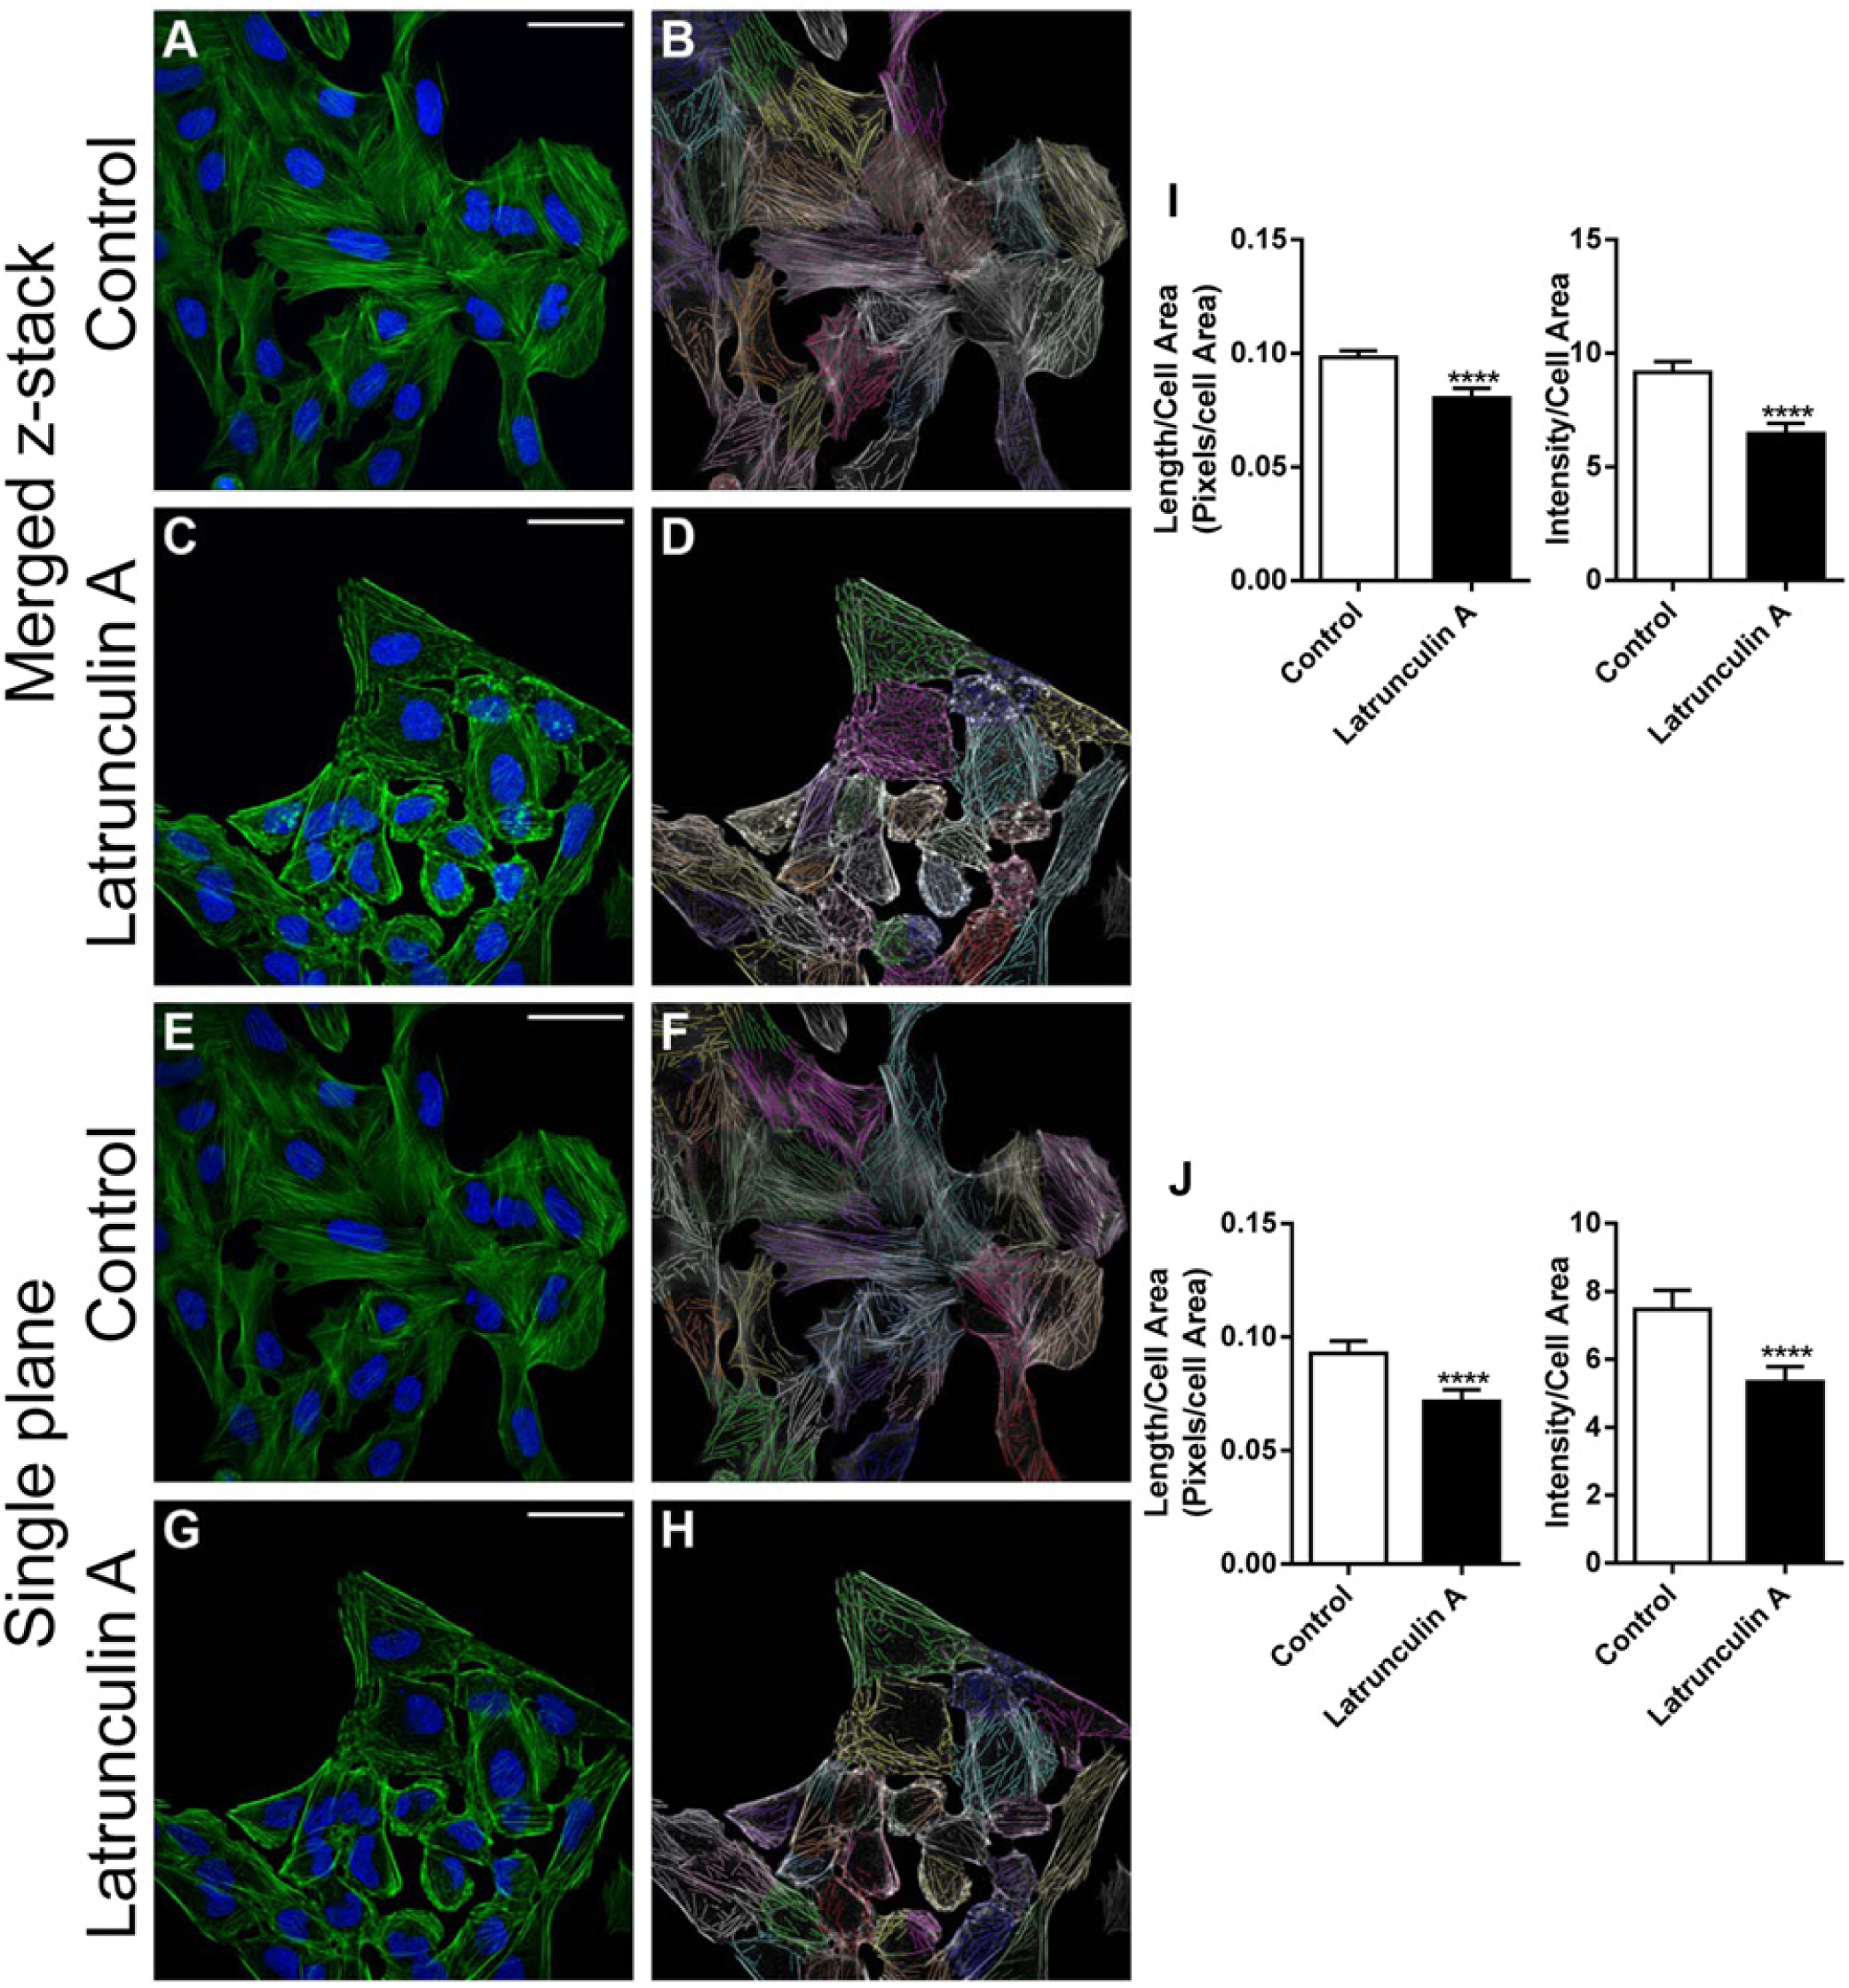
Comparison of images from a single plane and a merged z-stack. U2OS cells were either treated with DMSO (
Software Analysis of Immunofluorescent Images after Treatment of U2OS Cells with Latrunculin A Corresponds with the Biological Truth
To assess the use of additional parameters and to assess the linear feature detection algorithm’s suitability in analyzing multiple images encompassing large cell numbers, U2OS cells were treated with a well-characterized actin depolymerizing agent, latrunculin A. We quantified changes in actin organization using both the G-actin/F-actin assay, which measures relative levels of G-/F-actin within cells, to act as a biochemical measure of comparison, and the algorithm.
Densitometric analysis of a G-actin/F-actin Western blot (
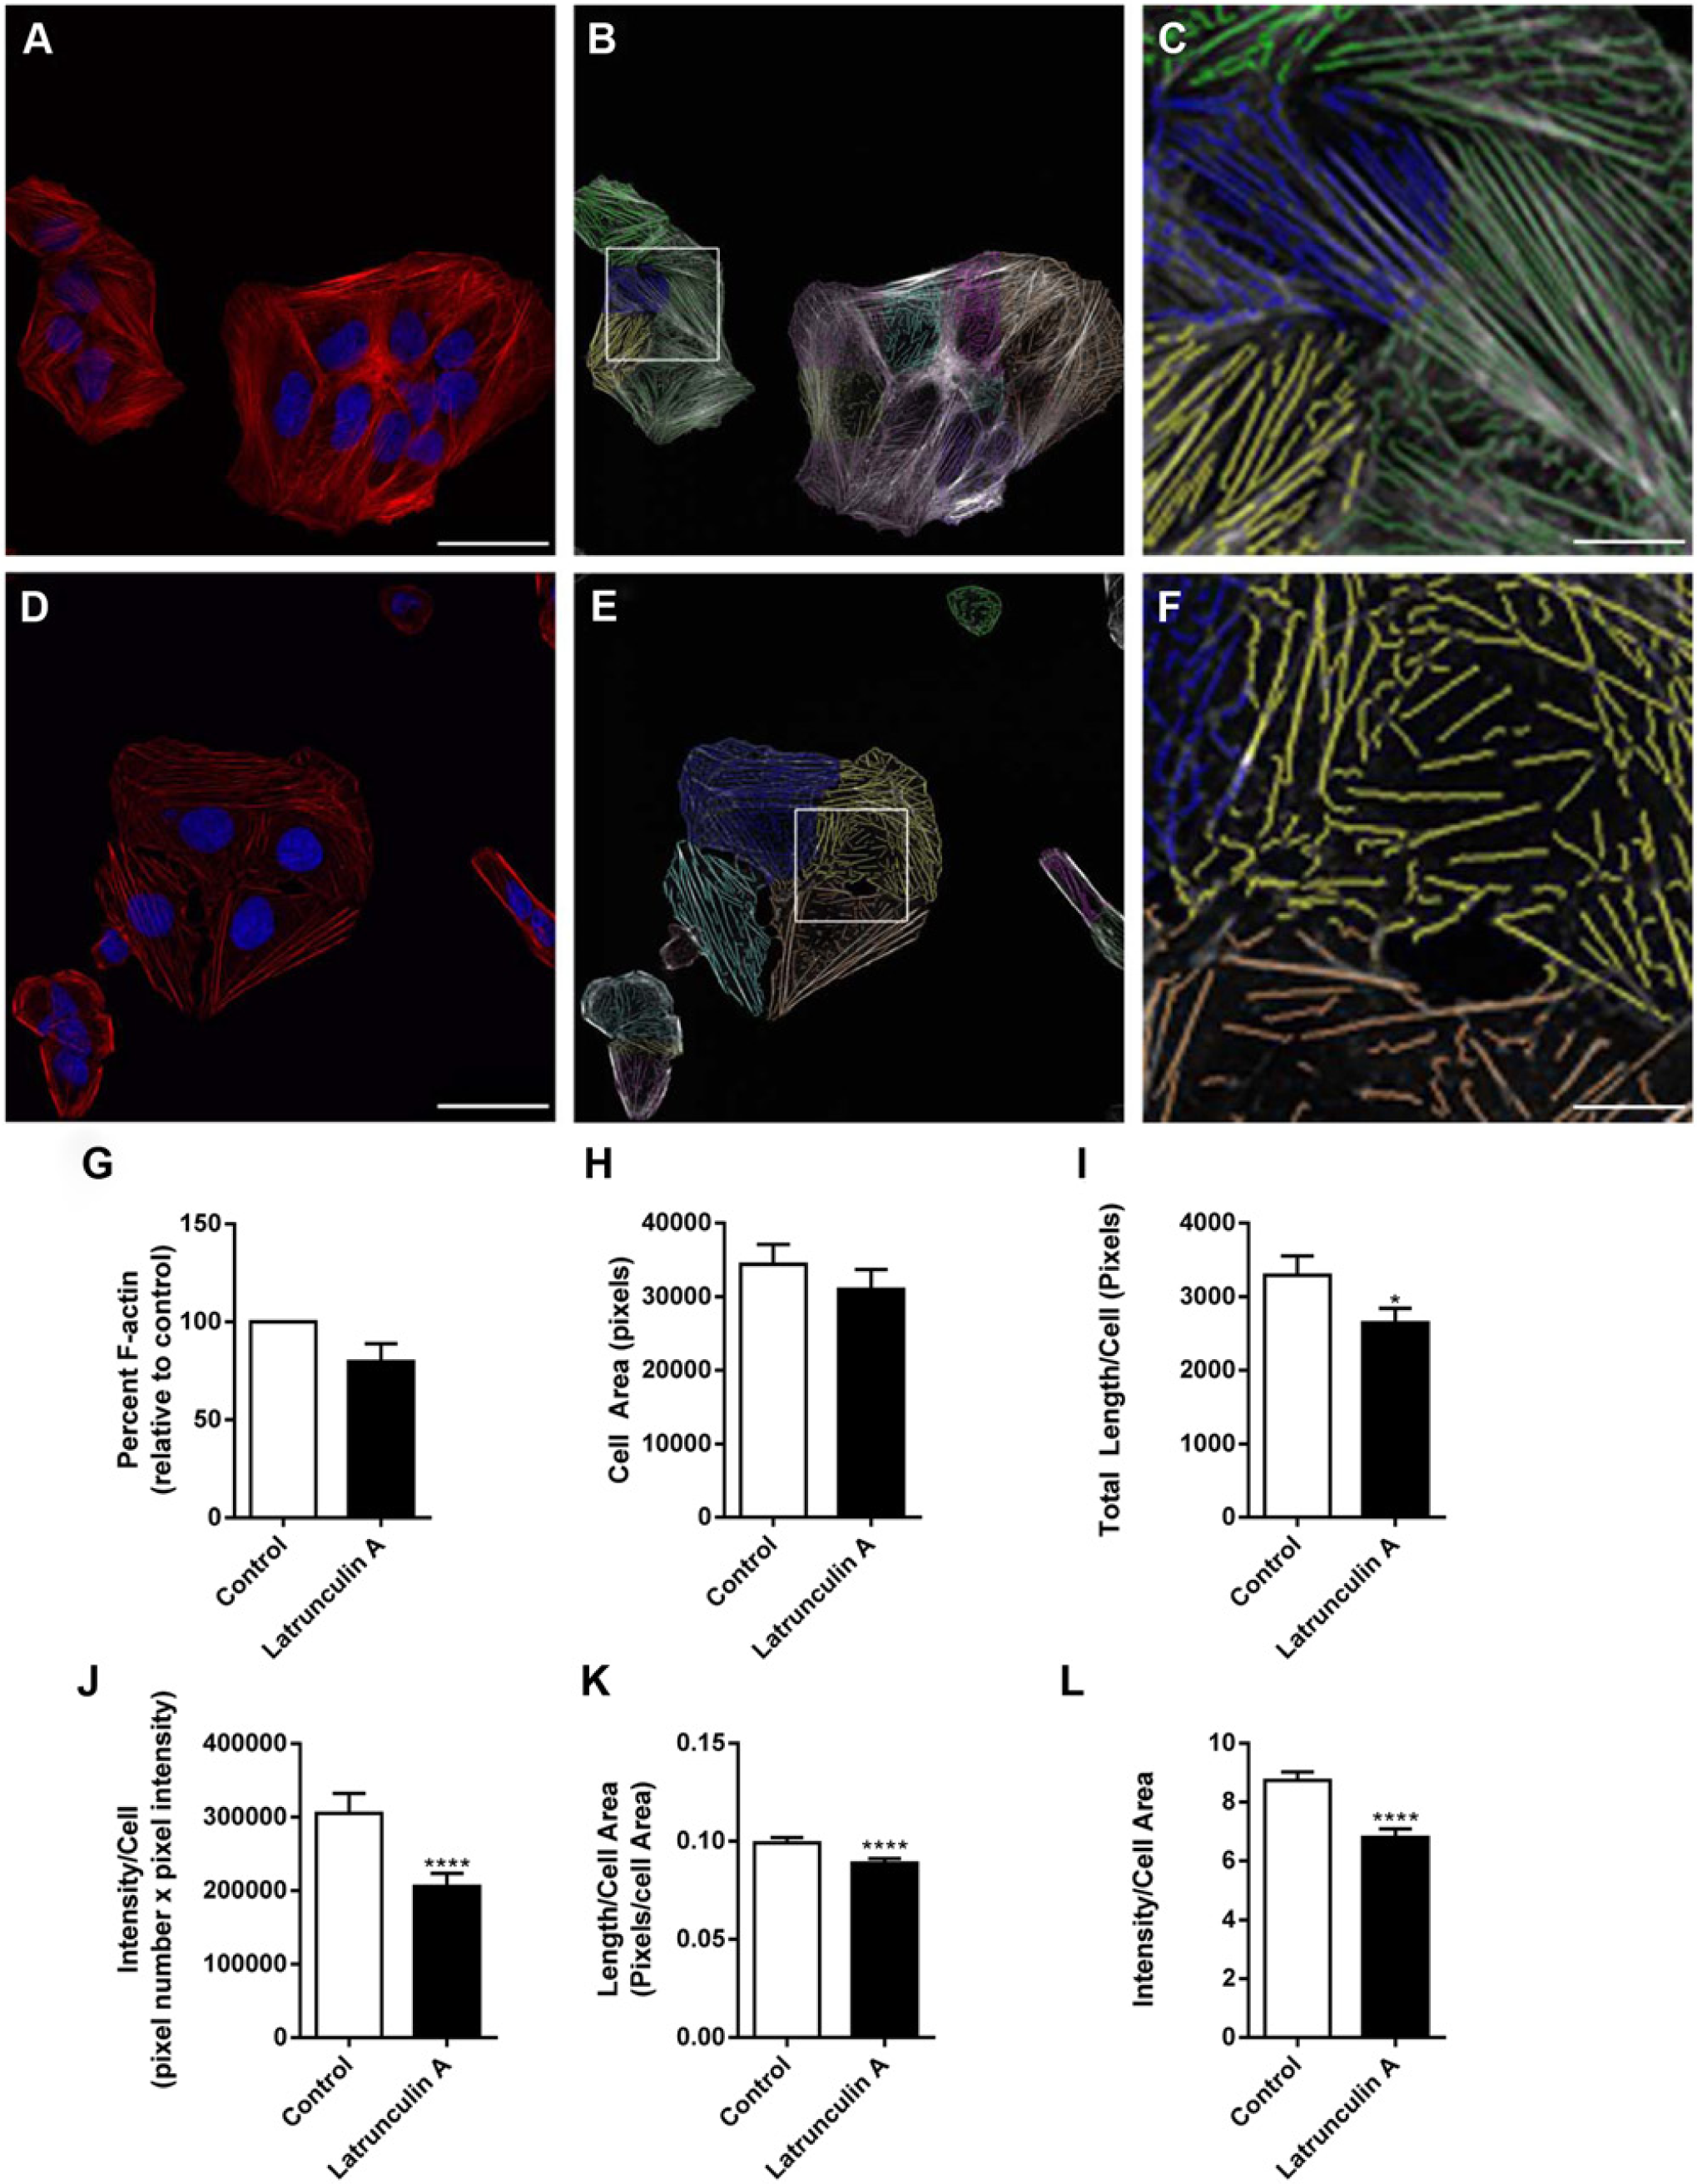
Latrunculin A causes profound changes in actin cytoskeletal organization. Image analysis from representative immunofluorescent images of U2OS cells treated with DMSO (
An Increase in F-actin Resulting from Treatment of U2OS Cells with the Filament-Stabilizing Compound Jasplakinolide Was Not Quantifiable through Image Analysis
We next assessed whether the algorithm was able to quantify changes in cytoskeletal organization after the addition of a well-characterized actin stabilizing agent jasplakinolide. Densitometric analysis of G-actin/F-actin Western blots (
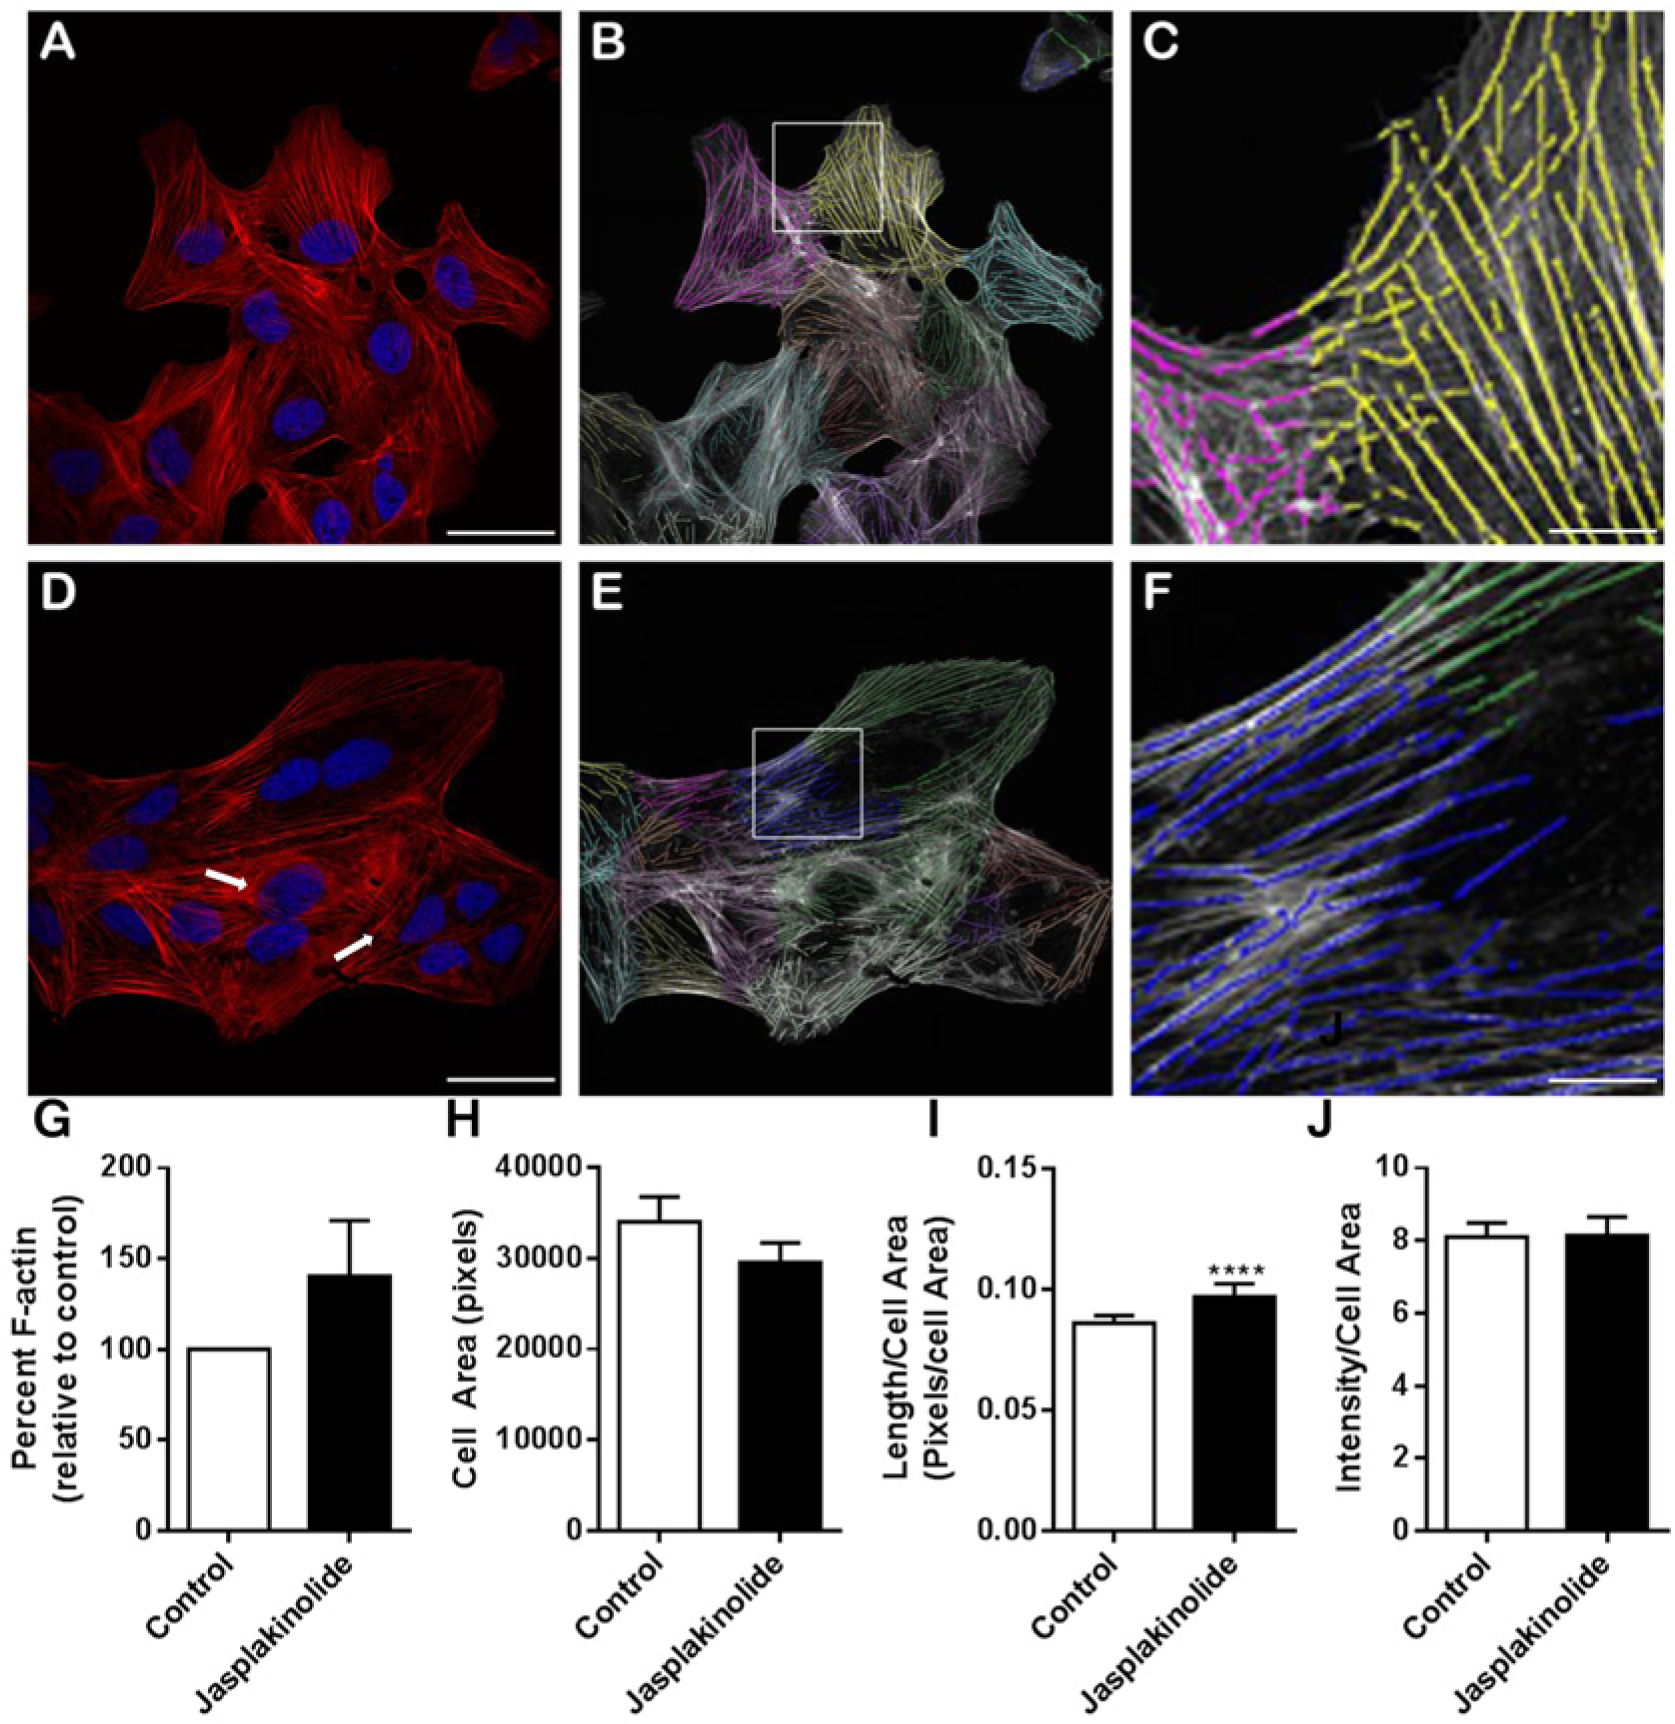
Image analysis of cells treated with the actin filament stabilizing agent jasplakinolide. Image analysis from representative immunofluorescent images of U2OS cells treated with DMSO (
Quantitation of Cytoskeletal Changes through Image Analysis Can Be Used with Compounds That Indirectly Target the Actin Cytoskeleton
We then determined whether the algorithm could be used to assess the impact of a novel class of anticytoskeletal compounds, which indirectly targets the actin cytoskeleton. Cells were treated with two doses of a tropomyosin-targeting compound TR100 (5 µM, 9 µM). TR100 affects tropomyosin polymerization along actin filaments 34 , resulting in a dose-dependent loss of filament bundles. General immunofluorescence observations were that there was a dose-dependent disruption of actin filament bundles in the TR100-treated cells ( Fig. 5A , D , G ). Thirty images from three experiments were analyzed using the algorithm ( Fig. 5B , E , H ). There was a significant reduction in cell area in the highest dose compared with both the 5 µM treatment group and the control ( Fig. 5J ). There was a dose-dependent decrease in both parameters used to measure cytoskeletal organization: filament length/cell area ( Fig. 5K ) and filament intensity/cell area ( Fig. 5L ). Immunofluorescence observations and results of image analysis using the algorithm were in agreement with our predicted outcomes. Initial experiments using the G-actin/F-actin assay on cells treated with 8 µM TR100 showed a small reduction in the relative levels of F-actin, although this was not statistically significant. The difference in the relatively small drop in F-actin seen when using the G-actin/F-actin assay and clear filament disruption seen after treatment with 9 µM TR100 was expected, as TR100 targets only tropomyosin, which provides filament stability, in contrast to latrunculin A and jasplakinolide, which directly target the levels of G-actin/F-actin. These results show that the algorithm is able to quantify changes to the actin cytoskeletal organization independent of changes to the G-actin/F-actin levels, making it a powerful tool when screening drugs that indirectly target the actin cytoskeleton.
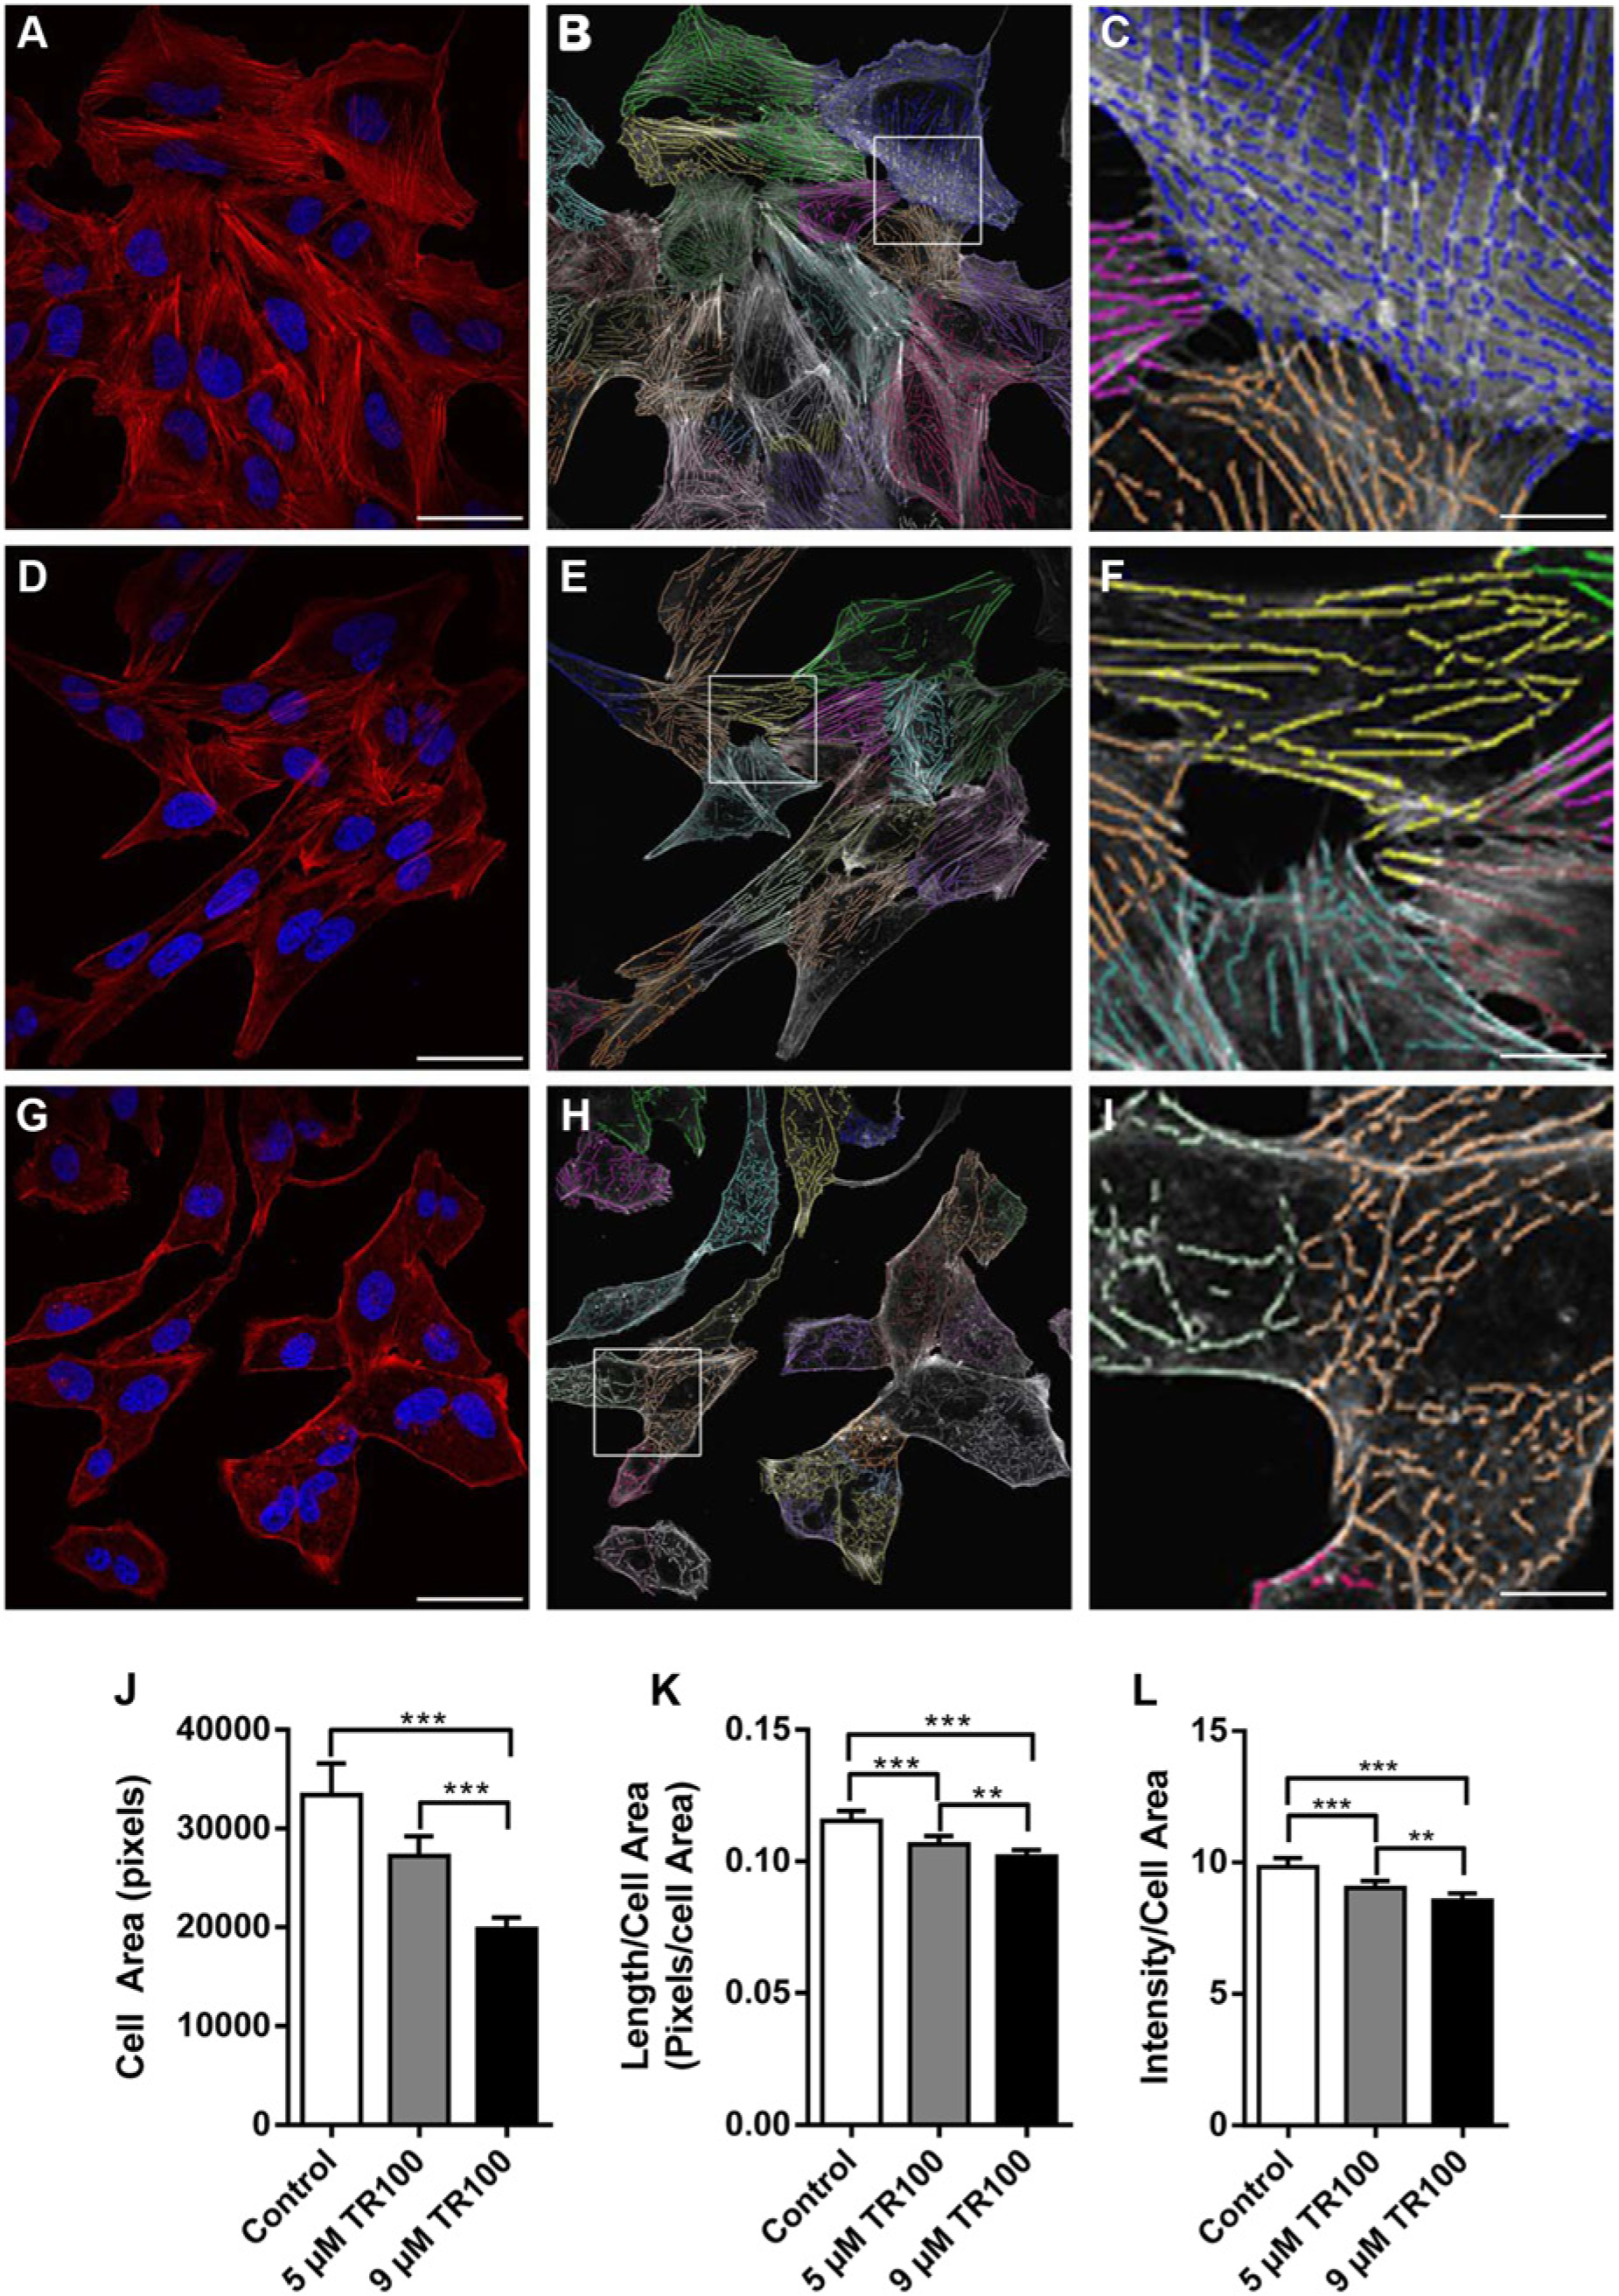
Image analysis of a comparison between a minor and major impact to the actin cytoskeleton using the tropomyosin-targeting compound TR100. U2OS cells were treated with either DMSO (
The Algorithm Can Be Used to Analyze Images Taken on an HCI Platform
Finally, we used the algorithm to analyze images of cells in a 96-well plate format on the Opera HCI to determine whether its use could be applied to a high-content screening platform. To also demonstrate that it was robust across different cell types, SK-N-SH neuroblastoma cells were treated in triplicate with three compounds at varying doses; actin-targeting compounds TR100 (5 µM) and 1-(3,6-dibromo-9H-carbazol-9-ly)-3-(dimethylamino)propan-2-ol (10 µM), a tropomyosin and an N-WASP inhibitor, respectively, were used as positive controls, as they have been shown to have a significant impact on the organization of the actin cytoskeleton. 1 Etoposide (10 µM), a topoisomerase inhibitor, used extensively in the clinic, was used as a negative control as it induces cell death without affecting the organization of the actin cytoskeleton. The TR100-treated cells were significantly affected ( Fig 6A versus 6B ), and analysis revealed a significant decrease in filament length/cell area ( Fig. 6C ). In contrast, the cells treated with etoposide showed no obvious morphological changes ( Fig 6D versus 6E ), and the drug had no effect on filament length/cell area. Cells treated with the N-WASP inhibitor ( Fig 6G versus 6H ) were found to have a significant drop in filament length/cell area compared with control ( Fig. 6I ).
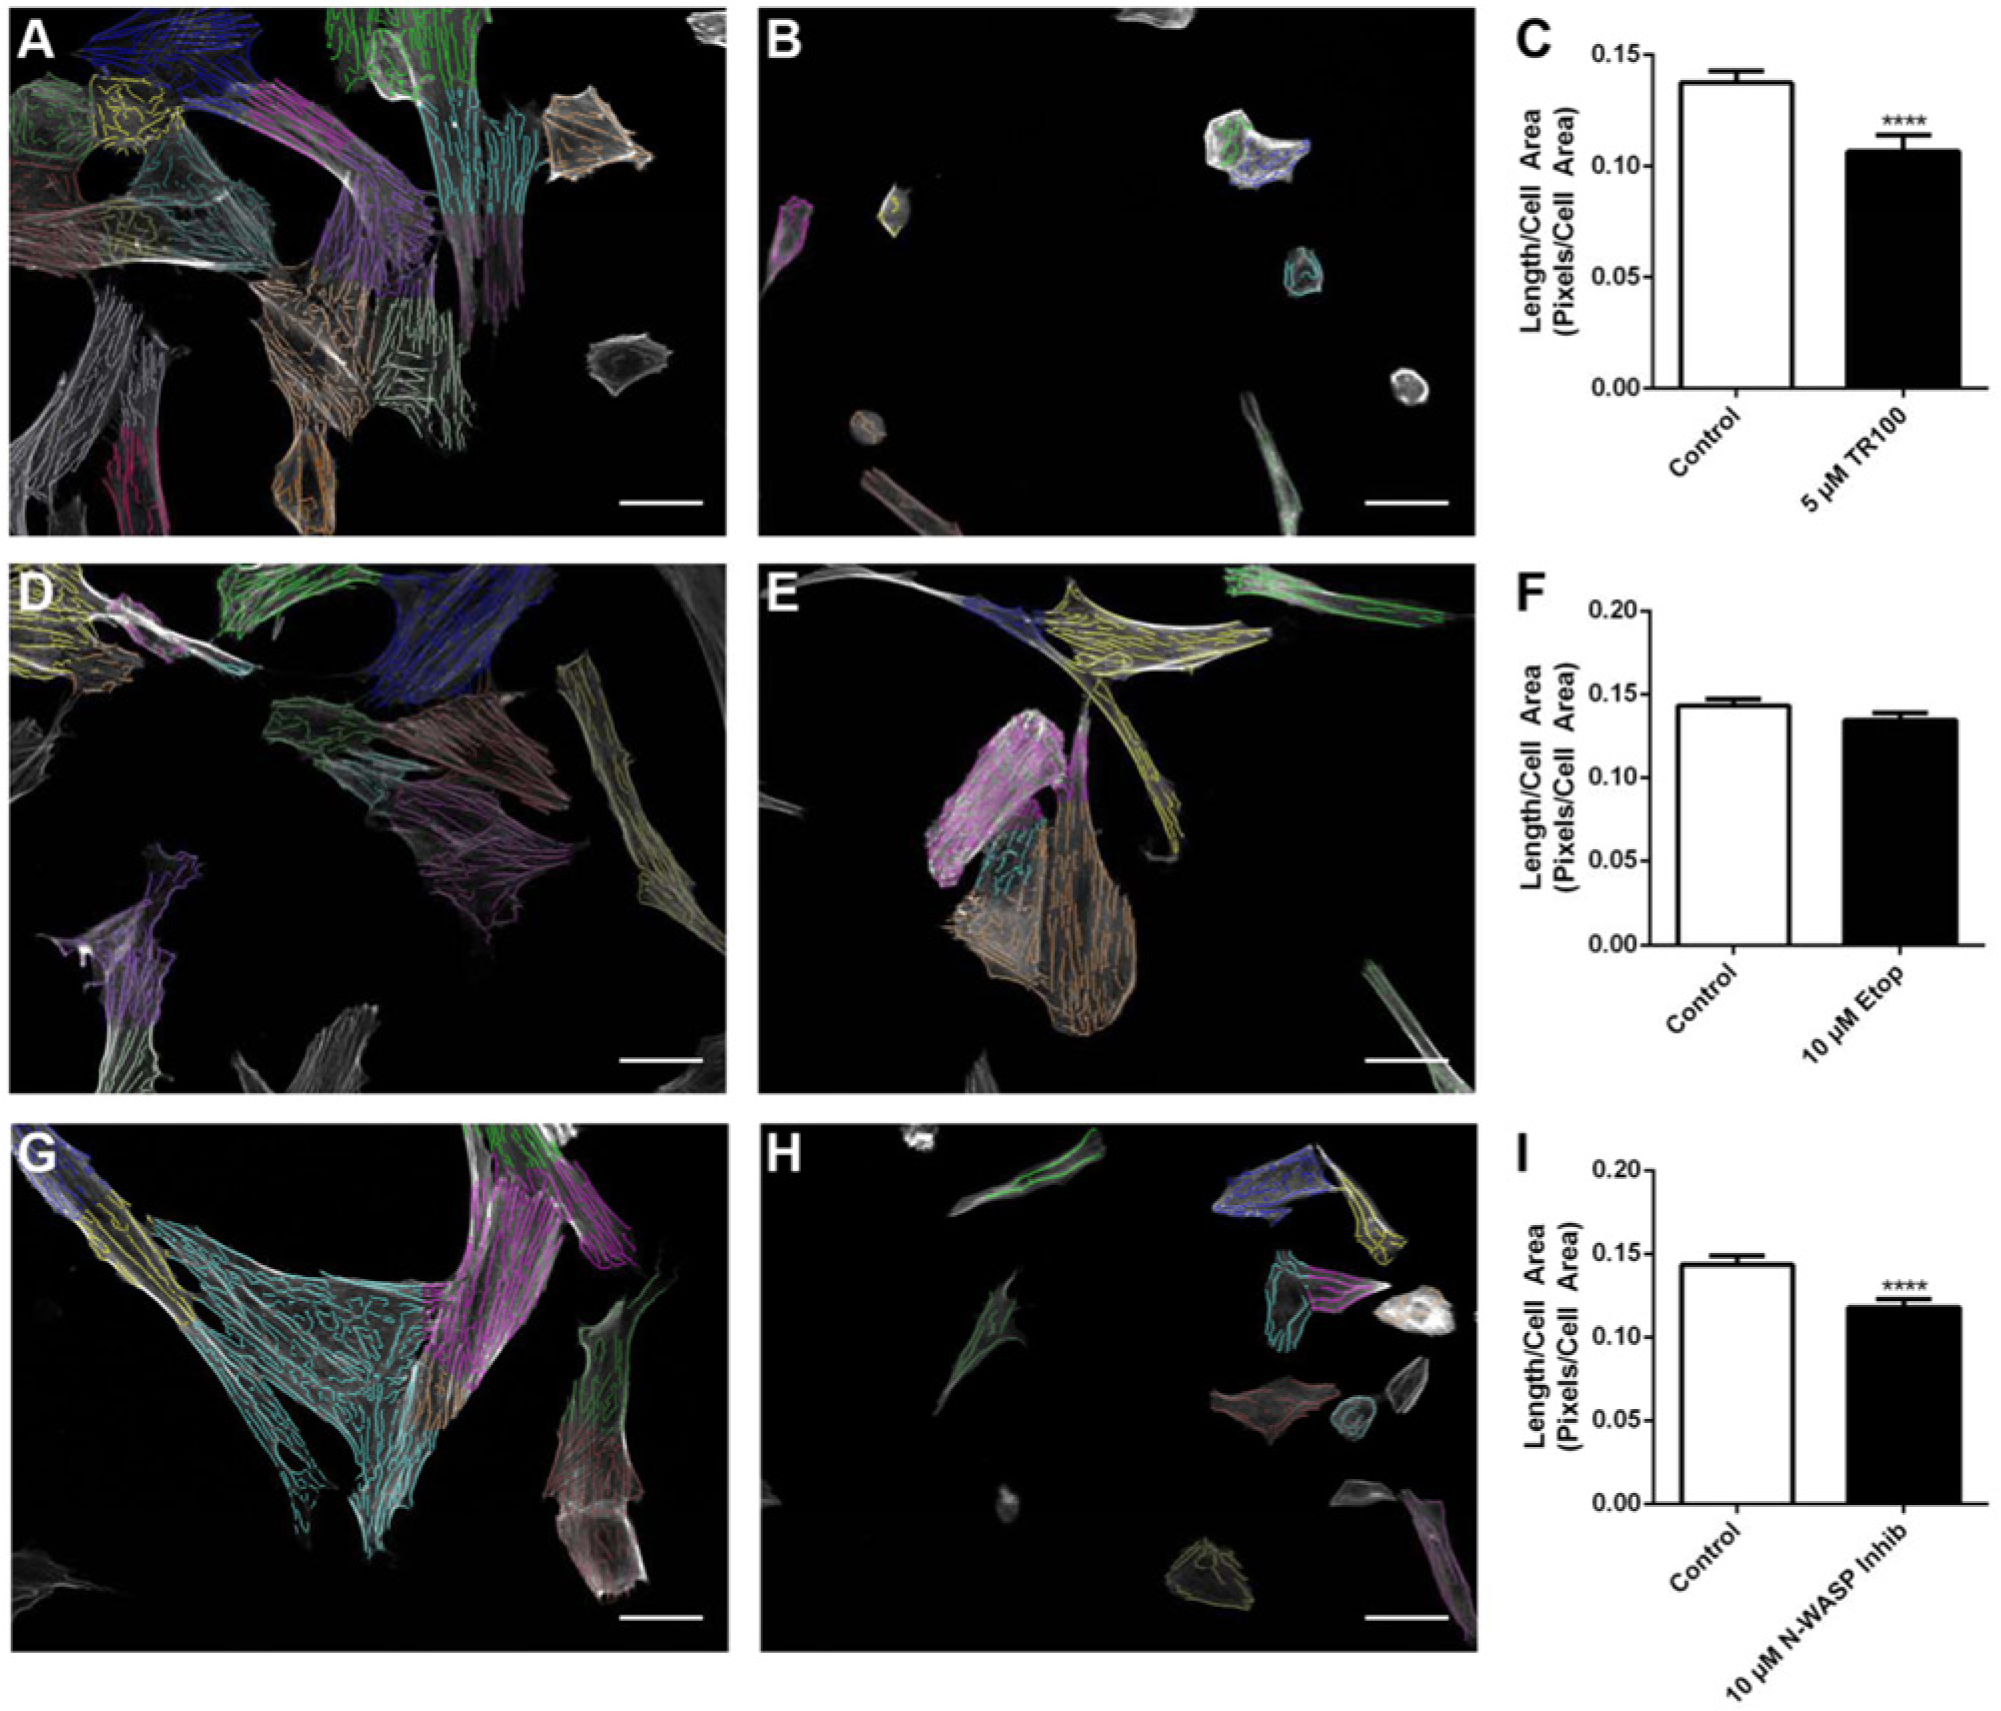
Analysis of images from the Opera high content screening system of drug-treated SK-N-SH cells. Overlay grayscale images and actin filament bundles detected by the software of control and drug-treated cells treated with either 5 µM TR100 (
To determine whether the quantification of filaments by the algorithm was suitable for an HCI platform, we calculated the Z′ factor for a number of parameters in cells that had been treated with, or without, TR100 (5 µM). We found that changes in cell area, which is regularly used to measure the impact on the actin cytoskeleton, gave a robust Z′ of 0.52. Actin filament parameters, such as filament intensity/cell and actin filament length/cell, gave Z′ factors of 0.75 and 0.42, respectively. Although Z′ factors of more than 0.5 are considered robust, 33 the measurements were made prior to assay optimization. We believe that when optimized, these additional actin quantifying parameters will be robust measurements that can be used in HCI. These results demonstrate that the algorithm is capable of quantifying changes in the actin cytoskeleton and distinguishing between compounds that do affect the cytoskeleton and those that do not in a format consistent with high-content screening.
Discussion
We have described and validated the use of a linear feature detection algorithm capable of analyzing changes in actin filament organization for use in screening for anticytoskeletal compounds in a cell-based system. For this algorithm to make accurate measurements, it is essential that image quality is of the highest standard. Using wide field microscopy, because of the lack of optical resolution, the algorithm could not distinguish between pixel intensity in filaments and that from areas containing what appeared to be diffuse phalloidin staining (
As actin filaments are ubiquitously distributed within cells and confocal images capture only a single slice of a cell’s total volume, we compared images taken in a single plane with merged z-stack images, which encompassed the entire volume of the cell. This was done in control and drug-treated cells to ensure that the changes seen in a single focal plane matched what was occurring throughout the whole cell. Results indicated that in both control and drug-treated groups, the majority of the filaments were confined to a single plane near the base of the cells and that analysis of a single image of this plane contained sufficient detail to quantify changes in actin filament organization using the algorithm.
We next determined whether the algorithm was able to quantify changes in actin cytoskeletal organization over multiple images using a G-actin/F-actin assay as a biochemical comparison. We used latrunculin A as it has been previously well characterized as an actin filament–destabilizing agent, making it ideal for use in validating the linear feature detection algorithm. Image analysis to quantify changes in the actin cytoskeleton following latrunculin A treatment gave results consistent with previous research. 9 Visual inspection of the overlay of the filament bundles as determined by the algorithm and the original grayscale image indicated that these measurements matched our visual interpretation of filament bundle localization. The decrease in percentage of F-actin using the G-actin/F-actin assay correlated with the reduction in all measurements calculated by the algorithm. The relatively small decrease in the total percentage of F-actin in the latrunculin A cells was unexpected and highlights a major limitation with the G-actin/F-actin assay in that there is no way to distinguish between F-actin in filament bundles and F-actin in aggregates and provides little information about cytoskeletal organization. The use of the algorithm has several advantages over the G-actin/F-actin assay in that it was able to analyze selectively only filament bundles while disregarding aggregates and is more efficient and robust in its quantification of the organization of F-actin bundles across large numbers of cells on a per cell basis.
We then used jasplakinolide, an actin filament–stabilizing compound, to determine whether the algorithm was able to quantify changes in cytoskeletal organization associated with an increase in F-actin. The results from the G-actin/F-actin assay showed a trend for an increase in F-actin; however, only one measurement of cytoskeletal organization confirmed this change after image analysis was performed using the algorithm. The levels of G-actin and F-actin given from the G-actin/F-actin assay provide no indication of where within the cell or how the cytoskeleton is reorganized to cause an increase in F-actin. Similar to the analysis of cells treated with latrunculin A, the algorithm was able to both quantify changes in filament bundle length and detect the difference between filamentous actin bundles and F-actin aggregates, giving a more accurate view about the changes in F-actin organization.
To demonstrate that the algorithm was able to quantify changes associated with drugs that indirectly target the actin cytoskeleton, we used it to quantify changes in cytoskeletal organization after cells were treated with a novel anticytoskeletal compound TR100. TR100 inhibits the ability of tropomyosin to stabilize filament bundles. Thus, we expected to see a loss of thick long filament bundles and an overall disorganization of the actin cytoskeleton after 24 h treatment with TR100. Staining seen in drug-treated cells appeared diffuse. As conjugated-phalloidins bind only to F-actin, the diffuse staining highlights that despite the near complete loss of filament bundles, the actin is still in its filamentous form. This observation matched previous results using the G-actin/F-actin assay to quantify changes in the G-/F-actin levels in cells treated with 8 µM TR100. The results from this assay showed only a slight drop in levels of F-actin, indicating that these changes occur independent of changes in the levels of G-/F-actin. The ability of the algorithm to measure dose-dependent changes that are independent of a change in relative levels of F-actin highlights its sensitivity and suitability for use in the screening of compounds that target the actin cytoskeleton.
Most importantly, we have demonstrated that this algorithm can be used to quantitate changes in actin filament organization using images generated from an HCI platform. HCI experiments performed with SK-N-SH neuroblastoma cells have also shown that quantitation using this algorithm is robust across different cells lines. As parameters set for imaging on the Opera HCI are fixed and variation in staining intensity across cells in the same treatment group was negligible when compared with data from confocal microscopy, filament length/cell area was the parameter used to assess drug impact on the cytoskeleton. As expected, the cells treated with TR100 and the N-WASP inhibitor showed a significant drop in filament length/cell area. Cells treated with etoposide, which does not target the cytoskeleton, showed no significant change in filament length. These data indicate that the algorithm is robust enough to quantify changes in cytoskeletal organization using an HCI platform, and it is also sensitive enough to be able to discriminate between compounds that can target the actin cytoskeleton and those that do not.
The idea of quantifying changes in cytoskeletal organization using an algorithm based on one used to quantify neurite outgrowth has some minor limitations that need to be taken into account. First, organization and complexity of a neurite is relatively simple compared with the complexity of the actin cytoskeleton. Neurites are often visualized as single branching lines with clear contrast between them and the background, making them ideal structures to quantify using a number of algorithmic approaches. 32 The actin cytoskeleton, however, is a complex network of single filaments bundled together and regulated by a plethora of ABPs. 1 Although the algorithm is able to pick up obvious bundles that have well-defined functions, populations of very thin filament bundles made up of only a few actin filaments are not always detected. Although this may be limiting in detecting subtle changes in these thin filament populations, these filaments are difficult to visualize and therefore not an ideal readout in terms of measuring drug impact using a high-content screening approach.
Our study demonstrates that this linear feature detection algorithm can quantify changes in the actin cytoskeleton with both well characterized and novel anticytoskeletal agents. Although the use of computational methods to quantify cytoskeletal organization is not a new concept, 35 and despite some promising publications, there is still no recognized method to quantify changes in actin organization. 36 Many of these techniques simply are too slow, labor intensive, or lack the flexibility for a high-throughput assay. 32 This algorithm is designed for rapid analysis and is based on an algorithm whose versatility has already been demonstrated in high-throughput analysis. 31 Its use removes the potential for subjective analysis as all cells in a field of view are quantified, preventing observer bias and by only measuring filamentous structures avoids potential artifacts created due to changes in background intensity as cells round up associated with measures of fluorescence intensity. Finally, the algorithm’s sensitivity in quantifying a dose-dependent decrease in cells treated with the tropomyosin-targeting compound ( Fig. 5A versus 5D versus 5G ) demonstrates that it is capable of quantifying subtle changes without bias, which previously would require the use of further experimentation.
We have shown that use of the linear detection algorithm is a valid approach to measure changes in actin cytoskeletal organization in a cell-based system. We have also demonstrated that once optimized, it can be applied to determine the impact that a number of anticytoskeletal compounds such as the ones used in our laboratory have on the actin filament system. Furthermore, it is robust enough to quantify images taken on an HCI platform, and thus its use could be extended to HCI applications. To our knowledge, this is the first software that has been validated to quantify changes in cytoskeletal organization through demonstrating a correlation with the biological truth using a well-characterized anti-actin compound latrunculin A and more novel anticytoskeletal targeting compounds. Its ability to process hundreds of images in only a few minutes makes it applicable for use in high-throughput screening for potential chemotherapeutic agents that affect the actin cytoskeleton in tumor cells.
Footnotes
Acknowledgements
We would like to thank the Biomedical Imaging Facility (University of New South Wales) and Ms. Alyce Nehme for their excellent technical assistance, the ACRF Drug Discovery Centre for Childhood Cancer for help with the HCI, and Ms. Ashleigh Swain for critical reading of the manuscript. We would also like to thank the CSIRO Workspace Team for developing the Workspace package, and CSIRO Quantitative Imaging Team for developing the underlying image analysis functions, and, in particular, Dr. Yulia Arzhaeva for developing the Image Analysis Plugin for Workspace. Our thanks also to Dr. Michael Buckley (CSIRO Mathematics, Informatics and Statistics) for assistance with the statistical analysis.
Declaration of Conflicting Interests
The authors declared no potential conflicts of interest with respect to the research, authorship, and/or publication of this article.
Funding
The authors disclosed receipt of the following financial support for the research, authorship, and/or publication of this article: This work has been supported by two funding bodies: generous donations from The Kids Cancer Project and a National Health and Medical Research Council (NHMRC) project grant (APP1004188). Justine Stehn was supported by a Childhood Cancer Cytoskeletal Consortium (C4) Research Fellowship.
References
Supplementary Material
Please find the following supplemental material available below.
For Open Access articles published under a Creative Commons License, all supplemental material carries the same license as the article it is associated with.
For non-Open Access articles published, all supplemental material carries a non-exclusive license, and permission requests for re-use of supplemental material or any part of supplemental material shall be sent directly to the copyright owner as specified in the copyright notice associated with the article.