
Abstract
The lysosome is a vital cellular organelle that primarily functions as a recycling center for breaking down unwanted macromolecules through a series of hydrolases. Functional deficiencies in lysosomal proteins due to genetic mutations have been found in more than 50 lysosomal storage diseases that exhibit characteristic lipid/macromolecule accumulation and enlarged lysosomes. Recently, the lysosome has emerged as a new therapeutic target for drug development for the treatment of lysosomal storage diseases. However, a suitable assay for compound screening against the diseased lysosomes is currently unavailable. We have developed a Lysotracker staining assay that measures the enlarged lysosomes in patient-derived cells using both fluorescence intensity readout and fluorescence microscopic measurement. This phenotypic assay has been tested in patient cells obtained from several lysosomal storage diseases and validated using a known compound, methyl-β-cyclodextrin, in primary fibroblast cells derived from Niemann Pick C disease patients. The results demonstrate that the Lysotracker assay can be used in compound screening for the identification of lead compounds that are capable of reducing enlarged lysosomes for drug development.
Keywords
Introduction
Lysosomal storage diseases (LSDs) are a group of approximately 50 genetic diseases caused by mutations in genes encoding lysosomal proteins that involve degradation and trafficking of cellular macromolecules. 1 Although the incidence of each individual disease is ~3 to 6 patients per million, the combined prevalence of LSDs in a given population is 1:5000 to 1:10,000. 2 The clinical manifestations and onset of LSDs vary significantly among the diseases and patient population. Hepatomegaly and splenomegaly are common symptoms for LSDs. Symptoms related to central nervous system and neuronal degeneration occur in more than half of the patient population. Currently, enzyme replacement therapy (ERT) is available for a limited number of LSDs including Gaucher, Fabry, Pompe, mucopolysaccharidosis (MPS) I, and MPS VI, 3 whereas no effective treatment is available for the majority of LSDs. ERT requires lifetime treatment and is associated with high cost and other complications, such as autoimmune response. 4 The neuronal manifestations of LSDs are not alleviated by ERT because of its inability to penetrate the blood-brain barrier. Substrate reduction therapy has also been developed for the treatment of Gaucher, Tay-Sachs, and Sandhoff diseases, 5 where an enzyme inhibitor suppresses the production of a precursor molecule to decrease the accumulation of that precursor in the lysosome. Although other therapeutic approaches, including bone marrow transplantation, gene therapy, and small-molecule chaperone, have been reported, their efficacies in patients are currently being investigated or to be studied. 6
The lysosome is a cellular organelle that contains a series of hydrolase enzymes and proteins responsible for the degradation of lipids and unwanted macromolecules and the trafficking of these molecules out of lysosomes. Deficiency in these enzymes or proteins causes accumulation of lipids, glycoproteins, and/or other materials in the lysosome, resulting in enlarged lysosome size. It may also lead to loss of cellular function and ultimately cell death. Many LSDs with neuronal involvement are accompanied by neuronal degeneration, which is a leading cause of patient death.
Recently, lysosomal exocytosis has emerged as a new therapeutic target for drug development in the treatment of LSDs.7,8 Lysosomal storage material and proteins have been found in extracellular fluids, blood, and urine in some LSD patients, providing direct evidence of lysosomal exocytosis in the LSD patients. 9 Reduction of enlarged lysosomes in several cell-based disease models has been observed by overexpressing bHLH-leucine zipper transcription factor EB. 8 In addition, lysosomal cholesterol accumulation and enlarged lysosomes in patient cells derived from Niemann Pick type C (NPC) disease were significantly reduced in the presence of methyl-β-cyclodextrin (MβCD) and delta-tocopherol, where the enhancement of lysosomal exocytosis was observed.10,11 The effect of delta-tocopherol on reduction of lysosomal storage was also extended to the patient cells derived from several other LSDs. 11 Therefore, the phenotypic screen using patient-derived cells is a useful approach for the identification of compounds capable of enhancing lysosomal exocytosis as a potential treatment for LSDs. Here we report the development and optimization of a phenotypic Lysotracker staining assay in both fluorescence intensity and microscopic imaging readout formats. The Lysotracker assay is amenable for compound screening to identify lead compounds in many patient cells derived from LSD patients, independent to the type of accumulated macromolecules.
Materials and Methods
Materials
Lysotracker-blue DND-22 (#L7525), Lysotracker-green DND-26 (#L7526), Lysotracker-yellow HCK-123 (#LL12491), Lysotracker-Red DND-99 dye (#L7528), Hoescht 33342 nuclear dye (# H3570), and CellMask Red (#H32712) were purchased from Invitrogen (Carlsbad, CA). DRAQ5 nuclear dye was obtained from Cell Signaling. Filipin dye (#F9765) and MβCD (#M7439) were obtained from Sigma-Aldrich. The 96-well black clear-bottom plates (#655090) were purchased from Greiner Bio-One (Monroe, NC).
Cells and Cell Culture
Patient-derived skin fibroblast cell lines and control cell line (wild type) were purchased from the Coriell Cell Repository (Camden, NJ). Cells were cultured in DMEM medium (Invitrogen, cat No. 11995-040) supplemented with 10% fetal bovine serum, 100 unit/mL penicillin, and 100 µg/mL streptomycin in a humidified incubator with 5% CO2 at 37 °C. Cells were seeded at 1500 cells/well and 3000 cells/well in 100 µL medium in 96-well plates for the Lysotracker experiments using imaging and fluorescence intensity readout formats, respectively.
Lysotracker Staining Measured by Imaging Analysis
The assay was optimized to visualize the enlarged lysosomes by staining cells with appropriate concentration of the Lysotracker dye after overnight culture in 96-well plates. Briefly, cells were live stained with 100 µL/well 50 nM Lysotracker-red DND-99 dye (Invitrogen, #L-7528) in medium at 37 °C for 60 min. After the plate was washed twice with phosphate-buffered saline (PBS), 100 µL/well of 1 µg/mL Hoechst 33342 in 3.2% formaldehyde solution was added to fix the cells and stain the nuclei. After 30 min incubation at room temperature (RT), the plate was washed twice with PBS and stored at 4 °C until further imaging measurement. The image acquisition was carried out in an IN Cell Analyzer 2000 (GE Healthcare, Waukesha, WI) that uses a halide arc lamp as the light source. The DAPI (Ex = 350 ± 50, Em = 455 ± 50 nm) and TRITC (Em = 545 ± 20, Ex = 593 ± 20 nm) filter sets were used to visualize Hoechst nuclear staining and Lysotracker-red staining, respectively. Nine fields of images per well were usually recorded with a 20× objective and numerical aperture of 0.45. The exposure time was 0.05 s for Hoechst nuclear staining and 0.9 s for Lysotracker-red staining. Similarly, the images of Lysotracker-blue staining was taken by the DAPI filter set and Lysotracker-green and Lysotracker-yellow staining were taken using the FITC filter set (Ex = 490 ± 20, Em = 525 ± 36 nm). The Draq5 nuclear staining was co-stained with these three Lysotracker dyes and measured by a different filter set (Em = 645 ± 30, Ex = 705 ± 72 nm).
Lysotracker Fluorescence Intensity Assay Using Fluorescence Plate Reader
After an overnight culture, the medium was aspirated and discarded from 96-well assay plates followed by addition of 100 µL/well of 156 nM Lysotracker-red solution in medium (
Filipin Staining
Filipin dye stains the unesterified cholesterol in cells at an appropriate concentration. Briefly, the cells after overnight incubation were washed twice with PBS and fixed with 100 µL/well of a 3.2% formaldehyde solution at RT for 30 min. After washing twice with PBS, the cells were stained with 100 µL/well of 50 µg/mL filipin solution (freshly dissolved in DMSO at 10 mg/mL and then diluted in PBS) at RT for 1 h followed by cell wash with PBS. The resulting assay plates were stored at 4 °C for further imaging analysis. On the day of imaging, cells were stained with 100 µL/well of Draq5 diluted 1:1000 in PBS at RT for 30 min followed by cell wash. The plates were imaged using an IN Cell Analyzer 2000. The DAPI and Cy5 filter sets were used to detect filipin and Draq5 staining, respectively. Nine fields of images per well were usually recorded with a 20× objective and numerical aperture of 0.45. The exposure time was 0.05 s dye and 0.025 s for filipin staining.
Data Analysis
Image analysis was conducted using IN Cell Analyzer 2000 software (GE Healthcare, version 3.7). The Multi-Target Analysis protocol was used for quantitation of Hoechst stained nuclei and Lysotracker-red stained lysosomes. Nuclei were segmented using the Top Hat segmentation method with a minimum area set at 150 µm and a sensitivity set at 50. Lysosomes were identified as “Organelles” within the analysis software and were segmented using the Multiscale top-hat algorithm. Settings for lysosome detection were identify granules ranging in size of 2 to 10 µm (3 to 13 pixels) and a sensitivity setting of 60. Total organelle intensity was calculated by multiplying the mean intensity per granule by the total area of the organelles. A single contrast setting for image analysis was applied using the imaging analysis software included in the IN Cell Analyzer 2000. Concentration-response curves were analyzed and EC50 values (mean ± SD) calculated using Prism software (GraphPad, San Diego, CA). Results in figures are expressed as mean of triplicates ± SD unless they are specified.
Results and Discussion
The late endosome and lysosome have acidic pH (4–5), whereas the normal cytosolic pH is approximately 7.2. Weakly basic amines are found to accumulate selectively in the acidic organelles and are conjugated to a fluorophore or antibody for visualizing acidic compartments in cells. 12 The recently developed Lysotracker dyes not only accumulate in acidic organelles but also become fluorescent at a low pH environment, making the dyes convenient for staining and tracking of acidic organelles in cells. 12 In addition, an increase of Lysotracker staining has been found in the fibroblasts derived from patients with neuronal ceroid lipofuscinoses, mucolipidosis type VI, and NPC, which reflects the enlarged lysosomes in those patient-derived cells.11,13,14 The Lysotracker dye staining can be carried out in either fixed cells or live cells as the dye is cell membrane permeable. To differentiate the Lysotracker staining in patient lysosomes from that of normal lysosomes in healthy control cells, the dye concentration, incubation time, and dye variants had to be optimized. An NPC patient fibroblast cell line exhibiting lysosomal cholesterol accumulation with enlarged lysosomes was used for assay development and optimization.
Dye Incubation Time for Lysotracker Staining
The time course of staining with Lysotracker-red dye was carried out in NPC patient-derived fibroblast cells in comparison with healthy control cells. The fluorescence staining of Lysotracker-red dye reached a plateau after 1 h of incubation at 37 °C (
Optimal Lysotracker Probes and Concentration
There are several additional Lysotracker dyes with different fluorescence spectrum. We compared four Lysotracker dyes with emissions in the blue, green, yellow, and red fluorescence spectrum. Results indicated that these dyes have different sensitivities for staining enlarged lysosomes in NPC fibroblasts. The fluorescence signals from the Lysotracker-blue and Lysotracker-yellow dyes were relatively weak, where a 3.2 µM dye concentration was needed for the measurement ( Fig. 1A , B ). Both the Lysotracker-green and Lysotracker-red dyes stained enlarged lysosomes robustly at a substantially lower concentration ( Fig. 1C , D ). The optimal concentrations for these two dyes were 100 and 50 nM, respectively. Together, the data indicate that the Lysotracker-green and Lysotracker-red dyes are more sensitive for staining enlarged lysosomes in NPC fibroblasts. Because the red fluorescence readout is less prone to compound fluorescence interference in compound screening, the Lysotracker-red dye was selected for the further evaluation.
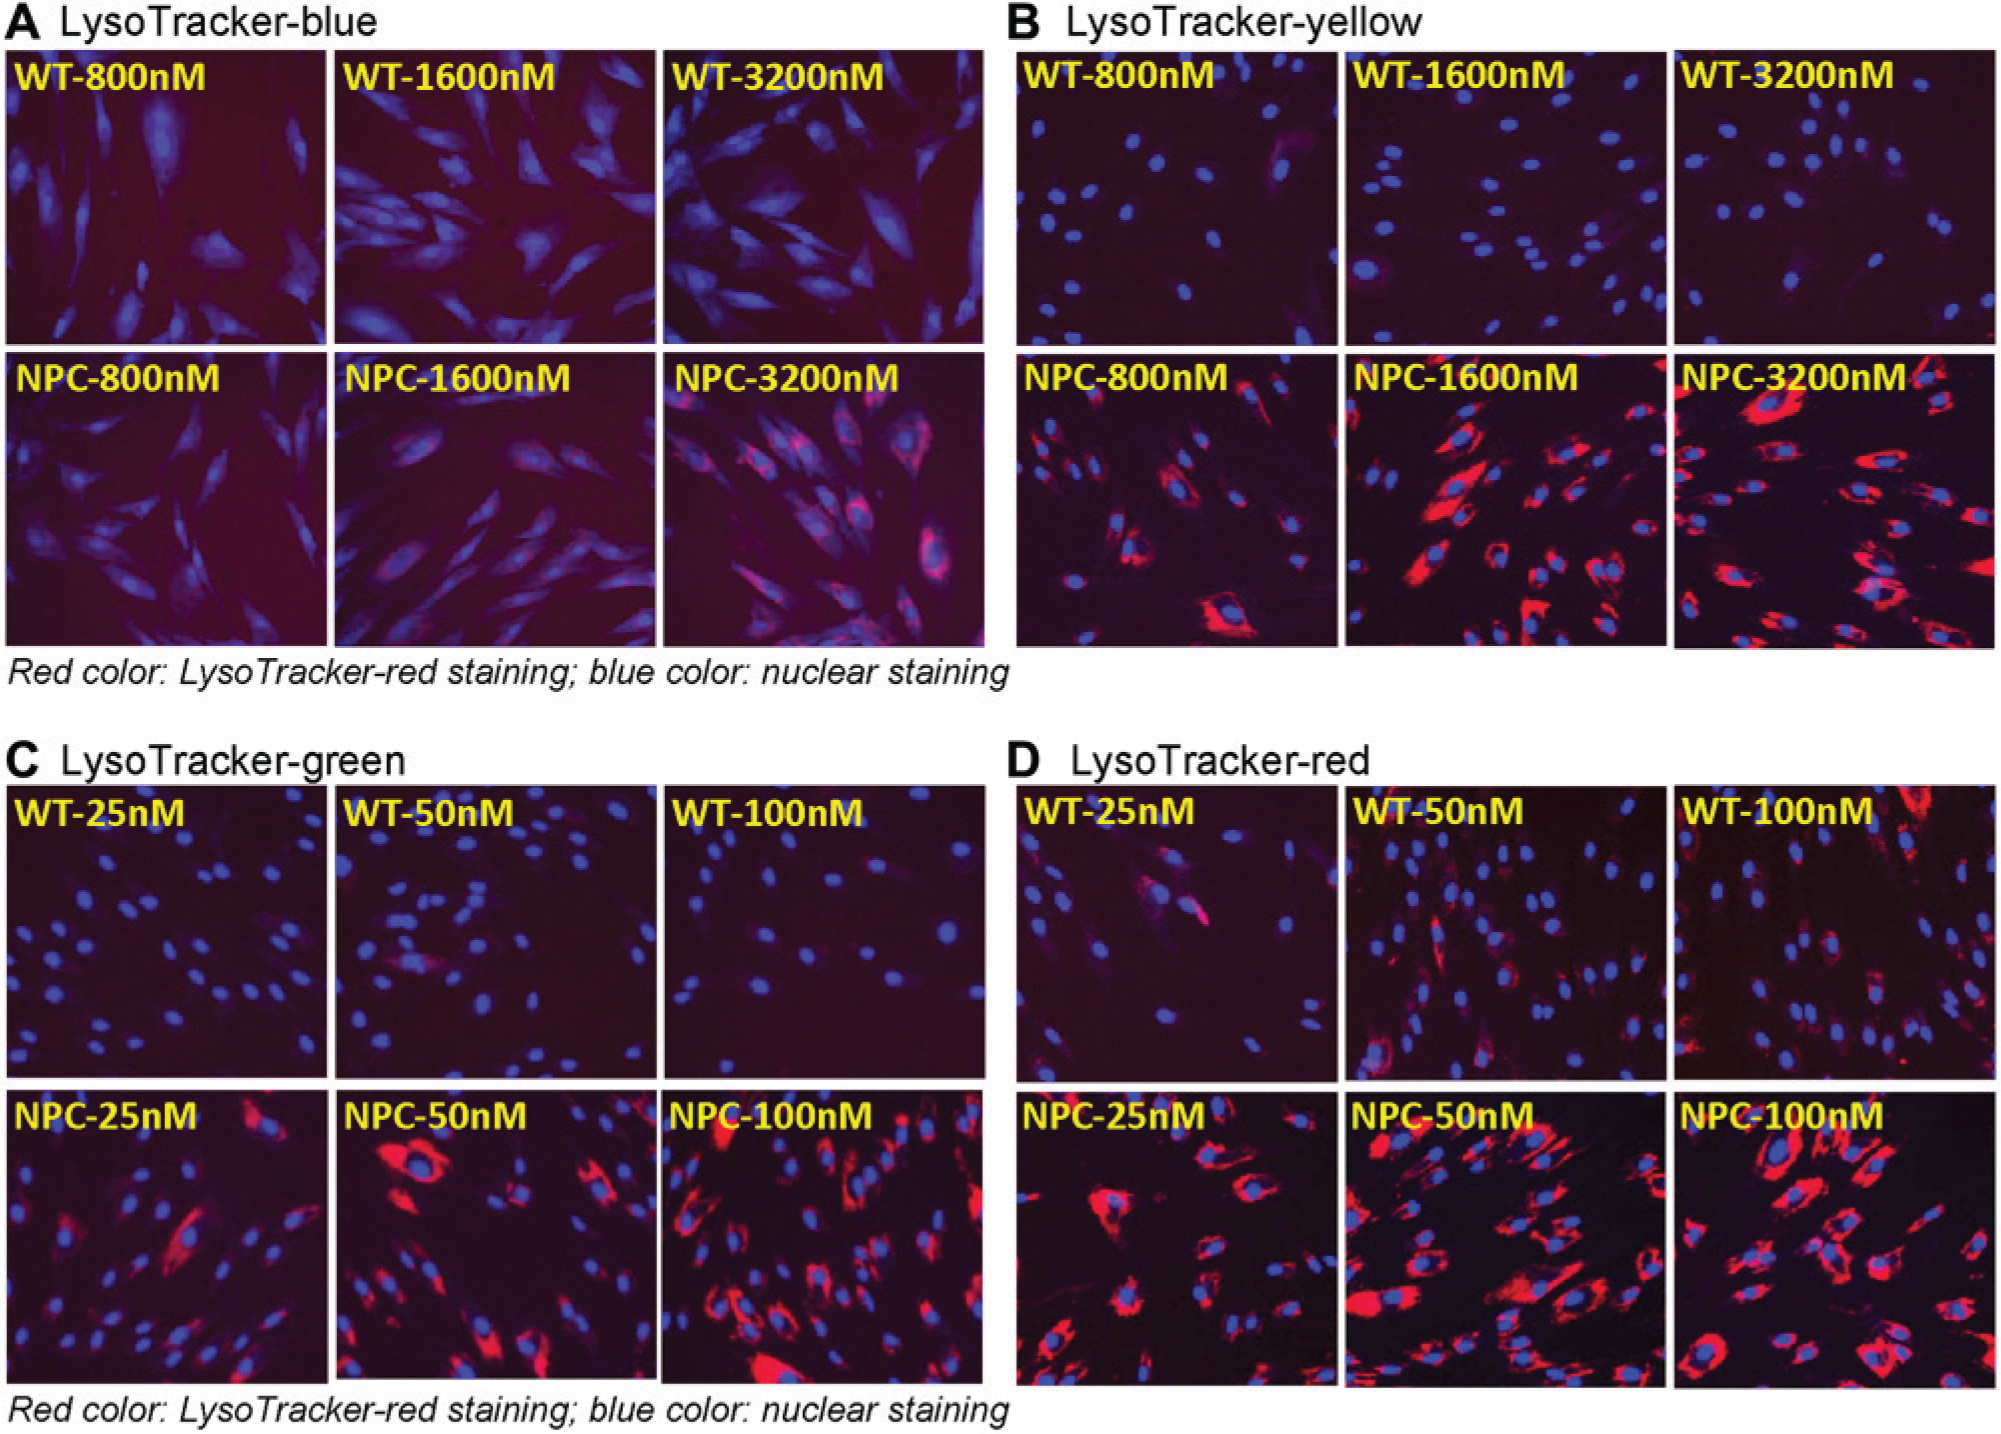
Fluorescence staining of four types of Lysotracker dyes in skin fibroblasts derived from a Niemann Pick type C (NPC) patient in comparison with control cells. Lysotracker dye staining increased in NPC cells, indicating the enlarged lysosomes in these patient-derived cells. (
Lysotracker Assay Using Fluorescence Plate Reader
Although the imaging assay for Lysotracker staining visualizes the enlarged lysosomes in patient-derived cells, it requires a special imaging plate reader and has lower screening throughput compared with a regular fluorescence plate reader assay. Therefore, we used a fluorescence plate reader for measurement of fluorescence signals in the Lysotracker assay. We found that the optimal cell density and dye concentration detected by a fluorescence plate reader were similar to those used in the imaging assay. The fluorescence intensity reached a plateau between 156 and 625 nM Lysotracker-red dye (
Increased Lysotracker Staining in Fibroblasts from Other LSDs
Because lysosome enlargement is a common feature in many LSD patient-derived cells, we determined whether the Lysotracker staining assay developed in NPC cells was applicable to other LSD patient-derived cells. Sixteen additional LSD fibroblast cell lines (
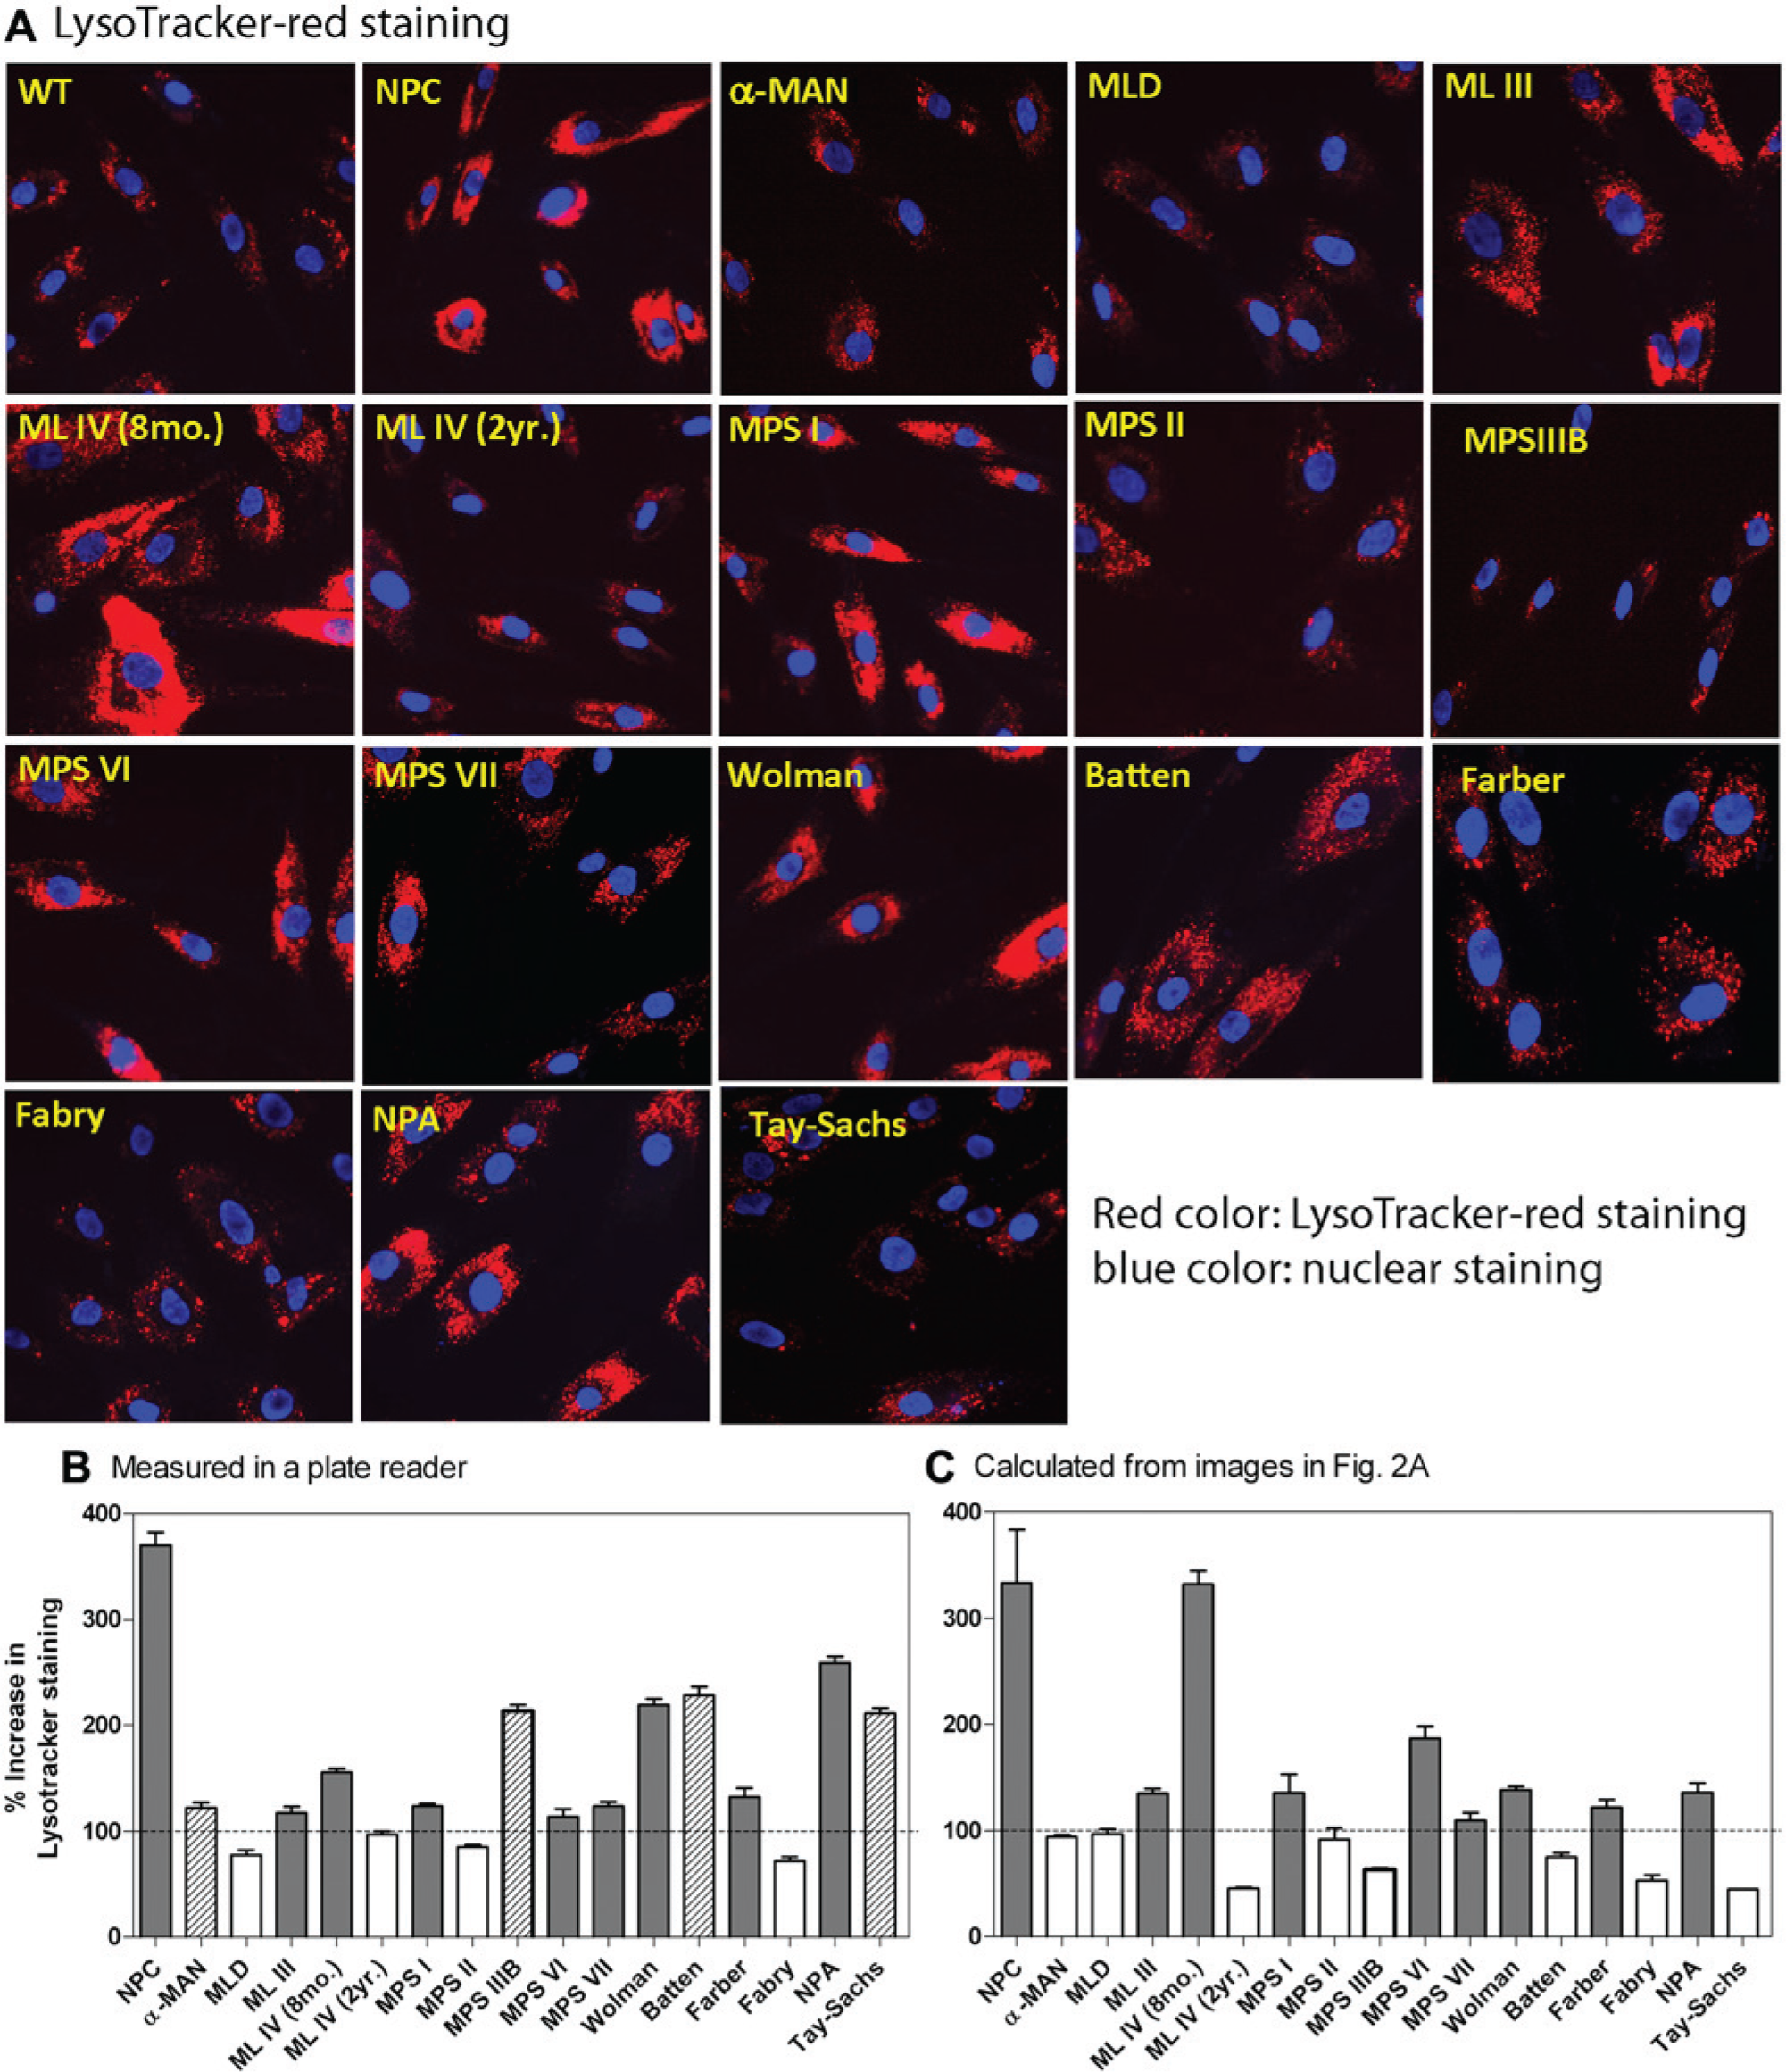
Comparison of results of Lysotracker staining in 17 patient-derived fibroblast lines measured by an IN Cell Analyzer 2000 with these determined by a fluorescence plate reader. (
The fluorescence intensity of Lysotracker staining in these 16 cells was also measured using a fluorescence plate reader. An increase in Lysotracker staining was observed in 13 patient cell lines, including 4 patient-derived cell lines ( Fig. 2B ; α-MAN, MPS-IIIB, Batten, and Tay-Sachs) that were not identified in the imaging assay ( Fig. 2C ). The discrepancy in the number of positive patient cell lines found in two detection methods may be associated with the different detection sensitivity in two detection methods, limitation of imaging software for data calculation, and day-to-day experimental variation. The irregularity in individual lysosome size and variable dye staining pattern in patient-derived cells could also contribute to the variable results from the imaging data calculation. In addition, the number of cells analyzed in image experiments could be varied and may affect the calculated results. Taken together, although the visual examination of Lysotracker staining is a useful application to confirm enlarged lysosomes in patient-derived cells, the plate reader–based measurement is more robust for the primary screen of compound collections.
A DMSO plate test for the Lysotracker assay was carried out using a fluorescence plate reader for detection. The signal-to-basal ratio of 3.8-fold, coefficient of variation (CV) of 12.0%, and Z factor of 0.41 were obtained using the NPC patient-derived fibroblast cells (
Cyclodextrin Reduced Lysotracker Staining
We determined the comparability of two detection methods (e.g., plate reader and imaging) of this Lysotracker assay for the measurement of compound activity in NPC patient-derived cells. MβCD was chosen as a positive compound as it has been shown to reduce the enlarged lysosomes by decreasing lysosomal cholesterol accumulation in NPC fibroblasts.10,15 The effect of MβCD measured by the Lysotracker assay was compared with a filipin staining assay and a biochemical Amplex-red cholesterol assay, whereby both assays measure cellular cholesterol levels. 11 Filipin dye binds to unesterified cholesterol, which becomes fluorescent and can be detected by fluorescence imaging. We observed that the Lysotracker staining was significantly reduced in the NPC cells after treatment with 300 µM MβCD ( Fig. 3A ). A similar effect of MβCD on the NPC cells was observed in the filipin staining assay ( Fig. 3B ). In the Lysotracker assay using a fluorescence plate reader, MβCD treatment reduced the fluorescence intensity with an IC50 value of 133 µM, indicating the reduction of enlarged lysosomes in NPC cells. Similarly, an IC50 of 78.7 µM of MβCD on the reduction of cellular cholesterol was determined in the Amplex-red cholesterol assay ( Fig. 3C ). Together, the results demonstrate that the compound activity measured by the Lysotracker assay correlates with that determined in the Amplex-red cholesterol assay. Therefore, the Lysotracker assay is effective for measurement of compound activity against enlarged lysosomes in patient-derived cells.
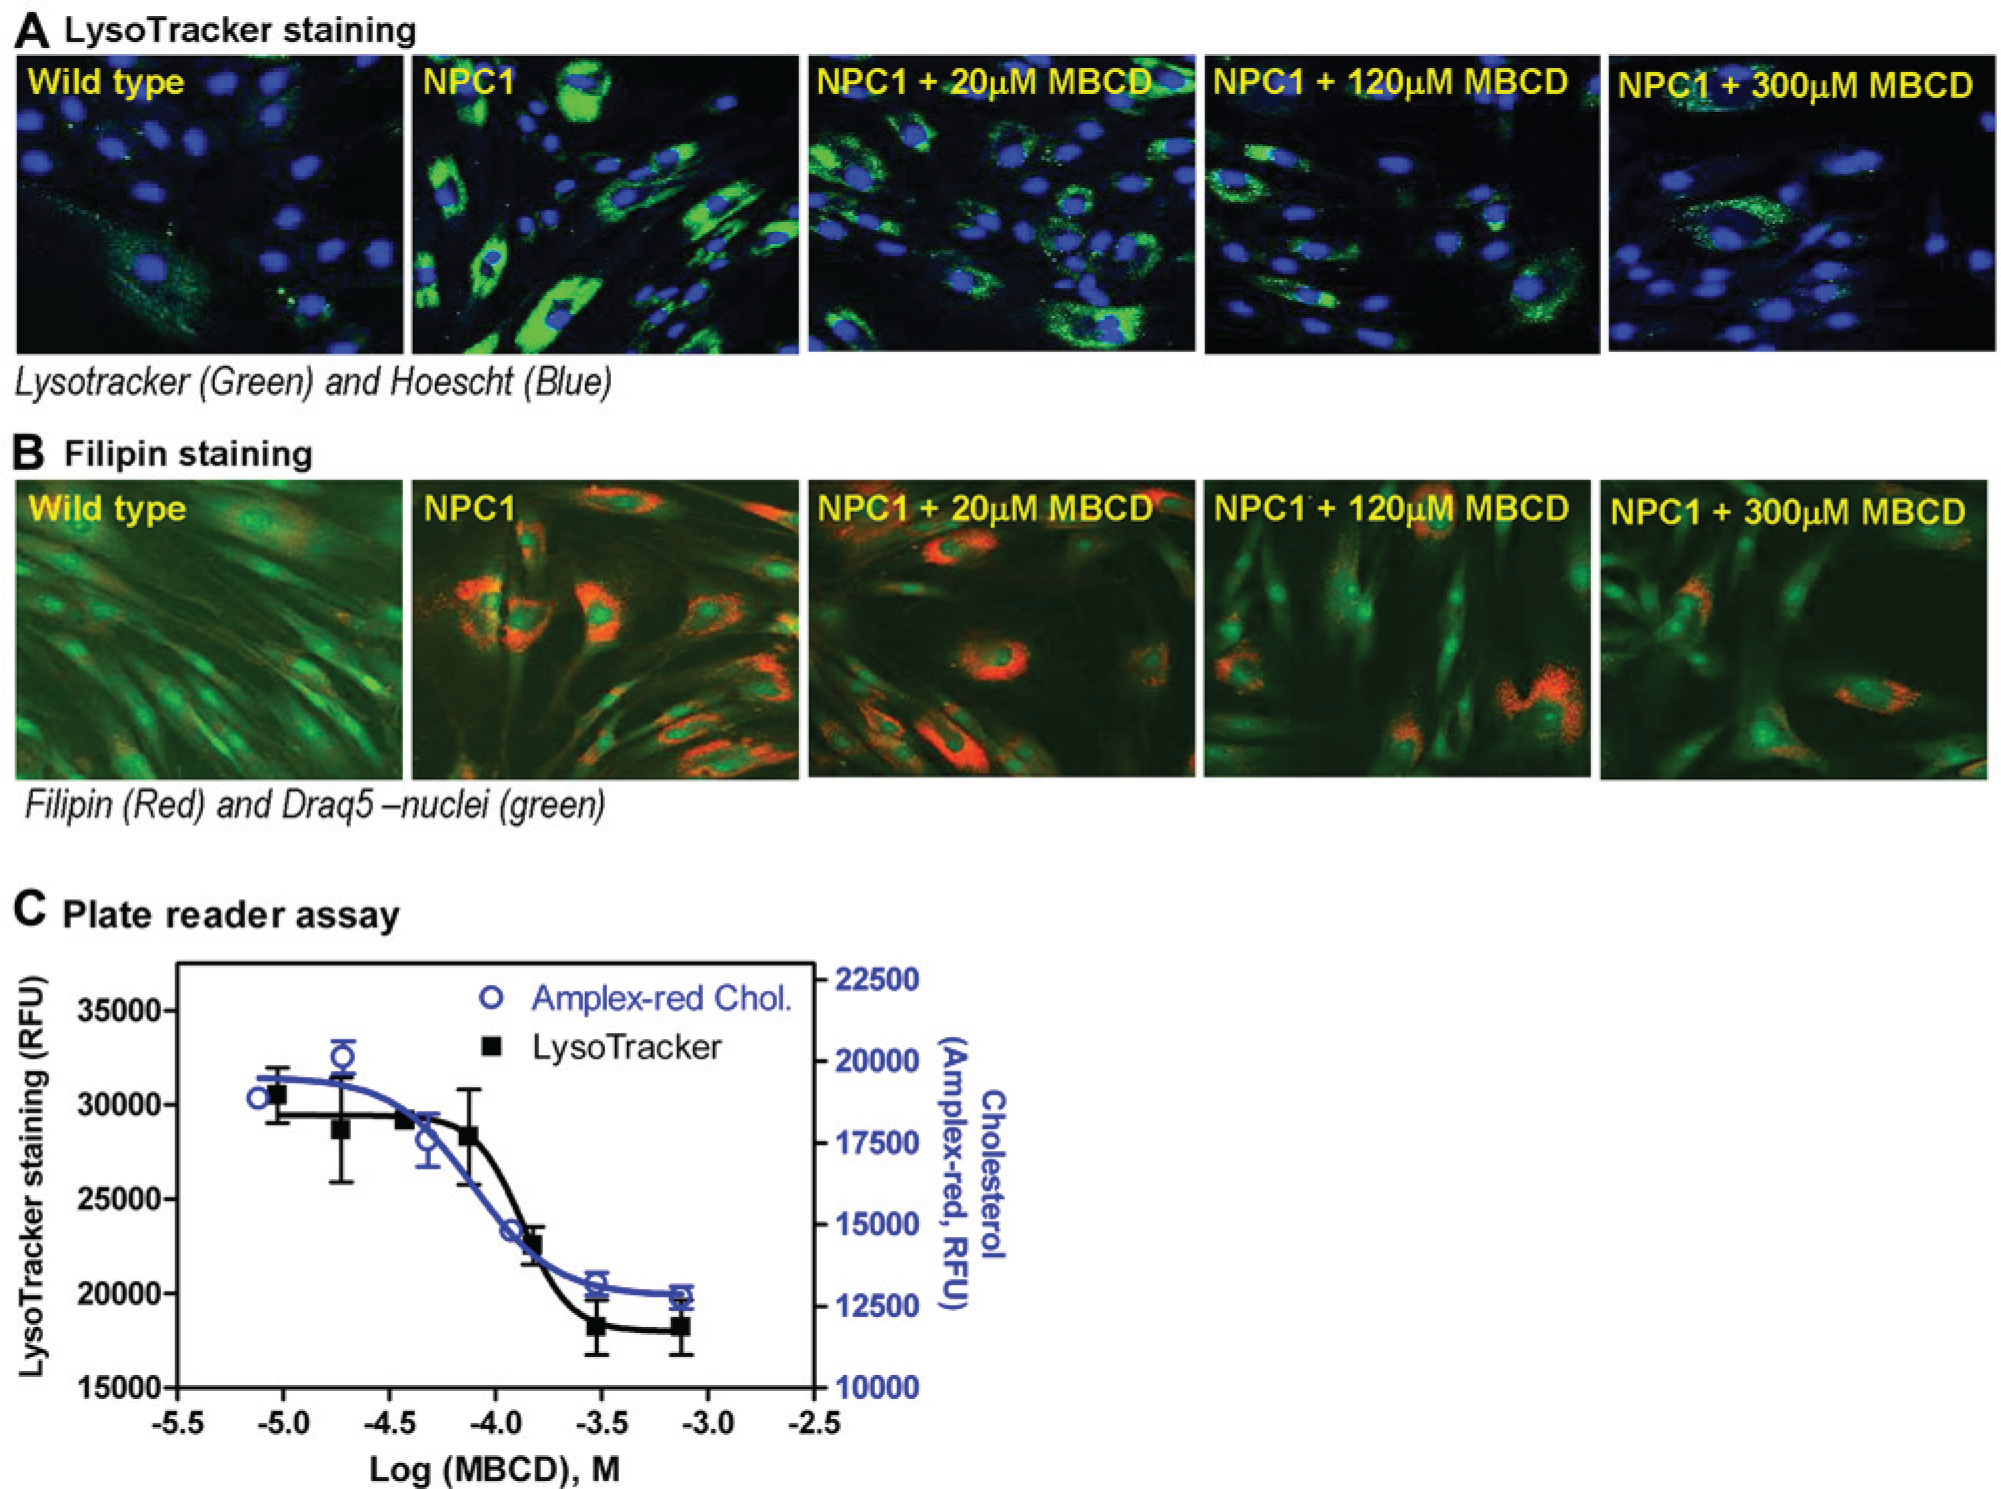
Effect of methyl-β-cyclodextrin (MβCD) on reduction of cholesterol accumulation and lysosome size in Niemann Pick type C (NPC) fibroblasts determined by Lysotracker-red staining, filipin cholesterol staining, and Amplex-red cholesterol assays. (
In contrast to target-based drug discovery, phenotypic screening is based on the disease phenotypes, which may not link to a specific target protein. A cell-based disease model using patient-derived cells is usually disease relevant. Unlike the NPC disease, specific dyes capable of detecting various lipids accumulated in lysosomes of other LSDs (
In conclusion, we have developed and optimized a phenotypic Lysotracker staining assay that measures enlarged lysosomes in patient-derived cells. The Lysotracker assay can be detected by both imaging readout and fluorescence plate reader formats in compound screening to identify lead compounds for drug development. Although the plate reader format of the Lysotracker assay can be used for high-throughput screening, the imaging format of the Lysotracker assay is useful for the compound confirmation and follow-up studies. In addition, Lysotracker staining could potentially be developed into a flow cytometry assay for clinical disease diagnosis and for biomarker development using patient-derived lymphocytes.
Footnotes
Declaration of Conflicting Interests
The authors declared no potential conflicts of interest with respect to the research, authorship, and/or publication of this article.
Funding
The authors disclosed receipt of the following financial support for the research, authorship, and/or publication of this article: This work was supported by the Intramural Research Program of the Therapeutics for Rare and Neglected Diseases, National Center for Advancing Translational Sciences, National Institutes of Health.
References
Supplementary Material
Please find the following supplemental material available below.
For Open Access articles published under a Creative Commons License, all supplemental material carries the same license as the article it is associated with.
For non-Open Access articles published, all supplemental material carries a non-exclusive license, and permission requests for re-use of supplemental material or any part of supplemental material shall be sent directly to the copyright owner as specified in the copyright notice associated with the article.