
Abstract
Sickle cell anemia (SCA) is a genetic disorder of the β-globin gene. SCA results in chronic ischemia with pain and tissue injury. The extent of SCA symptoms can be ameliorated by treatment with drugs, which result in increasing the levels of γ-globin in patient red blood cells. Hydroxyurea (HU) is a Food and Drug Administration–approved drug for SCA, but it has dose-limiting toxicity, and patients exhibit highly variable treatment responses. To identify compounds that may lead to the development of better and safer medicines, we have established a method using primary human bone marrow day 7 erythroid progenitor cells (EPCs) to screen for compounds that induce γ-globin production. First, human marrow CD34+ cells were cultured and expanded for 7 days and characterized for the expression of erythroid differentiation markers (CD71, CD36, and CD235a). Second, fresh or cryopreserved EPCs were treated with compounds for 3 days in 384-well plates followed by γ-globin quantification by an enzyme-linked immunosorbent assay (ELISA), which was validated using HU and decitabine. From the 7408 compounds screened, we identified at least one new compound with confirmed γ-globin–inducing activity. Hits are undergoing analysis in secondary assays. In this article, we describe the method of generating fit-for-purpose EPCs; the development, optimization, and validation of the ELISA and secondary assays for γ-globin detection; and screening results.
Keywords
Introduction
Sickle cell anemia (SCA) is the most common inherited genetic disorder. A single amino acid mutation of the β-globin gene results in the polymerization of deoxygenated sickle hemoglobin and malfunction of red blood cells (RBCs), resulting in chronic ischemia, pain, and tissue and organ injury. Not all individuals with SCA are diagnosed, although in the United States, newborn screening in all 50 states for the presence of SCA has been in place since 2005. In 2010, more than 300,000 babies were born with homozygous SCA disease worldwide. Approximately 3000 babies were born with SCA in the United States, while approximately 240,000 were born with SCA in sub-Saharan Africa. 1 The identification and treatment of these patients represent a major global unmet medical need.
Normal adult hemoglobin contains two α- and two β-globin chains together with four molecules of heme. Prior to birth, the tetramer contains primarily two γ-globin chains and two α-globin chains. Several weeks after birth, γ-globin protein decreases and is replaced by β-globin protein. 2
The current standard of care for SCA is hydration, transfusions, and pain medication to treat the painful crises typical of this disease. Hydroxyurea (HU) is approved by the Food and Drug Administration (FDA) to reduce the frequency of painful crises and to reduce the need for blood transfusions in adult patients with SCA. 3 However, HU has dose-limiting toxicity and a highly variable treatment response rate.4 –7 HU has multiple reported mechanisms of action, including decreasing the number of neutrophils, increasing the water content of RBCs, increasing the deformability of sickled cells, and altering the adhesion of RBCs to the vascular endothelium.3,8 However, while the molecular mechanism is unknown, it is the ability of HU to increase γ-globin in RBCs that is most frequently cited as its primary mechanism of action. 9 Increases in the level of γ-globin (fetal hemoglobin; HbF) in patient RBCs prevent polymerization and ameliorate the extent of SCA symptoms. Known genetic mutations that raise the levels of γ-globin in certain patient populations also provide support for the proposal that drugs that result in increased induction of γ-globin expression may provide therapies for SCA. 10
Over the past several decades, there have been multiple efforts to identify compounds to effectively treat SCA. These screening systems have generally used cell lines with erythroid characteristics of either mouse or human origin.11–18 The most recently reported screening effort for the identification of compounds that induced increased levels of γ-globin was conducted by Bradner et al. 19 Employing a fluorescent microsphere detection system, the authors were able to measure the endogenous expression of seven globin messenger RNA (mRNA) transcripts in primary human erythroid cells, and they used this method to screen FDA-approved drugs and a 600-member histone deacetylase (HDAC) inhibitor-focused set for compounds that could induce γ-globin mRNA. From these studies, HDAC1 and HDAC2 inhibitors were demonstrated to increase the ratio of γ-globin/β-globin gene expression. They further showed a 2-fold increase in fetal hemoglobin in LBH-589 treated Hodgkin’s Lymphoma patients in a prospective clinical trial.
Silencing of the γ-globin gene is associated with increased DNA methylation. 20 DNA methyltransferase (DNMT) enzyme inhibitors such as 5-aza-2′-deoxycytidine (decitabine) have been reported to cause significant increases in γ-globin in patients with SCA.21–23 However, these compounds have been shown to be very toxic. Short-chain fatty acids (SCFAs) such as butyrate, a known HDAC inhibitor, are also reported to cause significant increases in γ-globin levels, 24 although low potency combined with the short half-life of this class of compounds has so far prevented their clinical use.
To identify compounds that may lead to the development of more effective medicines with an improved safety profile for the prevention of crisis episodes in SCA patients, we have established a method using day 7 erythroid progenitor cells (EPCs) to screen for small-molecule inducers of γ-globin expression. To differentiate our screening effort from previous efforts, we selected normal human primary marrow-derived EPCs as the cell population for this screen, and we chose to assess the level of γ-globin protein, rather than mRNA, to further increase the physiological relevance of our screening assay.
To this end, we developed a 384-well enzyme-linked immunosorbent assay (ELISA) that measures γ-globin expression following a 3-day treatment of day 7 EPCs. This assay uses a polyclonal antibody (Ab) to human γ-globin to monitor change in γ-globin levels upon compound treatment. The assay was validated by treating cells with HU and decitabine, both known inducers of γ-globin protein expression. Both tool compounds gave dose-dependent responses, but decitabine had optimal potency of approximately 100 nM with a bell-shaped dose-response curve. To maximize the chance of identifying potential γ-globin inducers, we conducted a focused screen of 7408 compounds in 11-point concentration dose-response curves. These compounds were selected for screening based on several reported mechanisms of action, including epigenetic mechanisms. Of the 7408 compounds screened, we identified hits that were subsequently confirmed to induce expression of γ-globin in secondary assays such as high-content imaging (HCI) and liquid chromatography–mass spectroscopy (LC-MS).
Materials and Methods
HU was purchased from Sigma (St. Louis, MO), and 5-aza-2′-deoxycytidine (decitabine) was purchased from Carbosynth Ltd (Berkshire, UK). Hoechst 33342 (cat. H3570) and FITC-conjugated mouse anti–human HbF monoclonal Ab for flow cytometry (anti–HbF-FITC; cat. MHFH01) were purchased from Life Technologies (Carlsbad, CA). γ-Globin calibrator (cat. RC80-135) and anti-HbF sheep polyclonal Ab for enzyme-linked immunosorbent assay (ELISA) (cat. A80-136A) were purchased from Bethyl Lab (Montgomery, TX), and Dulbecco’s phosphate-buffered saline (DPBS) buffer was from Mediatech (Manassas, VA; cat. 21-031-LB). Black-walled µclear F-bottom 384-well microplates were purchased from Greiner Bio-One (Monroe, NC; cat. 781090). DMSO (cat. D2438) and glutaraldehyde (cat. 65882) were purchased from Sigma-Aldrich. Triton X-100 solution (cat. HFH-10) was purchased from Life Technologies.).
Culture, Expansion, and Characterization of Day 7 EPCs
All donors provided written informed consent for use of their samples, and the collection and use of the samples received institutional review board approval.
All cryopreserved human bone marrow CD34+ cells used here were obtained from AllCells (Emeryville, CA) and were generally from different donors. The CD34+ cells were cultured using the method of Bradner et al. 19 to generate EPCs at day 7. Briefly, 1 million cells were cultured in 5% CO2, 5% O2 at 37 °C in H3000 Stemspan media (StemCell Technologies, Vancouver, BC, Canada) supplemented with 2 mM L-glutamine, 40 µg/mL human low-density lipoproteins (StemCell Technologies), 10 ng/mL recombinant human (rh) interleukin IL-3 (R&D Systems, Minneapolis, MN), 100 ng/mL rh stem cell factor (R&D Systems), and 0.5 U/mL rh erythropoietin (EPO; Invitrogen, Grand Island, NY). Cells were split and refed on day 4 with complete H3000 media and harvested on day 7 for evaluation of erythroid marker expression and assessment of γ-globin induction. Day 7 EPCs were also frozen at 5 to 10 million cells/mL in 95% fetal bovine serum (FBS; Invitrogen) with 5% DMSO for subsequent use.
Erythroid Markers by Flow Cytometry
Cells collected from day 7 cultures were washed twice in stain buffer (0.1% bovine serum albumin [BSA] in DPBS) using centrifugation and pipette aspiration. Cells were stained with the following PE- or APC-conjugated monoclonal antibodies and respective isotype Ab controls to demonstrate generation of erythroid lineage cells: CD36 (BD Biosciences, San Jose, CA), as well as CD71 and CD235a (R&D Systems). The myeloid marker, CD11b (BD Biosciences), was included to confirm purity of erythroid lineage population. Cells were washed once following stain and fixed in 1% formaldehyde prior to data collection and analysis on a FACSCanto (Becton Dickinson, Franklin Lakes, NJ) with FlowJo v7 software (Treestar, Ashland, OR).
Validation of Day 7 EPCs Using Tool Compounds
Day 7 EPCs were washed in H3000 base media by centrifugation and resuspended in complete H3000 media with 3 U/mL EPO. Cells were plated into a 24-well culture dish at 1 million cells per well. HU (100 µM) or decitabine (100 nM) was added based on preestablished peak response (
Quantitation of Globins in Day 7 EPCs by LC-MS
Day 7 EPCs (2 × 10⁵ cells) were incubated at 5% CO2, 5% O2 at 37 °C for 3 days with either 0.3% DMSO or varying concentrations of compound. After treatment, cells were harvested by centrifugation, washed once in DPBS, and lysed in water. The lysate was frozen on dry ice for 15 min, thawed in a 37 °C bath, and centrifuged at 14,000 rpm for 10 min to separate cell debris. Recovered supernatants were treated with protease inhibitor (cat. 78415; Thermo Scientific, Waltham, MA) and stored at -20 °C until analysis.
The unfractionated lysates were loaded onto a 2.1 × 30-mm POROS R2/10 high-performance liquid chromatography (HPLC) column and the proteins eluted with a 20% to 40% acetonitrile (0.2% formic acid) gradient over 6 min into the electrospray ionization source of an Agilent (Santa Clara, CA) orthogonal time-of-flight (TOF) mass spectrometer. α-, β-, and γ- (G and A) globins were identified in the lysate on the basis of their molecular weight (15126.6 Da for α, 15867.4 Da for β, 15995.5 Da for G-γ, and 16009.5 Da for A-γ) and confirmed by direct tandem mass spectrometry (MS/MS)–based sequencing of the intact protein on an Orbitrap XL (Thermo Fisher, Waltham, MA). Relative quantitation of the various globins was achieved by constructing ion current chromatograms for multiple mass-to-charge ratio (m/z) values specific for each globin, summing the intensities for the values specific to each globin and integrating the total peak area for each globin using the Agilent Mass Hunter software. β- and γ-globin were normalized to the amount of α, and each data set was reported as the increase or decrease relative to 0.3% DMSO control.
384-Well ELISA Development, Optimization, and Validation
Day 7 EPCs (frozen or fresh) were cultured in 384-well cell plates (Greiner Bio-One; 781090), which were prestamped with compounds. The plates were incubated for 3 days at 37 °C with 5% CO2 and 5% O2.
The coating anti-HbF Ab (Bethyl Lab; cat. A80-136A) was diluted by 100-fold in the coating buffer (0.05 M carbonate-bicarbonate, pH 9.6), and then 20 µL/well was added to a 384-well MaxiSorp ELISA plate (Thermo Fisher; cat. 464718). After 1-h incubation at room temperature, the plates were washed three times with ELISA washing buffer (50 mM Tris, 0.05% Tween 20, pH 8.0) with an EL406 plate washer (BioTek, Winooski, VT). Then, 40 µL/well of blocking buffer consisting of 50 mM Tris and 1% BSA (pH 8.0) was added to the plate and incubated for 30 min at room temperature or overnight at 4 °C. The plates were washed twice prior to ELISA measurement.
After a 3-day incubation in the presence of compound at 37 °C, 5% CO2, and 5% O2, cell plates were removed from the incubator and equilibrated at room temperature or stored at -80 °C until ELISA analysis. To each well was added 30 µL of lysis buffer (Invitrogen; cat. FNN0011, supplemented with 1× protease inhibitor), and the solution was mixed five times with a Cybi-Well (Jena, Germany) pipettor. Following the mixing procedure, 20 µL/well of lysate was transferred to the coated ELISA plate followed by a 1- to 2-h incubation at room temperature. The ELISA plate was washed three times, and 20 µL/well of 1:75,000 to 100,000 diluted horseradish peroxidase (HRP) conjugate detection anti–HbF Ab (Bethyl Labs; cat. A80-136P, diluted in 50 mM Tris [pH 8.0], 1% BSA, 0.05% Tween-20) was added. After a 1-h incubation at room temperature, the plate was washed four times, and then 20 µL/well of tetra methyl benzidine ELISA substrate (Thermo Scientific; cat. 34028) was added. After a 15- to 20-min incubation at room temperature in the dark, 20 µL/well of stop solution (0.2 M sulfuric acid) was added. The plates were then read at absorbance 450 nm (OD450) with an EnVision plate reader (PerkinElmer, Waltham, MA).
OD450 values were used directly to process the data. DMSO samples were used as the basal level control (100%). The induction level was calculated as a percentage of the basal level. If a standard curve of γ-globin was generated, the amount of γ-globin protein level could be back-calculated from the standard curve.
HCI Assay Development, Optimization, and Validation
Day 7 EPCs were plated at 10,000 cells per well onto serially diluted compounds into 384-well microplates and incubated for 3 days at 37 °C and 5% CO2. After 3 days of incubation, an immunofluorescence staining protocol was performed to stain the cells for γ-globin protein. In brief, cells were fixed by adding glutaraldehyde to a final concentration of 0.05% (from a 3× solution in DPBS) for 10 min at room temperature. Cell plates were spun at 600 g for 7 min, and fixative was removed with a BioTek washer ELx405. Cells were then blocked by adding 50 µL/well freshly prepared blocking solution (0.1% FBS and 0.1% Triton X-100 in DPBS) and incubated for 5 min at room temperature. Cell plates were spun at 600 g for 7 min, blocking solution was removed, and cells were stained by adding a 20- to 30-µL staining solution consisting of 1:40 FITC-conjugated anti–HbF Ab (cat. MHFH01) and 1:500 Hoechst 33342 (prepared in blocking solution) for 3 h at room temperature. After three washes with DPBS, plates were sealed and ready for imaging.
Images were captured on an Opera HCI instrument (PerkinElmer) with two separate exposures performed by two lasers (405 nm and 488 nm). To avoid saturation and crosstalk between color channels, laser power and exposure time were optimized to obtain the best image quality. The Opera instrument was set up and adjusted according to the manufacturer’s instructions. Three images for each well were captured (average of approximately 2000 cells per well for analysis with the 10× air objective) unless otherwise indicated in the figure legends. For the image analysis, nuclei and cell borders were first identified based on Hoechst 33342 signals using Acapella software image analysis algorithms (PerkinElmer, Waltham, MA). Fluorescence signals within each cell body were measured. A threshold was defined using unstimulated cells and comparing them with the positive control cells treated with decitabine. The main outputs were average FITC intensity per cell (based on a 488-nm channel), % HbF+ cells, and cell count. It took approximately 30 min to complete the image acquisition and data output for one 384-well plate. Prepared plates were stable for several days at room temperature, so the 30-min plate read time did not adversely affect the results in terms of the difference in time between reading the first well of the first assay plate and last well of the last assay plate.
Method to Detect Cell Viability in Day 7 EPCs
Frozen day 7 EPCs were thawed, washed, and resuspended in the complete H3000 medium with 3 U/mL EPO. After diluting to the desired cell density, the cell solution was dispensed at 1000 cells per well into 384-well white tissue culture plates (Greiner Bio-One; cat. 781080). The plates were prestamped with compounds using an Echo 555 (Labcyte, Sunnyvale, CA). For compound dose curve analysis, the final top concentration was 33 µM, with 3-fold serial dilution up to 11 doses (columns 1–12 or columns 13–24, column 6 with DMSO, column 18 was empty). Cell plates were placed in a humidified incubator at 37 °C with 5% CO2 for 3 days. Then, 15 µL/well of Cell Titer-Glo (Promega, Madison, WI) was added to the cell plates. The cell plates were incubated at room temperature for 10 min prior to reading on ViewLux 1430 (Perkin Elmer) using a luminescence protocol.
Focused Screen Procedures
A focused screen was performed using the ELISA method. A total of 7408 compounds were screened in 384-well plates with 11-point dose curves of 3-fold serial dilutions starting at 33 µM. Compounds selected for further confirmation were run in duplicate 11-point dose curves. Follow-up of the confirmed hits was run in 18-point dose curves starting at 33 µM. Confirmed hits were also tested in Opera HCI and Cell Titer-Glo assays.
Results and Discussion
EPC Characteristics and γ-Globin Response
A degree of erythroid differentiation was required for this assay so that the appropriate transcriptional and translational elements were available to measure compound effects on globin gene expression. Adult human bone marrow–derived CD34+ cells were chosen, rather than other sources of hematopoietic progenitors, to assess the potential effects of compounds on the most physiologically relevant cell type. These cells were commercially available and could be expanded to sufficient quantities for the focused ELISA screen. There are reports that erythroid progenitors derived from cell types such as cord blood do not have the transcriptional elements necessary for complete adult globin expression. 25
An initial EPC assay was established by flow cytometry prior to conversion to an ELISA format for the focused screen. Normal human marrow CD34+ cells were grown for 7 days with low EPO levels for expansion and differentiation (subsequently referred to here as day 7 EPCs, these cells were termed hematopoietic precursor cells by Bradner et al.
19
) and then treated with compounds in the presence of higher EPO concentrations for 3 additional days before analysis for γ-globin induction (
Fig. 1
). Erythroid markers (CD71, CD36, and CD235a) detected on the day 7 EPCs demonstrate that the population consisted of approximately 90% early to mid erythroblasts (
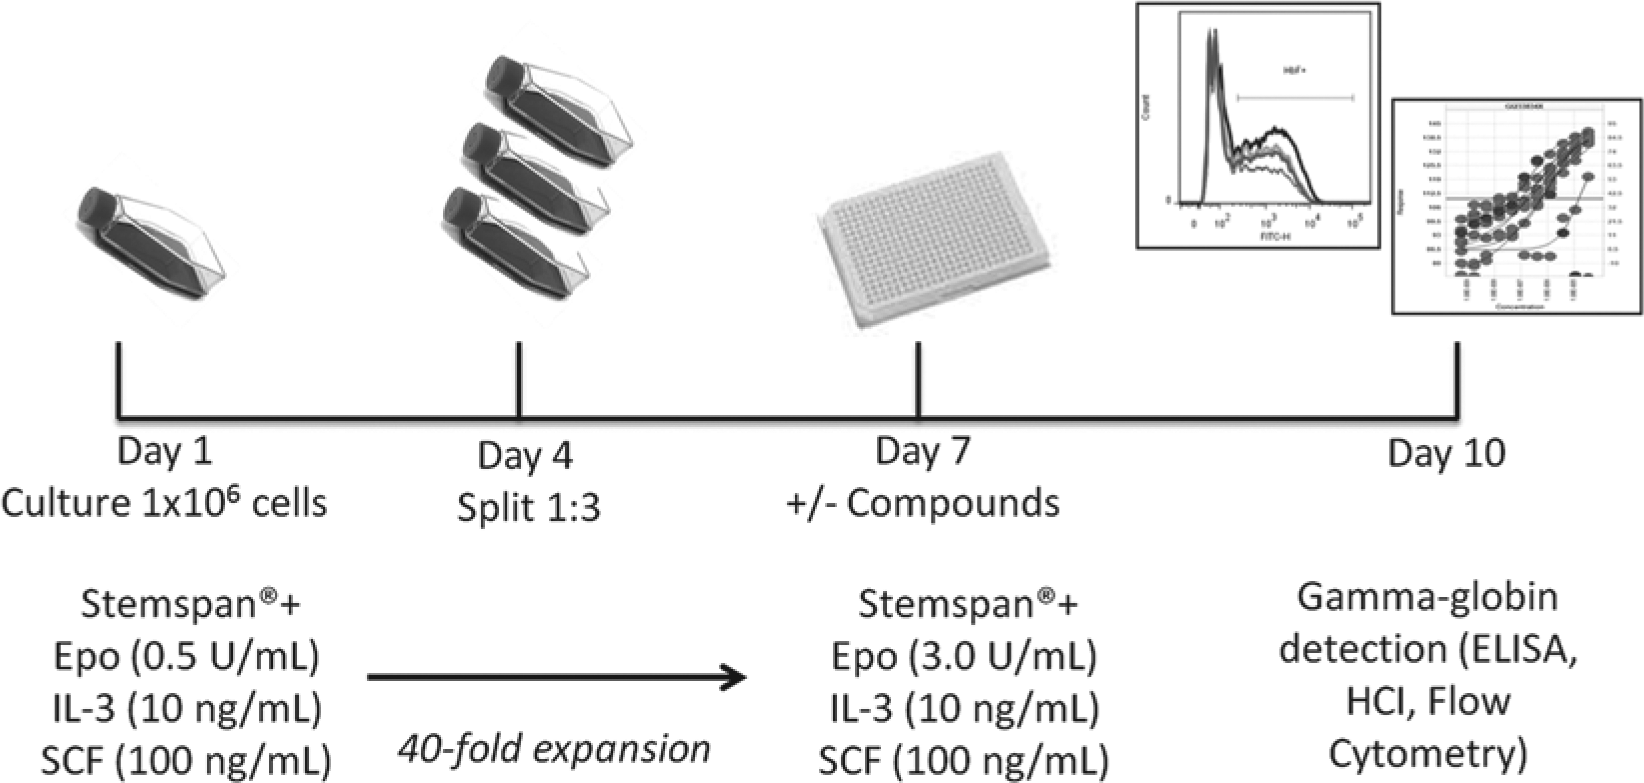
Method for obtaining day 7 erythroid progenitor cells (EPCs) for use in γ-globin screening assay. EPCs were generated and expanded from cryopreserved human bone marrow CD34+ cells in a two-phase liquid culture system. Expansion media with low erythropoietin (EPO) (0.5 U/mL) were used from days 1 to 7 of culture. Day 7 EPCs were then cultured in media with high EPO (3 U/mL) for an additional 3 days in the presence or absence of tool or test compounds to assess γ-globin–inducing potential by various methods (i.e., flow cytometry, enzyme-linked immunosorbent assay [ELISA]). HCI, high-content imaging; IL-2, interleukin 3; SCF, stem cell factor.
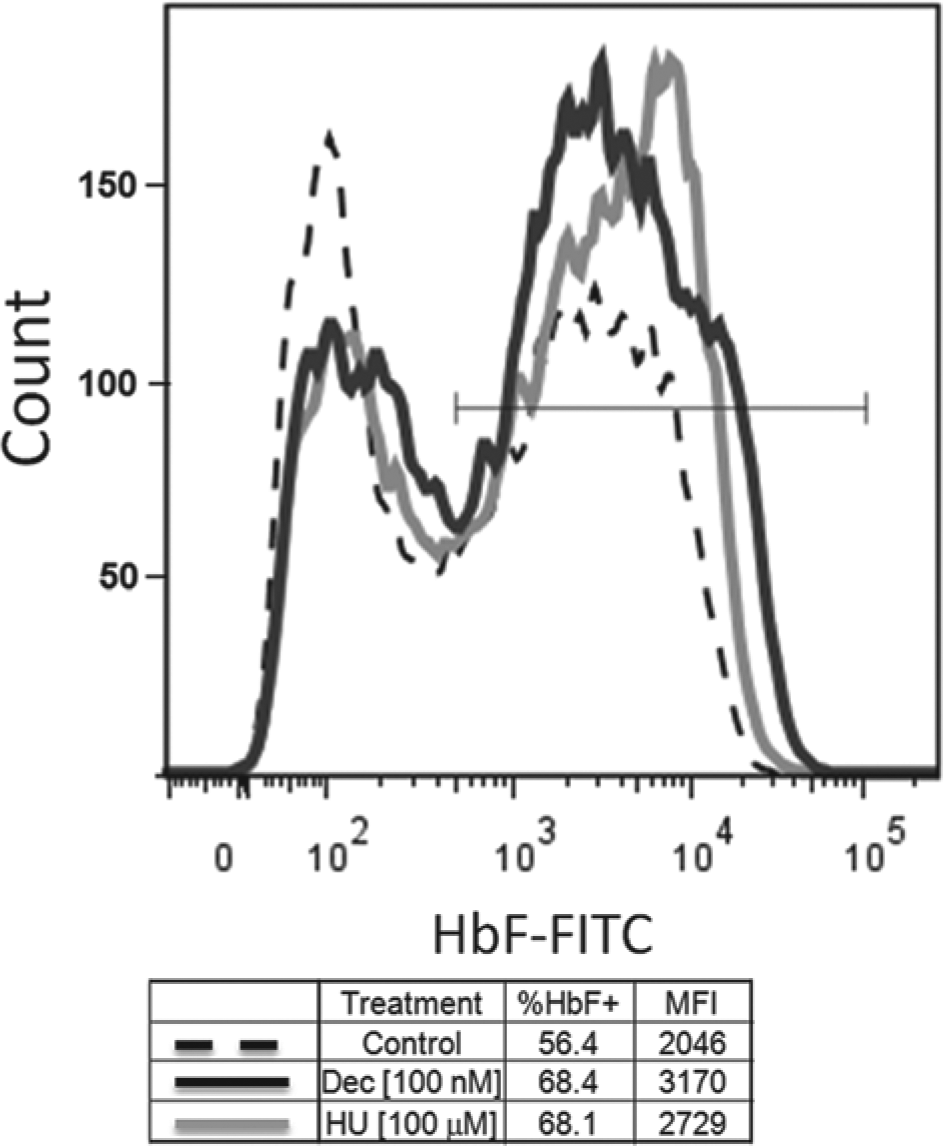
Validation of γ-globin induction in day 7 erythroid progenitor cells (EPCs) by hydroxyurea (HU) and decitabine. Day 7 EPCs were cultured with 100 µM HU, 100 nM decitabine, or 0.3% DMSO control. After 3 days in culture, percent γ-globin (fetal hemoglobin [HbF]) was measured for each condition by flow cytometry. Intracellular staining with FITC-conjugated anti–HbF mAb was performed as per the manufacturer’s specification (Invitrogen, Grand Island, NY). Both HU and decitabine treatment caused an increase in % HbF+ cells and an increase in median fluorescent intensity (i.e., γ-globin expression per cell). This assay was used to determine that the individual batches of cells gave satisfactory γ-globin induction responses for screens.
Cryopreserved Cell Preparations of Day 7 EPCs
Most of the ELISA screening was performed using freshly prepared day 7 EPCs. However, to improve the availability of cells and allow flexibility in timing and number of plates screened for confirmatory assays, the EPCs were cryopreserved in small batches at the day 7 EPC stage for subsequent use.
A comparison of fresh and frozen EPCs from the same lot of bone marrow CD34+ cells was performed to confirm the suitability of frozen cells for the ELISA. The response of cryopreserved EPCs to optimal concentrations of HU and decitabine was not impaired and in some cases was greater than that from the same batch tested fresh at harvest on day 7 (
ELISA Assay Development, Validation, and Optimization
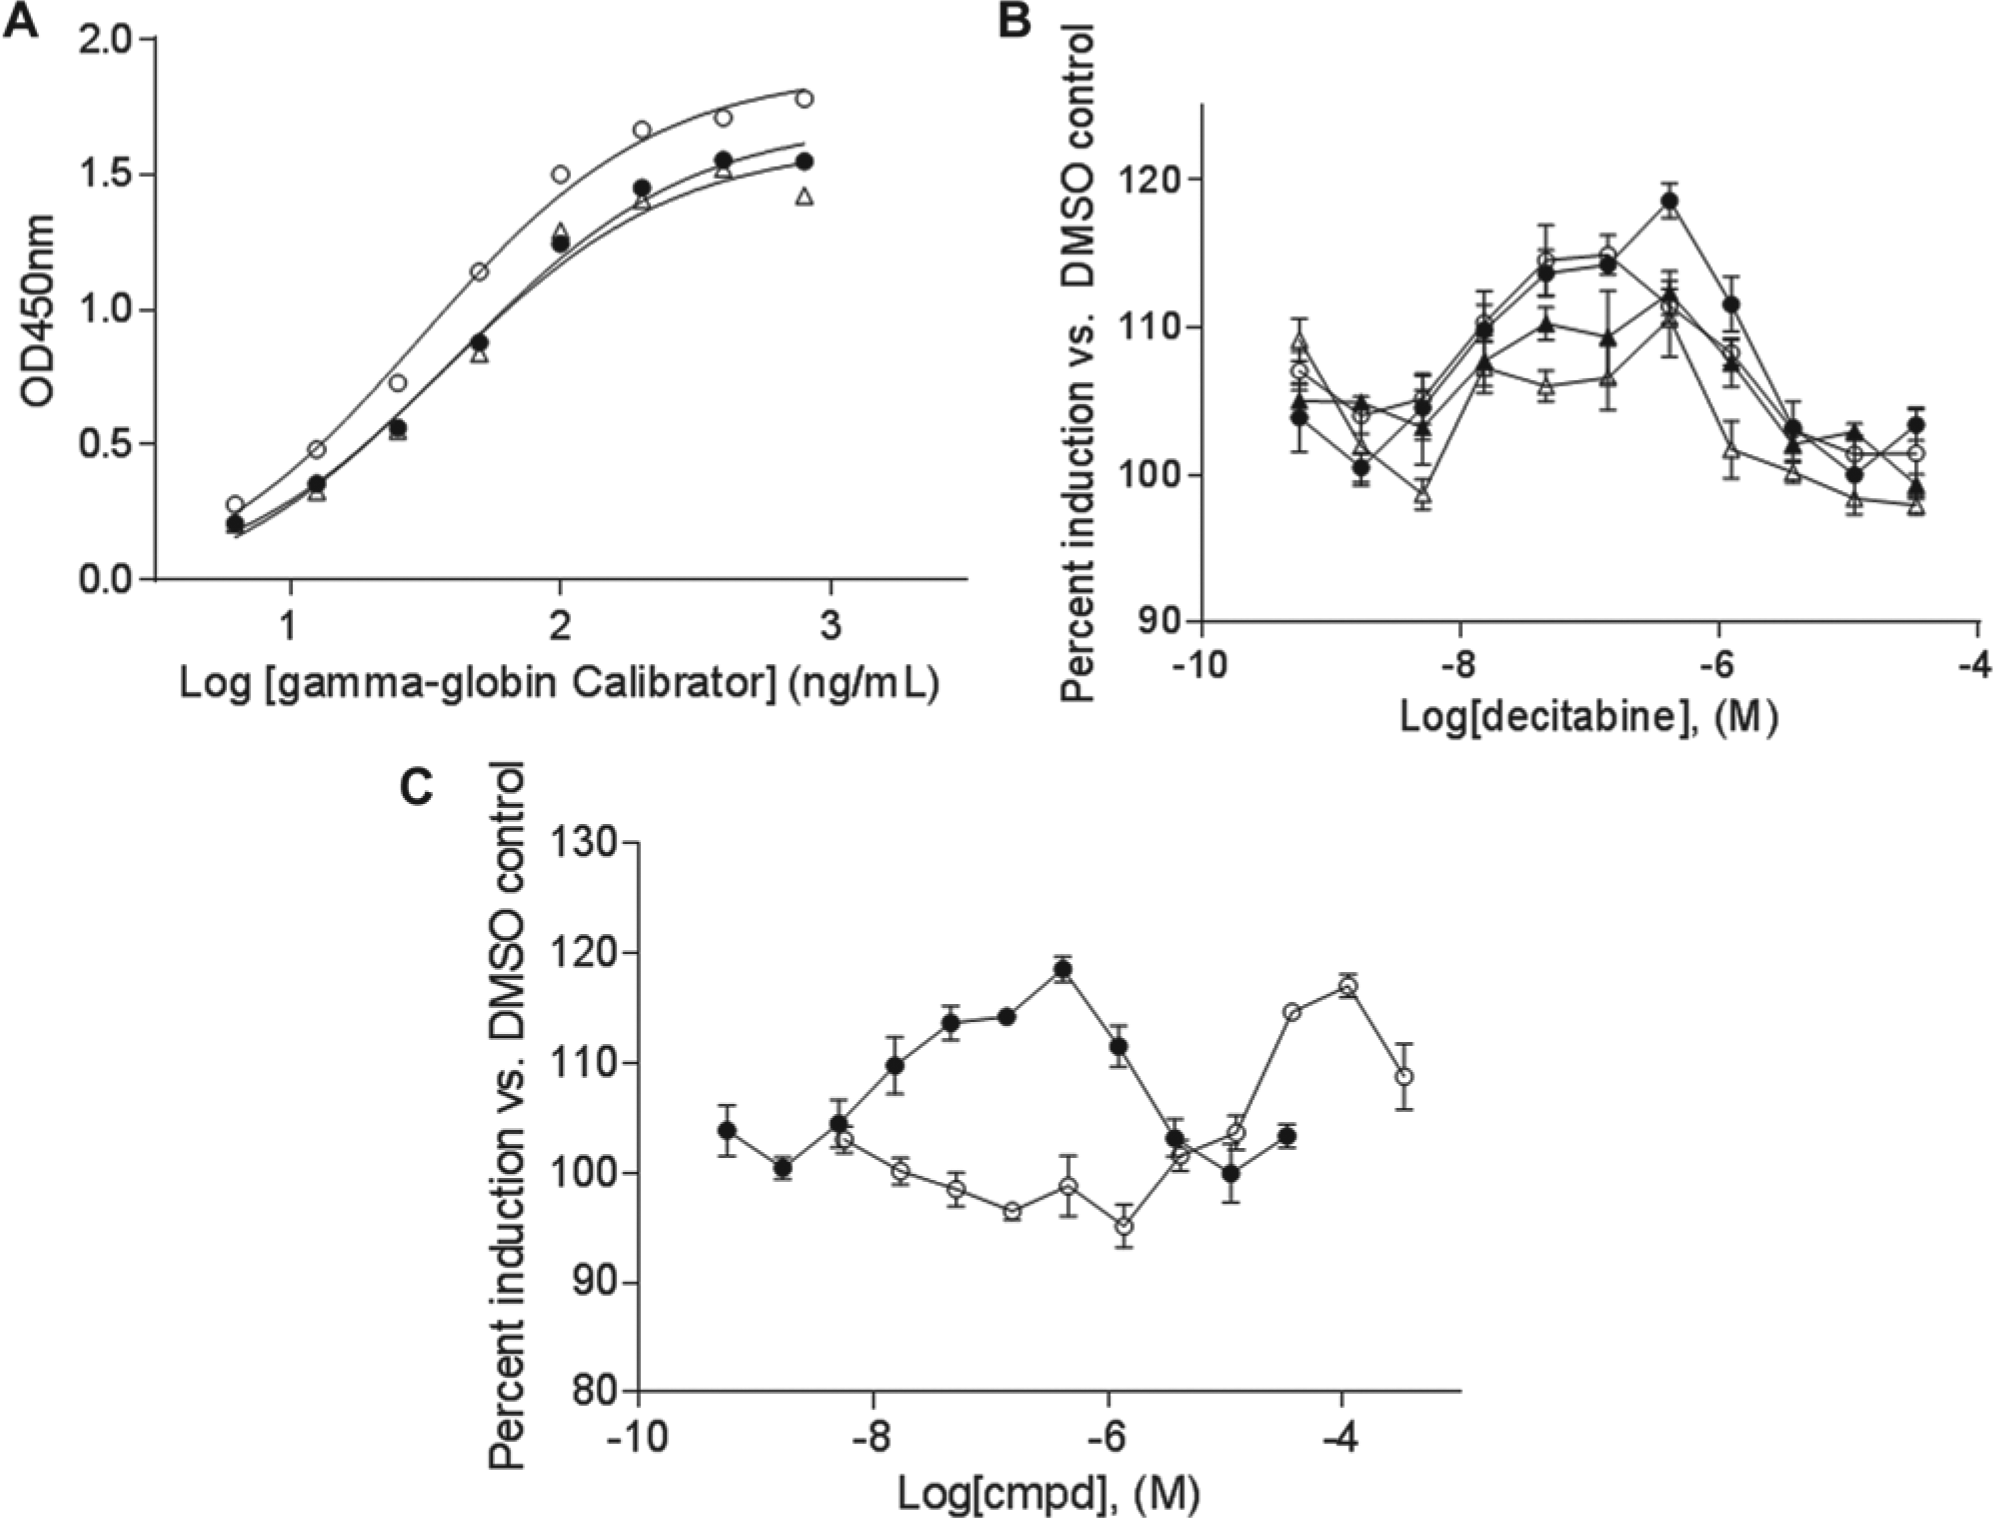
We used an Ab against γ-globin protein to develop a 384-well ELISA method. To validate the assay, we used a γ-globin calibrator obtained from Bethyl Labs. As shown in Figure 3A , the coated ELISA plates were stable for over a week at 4 °C. This provided convenience to coat and store the plates before the sample preparation. Figure 3A also shows that the dynamic range of the assay was from 10 to 1000 ng/mL, with the linear range from 10 to 100 ng/mL of the calibrator. It can also be seen that at above 100 ng/mL (OD450 approximately 1.5), the assay started to lose linearity, rendering the assay less sensitive. Meanwhile, additional data indicated that the total hemoglobin calibrator also showed significant signal at high concentrations (data not shown). Together, these data suggest that assay samples needed dilution to ensure they were in the linear range of the assay to accurately measure the γ-globin concentration.
Development and optimization of 384-well enzyme-linked immunosorbent assay (ELISA). (
HU and decitabine have been reported to induce γ-globin levels in EPCs.9,21,23 We therefore used HU and decitabine as tool compounds to treat day 7 EPCs to optimize the assay conditions. These cells were treated with different concentrations of HU and decitabine under four different cell densities (2000, 3000, 4000, and 5000 cells/well) for 3 days. After treatment, cell lysates were prepared and analyzed for the presence of γ-globin protein by ELISA. As shown in Figure 3B , the condition with 2000 cells/well (filled circle) had much better responses for both HU and decitabine than the higher cell density conditions (4000 and 5000 cells/well, filled and open triangles, respectively). In addition, in a separate experiment performed using another batch of day 7 EPCs, it was determined that the optimal response was obtained at 1000 cells/well (data not shown). Based on these results, we selected 1500 cells/well for the screening conditions. In addition to the cell density titration, we also analyzed different times between 1 and 6 days of compound treatment. Data demonstrated that the optimal dose-response curves, for both HU and decitabine, were on day 3 (data not shown). We reasoned that longer treatment with the compounds caused significant cytotoxicity, while cells treated with compounds for shorter periods of time had a lower γ-globin response.
Dose-response curves for HU and decitabine under the screening conditions are shown in Figure 3C . Decitabine had the highest signal of approximately 120% over the basal level (DMSO control) at a concentration of approximately 100 nM. The signal decreased above 100 nM due to cytotoxicity (not shown). For HU, significant induction over the basal level was achieved at approximately 50 µM. Of note, the optimal response level of HU and decitabine varies with different batches of day 7 EPCs.
During initial assay development, we kept cells undergoing compound treatment in a low oxygen incubator (5% CO2 and 5% O2) for the 3-day cell treatment. This was to mimic the low oxygen biological environment of bone marrow cells. However, the frequent nitrogen flow to the incubator (to keep the low level of O2) increased evaporation from the wells of the plate, resulting in higher edge effects for the 384-well plates. To mitigate the edge effect over the required 3-day incubation, in addition to placing a water tray at the bottom of the incubator, we added wet paper towels under the plates and placed sterile water-filled dishes at the corners of each shelf. Due to the space limit of the incubator and multiple wash steps of the assay, it was not amenable for screening our full compound collection of more than 2 million compounds. Instead, we chose to screen a focused library set as described below.
Later on, we found that there were no differences in γ-globin expression in cells cultured under 5% oxygen or normoxia. Therefore, screening and secondary assay plates were cultured in a 5% CO2 incubator at 37 °C unless otherwise indicated (
The ELISA measures γ-globin in a pool of cells and cannot distinguish between an increase in the total number of cells with unchanged γ-globin level and an increase in the amount of γ-globin per cell. It is, therefore, necessary to develop secondary assays (e.g., the Opera-based HCI assay to confirm the induction of γ-globin per cell rather than an increase in γ-globin protein in the bulk cell population).
HCI Assay to Evaluate γ-Globin Protein Expression
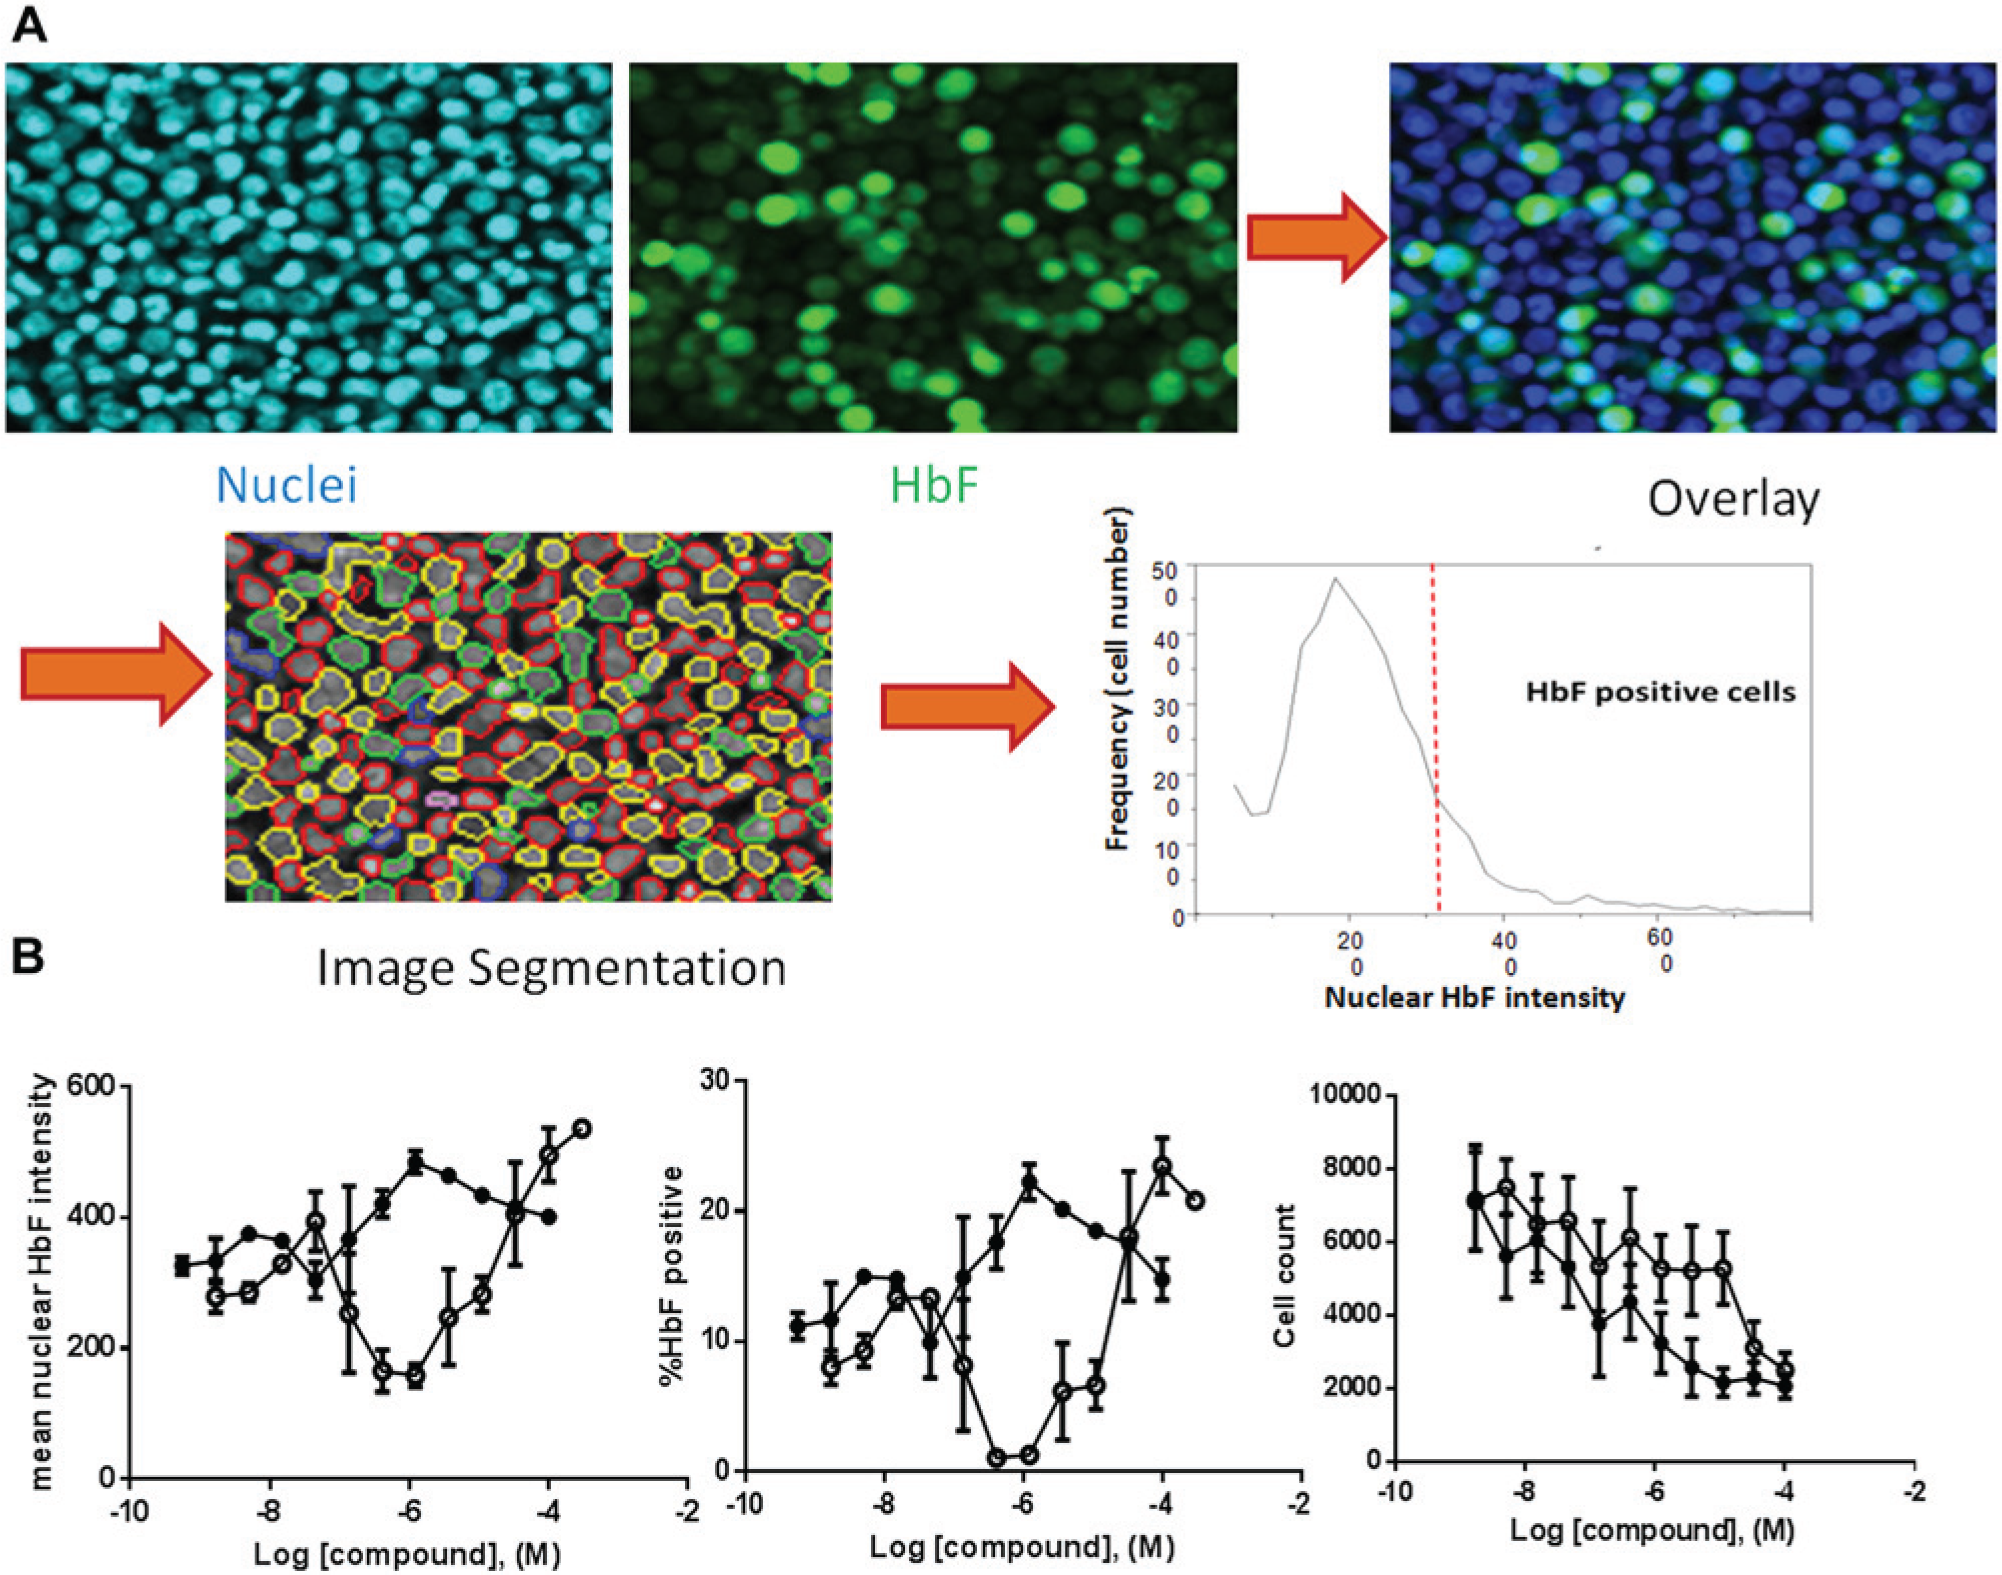
As an orthogonal assay to detect γ-globin protein in compound-treated cells, a 384-well HCI assay was developed. The main challenge of the HCI assay was liquid handling. To retain a suspension of day 7 EPCs, centrifugations and aspirations were introduced and optimized. The BioTek ELx405 plate washer enabled adjustments to optimize aspiration speed, tip depth, and tip position, conditions that were vital to the success of the assay. After all wash steps, up to 30% to 40% cells were lost. However, HCI is based on single-cell measurement ( Fig. 4A ), and as long as there were enough cells (e.g., 500 cells per data point), data quality remained high. Furthermore, single-cell–based analysis was particularly useful when cell health was affected by compounds, which led to cell count variation between assay wells. After a 3-day incubation with some compounds, the cell number was significantly lower at higher doses (cell count in Fig. 4B ). This caused significant bell-shaped curves in ELISA ( Fig. 3B ). In contrast, since HCI measures γ-globin level from each individual cell independently, the aforementioned bell-shaped curves can be corrected (mean fluorescence intensity curves in Fig. 4B ). As seen in Figure 4B , cells treated with both HU and decitabine showed a dose-dependent response either measuring mean HbF intensity or %HbF+ cells. The mean fluorescence intensity in HCI reflects actual γ-globin level in each cell. In addition, the HCI assay can provide multiple readouts, such as cell viability (cell count) and γ-globin expression level ( Fig. 4B ). Another advantage of the HCI assay is that it offers the ability to examine cells visually. In a high-throughput screening environment, visual examination by HCI can assist in eliminating various artifacts (e.g., staining aggregates and abnormal cellular morphology) to help confirm legitimate hits.
Quantification of γ-globin in day 7 erythroid progenitor cell (EPCs) using high-content imaging (HCI). (
LC-MS Analysis of γ- and β-Globin Levels
A more detailed analysis of the levels of β- and γ-globin protein is necessary to confirm that compounds are specifically inducing γ-globin, rather than inducing both β- and γ-globin. In addition, an increase in cell number relative to controls may also appear as an increase in γ-globin in the ELISA. The levels of γ- and β-globin in treated cells relative to the DMSO control cells were determined using LC-MS. Globins (α, β, A-γ, G-γ) were identified by their molecular weight. The identities were confirmed by direct MS/MS sequencing of the intact proteins. Globins were quantitated by extracting the ion current relative to each globin and integrating the peak area ( Fig. 5A ). Day 7 EPCs (2 × 10⁵ cells) were treated for 3 days in the presence of 100 µM HU or 100 nM decitabine. Peak intensities of the soluble lysates were quantitated and normalized to the intensity of the α-globin. Data were reported as fold change versus the DMSO-treated control. As shown in Figure 5B , the β-globin level in the cells was unaffected by HU or decitabine treatment. In contrast, the level of γ-globin in the treated cells increased by 1.4-fold for HU and 1.7-fold for decitabine, respectively. In experiments with day 7 EPCs isolated from four different donors, the levels of γ-globin increased by an average of 1.2- and 1.5-fold in cells treated with HU and decitabine, respectively (data not shown). We also noted that the G form of γ-globin demonstrated a greater increase than the A form under both conditions (data not shown).
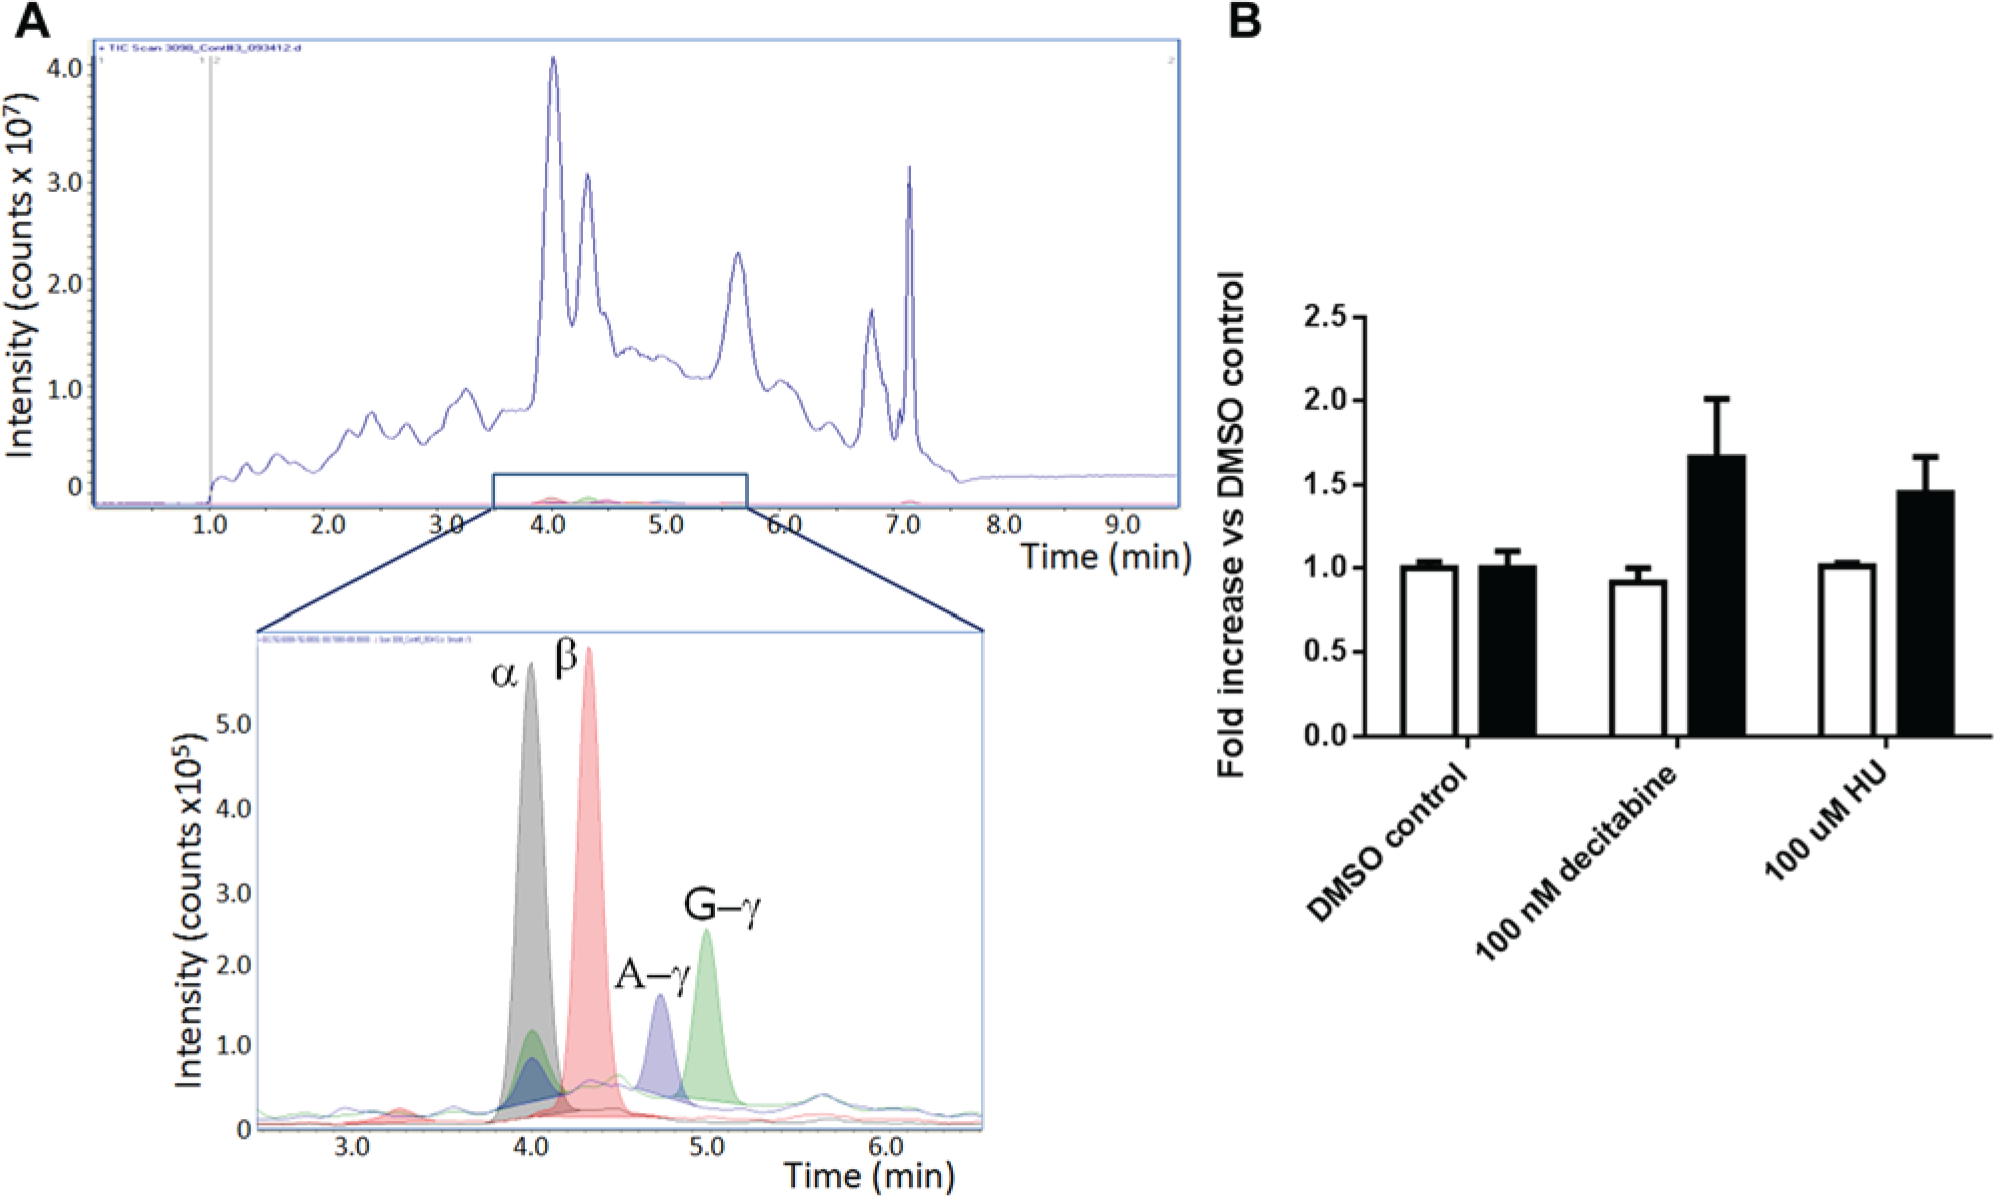
Quantitation of globin day 7 erythroid progenitor cells (EPCs) by liquid chromatography–mass spectroscopy (LC-MS) analysis. (
Results of a Focused Screen
A total of 7408 compounds were selected for screening in our ELISA-based γ-globin induction assay. These compounds were divided into three categories: target, chemotype, and pathway, based on the methodology employed to select them for testing. We chose 1181 compounds based on their ability to interact with specific biochemical targets, several of which have been recently implicated in the regulation of γ-globin production.27,28 We also selected 3329 compounds for testing based on the presence of specific chemotypes (i.e., metal-binding hydroxamic acids) as potential γ-globin–inducing pharmacophores. Finally, we chose 2898 compounds that had been previously determined at GlaxoSmithKline to interact with key biochemical pathways, such as epigenetic processes, that have been reported to regulate γ-globin production.19,29 –32
As seen from the assay development, cells treated with decitabine resulted in a bell-shaped dose-response curve of γ-globin induction. This was likely caused by a decreased cell viability effect at higher compound doses ( Fig. 3B ). To cover a broad range of compound concentrations, we decided to screen these selected compounds at 11 doses starting from a high concentration of 33 µM with 3-fold serial dilution. During assay development, we also observed that DMSO alone caused significant induction above a concentration of 0.5% (data not shown). So, as a basal level of induction (low control), we added 0.3% DMSO in column 6. We used the γ-globin calibrator in column 18 as a high control. Since this is an activation assay, we did not apply typical Z′ criteria (i.e., Z′ > 0.4) to assess the quality of the screening plate. Instead, we used % coefficient of variation (CV) of the low controls to fail the plate if it was >10%. The Z′ value was used as a measure for quality control (QC) of the reagents. As a result, the screening quality was determined by measuring the CV (DMSO as low control, ≤10%), Z′ (≥0.3, with DMSO as low control and γ-globin calibrator as high control), and the ELISA calibration curve (≥4 points in linear fit with R2 ≥0.98).
To complete approximately 250 × 384 compound plates, we used day 7 EPCs derived from multiple bone marrow donors. We found that the induction of γ-globin level varied in max response from 120% to ~135%, but the concentration corresponding to the max response did not change among different donors (
Due to the low level of response seen following treatment with the tool compounds HU and decitabine, screening hits were selected based on an arbitrary rule (i.e., three consecutive points above the basal level with the maximum percent response of >115%). Using these criteria, we selected 534 compounds for further confirmation. These compounds were retested in 11-point dose-response curves in duplicate starting from 33 µM against two different marrows. Of these, 75 compounds were confirmed and 18-point dose-response curves were performed for these compounds. One confirmed hit was compound A. This compound showed a clear dose-dependent response with greater γ-globin induction response levels than those seen with decitabine ( Fig. 6 ). However, this compound also demonstrated decreased Cell Titer-Glo activity at a concentration above 10 µM. Further investigation of the γ-globin induction response of compound A is ongoing and will be reported in due course.
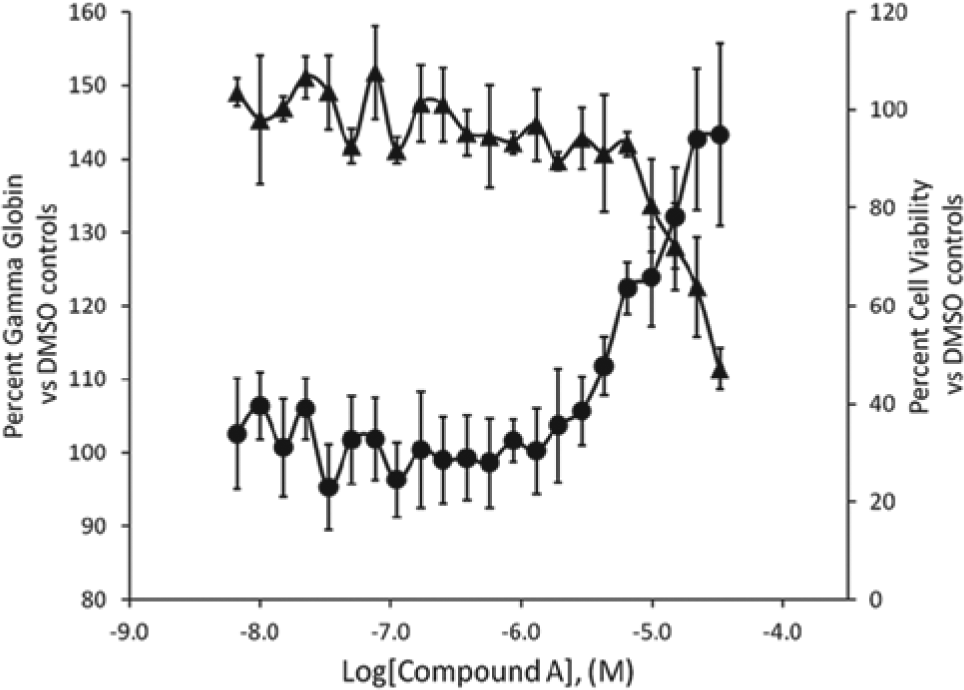
γ-Globin induction response and effects on cell viability by compound A in day 7 erythroid progenitor cell (EPCs). The γ-globin induction abilities of compound A were monitored in a dose-dependent manner in the enzyme-linked immunosorbent assay (ELISA). Cell viability was measured using the CellTiter-Glo (Promega, Madison, WI) assay. Each data point is an average of nine or four testings on separate dates at an indicated concentration in ELISA or CellTiter-Glo assays, respectively. Fetal hemoglobin ELISA (▲); cell viability (●). Error bars are ± standard deviations.
Secondary assays are in place to confirm activity seen in the ELISA and to further characterize the hits for their ability to induce γ-globin. These assays include BFU-E and CFU-E assays, further differentiation into reticulocytes with γ-globin expression in reticulocytes, and induction of γ-globin in erythroid progenitors derived from sickle cell patient blood.
In summary, we have demonstrated the feasibility of screening thousands of compounds for the ability to induce γ-globin expression in a phenotypic ELISA-based system using primary human bone marrow–derived cells and have identified at least one new γ-globin–inducing compound. While there were several potential limitations to this assay approach, including variable basal γ-globin levels, batch-to-batch variation in response, edge effects, and availability of fresh cells, measures to resolve these issues were undertaken and shown to be effective. The confirmation and characterization of screening hits in secondary assays will ultimately determine the utility of this phenotypic assay system to identify compounds to induce γ-globin for the treatment of SCA.
Footnotes
Acknowledgements
We thank the GSK SMTech group for their support in providing screening compound plates, Lisa Payne for help with preparing frozen cells, and Dr. Juliet McComas for her assistance in obtaining appropriate cell sources.
Declaration of Conflicting Interests
The authors declared no potential conflicts of interest with respect to the research, authorship, and/or publication of this article.
Funding
The authors received no financial support for the research, authorship, and/or publication of this article.
References
Supplementary Material
Please find the following supplemental material available below.
For Open Access articles published under a Creative Commons License, all supplemental material carries the same license as the article it is associated with.
For non-Open Access articles published, all supplemental material carries a non-exclusive license, and permission requests for re-use of supplemental material or any part of supplemental material shall be sent directly to the copyright owner as specified in the copyright notice associated with the article.