
Abstract
Customized compound picking and plating of very large corporate screening decks (many 100,000s) for high-throughput screening is generally restricted, both from a time and cost perspective. Here we present a stratified screening deck with accompanying plating design for use with very large corporate compound collections. The deck is plated as a whole, but copies for screening can be downsized flexibly and quickly on the fly, without the need for repicking of physical samples. We show that such downsized sets maximize returns and yield results superior to randomly picked subsets of the same size. For the proposed stratified plating design, structurally diverse subsets that cover the full collection in terms of compound diversity and favorable compound properties can be produced economically and quickly from the full set of master plates. The design was implemented globally at AstraZeneca in 2009 and has enabled substantial cost-saving in screening campaigns, as set size requirements can be met on a per-screen basis, using a single, preplated master deck.
Keywords
Introduction
High-throughput screening (HTS) is an established method used for “lead generation”—one of the earliest phases toward the discovery of a potential new drug. It involves the screening of large compound sets with biological assay systems that are technically amenable and economically affordable for high throughput. With success rates that are on average between 50% and 60%,1–4 HTS will continue to be a major source for chemistry starting points (hits) in drug-hunting projects. To maximize the chances of finding a hit, one typically wishes to screen the entire chemical equity that is available in the form of the full corporate collection at a company (subject to any preexisting legal restrictions). Such corporate collections are composed of diverse compounds that have been synthesized in various projects over the company’s lifetime, compounds that were purchased from external vendors or compounds that were obtained through mergers and acquisitions. Corporate collections were extended further in the 1990s through the combinatorial chemistry revolution 5 and more recently through extensive collection enhancement programs. As a result, collections of established pharmaceutical companies can be in the range of several 100,000s to several millions of physical samples.2,6
Above developments have also affected the economics of screening, as the testing of more and more compounds naturally increases the overall cost for HTS. Although advances, both technical, with respect to compound dispensing, and biological, with respect to assay development, have helped to reduce the cost and effort per screening point, 7 the emphasis in HTS is moving to higher content and quality 3 so alternative cost-saving measures are required. One alternative approach is the screening of mixtures, which requires subsequent deconvolution of the screening results. 5 Its application in HTS is not common and results can be hard to interpret due to compound reactivity and binding promiscuity, for example.
The screening strategy of using subsets rather than the entire collection has the advantage that sets can be tailored to bias particular target class compounds and presupposes a focus on quality more than quantity. Generally, such sets attempt to limit the overall diversity or to favor particular compound properties, thus aiming for better starting points for a chemistry program. The compilation of a subset generally involves weeding out undesired physicochemical properties or redundancies of compound classes, which may have been introduced over time in corporate collections through project-oriented chemistry programs. In practical terms, a drawback of having different compound subsets for different screening strategies is the duplication of compound samples onto different screening plates, since a single compound can be part of multiple sets. Not only does this increase the costs for maintenance, but it also depletes compound stock since each separate vial contains a certain dead volume of sample that will be nonrecoverable.
The most common screening strategy in HTS-based lead generation is screening of structurally diverse compound sets, and it is therefore desirable to have at least one generic deck of screening samples that (a) attempts to represent the chemical diversity present within the entire corporate collection, (b) will result in the most useful starting points for medicinal chemistry programs, and (c) balances cost of screening and maintenance. In this article, we propose a screening deck with an accompanying static plating design that can be maintained centrally and sampled in a cost-efficient way, with a limited and predictable impact on success rates. In addition, the suggested layout for compounds on screening plates biases content toward more lead-like compounds in smaller subsets by taking into account molecular properties.
Although there is still the expenditure of picking and plating the initial master plate set, our cumulative plating design allows compounds to be stamped out such that different deck sizes can be copied efficiently and cheaply from a single set of master plates, so that screening capacity can be tailored easily to a screening deck on a per-campaign basis. We show that the suggested design offers a better-than-random retrieval rate of active compound classes for a typical corporate collection while representing the full diversity of compound classes. The benefits achieved this way are 3-fold: first, the tailored subset does not need to be picked and plated but can be copied expediently from the master set; second, the screening of a smaller sized set will constitute a cost saving in itself; and third, use of a single master screen set harmonizes use of chemical equity, data generation, and operating practice across globally dispersed research sites.
Methods
Clustering
Where we mention clustering in the following discussion, we refer to a grouping of compounds typically based on a Daylight-type structural fingerprint distance. 8 In our in-house implementation of these structural fingerprints, a clustering threshold distance of 0.3 is used, and clustering of large sets is performed using a sphere-exclusion approach. 8 Compounds grouped together this way generally show a meaningful degree of chemical similarity.
A Simple In Silico Model for Predicting Screening Outcome
A simplified HTS exercise is depicted schematically in Figure 1 . A large corporate compound collection, or a subset thereof, is measured using a biological assay for a selected target, and following detection of activity, a second round of screening is used to confirm actives. Confirmation of activity is generally obtained by screening “near-neighbors,” compounds that are structurally similar to the hits that were initially identified. Within groups of structurally similar compounds, we tend to observe a range of activities if these compounds, in general, have an appreciable and genuine effect on our target. In this way, it is possible to weed out false-positive results (i.e., removing/identifying compounds that appear active in an assay for reasons other than binding to the intended target). The observation that compounds have an increased chance of being active if a near-neighbor is active is generally recognized by medicinal chemists as structure-activity relationships (SAR) and serves as a guide for iterative hit-to-lead development steps. To be able to build SAR information, we need a number of compounds displaying a range of structural variety within a class.
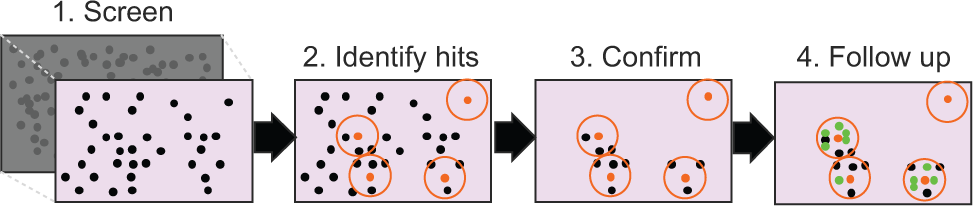
A typical high-throughput screening approach. The following steps can be discerned: (1) collation of a diverse subset from the full corporate collection; (2) screening of the set using a biological assay and identification of hits (shown as orange dots), (3) screening of similar compounds from the current collection to confirm structure-activity relationships (SAR), typically as dose-response measurement; and (4) follow-up of a selection of series following analysis of the hits (e.g., by new synthesis efforts or acquisition) (shown as green dots).
When screening a compound, the screen readout is, in approximation, the result of two orthogonal contributions that determine detection of compound activity. The first contribution is that of the target that we screen and suitability of the biological assay. As a result of binding to the target, certain types of compounds will show biological activity, and this enables detection. This effect is strictly a result of the nature of the target and the compound that binds to it. The second contribution to screen outcome is more difficult to characterize and depends on the content of our screening collection and, hence, chance. The nature of the compounds in our collection determines whether we do indeed have a chance of seeing any biological activity, but apart from that, we also need to consider the abundance of “similars”—that is, even if we know that we have compounds that are similar to actives, there is still the chance that we simply do not have the right compounds that will bind. This is not unlikely. Estimations of chemical space 9 range up to 1060 and, with corporate collection sizes on the order of millions, it is obvious that the latter are but small samples of that space. Given that we do not know a priori which compounds will be active for a new target, there is strength in numbers. By making sure we measure a sufficiently large number of compounds, we maximize our chances of detecting an active compound.
In the following, we ignore the effects of false positives, false negatives, and assay noise. False negatives are active compounds that are not detected with the assay at hand. Their loss can be prevented through rescreening of the full screen set in an alternative and different assay, which is generally not possible. The incidence of false negatives can be minimized to some extent through careful optimization of the HTS primary assay in terms of noise and reproducibility, and at AstraZeneca, latter assay properties are checked to be within acceptable bounds prior to deployment in a screening campaign. False positives are well known to occur in screening, and the understanding of their causes has increased considerably in recent years.10–15 Again, optimization of the primary screening assay goes some way in preventing their occurrence. False-positive and false-negative rates are expected to be largely independent of subsetting approach when dealing with large sets, and their impact is generally seen on follow-up of the clusters resulting from primary screens. At that stage, false-positive results are generally dealt with using assays designed specifically for that purpose further downstream in the HTS screening cascade.16–18 For this reason, we will not explicitly address their effects further in this article and assume that their impact remains constant regardless of subsetting strategy. In addition, exclusion of such likely false-positive compounds upfront where historical HTS results indicate severe anomalous behavior mitigates their influence at AstraZeneca (this strategy is part of the design discussed here).
A simple model to simulate screens based on above assumptions is outlined in Figure 2 . First, we divide the screen set into groups of similar compounds, a process generally referred to as clustering. The hit rates of interest are the chance of observing an active cluster, for a given target (Hcluster), and the chance of observing an active compound in an active cluster (HSAR). The former is largely dependent on the druggability of the target and suitability of the assay. The SAR hit rate depends on target type and type of clustering used.
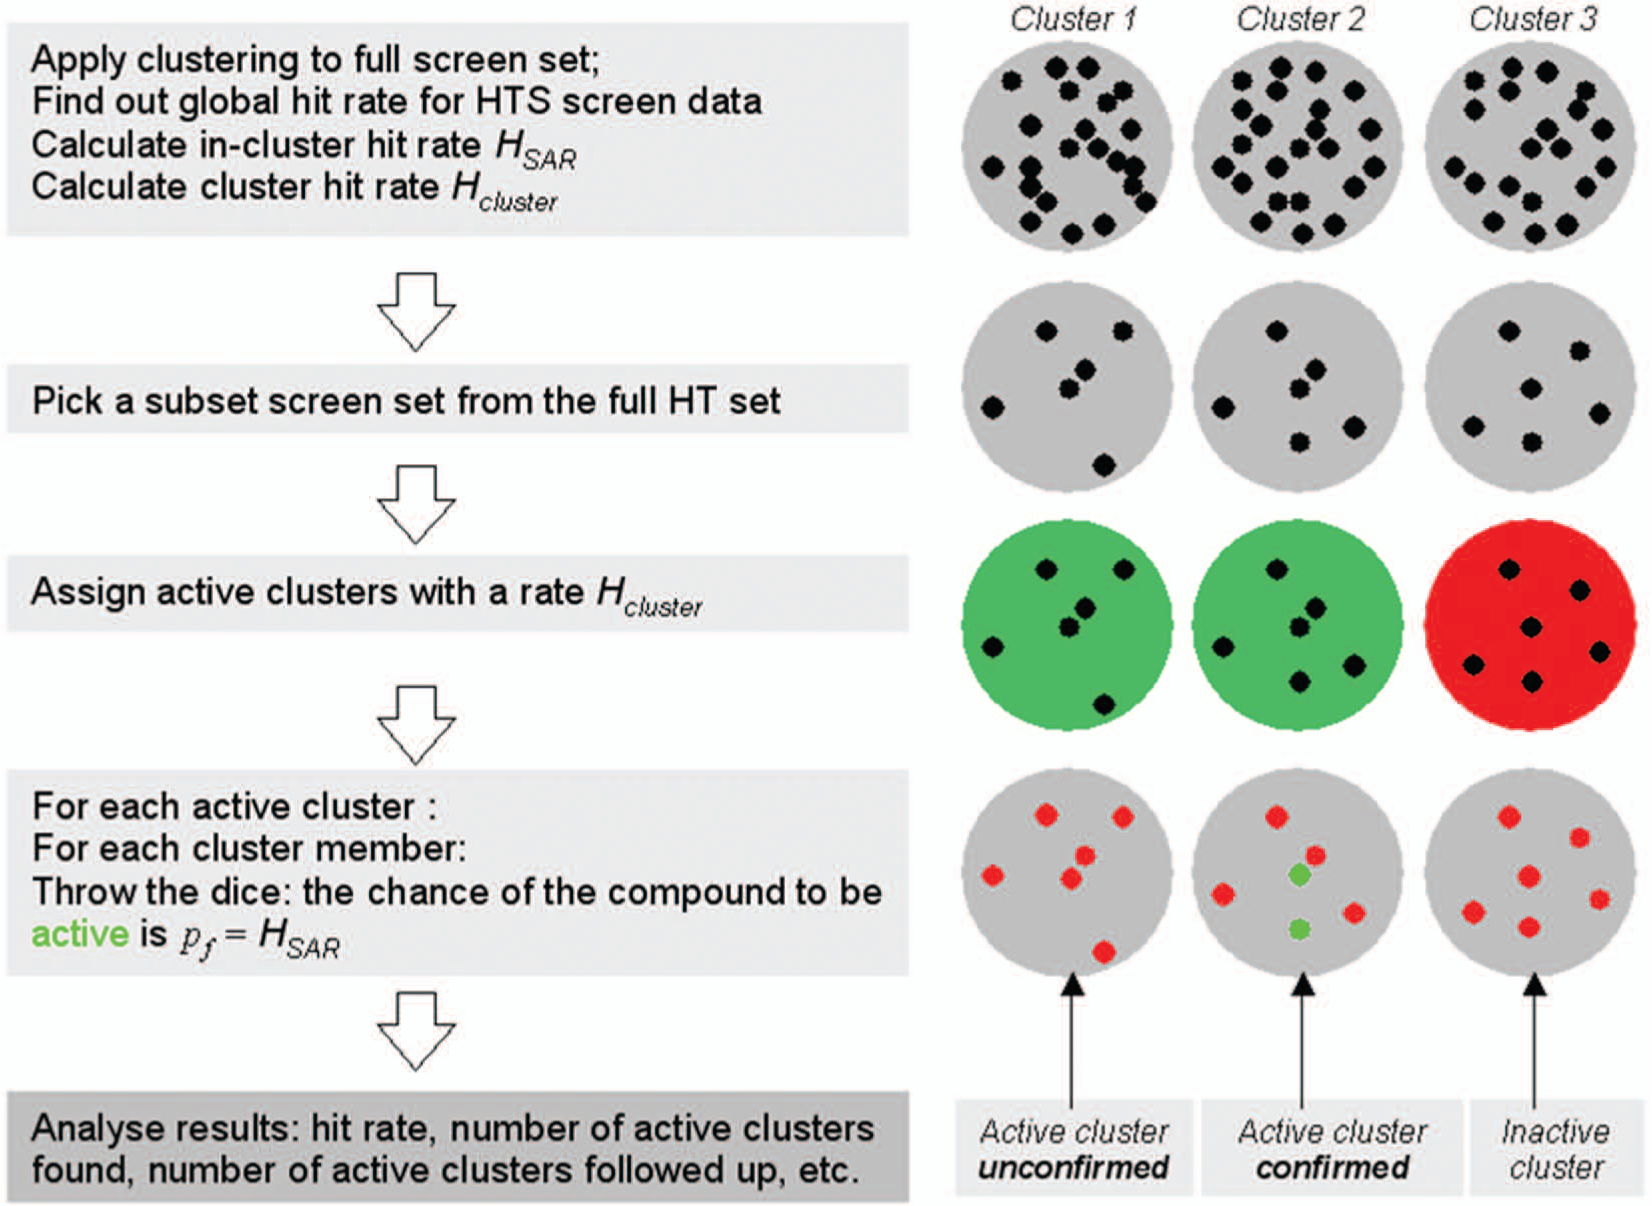
Graphical representation of the in silico model used to simulate the outcome of a high-throughput screen. See text for further explanation. HT, high throughput; HTS, high-throughput screening.
Once the above hit rates are known, we can simulate a (noise-free) screen by designating our active clusters according to Hcluster and picking active compounds within these clusters according to HSAR, at random, using the protocol designated in Figure 2 . If required, we can further embellish the simulation by introducing a false-positive rate (the chance that a nonactive compound turns up active) and a false-negative rate (the chance that an active compound is not detected). Such anomalies are generally the result of assay characteristics, and we ignore these in the context of the work presented here.
Concept of Stratification
To represent the structural diversity of the full set in a subset, we need to represent each and every cluster of compounds by a suitable number of candidate compounds. In practice, this will not always be possible. At the one extreme, there will be structural singletons—that is, where a compound has no near-similars in the corporate collection, and therefore only a single compound can be selected to represent the structural class. At the other extreme, there will be classes of compounds that are overrepresented (e.g., as a result of in-house project work that targeted specific chemical series or combinatorial chemistry strategies). The size of the majority of compound classes will lie between these extremes: most clusters will contain just a small number of representative compounds. As a result, picking a representative set will be restricted by the total number of available compounds and their coverage of chemical space in terms of compound clusters.
By picking up to a fixed number of compounds from each cluster, we can create a diverse subset of compounds that we hope will represent the diversity of compounds in the master set from which they are picked. By ordering these selected compounds across a number of strata (i.e., “layers” or plate sets), we create a static set of plates that can be subsetted by picking the strata cumulatively (this is shown in
Cluster members are distributed sequentially across the strata, such that each stratum contains cluster member compounds m to n. The result is as follows: stratum S (singletons) contains singleton cluster members, stratum 1 will contain the first member n1 of each and every nonsingleton cluster, cluster 2 will contain members m2 = n1 + 1 to n2 of each and every cluster, cluster 3 will contain members m3 = n2 + 1 to n3 of each and every cluster, and so on.
For each stratum, the numbers m and n are chosen such that the total number of compounds m to n summed over all clusters per stratum is approximately equal. This way, the granularity of the subset sizes can be set. For example, with a compound collection of approximately 1 million compounds, we were able to use a stratum size around 100,000, so that cumulative subsets containing approximate multiples of 100,000 could be applied in screening.
Subsets are collated by cumulatively combining the layer sets, starting from the singleton stratum. Such subsets will contain the maximum number of available compounds per cluster up to mstratum, thus ensuring that all structural diversity present in the original set is covered by the subset. During the process of populating the different strata with cluster representatives, we have the opportunity to make a conscious decision over which cluster compound to pick preferentially for a certain stratum. Since the quality or perceived lead-likeness of compounds within a cluster can vary significantly, it makes sense to select the more lead-like and high-quality compounds into the lower strata and fill the remaining strata with decreasing attractiveness with regard to lead generation starting points. There is abundant debate over what defines lead-likeness or compound quality (see, e.g., Chuprina et al. 19 ). For the purpose of our internal stratification, we have chosen a simplified set of descriptors including MW, predicted lipophilicity, predicted solubility, an internally developed lead-likeness classifier (AZFILTERS 20 ) and an internally developed score for frequent-hitter likelihood. The selection of these descriptors was based on an analysis of major decision criteria used in house in the hit evaluation phase (i.e., in the step when hits are selected from the HTS output for follow-up). A simple penalty scoring scheme using these descriptors was devised to reflect a ranking by desirability. Within a cluster, compounds are ranked by penalty prior to selection, and as a result, low-penalty representatives are more likely to be entered into the lower strata ( Fig. 3 ).
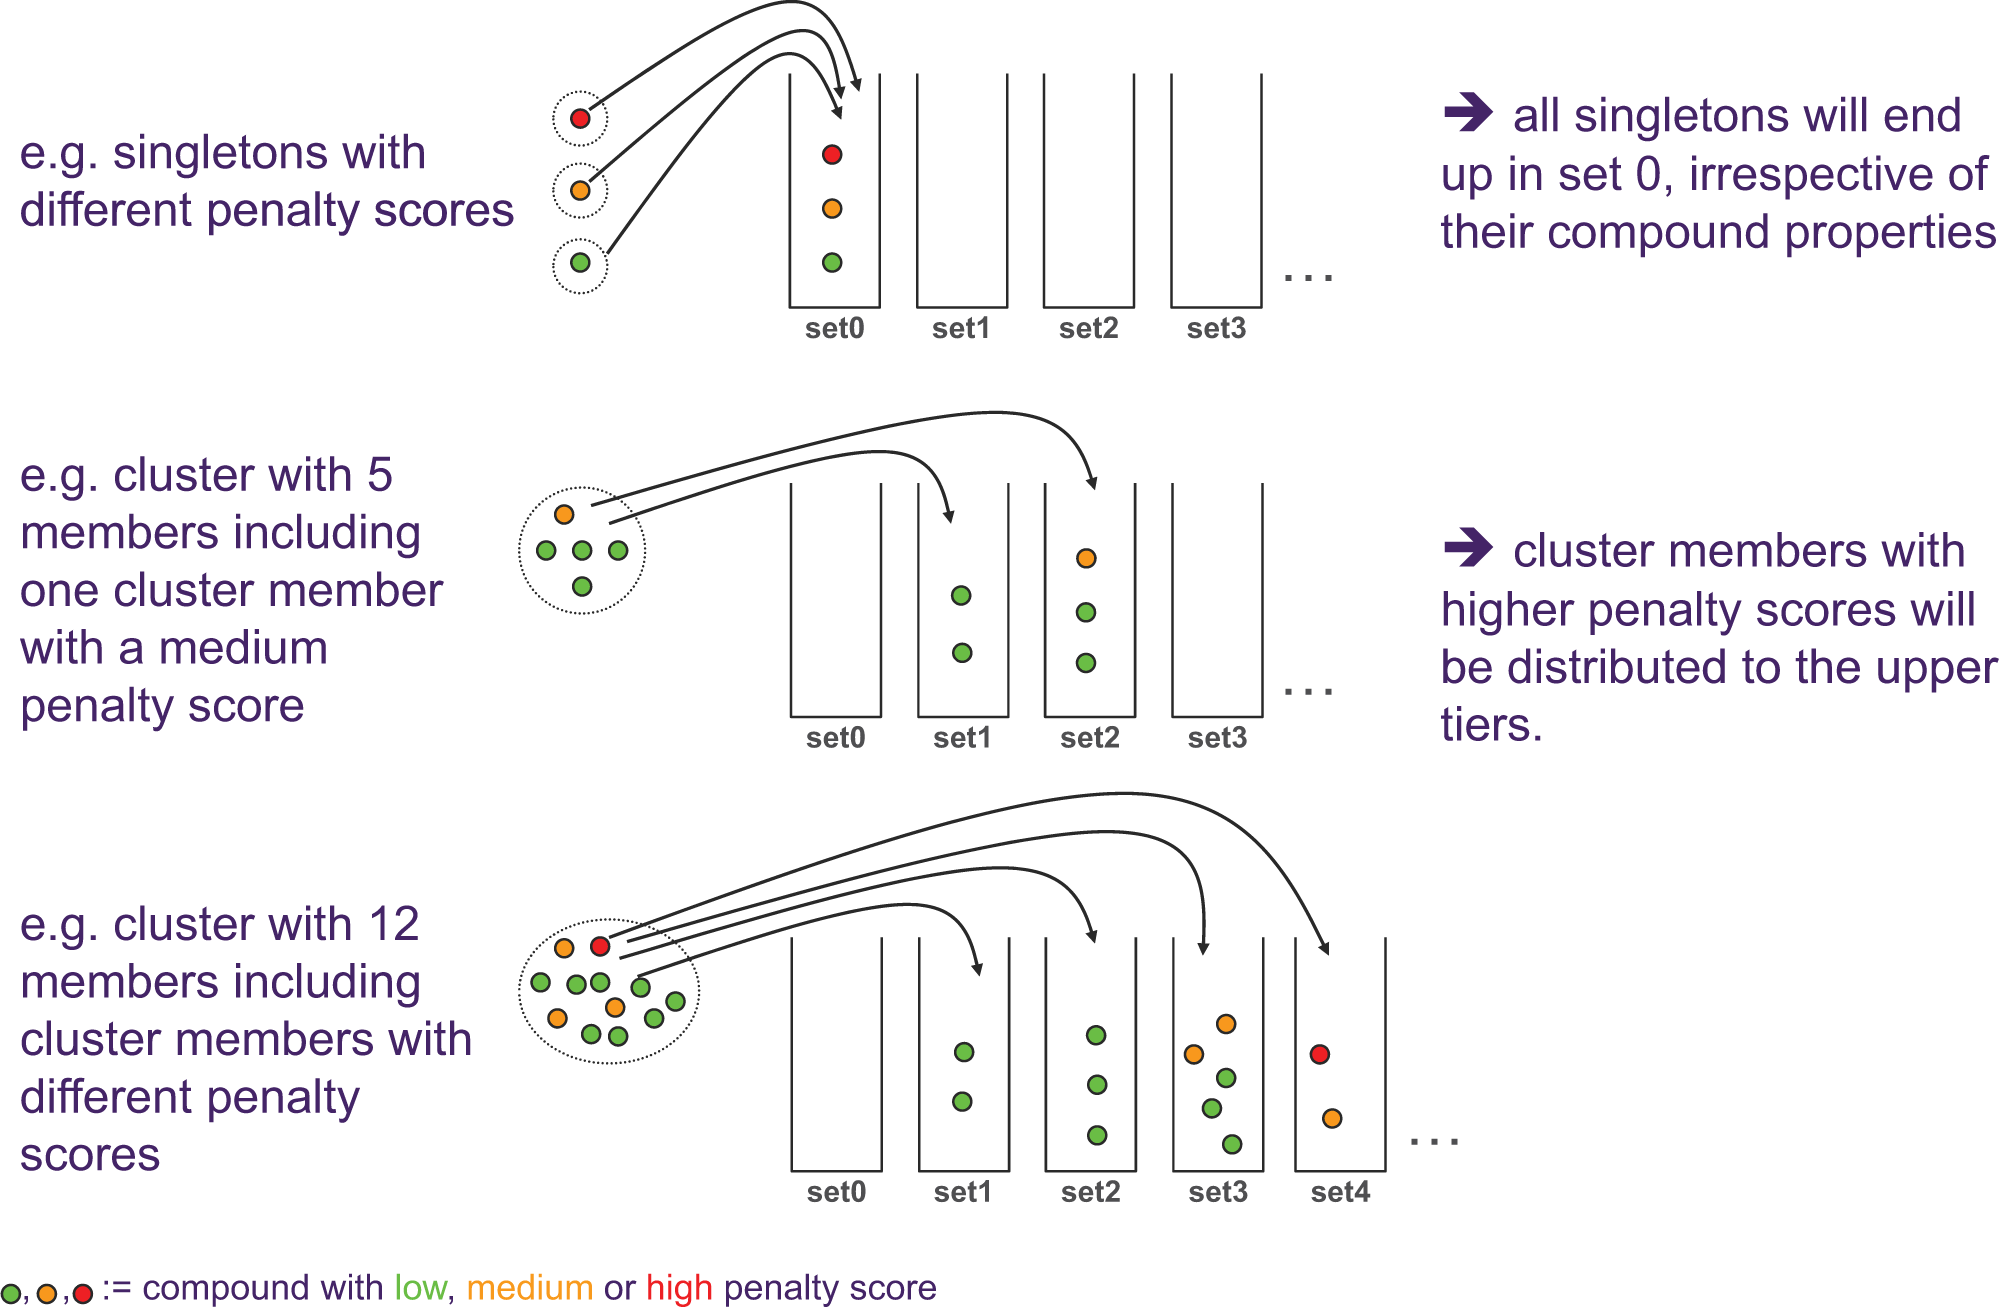
Examples for distribution of compound clusters (and singletons) over the strata sets under consideration of their chemical attractiveness. Each individual compound has a penalty score, and cluster representatives with lower penalties are favored to the lower set. Per definition, all singletons end up in “set 0,” irrespective of their penalty score.
How Many Compounds from a Single Cluster Do We Need to Screen?
Stratifying the collection in the way outlined above raises the question of how many compounds mstratum from a single compound class (i.e., cluster) need to be screened for an expected reasonable return. Knowing the HSAR hit rate that applies within a typical active cluster, we estimate the optimal number of cluster compounds to be measured as follows. The goal of screening is observing at least one active compound in a cluster of compounds with biological activity, as only then can we progress that particular cluster of compounds for follow-up. We treat the full set of compounds as a random, suitably diverse sample. Since it is not known a priori which compounds in a cluster are going to be active, we assume a binomial distribution (in a recent article, Bakken et al. 19 use a similar approach called “belief theory”). Using this, we calculate an estimated probability pactive of seeing at least one active compound in a random sample of N related compounds as
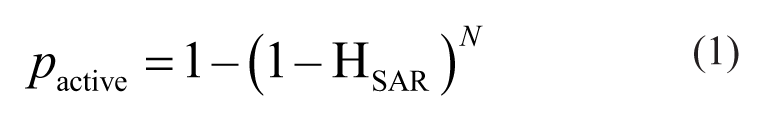
(Equation (1) equals 1 minus the chance of not seeing any actives.)
Retrospective analysis of high-throughput data suggests values of 5% to 10% for in-cluster SAR hit rate HSAR. In our case, neighborhoods (i.e., clusters) were defined using a sphere-clustering approach based on fingerprint distances (maximum distance 0.3; sphere-exclusion approach 8 ). We note that such SAR hit rates will depend heavily on the clustering method and threshold distance that is applied.
For an optimal screen, we stipulate that we want to be >95% certain of seeing an active when measuring N compounds from an active class (i.e., pactive>95%). In that case, we would require at least 29 observations when the SAR hit rate HSAR is 10% (equation (1)). For a SAR hit rate of 5%, we would require N = 59 or more observations to be 95% sure that we see at least one active compound in our compound cluster. Using the stratified set, we can easily assemble an optimal high-throughput screen set by collating the strata that cover cluster members up to and including mstratum = 59 (assuming a low SAR hit rate scenario of 5%, which would require a higher number of cluster members to be screened than for a higher HSAR). In our example stratified collection, this amounted to a set size of ~0.7 million (approximately two-thirds of the total set), which constituted a significant reduction over the full set size of 1.2 million entries. An informed decision on set size required for screening can be made in practice by running a small validation screen prior to the screen itself to estimate the observed hit rates.
Follow-up by Secondary Screening
When subsets are screened, hits that have not been included in the initial screen will never be found. Any application of subset screening therefore requires a follow-up round of secondary screening, to screen additional members of “active clusters” that are identified by having at least one active compound. This process becomes more important with decreasing set sizes. One should keep in mind that with decreasing cluster size, the chance of not observing activity in a cluster that does in fact encompass active compounds increases quickly. An approximation of the chance Punobserved of not detecting an active cluster as a function of cluster size N is shown in equation (2) and Figure 4 .
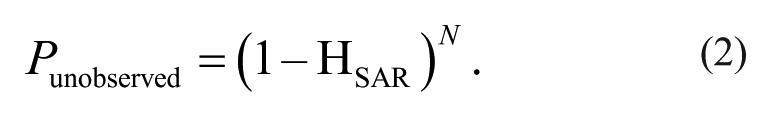
Chance that a cluster harboring an active compound class remains undetected by chance (Punobserved). Solid line corresponds to a case where HSAR = 5%; dotted line, HSAR = 10%. For example, a cluster exemplified by 20 compounds has a chance of nearly 40% to remain undetected when the structure-activity relationship (SAR) hit rate is 5%; if the same cluster can be enlarged to a total of about 50 compounds, the chance of going undetected drops to ~10%.
For targets giving rise to an HSAR hit rate of 5% or lower, the chance of not detecting activity in a sample of 29 compounds from an active cluster purely by chance amounts to 23% or higher. This should be taken into account when deciding on screen set size. Any decrease in set size will result in a decrease in return, so careful consideration of the optimal screen set size is required for targets that are known to yield very low hit rates as a result of a low HSAR. It is therefore advisable to determine the hit rates prior to a screen through a validation run—hit rates determined from a set comprising at least a few 1000s of compounds should be indicative of hit rates that will result for the larger sets.
Results and Discussion
Subsetting by Stratification
Typical corporate compound collections contain a million or more compounds. As a result of acquisition and synthetic exploration over the years, these tend to be distributed over compound clusters of widely varying size. To prevent oversampling of particular compound classes, we construct optimal subsets from a large master set by picking up to mstratum compounds per cluster. Thus, we ensure that the chances of observing activity in each cluster are equal in compound classes that are sufficiently populated. For clusters with less than mstratum compounds, we should include all available compounds to maximize the chance of observing activity.
The plate set lower and upper neighbor boundaries mstratum and mstratum + 1 for each layer were optimized iteratively upon construction of the sets, such that each layer i contained approximately 100,000 compounds. Each layer contains a part of the cluster members (e.g., the third layer set might contain neighbors 4, 5, and 6 only of every cluster that has more than three members). The upper and lower neighbor counts are chosen in such a way that the total count of these neighbor compounds in the layer is similar from layer to layer (i.e., approximately 100,000 in our example). Subsets for screening are collated by combining the plate set layers cumulatively, from first singleton layer S to plate set i containing up to mi members per cluster, and subset sizes will be multiples of 100,000. The master set is cherry-picked from the corporate collection and plated only once, a process that can take considerable time (months) for sets that are typically of a 106 size order. Once this is done, subsets can be copied quickly from the master set without the need to repick. In our case, this allows us to pick diverse subsets from a 1.2 million master set with a granularity of 100,000.
Subset Screen Simulations
Simulations were performed using the approach outlined in Figure 2 . False-positive hit rates were neglected (see above). The outcome of the simulation depends on both the hit rates typical for the target, as well as the makeup of the screen set in terms of diversity (i.e., clusters) and compounds per cluster. Hit rates were obtained from retrofitting the model onto existing screen data. From this, we derived that the cluster hit rate Hcluster can generally be approximated as 5 times the global hit rate, in our case (this will be a function of the makeup of the collection in terms of diversity). The SAR hit rate HSAR varies but is observed to be around 10% for nontargeted screens (SAR hit rates of up to 40% were observed for highly targeted in-house compound subset screens for kinase targets). A typical high-throughput screen can be simulated using HSAR = 10% and Hcluster = 5%, with clustering information derived from the corporate collection makeup.
Determining Hit Rates
An initial validation analysis was performed prior to global implementation of the stratified design at AstraZeneca; after implementation of the stratified screen set in 2009, a number of full-sized screens were run, and these were used for a more comprehensive secondary validation. For the initial validation, we retrospectively analyzed results obtained from large high-throughput screens, covering a variety of assay technologies and target types, and generated between 2001 and 2008. A set of ~700,000 compounds common to all of these historical screens was used.
Typically, global hit rates (defined as number of actives divided by total measured) were observed to be around 1%. Although universally used to characterize “success” of a screening run, global hit rates are virtually useless for this purpose as they do not capture the diversity of hits returned. This becomes important when we investigate the return of subset screens: for subset screens, the global hit rate is not expected to change, but diversity within the set of hits decreases with decreasing set size. We therefore use the diversity-corrected hit rate Hcluster or the detected number of active clusters as a measure of success. Active clusters are defined as clusters containing at least one active compound. Hcluster is defined as number of active clusters divided by the total number of clusters.
Retrospective analysis shows that the diversity-corrected hit rate Hcluster is, in our case, typically around 5%, or about 5 times the global hit rate. The in-cluster hit rate HSAR depends on the nature of the clustering routine and clustering distance used. We applied a Daylight-like fingerprint-distance–based sphere-exclusion clustering approach 8 with a cutoff distance of 0.3, which groups chemically similar compounds together well. The observed SAR hit rate tends to range from 5% to 10% in our cases.
Validation of the Stratification Principle (prior to implementation)
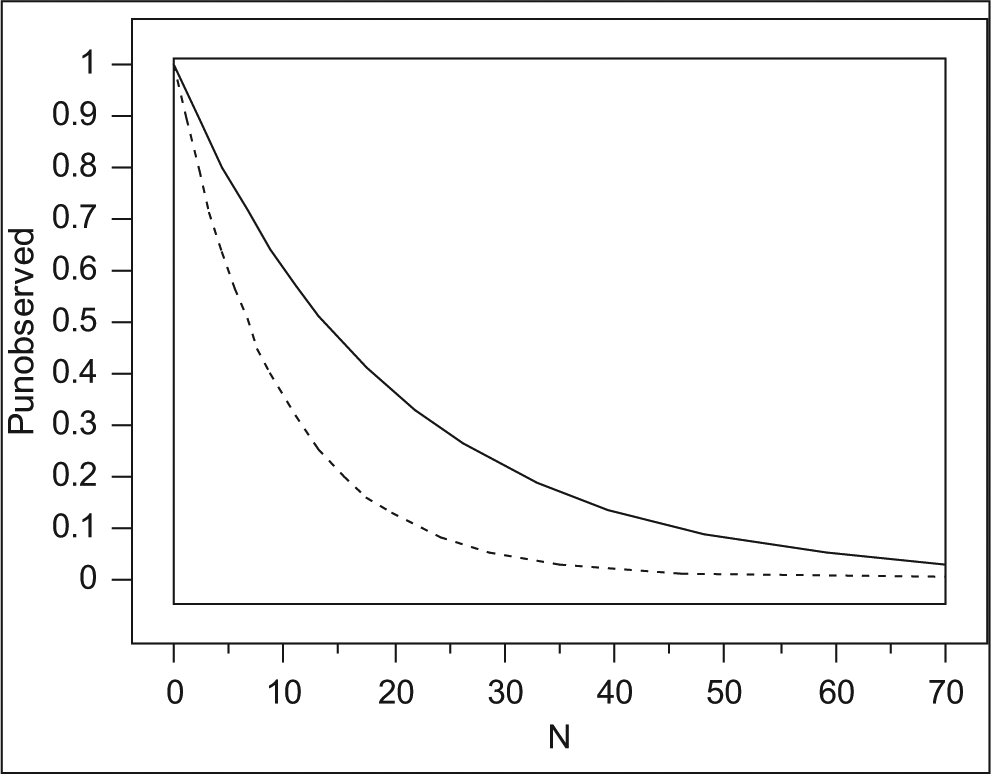
Results from a simulation using the in silico model described in Figure 2 are shown in Figure 5a (using HSAR = 10% and Hcluster = 5%; clustering information for the full set was derived from the actual corporate collection makeup). Retrieval rates are given as number of active clusters (i.e., clusters in which at least one active compound has been detected). Results from the model ( Fig. 5a , black curve at top) and those retrospectively collated for stratified screens ( Fig. 5c ) show a similar trend, and retrieval results are better than those seen for random subsets of equal size ( Fig. 5b ). We note that the curve shape of the screens in Figure 5c is less pronounced than that observed in the simulated run. The reason for this is likely to be due to a contribution of false positives (random actives), the effect of which was excluded in the simulation.
Returns (as numbers of active clusters identified) for subset screens as a function of screen size. (
The ratio of the numbers of active clusters retrieved in the stratified sets and the randomly picked ones is shown in Figure 5d . Ratios larger than unity indicate that a stratified set yields more than its equal-sized random equivalent. Although in absolute numbers, the number of retrieved active clusters decreases for sets of decreasing size ( Fig. 5b , c ), the ratio of the returns seen for stratified and random sets is generally greater than 1 ( Fig. 5d ). This means that stratified subsets generally outperform random subsets in terms of identification of active clusters. Ratios of returns ( Fig. 5d ) suggest that these returns can be better by up to 20% (i.e., ratios of ~1.2), indicating that the stratified design is more efficient than the corresponding random set pick.
Validation of the Stratification Principle (using newly generated results)
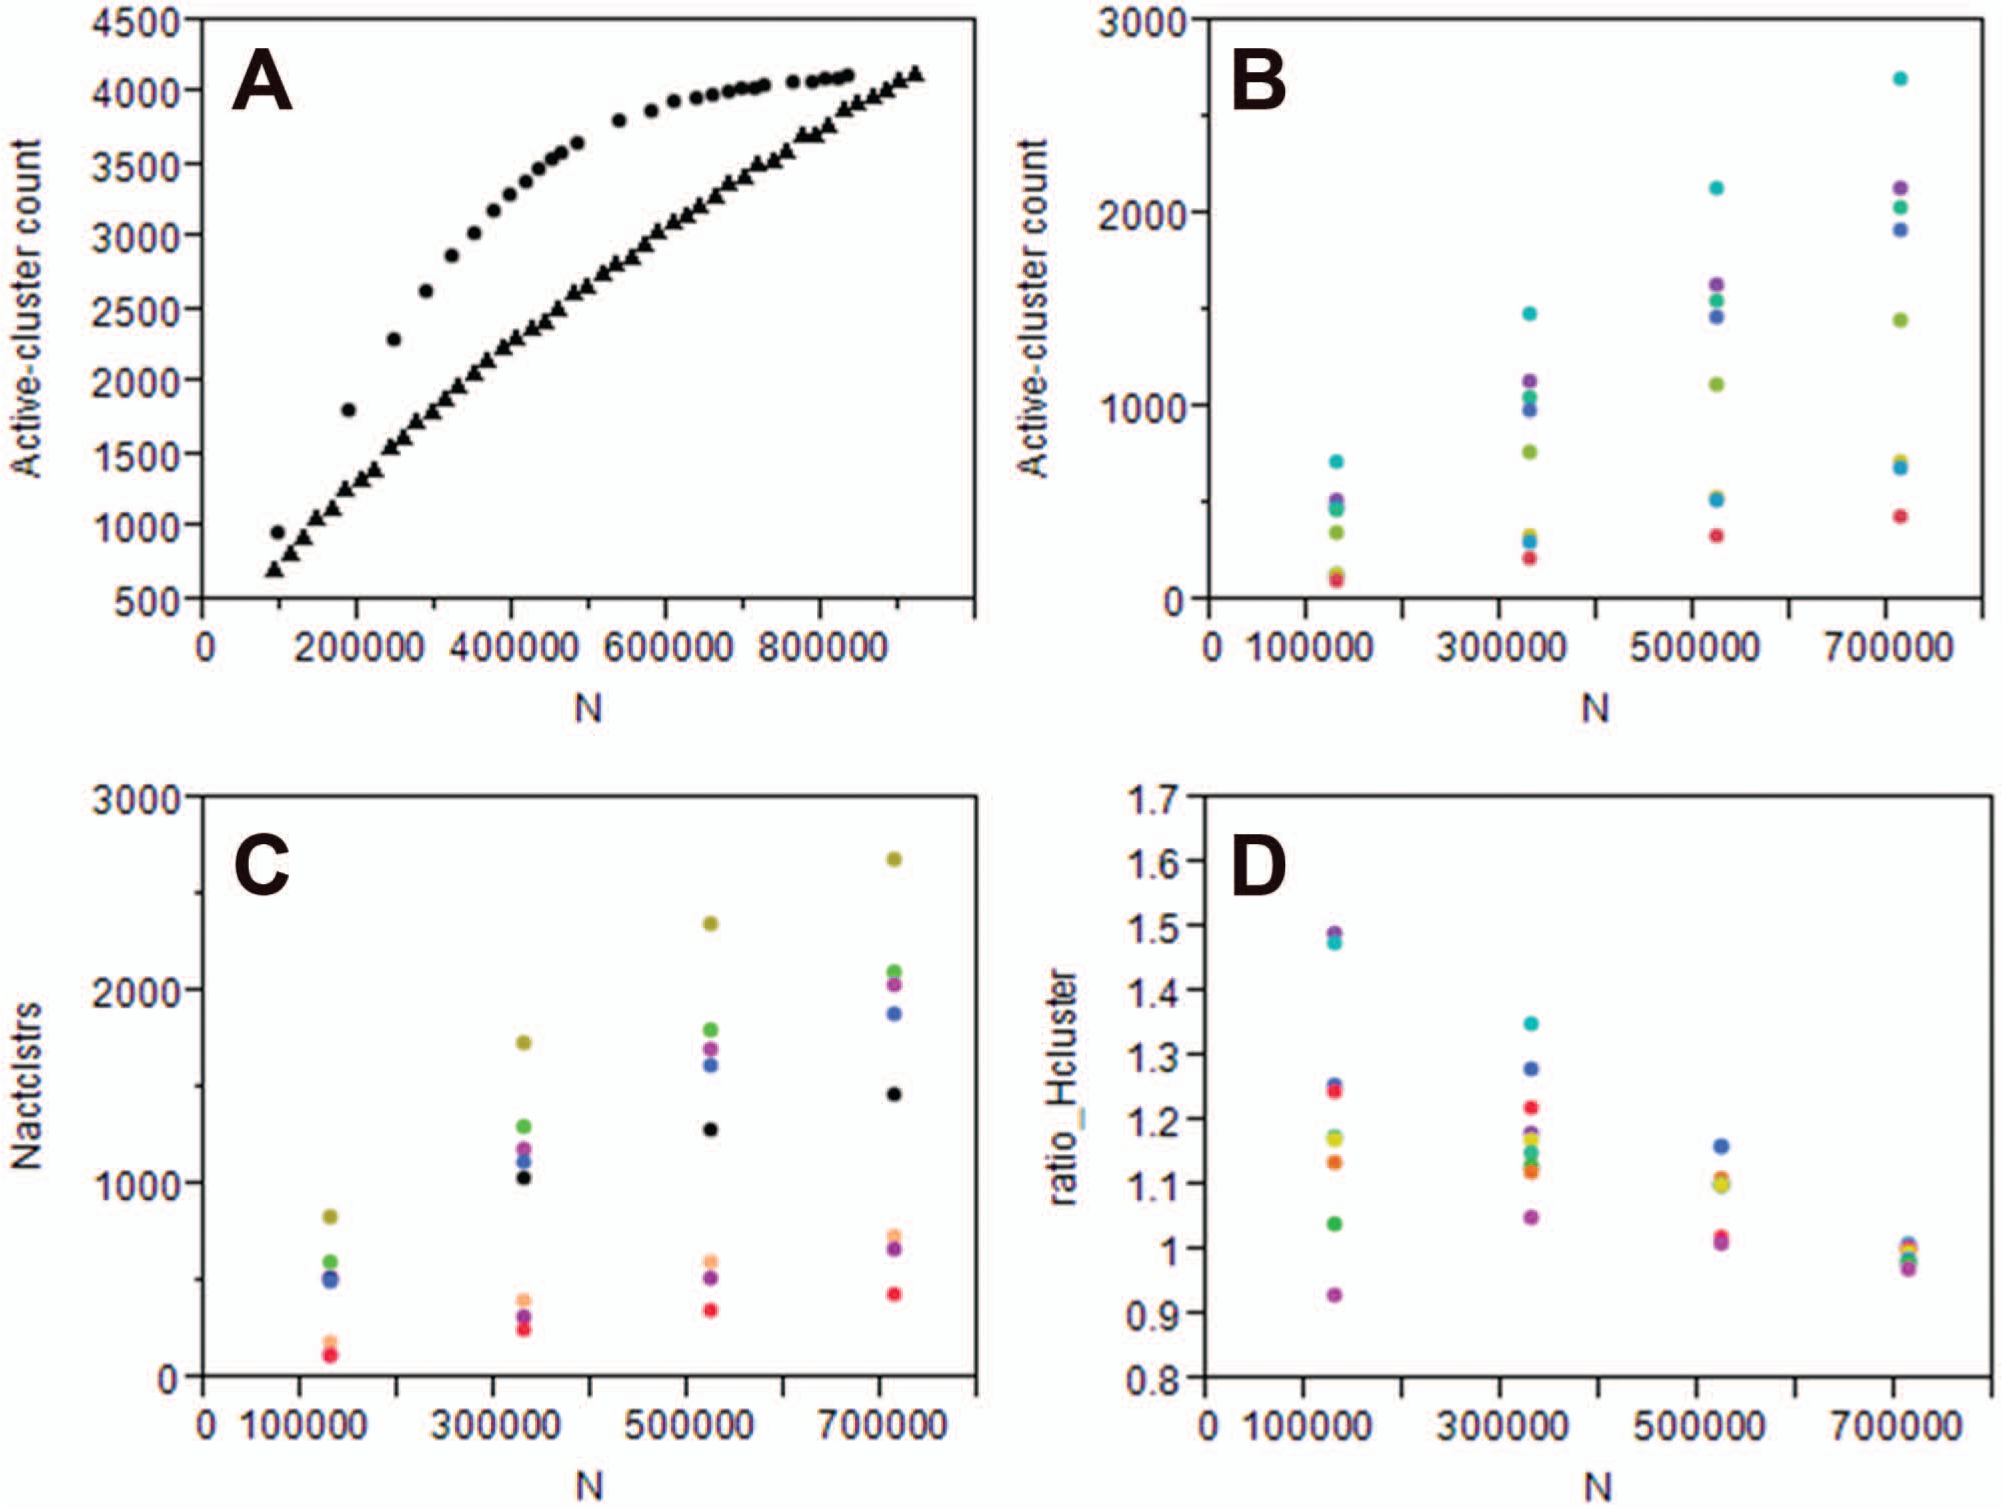
The stratification principle was implemented globally at AstraZeneca in 2009. A number of screens have been run at full size (but from the stratified plate set), and this enables us to validate the effects of stratification on hit retrieval in further detail. For this purpose, we looked at a compound collection comprising 11 stratified layers (covering a set of more than 1 million compounds) and assessed retrieval rates for putative stratified and same-sized random subsets using the full-set experimental HTS. Results for six screens are shown in Figure 6a and show conclusively that in these cases, running a random subset screening approach would have yielded less structurally diverse hits than a stratified set of the same size.
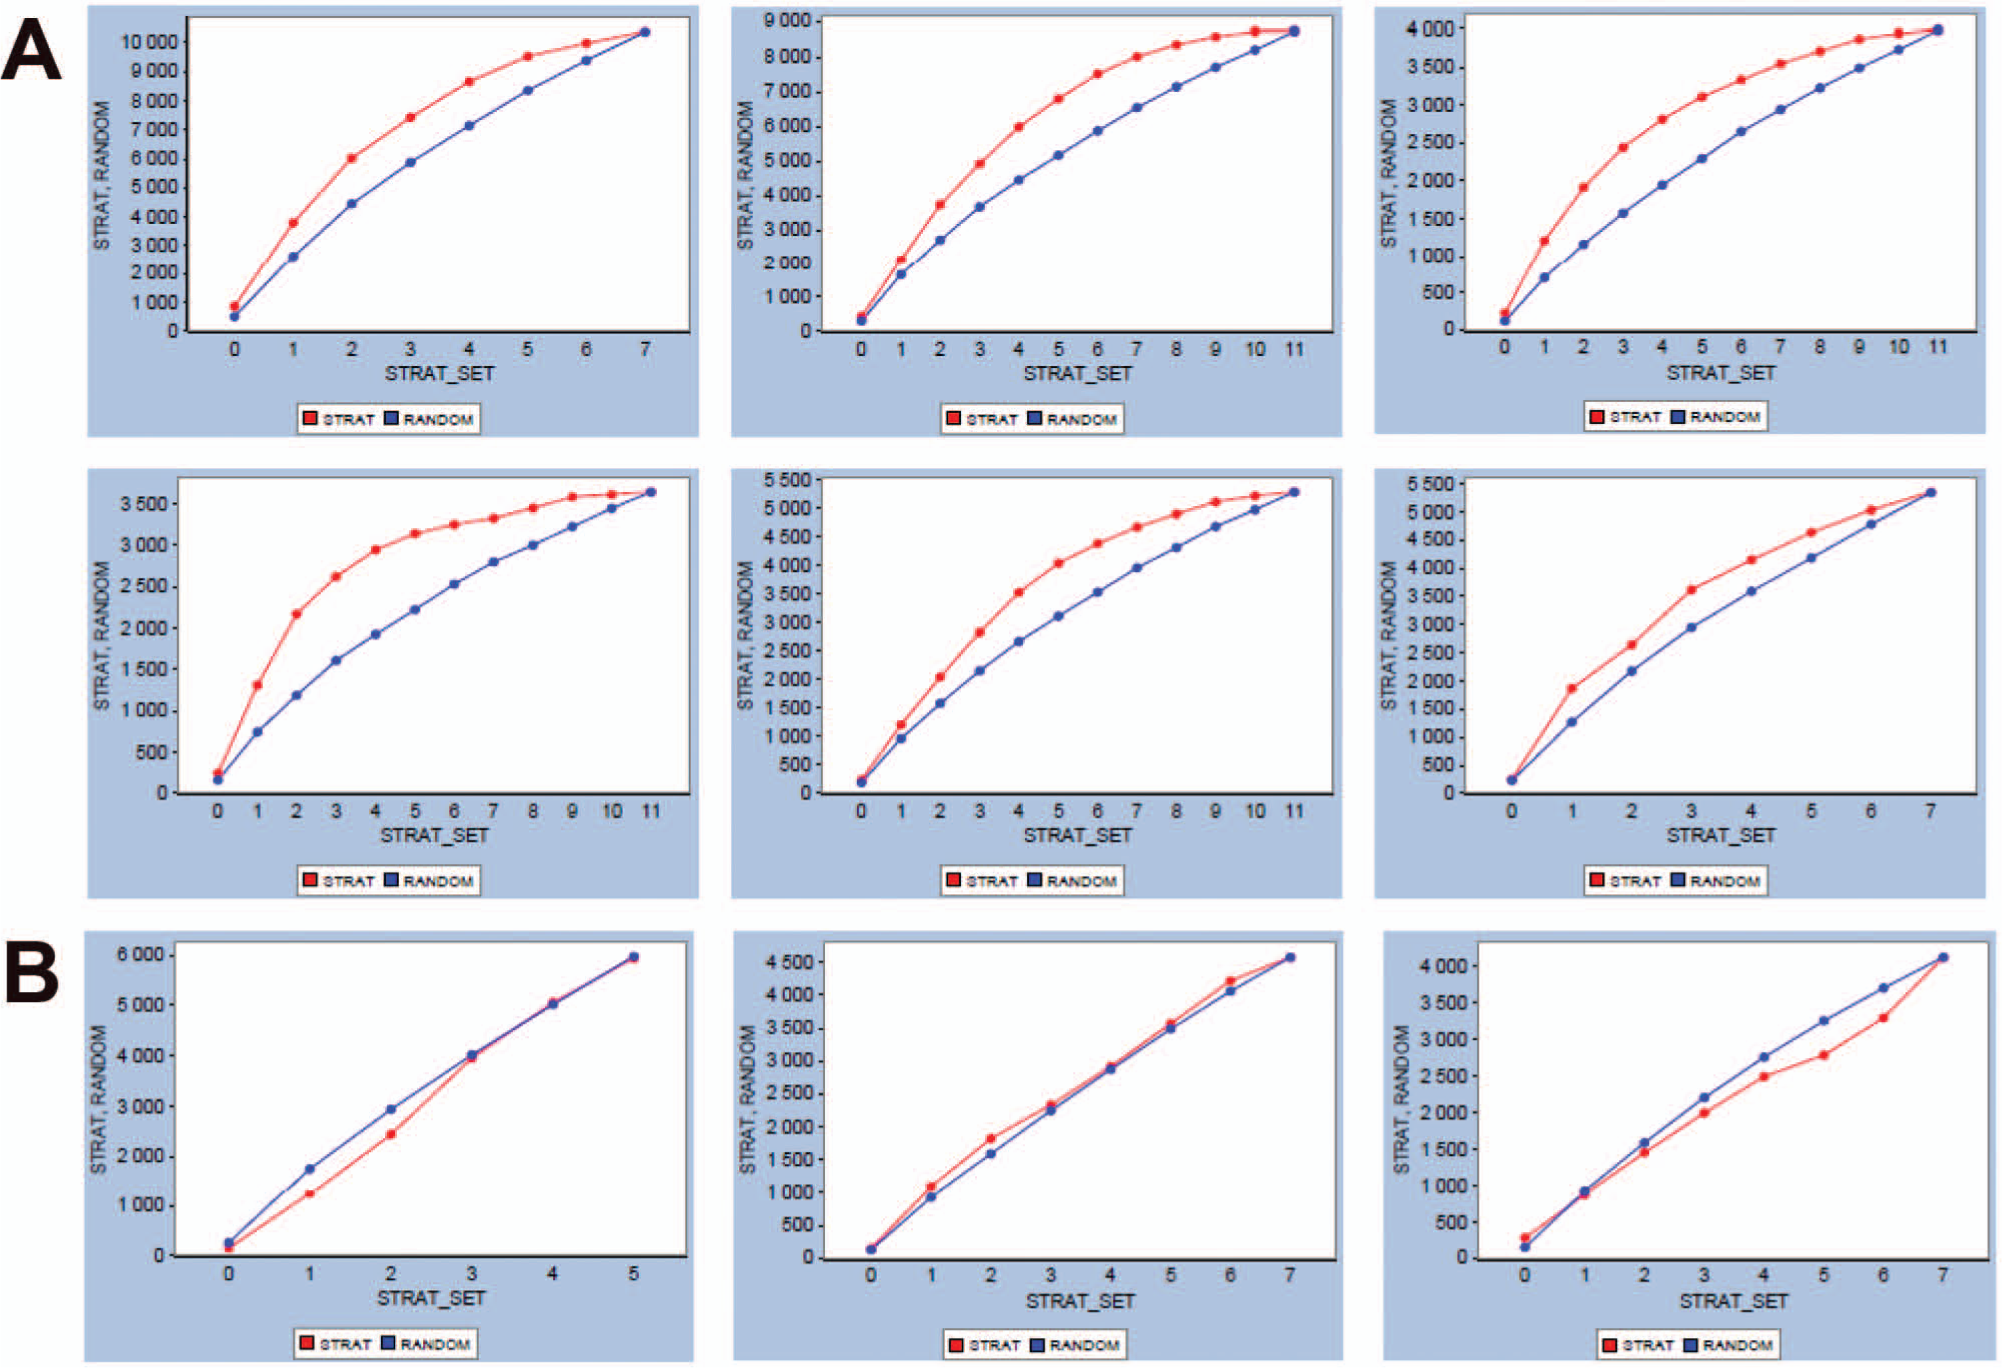
Retrospective analyses of performance of stratified screens (red curve) versus that of a same-sized randomly picked screen set (blue curve). The plots show the number of hit clusters retrieved against cumulative screening of stratified sets. (
In approximately a third of our validation cases, stratified sets offered no advantage over screening a random subset. Three examples are shown in Figure 6b . Results such as these were identified across target classes and assay technologies. The lack of differentiation between the validation curves for random and stratified sets suggests that the readouts generated by these primary assays do not reflect structural SAR, the existence of which is one of the underlying assumptions for constructing stratified sets. One reason for this could be that the true hit rate of compounds acting on the target as required is much smaller than the observed hit rate—that is, the primary assay may highlight many spurious hits that arise, for example, from a sensitivity to physicochemical properties. Upon inspection, however, the misbehaving HTS screens did not show aberrant confirmation hit rates in subsequent dose-response follow-up rounds, suggesting that the majority of the hits behaved in a dose-dependent fashion. The ability to reproduce these hits confirmed that the apparent randomization of readout had not been due to plating errors, as the hits were replated in a different format for the dose-response rounds. The assays did not stand out in terms of noise level (as observed in the distributions of %inhibition readout). Closer inspection of dose-response curve shapes did not reveal higher than usual proportions of steep-curve fits (i.e., curve fits with high Hill slopes), which can be indicative of artifactual responses. Last, using historical data for compounds measured in many HTS screens, we identified likely anomalous binders and used these to gauge whether the incidence of such artifactual hits was higher in the unsuccessful screens than in other screens, but no clear relation could be found in that respect either. We note that the observed effect does not preclude success of the HTS screen—in some of these cases, true positives had resulted in structural series that were taken forward to lead initialization.
A conclusive explanation for the discrepancies observed here remains to be identified, but we hypothesize that the effect could be due to a low true hit rate resulting from limited coverage of the required chemical diversity in the corporate collection. In such cases, true hits may comprise small clusters of similars and singleton compounds, on which the stratification will have little impact. With increasing screen set size, the number of false positives retrieved increases, but, being largely a random process, this will be regardless of the screen set being compiled by stratification or randomly. In addition, the difference between stratified and random returns is seen in cell-based screens (albeit not exclusively), where cell permeability will affect the observation of hits, and numbers of true positives in larger clusters can be diminished as a result.
In summary, we present a rational approach to subsetting of large sets and physical subset plating. The collection stratification approach we describe constitutes a cumulative ordering of plated compounds onto plate sets. Users have a choice of screening all or part of the full collection while retaining a structurally diverse coverage of the full set, but without the need for replating substantial sets of compounds. This way, we enable flexible, diverse subset screening at various sizes using a single, full-size master plate set, tailored as needed to screening capacity or budget.
Our approach has facilitated consolidation of screen sets globally and was used to drive down cost in HTS while minimizing chance of failure. Although overall HTS cost will not decrease proportionally with set size reductions due to fixed upfront assay development cost, investment in equipment, and follow-up overheads, savings of HTS execution costs are substantial when 100,000s of wells less can be routinely screened across tens of HTS campaigns (well costs are estimated to be in the $0.02–$0.06 range 7 ). Cumulative subsets constructed from the stratified corporate collection cover the same structural diversity as the full set in terms of compound classes at a decreased, yet optimal, sampling density. Retrospective analysis shows that in the majority of cases, the stratified design yields an improved retrieval rate of hits over same-sized randomly picked subsets; at worst, their results are similar to randomly picked sets.
We emphasize that any decrease in set size for a diverse screen will result in a decrease of hits in absolute terms. For relatively large subsets of a corporate collection, however, this decrease may well be acceptable when offset against the more economical handling and screening of smaller sets. In our case, a stratified subset that is smaller in size by ~30% than the full collection is expected to deliver about 80% to 90% of the original return in terms of active compound classes, at a substantial saving of cost. One should keep in mind, though, that for very small diverse subsets, the return will be significantly lower than that of a full set. This occurs because in such cases, the sampling of compound classes drops to very low levels, which has an adverse effect on the chance of detecting any actives (see Fig. 4 ).
Footnotes
Acknowledgements
The authors thank the following people who provided input and contributed to the design and execution of the stratified collection: Dan Russell, Arthur Patten, David Murray, Magnus Kjellberg, Nick Tomkinson, Carolyn Blackett, Lilian Alcaraz, Isabel Charles, Shephali Trivedi, Christine Rigby, Tim Perkins, Linda Nilsson, Dylan Griffith, Gareth Wilden, Stephen Walker, Robert Shaw, and Ruifeng Liu, as well as Andrew Williams for proofreading and suggestions. We value the input provided by the anonymous referees.
Declaration of Conflicting Interests
The authors declared no potential conflicts of interest with respect to the research, authorship, and/or publication of this article.
Funding
The authors received no financial support for the research, authorship, and/or publication of this article.
References
Supplementary Material
Please find the following supplemental material available below.
For Open Access articles published under a Creative Commons License, all supplemental material carries the same license as the article it is associated with.
For non-Open Access articles published, all supplemental material carries a non-exclusive license, and permission requests for re-use of supplemental material or any part of supplemental material shall be sent directly to the copyright owner as specified in the copyright notice associated with the article.