
Abstract
High-throughput screening (HTS) has been widely used to identify active compounds (hits) that bind to biological targets. Because of cost concerns, the comprehensive screening of millions of compounds is typically conducted without replication. Real hits that fail to exhibit measurable activity in the primary screen due to random experimental errors will be lost as false-negatives. Conceivably, the projected false-negative rate is a parameter that reflects screening quality. Furthermore, it can be used to guide the selection of optimal numbers of compounds for hit confirmation. Therefore, a method that predicts false-negative rates from the primary screening data is extremely valuable. In this article, we describe the implementation of a pilot screen on a representative fraction (1%) of the screening library in order to obtain information about assay variability as well as a preliminary hit activity distribution profile. Using this training data set, we then developed an algorithm based on Bayesian logic and Monte Carlo simulation to estimate the number of true active compounds and potential missed hits from the full library screen. We have applied this strategy to five screening projects. The results demonstrate that this method produces useful predictions on the numbers of false negatives.
Keywords
Introduction
High-throughput screening (HTS) has played a dominant role in drug discovery for identifying chemically tractable compounds that modulate the biological activity of interesting targets. Typically, it involves screening millions of compounds. 1 The first step in this process is a single-point primary screen in which the whole compound inventory is exhaustively tested once without replication. Subsequently, the primary hit candidates are retested multiple times in a confirmation screen so that the true hits can be identified. During this process, the number of compounds failing confirmation is referred to as the false-positive rate. On the other hand, truly active hits that fail to make the hit candidate list due to assay noise are called false negatives and are mistakenly identified as nonhits. The number of false negatives is a critical benchmark that measures the success of HTS campaigns in that the missed hits cannot be experimentally rescued.
Currently, there are technical and logistical bottlenecks limiting the efficiency of the hit discovery process in HTS campaigns. For example, the quality of a large-scale primary screen is heavily influenced by stochastic variations from multiple sources, including day-to-day, plate-to-plate batch effects; positional row/column effects; and mechanical robotics issues. 2 Without sufficient technical replications, assays in primary screens suffer from low sensitivity and specificity. To maximize the hit discovery rate, it is desirable that more candidate hits from the initial primary screen be retested in the more accurate confirmatory screen. This solution is not always practical because the confirmatory screen is costly and time-consuming. To make a risk-based decision, drug screeners need to be aware of how many active compounds would potentially be missed when they select the number of potential hits to be retested for confirmation assays.
There has been increasing interest in using various numerical approaches to rescue missing hits. For example, false negatives can be predicted by structure-activity relationship analysis or machine-learning algorithms based on the structure of confirmed compounds and validated by follow-up experiments.3,4 However, structure-based methods are more likely to rescue additional active compounds with chemical scaffolds similar to those of known hits and therefore not significantly increasing the structural diversity of the hit pool. There are also structure-independent approaches including a variety of data normalization and preprocessing algorithms such as Z score, B score, and in-plate control methods that aim to control systemic bias.5,6 Our in-house HTS data analysis protocol measures compound activity using normalized percentage inhibition (NPI) based on in-plate positive and negative control wells according to the formula
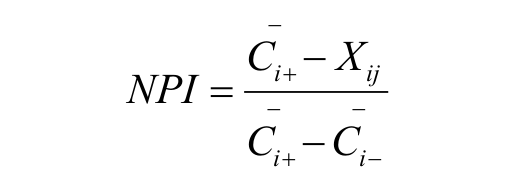
where Xij is the signal intensity of the jth molecule from the ith test plate and
Although there are literature reports on assay quality control and HTS data-processing methods, we are not aware of any statistically rigorous approach that estimates false-negative hit rates from the primary screening data. The lack of replicates in the primary screening process makes it difficult to make valid statistical inference. To improve screening quality and statistical power, we designed and implemented small-scale pilot screens prior to each full library screen.
This pilot library, consisting of approximately 10,000 compounds (~1% of the full library), was screened in triplicate under experimental conditions similar to those set for the primary screen. The purpose of the pilot screen is to gather information on relevant technical parameters that could be used to guide the larger and more expensive primary screen. In this article, we show that the posterior probability distribution of hit rates can be modeled by the primary screening data and the information extracted from the pilot screen in a Bayesian framework. Based on the proposed hit distribution and the projected assay variability estimated from the pilot screen, we designed a Monte Carlo simulation scheme to estimate the false-negative rate in a primary screen. This approach, summarized in a flow chart ( Fig. 1 ), provides screening scientists with a quantitative tool to make a risk-based decision on selecting candidate hits for follow-up confirmation assays.
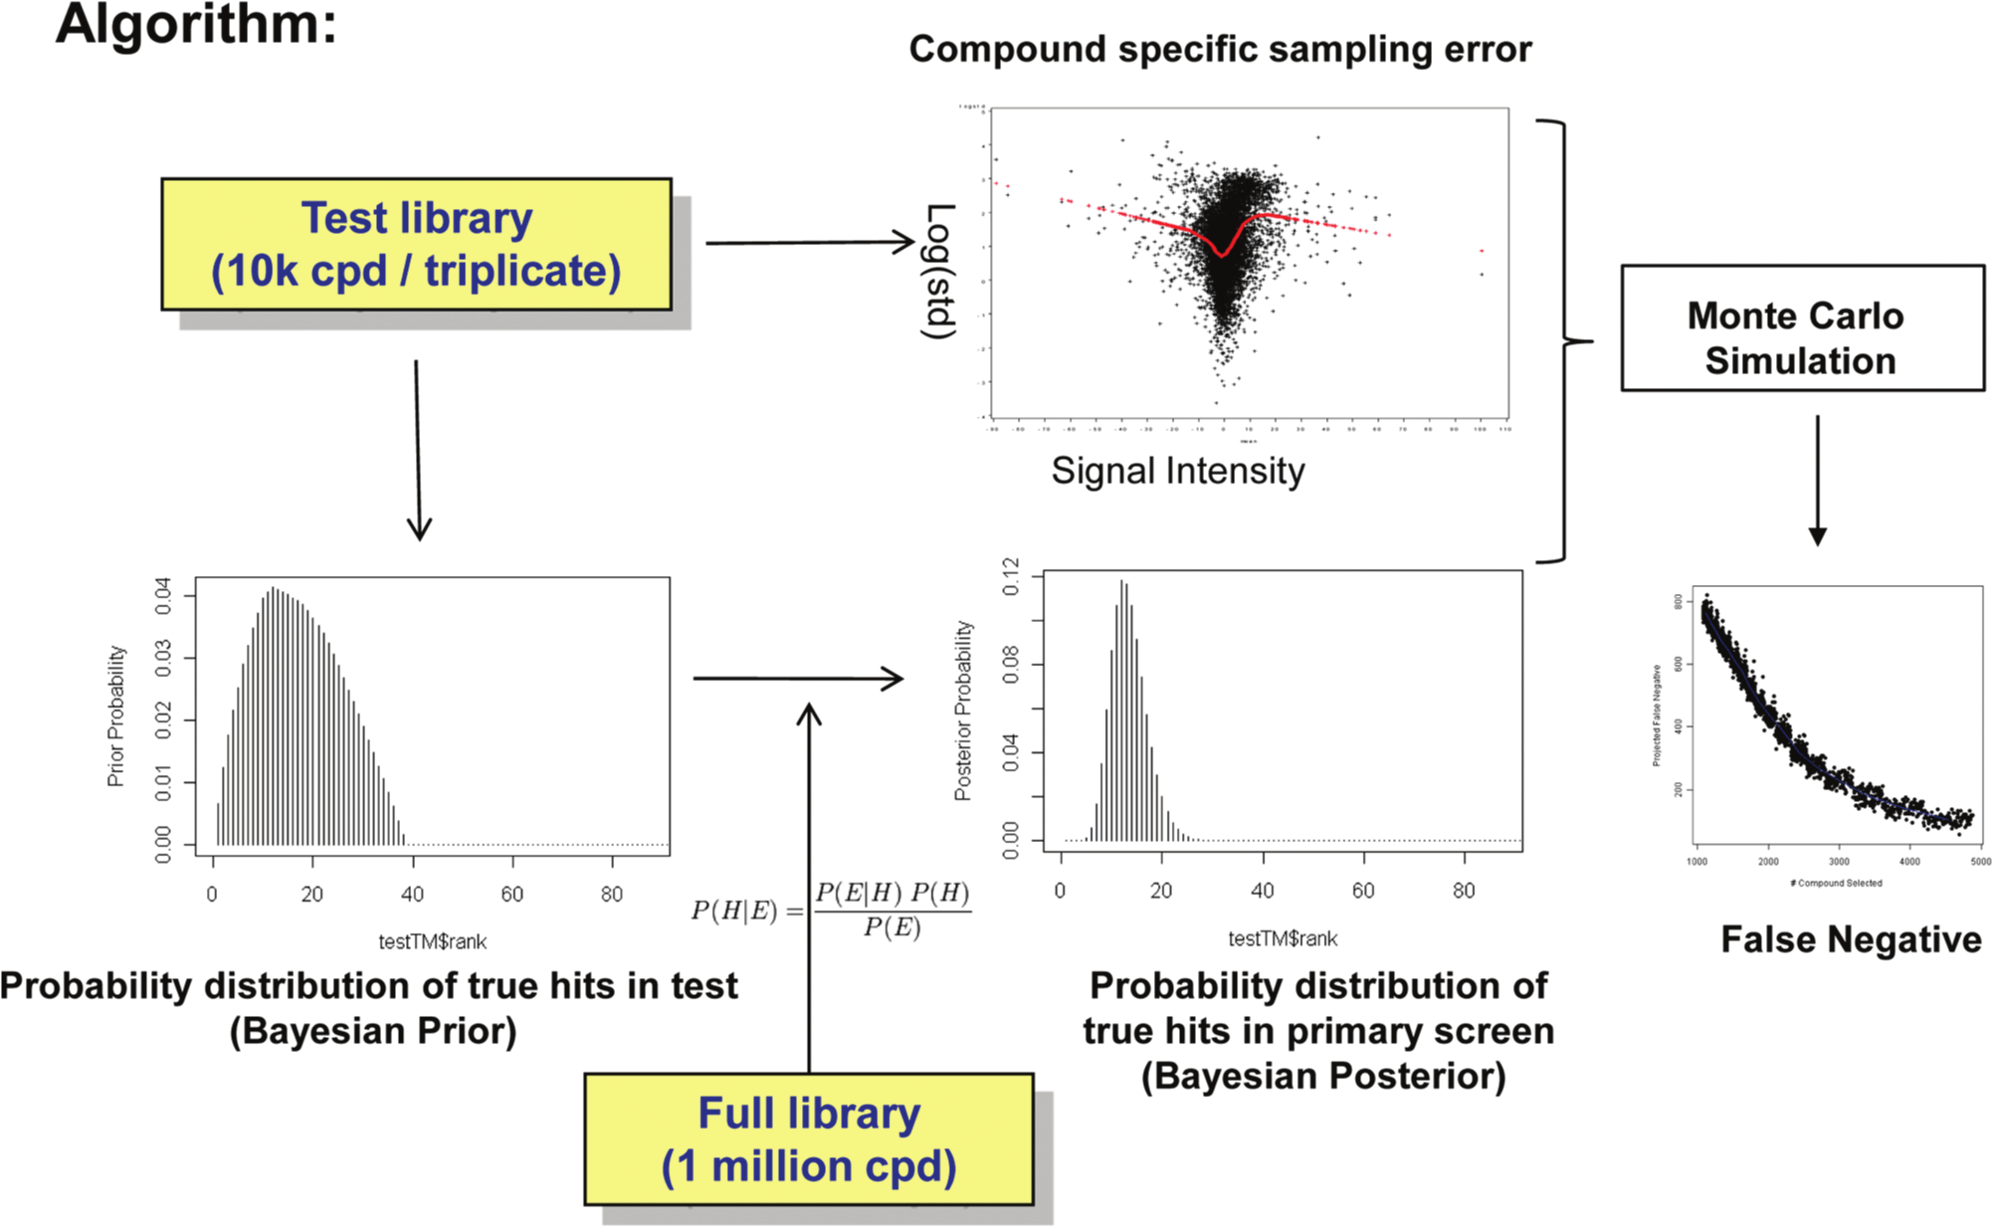
Flow chart for the Bayesian/Monte Carlo simulation method for the estimation of false-negative rates in the high-throughput screening campaign.
Materials and Methods
HTS
See supplemental materials.
Data Sets
We applied the pilot screen strategy to five Roche in-house HTS campaigns. The data sets, including the results of pilot/primary screens and follow-up confirmation, were retrieved from a Roche HTS data pipeline and used to infer the projected hit distribution and test the performance of the false-negative prediction algorithm. The key parameters of these five screens, including quality measurement Z′ factor, 8 the number of compounds in the libraries, and the observed hit count based on predefined activity cutoffs, are listed in Table 1 .
Technical parameters of five high-throughput screen (HTS) campaigns.
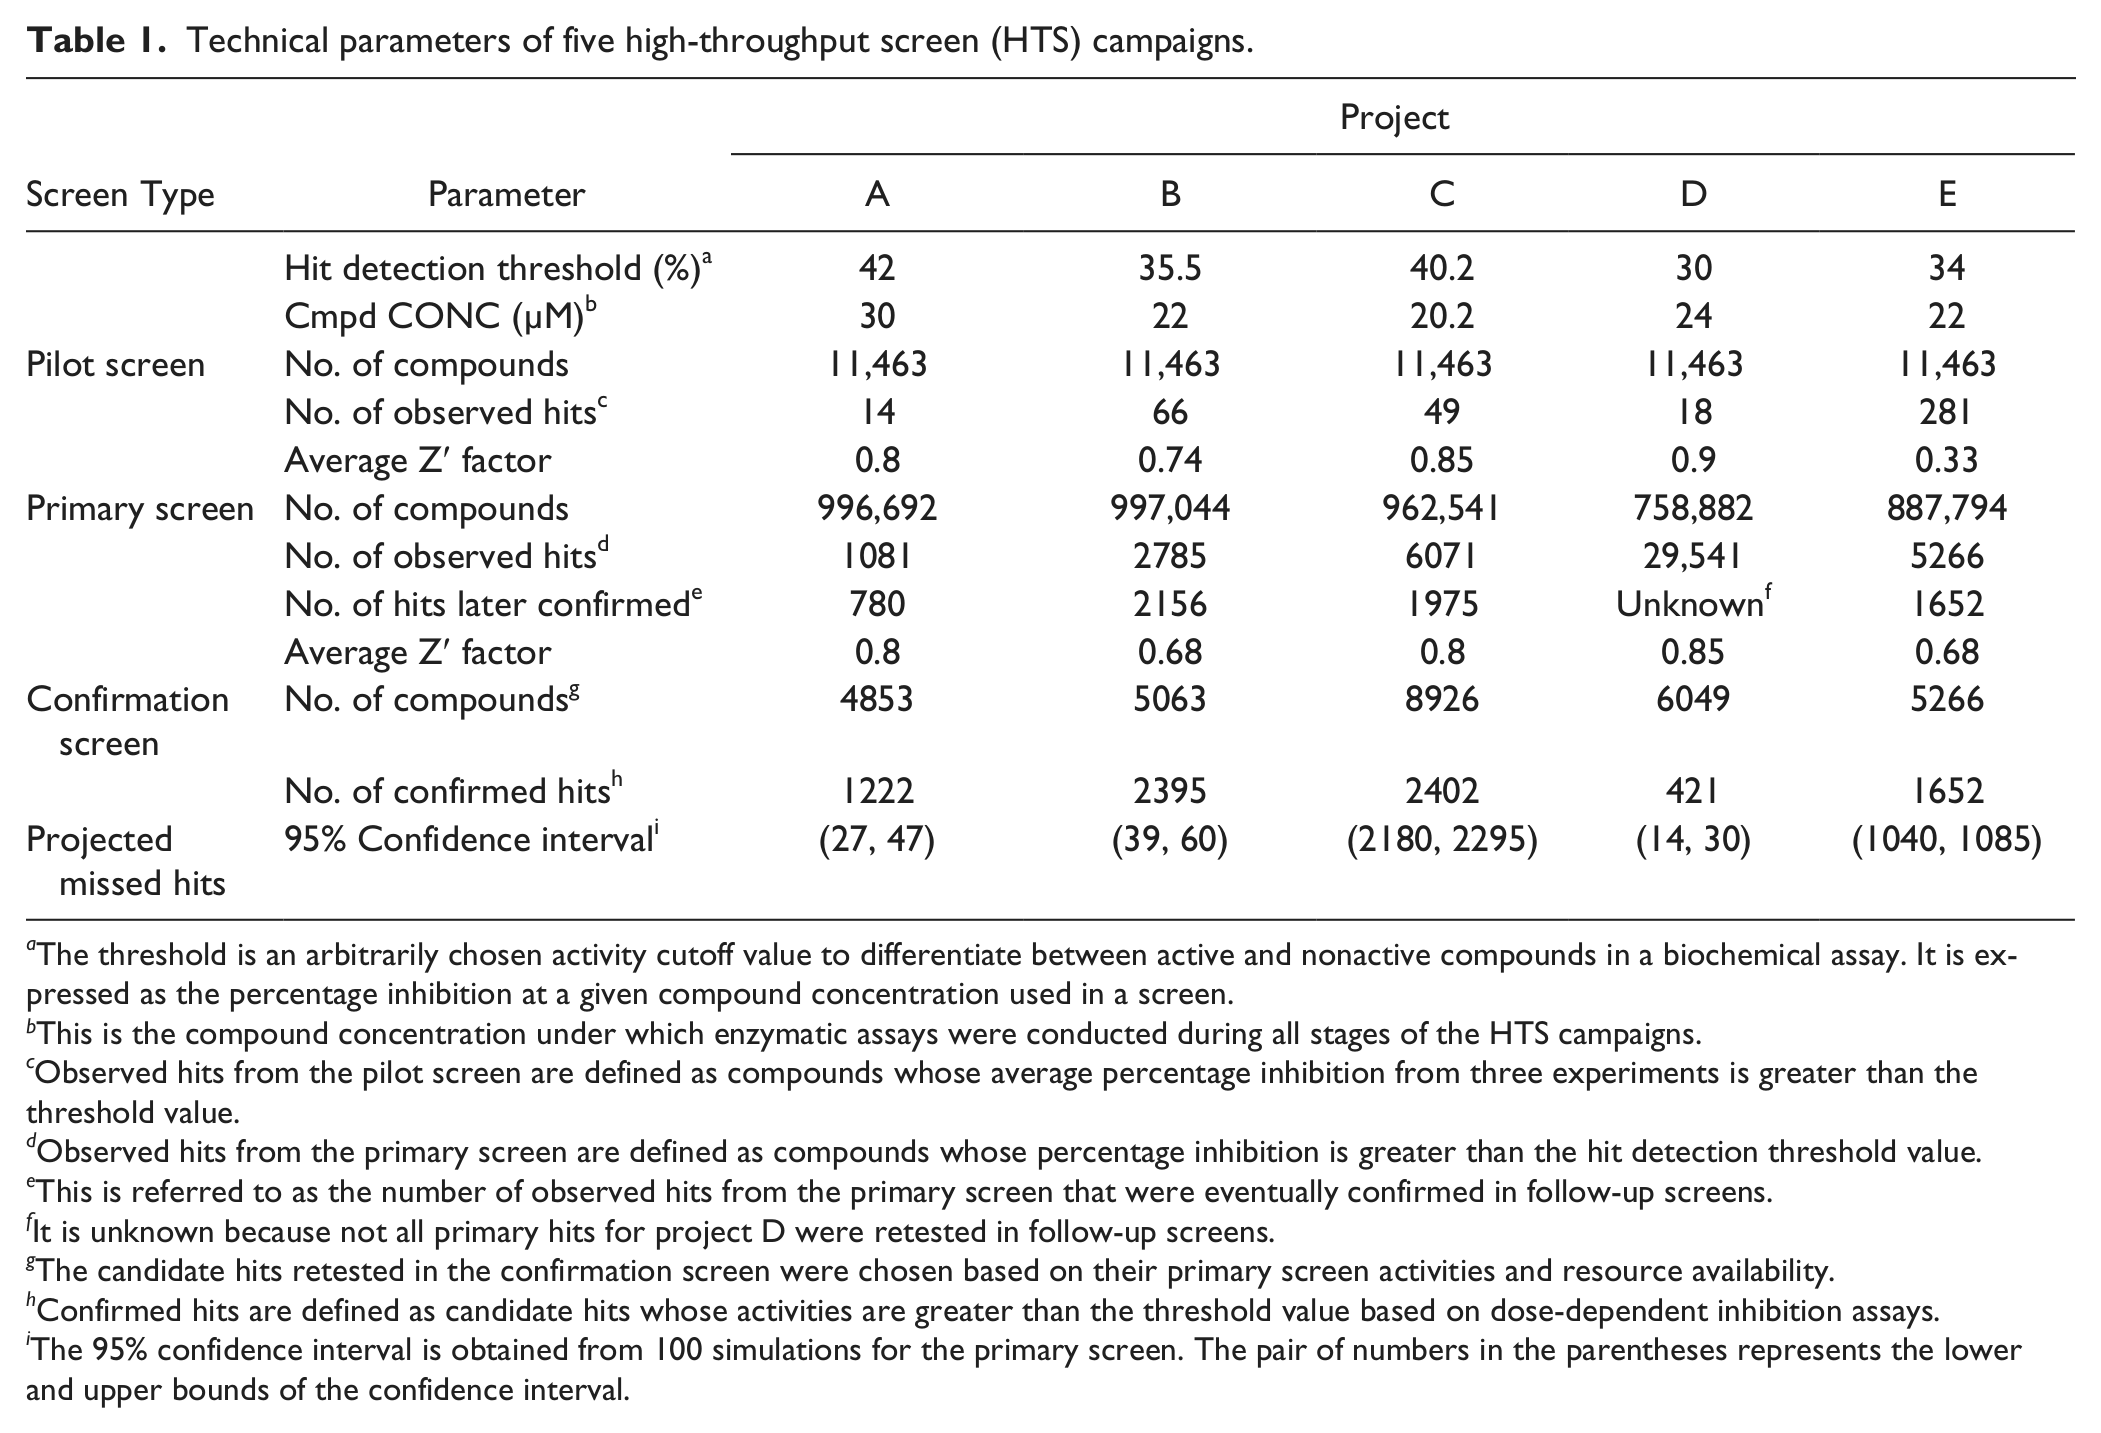
The threshold is an arbitrarily chosen activity cutoff value to differentiate between active and nonactive compounds in a biochemical assay. It is expressed as the percentage inhibition at a given compound concentration used in a screen.
This is the compound concentration under which enzymatic assays were conducted during all stages of the HTS campaigns.
Observed hits from the pilot screen are defined as compounds whose average percentage inhibition from three experiments is greater than the threshold value.
Observed hits from the primary screen are defined as compounds whose percentage inhibition is greater than the hit detection threshold value.
This is referred to as the number of observed hits from the primary screen that were eventually confirmed in follow-up screens.
It is unknown because not all primary hits for project D were retested in follow-up screens.
The candidate hits retested in the confirmation screen were chosen based on their primary screen activities and resource availability.
Confirmed hits are defined as candidate hits whose activities are greater than the threshold value based on dose-dependent inhibition assays.
The 95% confidence interval is obtained from 100 simulations for the primary screen. The pair of numbers in the parentheses represents the lower and upper bounds of the confidence interval.
Results
Methodology Overview
Unlike the traditional frequentist approach, a Bayesian inference considers the parameter of a statistical model to be a random variable instead of a constant to be estimated. From a Bayesian’s perspective, the probability distribution of an unknown parameter reflects the degree of one’s subjective belief, which can be constantly updated with new information. 9 These features make a Bayesian approach an attractive alternative for estimating the true hit rate in an HTS. Because of the enormity of the chemical universe, the determination of the true number of active compounds that may bind to any particular disease target with meaningful affinity is beyond the reach of any screening technology. Therefore, we can only estimate this based on a subjective perception that is guided by prior knowledge and can be updated with newly generated data. As shown in Figure 1 , we first derived the prior probability distribution for the hit rate by taking advantage of the available replication data from the pilot screen. Then, new information about the hit rate obtained from the primary screen was used to update the prior distribution, according to Bayes’ theorem, to arrive at a posterior distribution from which the expected true hit rate can be estimated. Furthermore, we simulated the true activities and assay variability for all the compounds in the primary screen by repeatedly bootstrapping the mean activities and standard deviations computed from the pilot library data. Finally, a second simulation was performed to sample the observed test values from the normal distribution pertaining to each hypothetical compound based on its mean and standard deviation. Because the true and observed hits can be determined by the expected hit rate from the posterior/prior distribution and the activity threshold, respectively, it was straightforward to count the false negatives beyond any given number of top-ranked compounds considered as potential positives for confirmation testing.
Use of the Gamma-Poisson Family to Derive the Posterior Probability Distribution of Hit Rate
Assume the number of test compounds in a primary screen is n and we detect y hits, whose experimentally observed activities are above a fixed threshold value. Suppose that y follows a Poisson distribution with mean
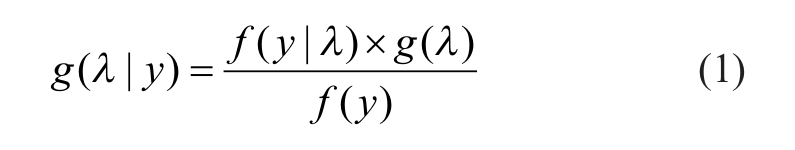
where g(λ) is the prior distribution of the parameter based on empirical evidence or subjective belief. The posterior distribution of λ, g(λ|y), which represents one’s updated belief on the unknown parameter, is derived from prior distribution that is renewed by the observed data y, expressed in the format of likelihood function f(y | λ). We first derived the prior/posterior distributions for real hit counts in a primary screen based on the Gamma/Poisson conjugate probability density function. However, the results (
Using the Pilot Screen Data to Build an Empirical Prior Distribution for the Primary Screen Data
Because the Bayesian model using the Gamma/Poisson conjugate did not provide a good fit for the majority of the data sets, we turned to the pilot data again to derive discrete empirical probability densities that rely solely on experimental data without arbitrary assignment of a closed-form prior. This information can be obtained from a pilot screen by application of the logic and analytical sequence described below:
Briefly, a one-sample t test is performed to compare the triplicate activities for each compound i from the pilot screen with the preselected threshold value µ as follows:
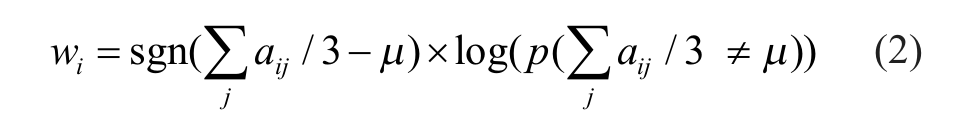
Simply put, this weight score is determined by the p value of a one-sample t test that compares the average of three activity readings with the fixed threshold value. Our goal is to construct a probability density function for the possible number of hits. Conceptually, the probability for the presence of total n real active compounds in the pilot library of N compounds, p(n = n), is proportional to the cumulative sum of confidence weight wi of the top n most likely active candidates from the pilot screen:
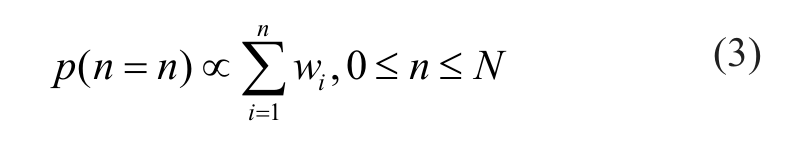
To make p(n = n) a legitimate probability density function, we simply need the integral of the function over its support to be 1, which is expressed as p(n = 0) = 0 and
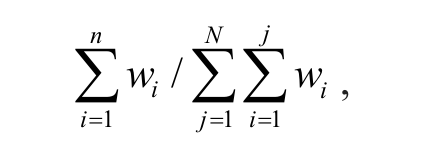
which is the ratio of the cumulative sum of confidence weight wi of the top n active compounds to the sum of weight score for all the compounds. However, the denominator in this ratio is actually negative as the confidence weights for most compounds are negative, being that the sign is determined by the difference of mean percentage inhibition and activity cutoff. To make p(n = 0) = 0 a valid probability density for the prior distribution, we let
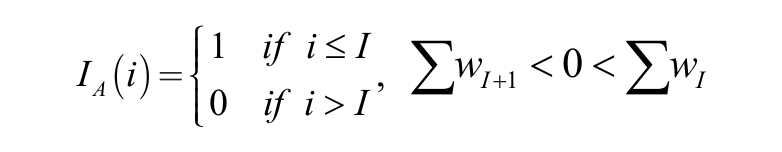
Here, i in the indicator function and IA(i) is the index for a sequence of test library compounds that are sorted by their confidence weights wi in descending order. I is the index number for the compound from which the cumulative sum of weight wi of sequence turns from positive to negative. The purpose of this indicator function is to force the majority of negative weight/probabilities to zero as one’s belief as to a certain event can be as low as zero but should never be negative. The resultant probability distributions for the five data sets, expressed as
are displayed in
Figure 2
(left panel). The red reference lines that mark the observed hit rates in the primary screens do not fall into the extreme tail of distribution for four of the five studies, suggesting that the empirical distribution derived from pilot screen data is a reasonable fit for the observed hit rate of the primary screen in most of the cases. The only exception is with project D, for which the number of observed hits in the primary screen lie well outside the prior distribution. This extreme anomaly indicates a possible quality problem with the primary screen. We offer possible explanations in more detail in the Discussion section. If we treat the empirical density (equation 4) as prior distribution, we can construct the posterior distribution according to the Bayes rule by multiplying the prior with the likelihood function for the number of observed hits in the primary screen, either in binomial or Poisson form as follows:
where i is the number of hits, N is the total number of compounds, and λ is the expected percentage of real hits.
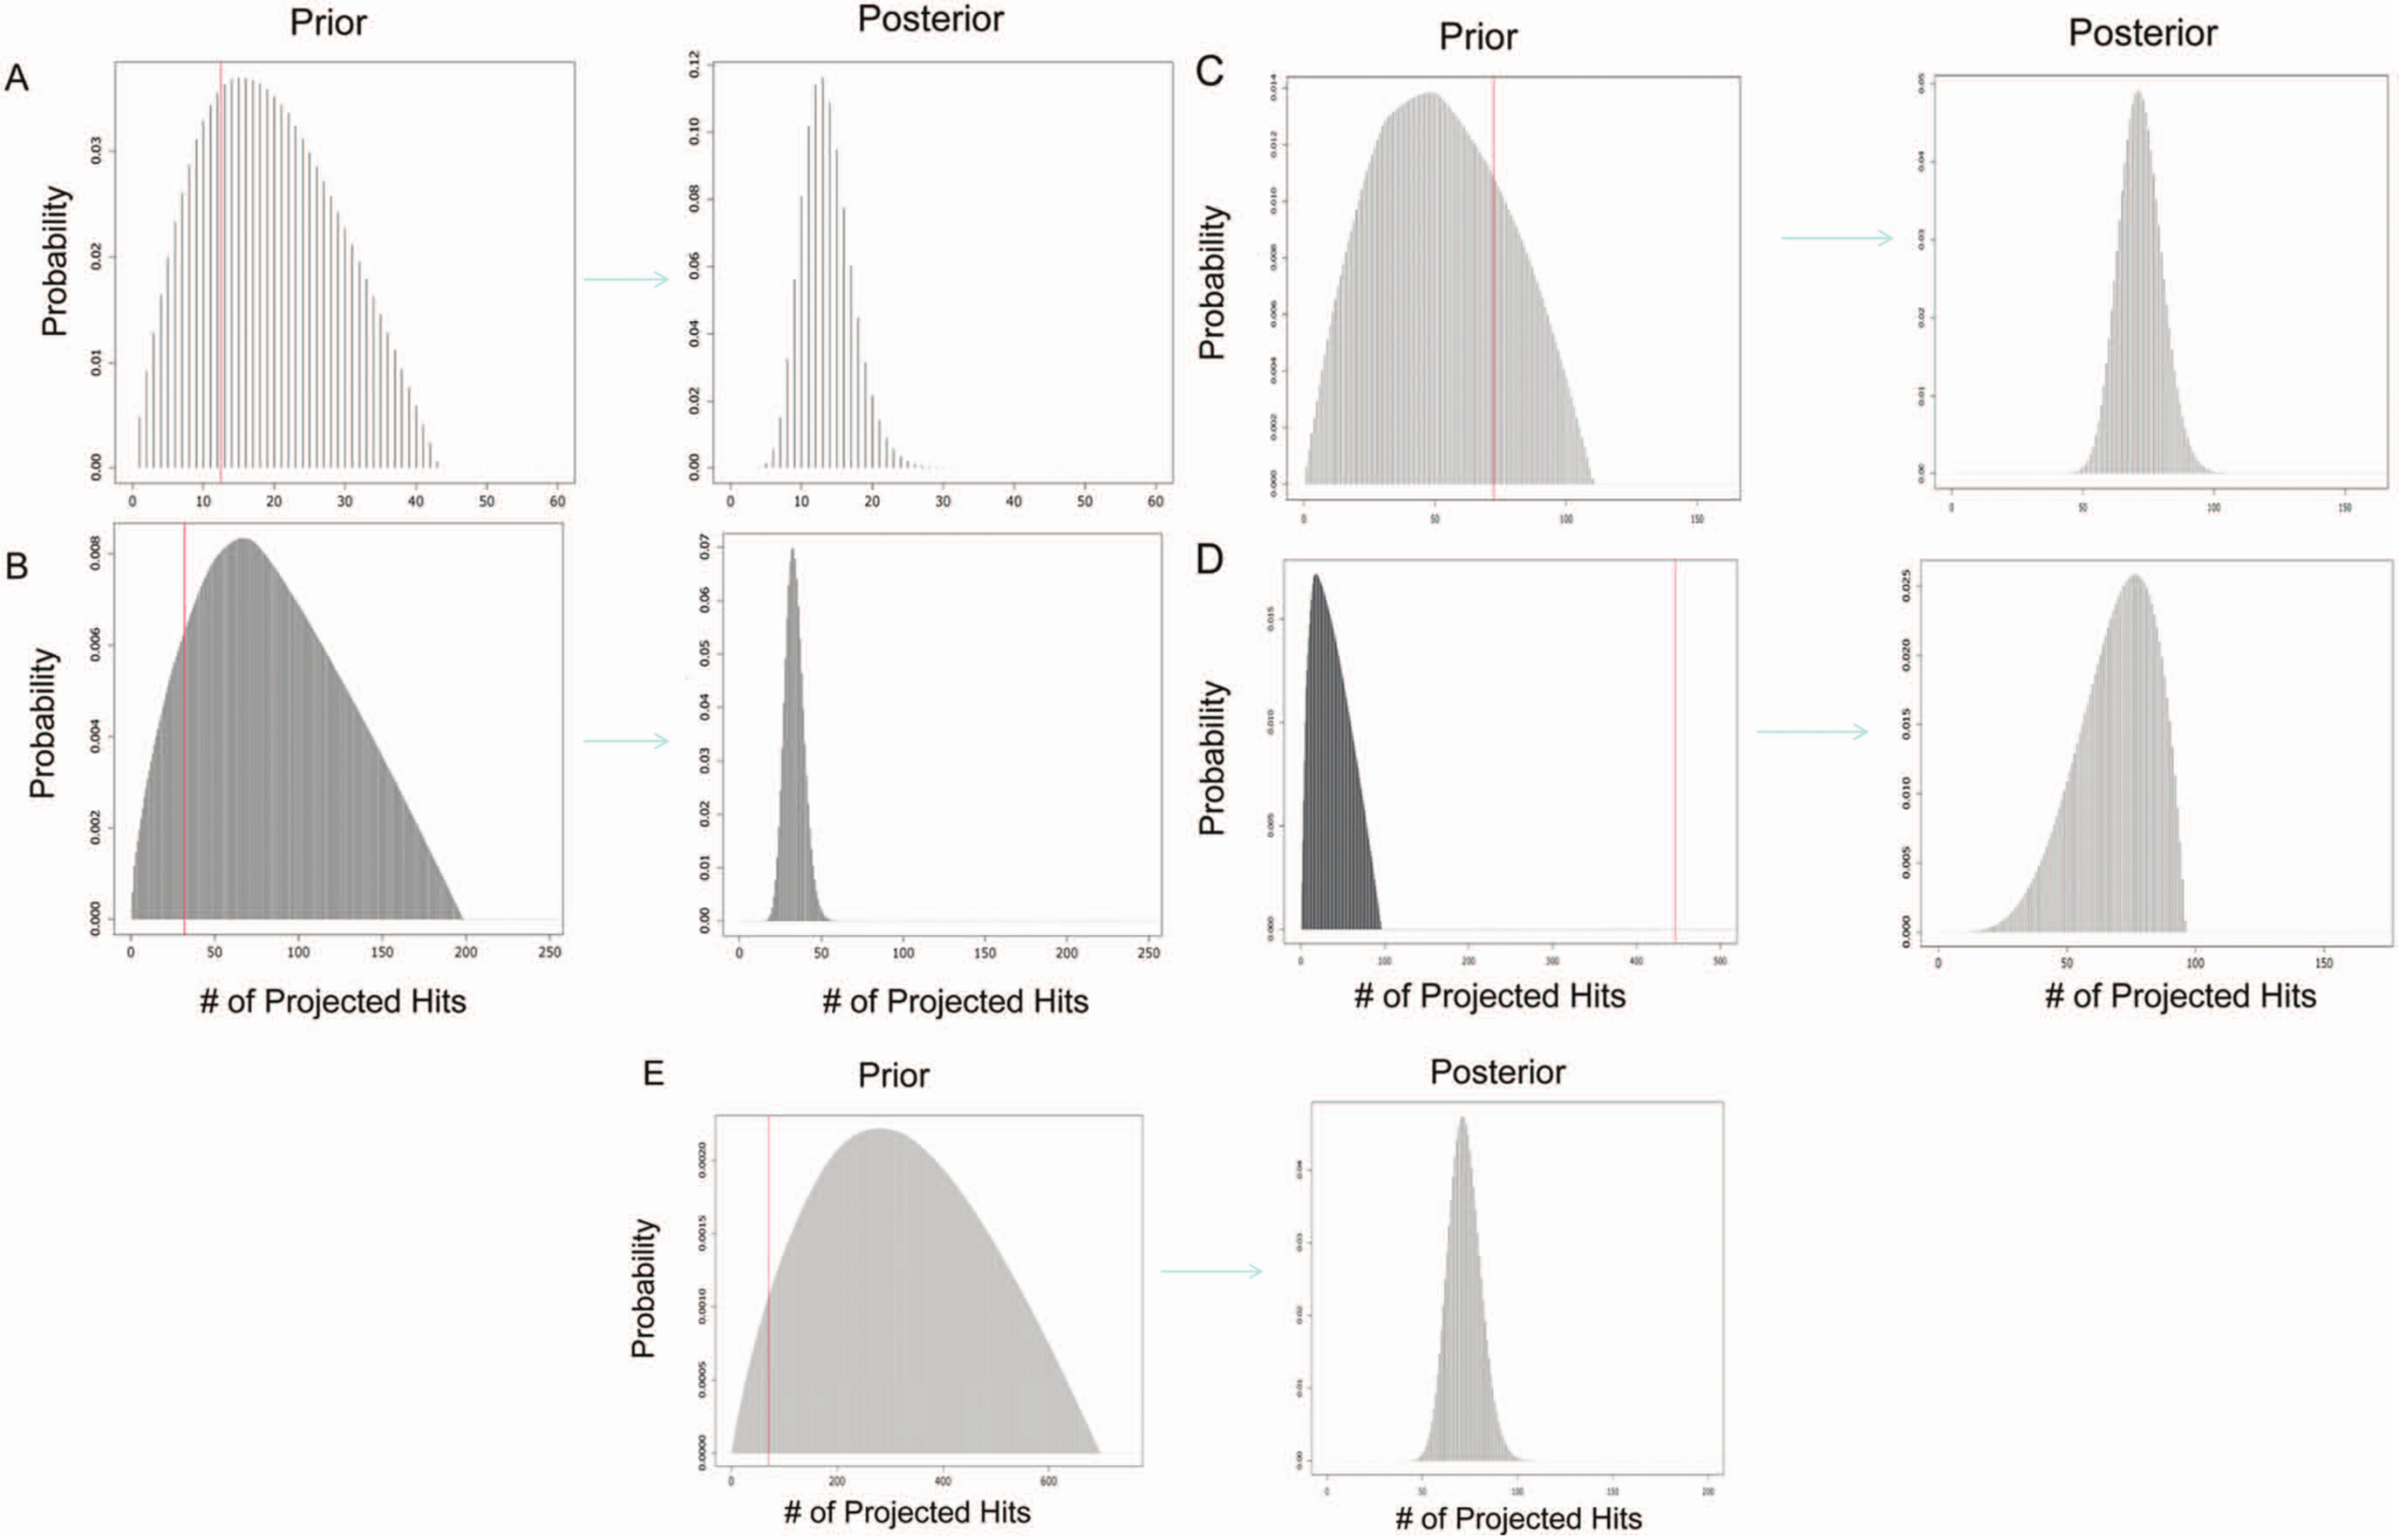
Empirical prior distribution for hit rate based on the pilot screen library (left panel) and posterior distribution derived from prior and binomial likelihood function (right panel) for projects A, B, C, D, and E. The posterior density is derived from the product of the prior and event likelihood scores according to Bayes’ rule. The red lines indicate the total compound numbers in the pilot screen × hit rates observed in the primary screen. Hit rate is the proportion of compounds from the entire primary screen with observed activities that are higher than the cutoff.
Use of the Bootstrap and Monte Carlo Method to Simulate the Primary Screen Based on Pilot Screen Data
The number of potential false negatives in HTS campaigns is generally affected by two factors when the number of candidate hits for confirmation is decided: (1) the number of true hits from the full primary library and (2) the technical variability of the test result for each individual compound. With regard to the first factor, we have discussed, in the previous section, the inference of the true hit rate in the primary library using the Bayesian principle. Specifically, our pilot screen is a trial experiment prior to the full-scale primary screen and run under similar experimental conditions. From a statistical point of view, however, the pilot screen with triplicates represents a 42% improvement in precision over the single-point primary screen based on the definition of mean standard error:
In addition to the true hit rate, the second factor influencing the false-negative rate is assay variability. A hit is more likely to be mislabeled as a nonhit as a result of a high standard deviation in a “noisier” assay than in a more reproducible one. However, the distribution of measurement errors for compounds with various activities has not been well studied. If we propose that each individual compound has a unique but unknown binding affinity µ and the observed activities follow a normal distribution, N(µ, σ2), where σ2 is the compound-specific detection variation, then the critical question is whether this error term is constant or not for all of the screened molecules. In Figure 3 , we plotted the logarithmically transformed standard deviations for all pilot library compounds against their mean signal intensities and used the Loess local regression method to assess the overall relationship between sampling error and mean signal intensities. The results from two data sets (projects A and B) show a similar pattern. In particular, Figure 3A shows a severe violation of the common error assumption, for the sampling variance increases drastically as the mean signal readings increase from 0% to 10% (percentage inhibition). These observations highlight the necessity of taking into account compound-specific sampling variations in simulations of experimental results.
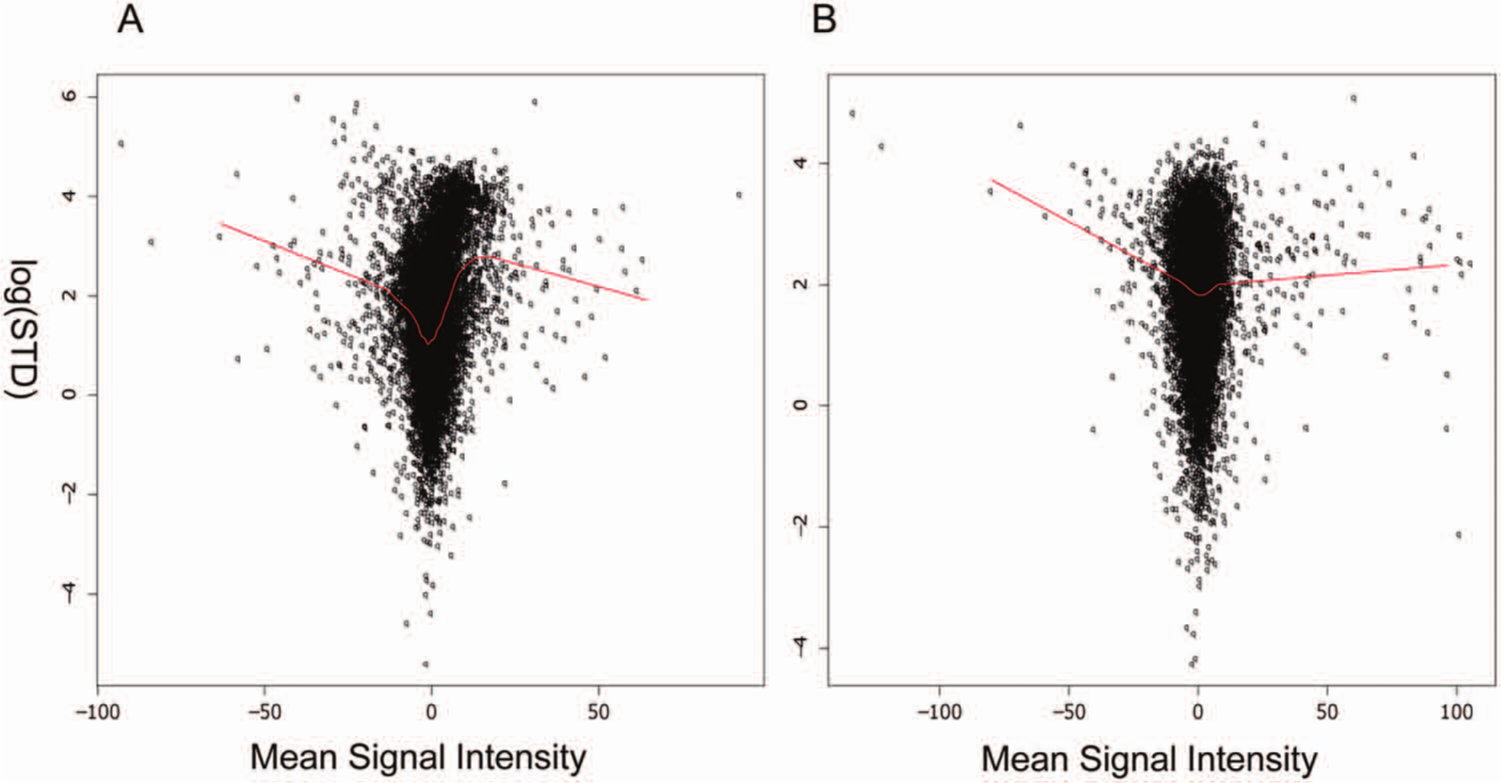
Relationship between average signal intensity and the standard deviation of three replicates can be revealed by loess regression using the pilot data of projects A and B as examples. The y axis represents the logarithmically transformed standard deviation of triplicates in the pilot screens.
Observed compound activities can be simulated only parametrically because each compound is tested independently only three times, which precludes meaningful bootstrapping using experimental data. With the mean and standard deviations readily available from the triplicates of the pilot screen, a normal distribution is a natural choice. To assess whether a normal density is an appropriate distribution for simulation of test results, we drew the quantile-quantile plots for three different types of control data consisting of thousands of replicates (
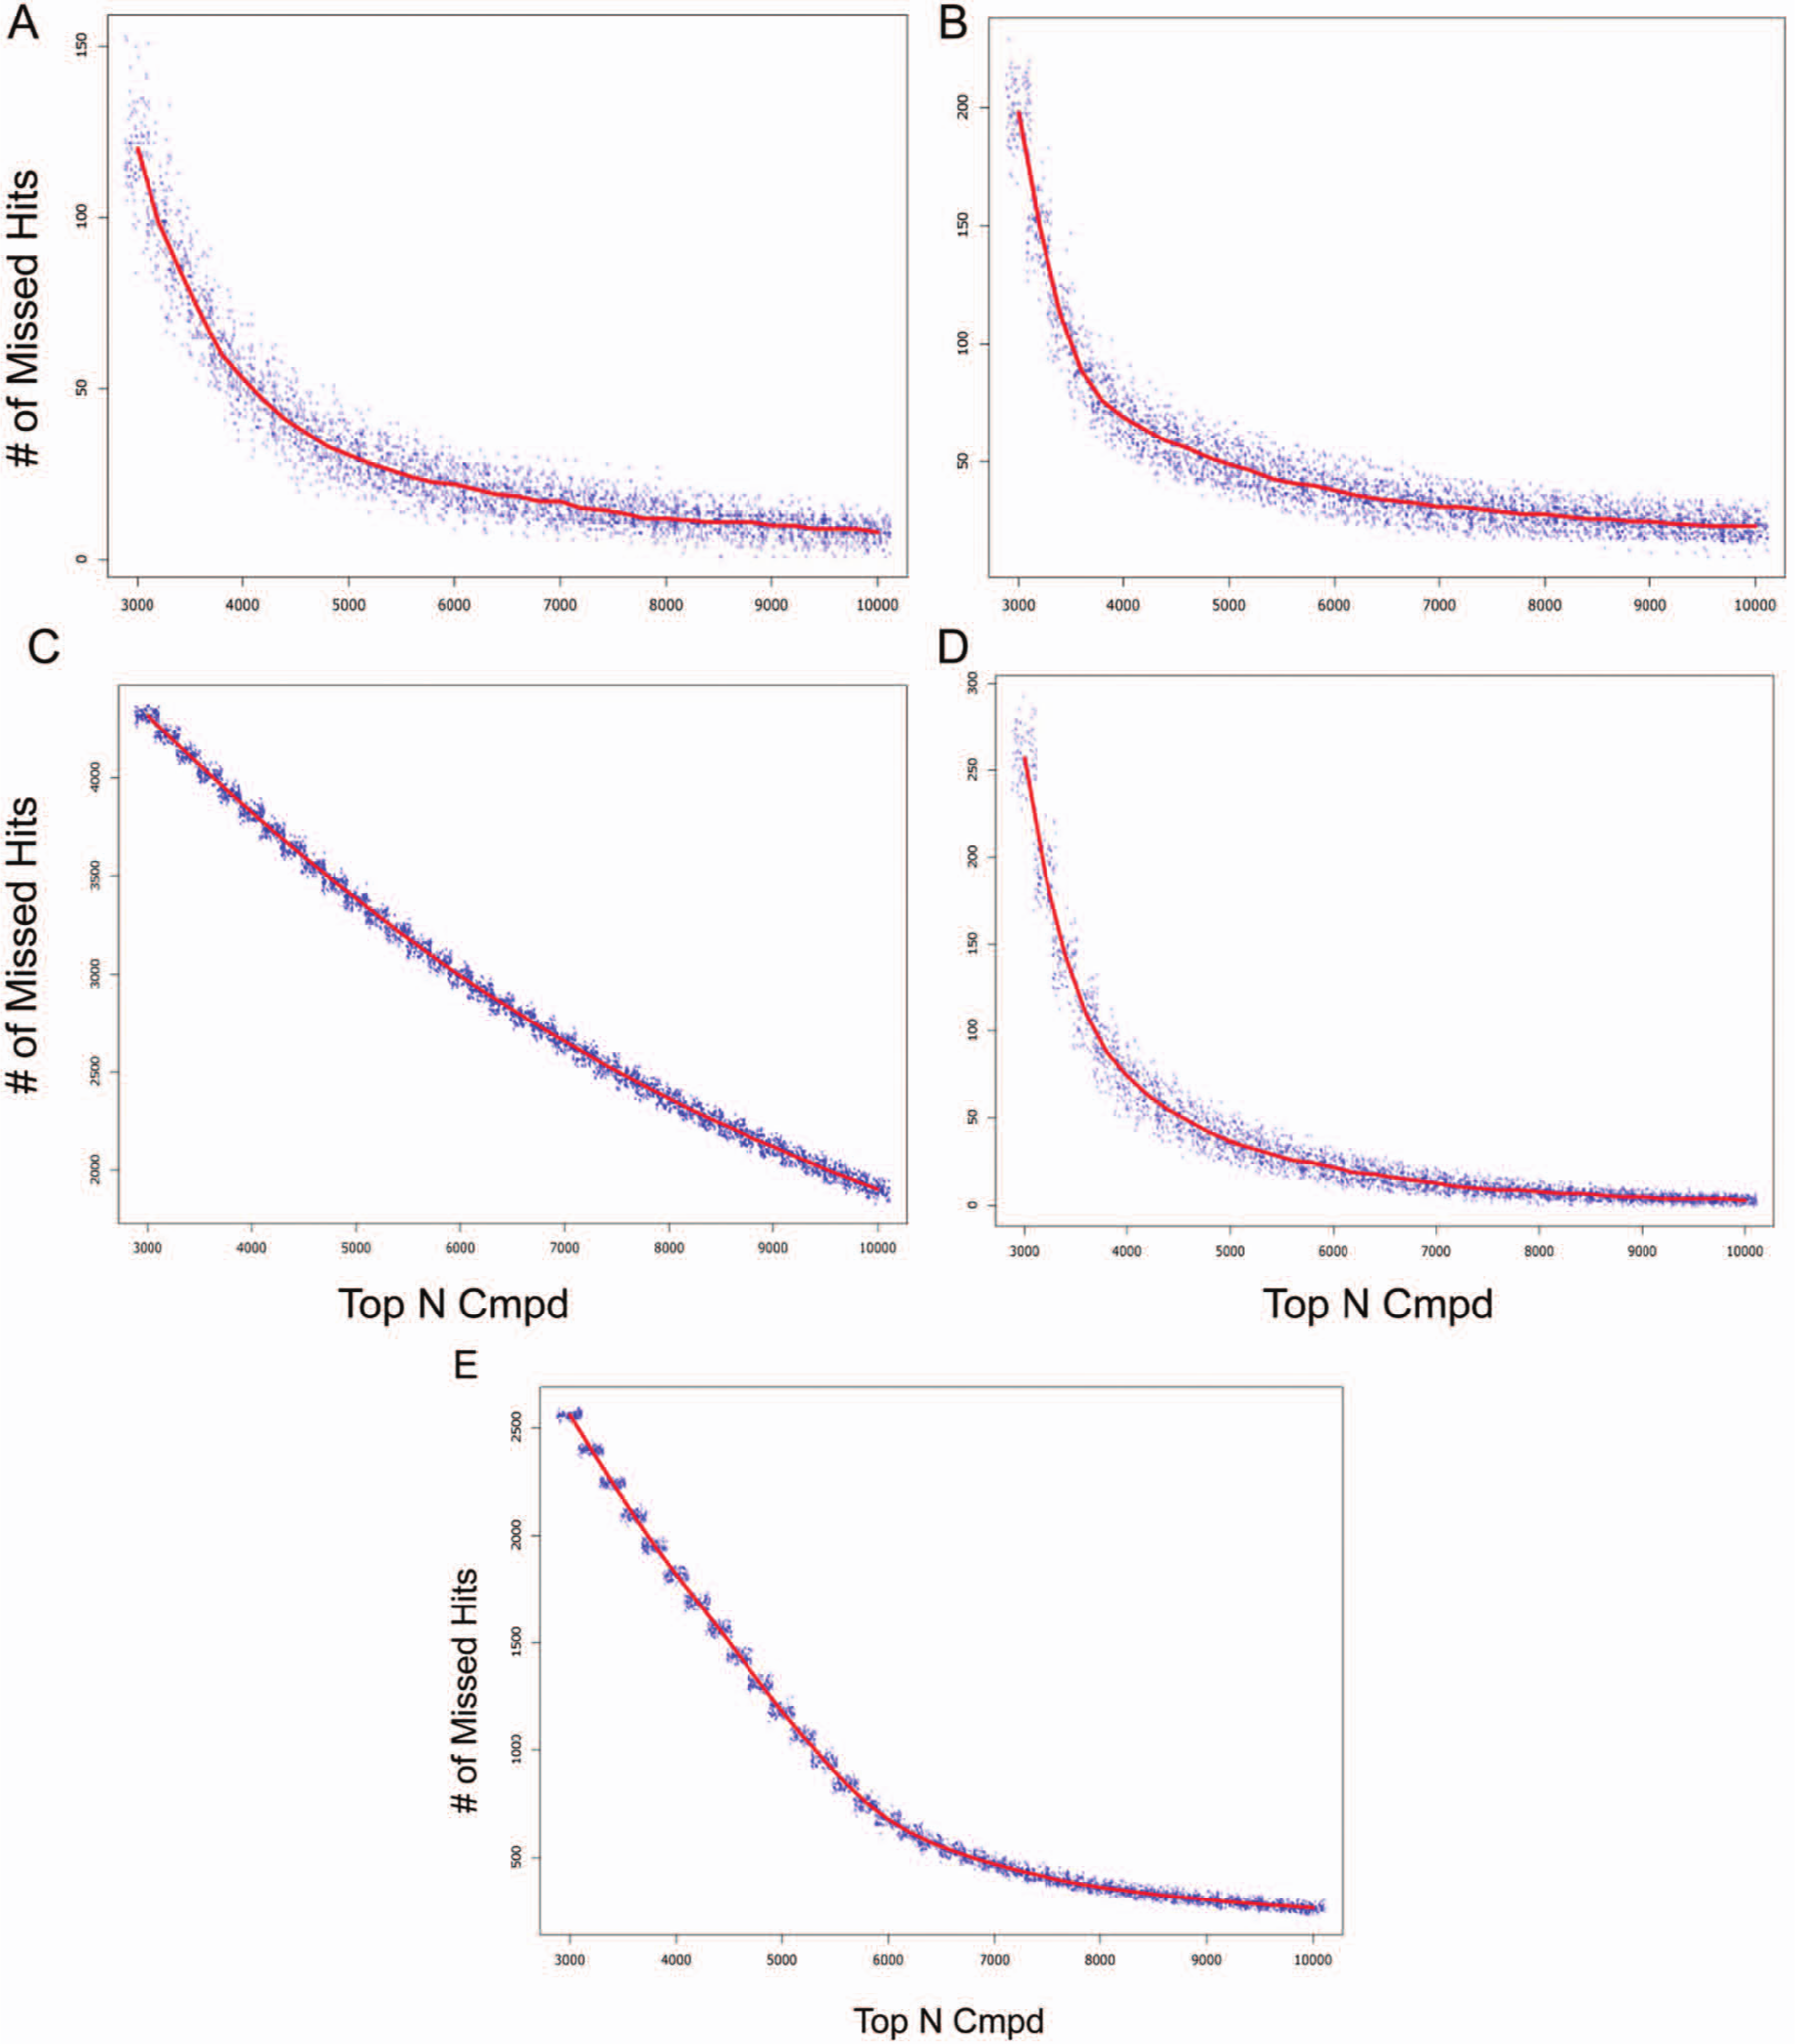
The projected number of false-negative hits is plotted against the number of top-ranked compounds in the primary screen that are chosen for follow-up confirmation testing. Note that projects A, B, C, and E are predicted using the mean hit rates derived from posterior distributions, whereas project D is modeled by the mean hit rate derived from prior distribution. The red lines represent the median of 100 simulations.
Experimental Confirmation of the Estimated False-Negative Rates
In practice, it is not feasible to completely confirm the predicted false-negative rate experimentally without rescreening the entire chemical inventory. This would be prohibitively expensive and time-consuming. Instead, it could be evaluated by comparing the predictive hit distribution to the true one that is experimentally derived from the confirmation screen. For this purpose, we first constructed the true hit density curve from the experimental data upon the completion of confirmatory screening for the top several thousand compounds. Specifically, in Figure 5 , the number of the confirmed hits within every 200 compound window was plotted against the rank of each window in a descending order of their activities in the primary screen. For example, the top 200 compound intervals’ rank is 200 on the x axis, and the top 800 to 1000 compound selection window’s rank is 1000. Figure 5 (black lines) demonstrates the distribution of confirmed hits from each bin of 200 compounds sorted by their experimental values. The results of projects A, B, and C indicate that the density of the confirmed hits is high among the top-ranked compounds and drops significantly as the test activities decrease. In another words, the “low hanging fruits,” most of which are very potent hits, were recovered and confirmed on the left side of the curve, while the vast majority of compounds tested in the confirmation screen turned out to be false positives (represented on the right side of the curve). Using project A as an example, the confirmation rate is more than 80% for the top 200 selections, whereas only a few (<10) truly active hits are confirmed among 200 compounds whose activities rank within the range of the top 3000 to 5000. The true hits that fall beyond the top 5000, if any, would be lost irreversibly for they would not even have chance to be revisited in a confirmatory screen.
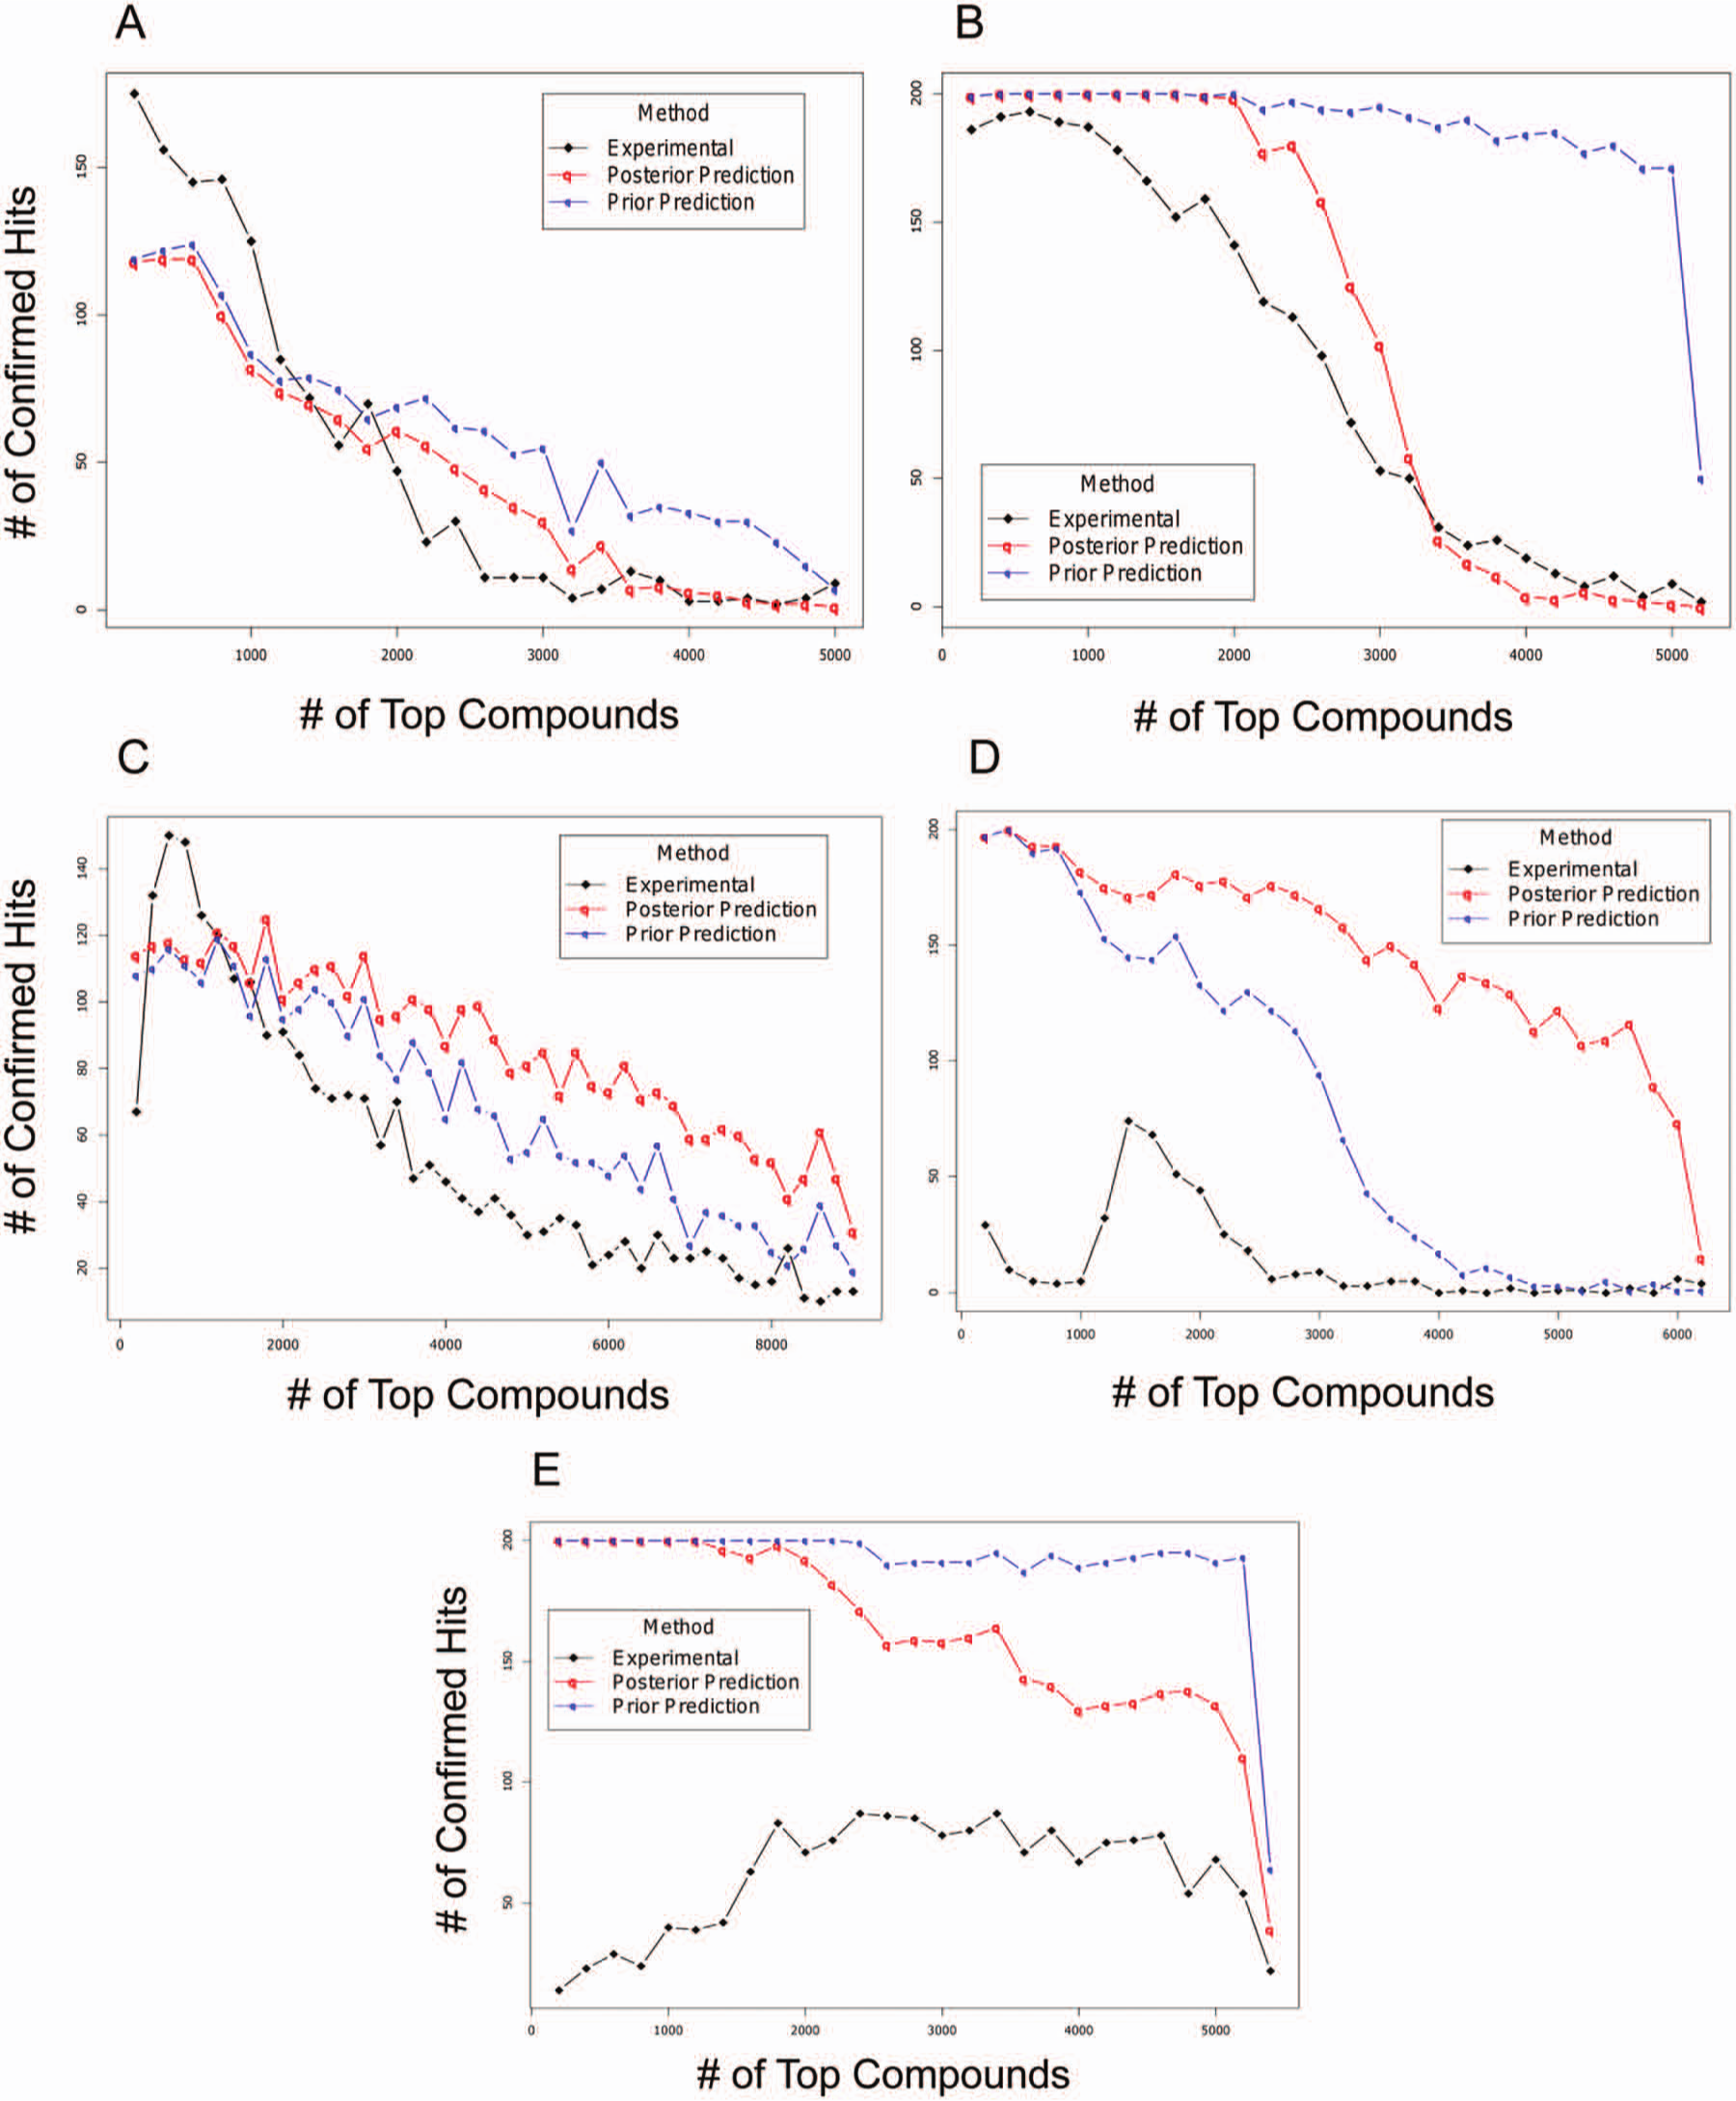
Partial validation of projected number of false-negative hits using the real hit distribution experimentally derived from confirmation screening (projects A, B, C, D, and E). The black lines represent the real hit distribution derived from confirmation screening, whereas the blue and red lines represent the predicted hit distributions based on prior and posterior probabilities, respectively.
In Figure 5 , we also plotted the curves of predicted hit distribution based on prior (blue lines) and posterior estimates (red lines) for comparison with the true hit densities discussed above. The results for projects A and C demonstrate that the projected hit densities derived from both the posterior and prior estimates gradually converge to the true hit distribution curve as the observed activities from the primary screen drop, an indication that the projected hit distribution may well extrapolate to the rest of the primary library that could not be exhaustively retested in the confirmation screen. Thus, this result showed that our method is robust enough to predict low hit rates among less likely hits and is indicative of the success of predicting overall false-negative rates, which is essentially represented by the area under the hit density curve for the rest of the full library. The results from projects B and D, on the other hand, demonstrate other interesting patterns. With project B, the predicted hit density curve, which is based on the prior estimator from the pilot data alone, drastically deviates from the experimental results, while the posterior-based prediction curve shows a nice convergence, suggesting that the incorporation of the primary screen results significantly improves the quality of the estimation. As a general rule, we believe that a good estimator for the hit rate should be the probabilistic combination of the pilot data, which carries statistical precision from the triplicates, and the primary screen, which is the unbiased representation of the entire chemical inventory. However, if the observed hit rate from the primary screen is of low reliability, which might be the case for project D, updating the prior distribution with this information may not lead to improvement of the estimation. The reliability issues with the primary screen of project D is first revealed by Figure 2D , which indicates that the number of observed hits has very a low likelihood according to the prior probability distribution derived from pilot data. The rescreening result shown in Figure 5D confirmed that, unlike the cases with projects A, B, and C, a very high percentage of the top-ranked compounds from the primary screen are false positives, suggesting that the primary screen results correlate poorly with the true potencies. This observation casts serious doubts on the reliability of the primary screen results. As a result, the hit estimate based on the prior distribution actually demonstrates better convergence to the experimental data. Finally, Figure 5E shows a failed prediction in which neither the prior nor posterior estimate is able to project the trend for the true hit distribution of project E. In fact, the confirmation screen reveals no hit enrichment among the compounds that have higher activity rankings relative to those with lower rankings, indicating the entire lack of correlation between the primary test results and true potencies.
Comparison with p Value Distribution Method
While the write-up of this article was under way, Prummer 10 independently published on small-molecule HTS data analysis based on a p value distribution method that was originally developed for microarray gene expression analysis. Here we applied his method to two of our primary HTS campaign data sets and presented the results in supplemental materials.
Discussion
The lack of experimentally replicated data is one of the main reasons why rigorous statistical methodologies have not been widely applied to analyses of HTS data. In this study, we took a balanced intermediate approach between either sole reliance on traditional single-point data sets or unrealistic implementation of replication for millions of compounds. By selectively profiling replicates on 1% of the whole chemical inventory, we were able to gather important prior information about hit potencies and assay variability relevant to the entire library. However, sole reliance on the prior distribution derived from a pilot library screen may introduce serious bias to the hit rate projection if the pilot library does not represent a truly random sampling of the screening library, which is often the case in real-world applications. To address this complication, we additionally applied an empirical Bayesian formula to our analyses. This seems a sensible choice given that the posterior distribution of the hit rate represents the probabilistic combination of prior distribution and the complete set of observed primary screening data. Our results demonstrate that the curves for projected hit density based on either the prior or posterior distribution might show large errors in predicting the hit rate for compounds with high observed activities (left side of hit density curve in Fig. 5 ). This deviation indicates that this approach may be less reliable in estimating the overall confirmation rate in the far left region of the curve, an area representing the majority of confirmed hits. On the other hand, the algorithm performs well as the predictive curves gradually converge to the experimentally confirmed low hit density on the right side of the curve ( Fig. 5A – D ). This is a promising piece of evidence supporting the utility of our method for estimating the number of potentially missed hits that are not selected for confirmation screening due to low hit enrichment. More specifically, our approach estimates that with the selected hit detection thresholds, less than 100 potential true hits were lost in project A, whereas the false-negative count for project C was of the magnitude of several thousand compounds. Interestingly, project A was a discovery project for small-molecule inhibitors targeting protein-protein interactions (PPIs). Because of the mechanistic hurdle of inhibiting PPI targets with small molecules, the number of true hits identified by common HTS technologies is typically very low. 11 Given the relatively high confirmation rate in the follow-up screen for project A, the low false-negative rate predicted by our method is consistent with our empirical knowledge about PPI antagonist projects. On the other hand, project C targets a kinase, which contains an easily accessible binding pocket for small-molecule ATP analogs. Based on extensive previous experience with similar targets, we expect a relatively high primary hit rate for such a project. Therefore, the seemingly very high projected number of missed hits, after taking into account the number of confirmed hits from the follow-up screen, is not a surprise. It appears that our strategy can be complementary to Prummer’s approach, 10 which successfully estimated the false-positive rate. Together, they might offer a more complete solution for overall evaluation of HTS campaigns.
When updating the prior distribution with observed data in a probabilistic framework, we should be aware that data of low reliability from a primary screen may skew the distribution for hit estimation, as we observed with project D. Thus, we set the following decision guiding rule: use the mean hit rate, estimated from a posterior distribution, to model the real hit rate unless the primary screening result is considered not to be reliable based on prior distribution, as illustrated by Figure 2D . In the latter situation, the prior distribution alone has to be used to construct the projected curve for missed hits. Furthermore, the unsuccessful attempt to project false negatives for project E demonstrates the limitation of this approach. In this project, neither the prior nor posterior estimate was able to predict the trend for true hit distribution among the top few thousand compounds from the primary screen. In fact, this particular screening campaign was known to be very challenging as many redox and auto-fluorescent compounds severely interfered with the fluorescence-based measurement of the assay format. Consequently, the pilot screen was plagued by high assay background signals, indicated by the relatively low Z′ factor (shown in Table 1 ; Z′ factor = 0.33 for pilot screen from project E). Understandably, neither the prior distribution based on the flawed pilot screen data nor the posterior density, which was derived from the prior distribution, was able to generate a correct model of the true hit distribution. We also noted that the Z′ score appears to be the necessary but not sufficient condition to determine the utility of the observed information in modeling hit distribution. Using project D ( Fig. 2D ) as an example, the observed hit count from the primary screen has a low probability score, leading to severe errors in predicting the true hit distribution, and yet, the screen had a fairly acceptable Z′ score (0.85).
In summary, we have developed a methodology for predicting false-negative rates for screens with high assay quality and low compound interference. Our results show that the predicted hit distributions correlate well with experimental data for compound sets with low observed activities. The availability of this methodology for predicting false-negative rates can guide HTS groups in selecting the appropriate number of candidate compounds for hit confirmation in an evidence-based manner.
Footnotes
Acknowledgements
We would like to acknowledge Mr. Michael Prummer for helping us generate false-negative predictions using his method 10 and Shirley Li for critical reading of the article.
Declaration of Conflicting Interests
The authors declared no potential conflicts of interest with respect to the research, authorship, and/or publication of this article.
Funding
The authors received no financial support for the research, authorship, and/or publication of this article.
References
Supplementary Material
Please find the following supplemental material available below.
For Open Access articles published under a Creative Commons License, all supplemental material carries the same license as the article it is associated with.
For non-Open Access articles published, all supplemental material carries a non-exclusive license, and permission requests for re-use of supplemental material or any part of supplemental material shall be sent directly to the copyright owner as specified in the copyright notice associated with the article.