
Abstract
High-throughput compound screening using electrophysiology-based assays represents an important tool for biomedical research and drug discovery programs. The recent development and availability of devices capable of performing high-throughput electrophysiology-based screening have brought the need to validate these tools by producing data that are consistent with results obtained with conventional electrophysiological methods. In this study, we compared the response properties of hα3β4 and hα4β2 nicotinic receptors to their endogenous ligand acetylcholine (ACh) using three separate electrophysiology platforms: Dynaflow (low-throughput, manual system), PatchXpress 7000A (medium-throughput automated platform), and IonWorks Barracuda (high-throughput automated platform). We found that despite the differences in methodological approaches between these technologies, the EC50 values from the ACh dose-response curves were consistent between all three platforms. In addition, we have validated the IonWorks Barracuda for both competitive and uncompetitive inhibition assays by using the competitive nicotinic antagonist dihydro-beta-erythroidin (DHβE) and uncompetitive nicotinic antagonist mecamylamine. Furthermore, we have demonstrated the utility of a custom-written algorithm for generating dose-response curves from multiple extrapolated current metrics that allows for discriminating between competitive and uncompetitive inhibition while maintaining high-throughput capacity. This study provides validation of the consistency of results using low-, medium-, and high-throughput electrophysiology platforms and supports their use for screening nicotinic compounds.
Introduction
Neuronal nicotinic receptors (NNRs) are members of the ligand-gated ion channel (LGIC) super family and are widely expressed throughout the brain and peripheral nervous system. These receptors are involved in a broad range of physiological processes including memory and attention, and they have been implicated in several different pathological conditions such as Alzheimer’s disease, Parkinson’s disease, and addiction. 1 NNRs have been a focus of drug discovery programs for decades, with the majority of research centered on compounds with either full or partial agonist activity. 2
The recent introduction of medium- and high-throughput electrophysiology platforms has allowed for the ability to assess the functional activity of a large number of compounds designed to target LGICs. Several automated electrophysiology platforms have now become commercially available for use in higher-throughput drug screening,3–5 with only a handful of publications demonstrating their use for NNR compounds.6–8 These studies have yielded EC50 data from automated platforms for both α4β2 and α7 nicotinic receptors using the endogenous nicotinic ligand acetylcholine (ACh) that are highly comparable to those obtained with manual patch clamp recordings; however, these platforms cannot truly be considered high throughput.
The IonWorks Barracuda is the newest automated electrophysiology platform that uses population patch clamp (PPC) under perforated patch conditions and allows for simultaneous recordings from up to 64 cells per well in a 384-well format. Although PPC can greatly improve the success rate and intrinsic averaging among many cells during automated electrophysiology experiments, 9 it had not yet been shown whether full dose responses for either agonists or antagonists that are represented by a sum of many uniform currents from multiple cells show good consistency with the results of conventional approaches that use single-cell recordings.
In addition, within the past few years, there has been a fast growing recognition for a class of compounds that can modulate LGIC activity by acting at sites other than the orthosteric binding site. Among these classes of compounds are uncompetitive inhibitors, of which the inhibition is contingent upon prior activation of the channel, and therefore are typically referred to as open channel blockers. This class of inhibitors that act via a different site other than the ligand-binding site holds considerable promise as therapeutics for numerous clinical indications.10–12 Uncompetitive antagonists can be differentiated from noncompetitive antagonists in that although both act at sites different than the orthosteric site, noncompetitive antagonists do not require prior activation of the channel to inhibit receptor function. Furthermore, the allosteric inhibition by noncompetitive antagonists is not dependent on the concentration of agonist, whereas uncompetitive inhibitors become more effective at higher agonist concentrations due to a greater amount of open channels that can be blocked. 10 Because studies using automated electrophysiology platforms have focused only on determining the effects of agonists or competitive antagonists at NNRs,6–8 there have been no published reports demonstrating the effects of open channel blockers using high-throughput electrophysiology-based platforms.
In this article, we support the use of the IonWorks Barracuda high-throughput system for screening both nicotinic agonists and antagonists by comparing current measurements obtained with ACh alone or in the presence of two nicotinic antagonists (DHβE and mecamylamine) across three different electrophysiology platforms: Dynaflow (manual electrophysiology), PatchXpress 7000A (medium-throughput automated electrophysiology), and IonWorks Barracuda (high-throughput automated electrophysiology). In addition, through the use of a custom-written MATLAB function to obtain additional current metrics, we describe a potential method for differentiating between competitive and uncompetitive antagonists by comparing the relative potency of the antagonist to inhibit the peak current amplitude versus its ability to change the kinetics of the aggregate current response.
Materials and Methods
Cell Culture
The human epithelial SH-EP1 cell line stably expressing the α4β2 neuronal nicotinic receptor was obtained from Dr. Ronald J. Lukas (Barrow Neurological Institute, Phoenix, AZ), and the Chinese Hamster Ovary (CHO) cell line stably expressing the human α3β4 nicotinic receptor was purchased from ChanTest, Inc. (Cleveland, OH). SH-EP1 α4β2 cells were routinely grown at 37 °C under a 95%O2/5% CO2 atmosphere, in Dulbecco’s Modified Eagle’s Medium (DMEM) supplemented with 5% horse serum, 10% heat-inactivated fetal bovine serum (FBS), 4 mM L-glutamine, 400 µg/mL Hygromycin B, and 500 µg/mL Zeocin. CHO α3β4 cells were grown at 37 °C in F12 growth media supplemented with 10% FBS, 400 µg/mL Zeocin, and 250 µg/mL Geneticin. For DynaFlow experiments, cells were grown in a 12-well plate and were washed with Dulbecco’s phosphate-buffered saline (D-PBS) without calcium and magnesium and incubated in Accumax for approximately 15 min. Media were added to the well and cells were washed off and transferred into a 15 mL centrifuge tube and spun for 2 min at 1000 RPM. Media were aspirated and cells were resuspended in 2 mL external buffer. For PatchXpress experiments, plates were washed twice with prewarmed D-PBS without calcium and magnesium prior to harvesting. Plates were then incubated for 15 to 20 min at 37 °C with 3 mL Accumax (SH-EP1 cells) or 3 mL Accutase (CHO cells). After the incubation, cells were harvested and left undisturbed for at least 15 min at 37 °C. Prior to experiments, cell suspension was centrifuged for 2 min at 1000 RPM, the supernatant was discarded, and the cell pellet was resuspended in 100 µL of recording medium. For Barracuda experiments, cells were cultured in 100 mm plates and harvested when approximately 90% to 95% confluent. After rinsing with D-PBS without calcium and magnesium, cells were harvested using 1.5 mL of Trypsin for 10 min. Five milliliters of media was added to wash cells from the plate, and cells were centrifuged for 3 min at 1000 RPM. After the supernatant was discarded, cells were resuspended in 5 mL external buffer.
Solutions
External buffer for DynaFlow experiments contained (in mM) NaCl, 137; KCl, 4.0; CaCl2, 1.8; MgCl2, 1; HEPES, 10; glucose, 10; and pH adjusted to 7.4 with Tris base. The intracellular solution for manual whole-cell recordings was composed of (in mM) 110 Tris phosphate dibasic, 28 Tris-base, 11 EGTA, 2 MgCl2, 0.1 CaCl2, and 4 Mg-ATP; pH 7.3. 28 External buffer for PatchXpress experiments was composed of (mM) NaCl, 120; KCl, 3; CaCl2, 2; MgCl2, 2; HEPES, 10; glucose, 25; pH adjusted to 7.4 with Tris base, and the intracellular solution for the whole-cell recordings was composed of (mM) Tris base, 138; MgCl2, 2; EGTA, 11; Na-ATP, 4; CaCl2, 0.5; pH 7.2 adjusted with H3PO4. The external buffer for Barracuda experiments contained (mM) NaCl, 137; KCL, 4; MgCl2, 1; CaCl2, 1.8; HEPES, 10; and glucose 10, and the internal solution was composed of (mM) KCL, 160; MgCl2, 2; EGTA, 5; and HEPES, 10. For agonist assays, ACh was added to the external solution, and for antagonist assays, either ACh plus DHβE or ACh plus mecamylamine was added to the external solution.
Electrophysiology
Conventional whole-cell current recordings together with a computer-controlled Dynaflow system (Cellectricon, Inc., Mölndal, Sweden) for fast application and removal of agonists were used in these studies and have been described previously.11,13 In brief, the cells were placed in a silicon chip bath mount on an inverted microscope (Carl Zeiss, Inc.). Cells chosen for analysis were continuously perfused with standard external solution (20 µL per hour). Glass microelectrodes (3–5 MΩ resistance between the pipette and extracellular solutions) were used to form tight seals (1 GΩ) on the cell surface until suction was applied to convert to conventional whole-cell recording. The cells were then voltage-clamped at holding potentials of −60 mV, and ion currents in response to application of ligands were measured. Whole-cell currents recorded with an Axon 700A amplifier were filtered at 1 kHz and sampled at 5 kHz by an ADC board 1440 (Molecular Devices, Sunnyvale, CA) and stored on the hard disk of a PC computer. Whole-cell access resistance was less than 20 MΩ. Data acquisition of whole-cell currents was done using a Clampex 10 (Molecular Devices), and the results were plotted using Prism 5.0 (GraphPad Software Inc., La Jolla, CA). The experimental data are presented as the mean ± SEM, and comparisons of different conditions were analyzed for statistical significance using Student’s t-tests. All experiments were performed at room temperature (22 °C). Concentration-response profiles were fit to either a single or dual Hill equation and analyzed using Prism 5.0. More than 90% of the cells responded to ACh, and every cell presenting a measurable current was taken into account. Cells were held at −60 mV throughout the experiment. ACh, DhβE, and mecamylamine were prepared daily from stock solutions.
Methods for whole-cell recordings obtained with the PatchXpress system have also been described previously. 8 Briefly, SealChip electrode arrays (manufactured by AVIVA Biosciences and distributed by Molecular Devices) were loaded and automatically prepared according to the built-in procedure. Cell suspensions were triturated four times by an on-board Carvo pipetting robot, and 3 µL of cell suspension was added to each well. After applying the initial attraction pressure, pressure ramps were repeatedly applied until the whole-cell configuration was established. After a 2 min stabilization period, the experimental sequence was initiated. Cells were held at −60 mV. ACh and drug solutions were delivered at 100 µL/s for 2 s. Following a 10 s wait period, the next application of drug was performed. All recordings were performed at room temperature. Cells with at least 50 pA of peak current and Rm ≥200 MΩ were used for analyses. Data analyses were performed using DataXpress 2.0 (Molecular Devices). Statistical analyses and curve fitting were performed with Prism 5.0 (GraphPad Software).
The following methods were used for recordings obtained with the IonWorks Barracuda. After resuspended cells were placed inside the system, external buffer was added to the 384-well patch plate, and a hole test was performed to assess the number of blocked wells. Cells were then mixed and dispensed into the cell boat, and 10 µL of the cell suspension was added to each of the 384 wells of the patch plate. Two seal tests were performed through the application of a 10 mV step, and then β-escin (1.3 mg per 100 mL internal solution) was added for 10 min as a perforating agent to gain access to the cells. β-escin has been shown to be an effective agent for perforated patch experiments14,15 and provides advantages such as higher solubility and lower cost over other traditional ionophores such as amphotericin B. Once whole-cell access was achieved, a third seal test was performed before compound(s) were added to the wells. All recordings were performed at room temperature.
Data Analysis Using Custom MATLAB Function
To analyze data collected from the IonWorks Barracuda system, a custom function was written in MATLAB (The MathWorks, Inc., Natick, MA) to determine the peak amplitudes and current decay constants from the exported raw traces for each of the 384 wells. Briefly, the raw seal test (10 mV step) and current traces for all 384 wells were exported as .csv files. Wells without quality seals (<20 MΩ) or with blocked holes (>500 MΩ) were excluded from analysis. Desired metrics (peak amplitude, charge, activation, and current decay kinetics) were calculated for each current trace and matched to the compound and concentration information for that well. Current decays were fit with a single exponential function, and IC50 values were determined by fitting a concentration-response curve to the normalized amplitude and decay constant values with a single Hill equation. Dose-response graphs were then generated for all compounds and desired metrics for each run. An example of the exported plots is shown in Figure 1 . For this experiment, a 384 well plate was filled with 30 six-point dose ranges of ACh, resulting in an average EC50 of 19.4 ± 2.2 µM, with a coefficient of variation of 0.63, as calculated by the following equation: Cv = SD/mean. The Z-factor (Z′), a standard measure to evaluate the quality of the assay, 16 was 0.52, as determined by the following equation: Z′ = 1 – [(3*SDpositive + 3*SDnegative)/|meanpositive – meannegative|]. Wells without ACh were used as negative controls, and wells with 300 µM ACh added were used as positive controls. For agonist assays, Z′ values ranged between 0.32 and 0.52.
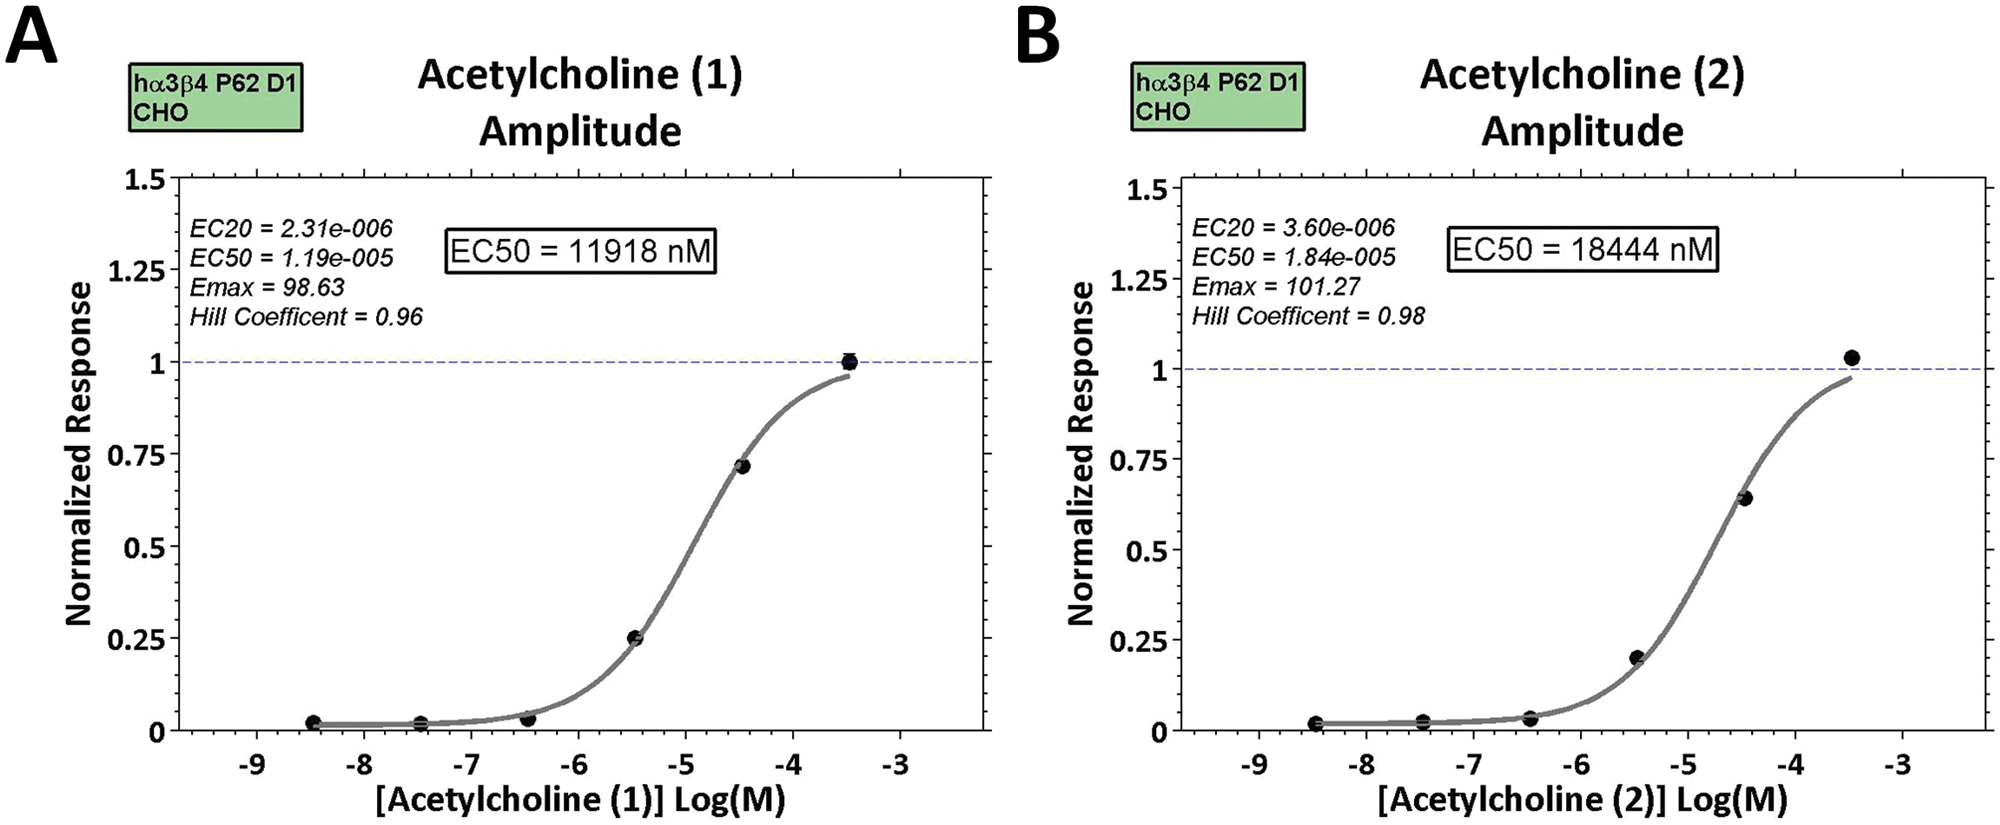
Example output graphs for acetylcholine (ACh) activation of α3β4 receptors. Example dose-response plots generated by the custom MATLAB function for ACh from two separate rows of the same 384 plate are shown in (
Results
Concentration-Response Curves for ACh Activation of α4β2 and α3β4 Receptors
To validate results from a cross-platform comparison, we first obtained concentration-response curves for ACh using a standard, whole-cell electrophysiology method as well as both automated platforms ( Fig. 2 ). Figure 2A shows the ACh concentration-response curve for α4β2 receptors using the Dynaflow system, a platform that uses conventional, manual electrophysiological techniques. This platform allows for the acquisition of one full dose-response using one cell at a time and therefore requires an entire day of experimentation to obtain a sufficient number of cells for a dose-response plot for one compound. Following whole-cell access, cells expressing α4β2 receptors were exposed to 1 s applications of increasing concentrations of ACh, with a 30 s washout period between each application. Each cell was exposed to a full 13-point concentration range. α4β2 receptors have been proposed to exist as a mixture of two stoichiometries, (α4)2(β2)3 and (α4)3(β2)2, with the former exhibiting high sensitivity (HS) and the latter low sensitivity (LS) to agonist activation.17,18 In accordance with this, the dose-response curve was best fit with a dual Hill equation, resulting in average EC50 values for HS α4β2 receptors of 2 µM and 71 µM for LS α4β2 receptors (n = 4).
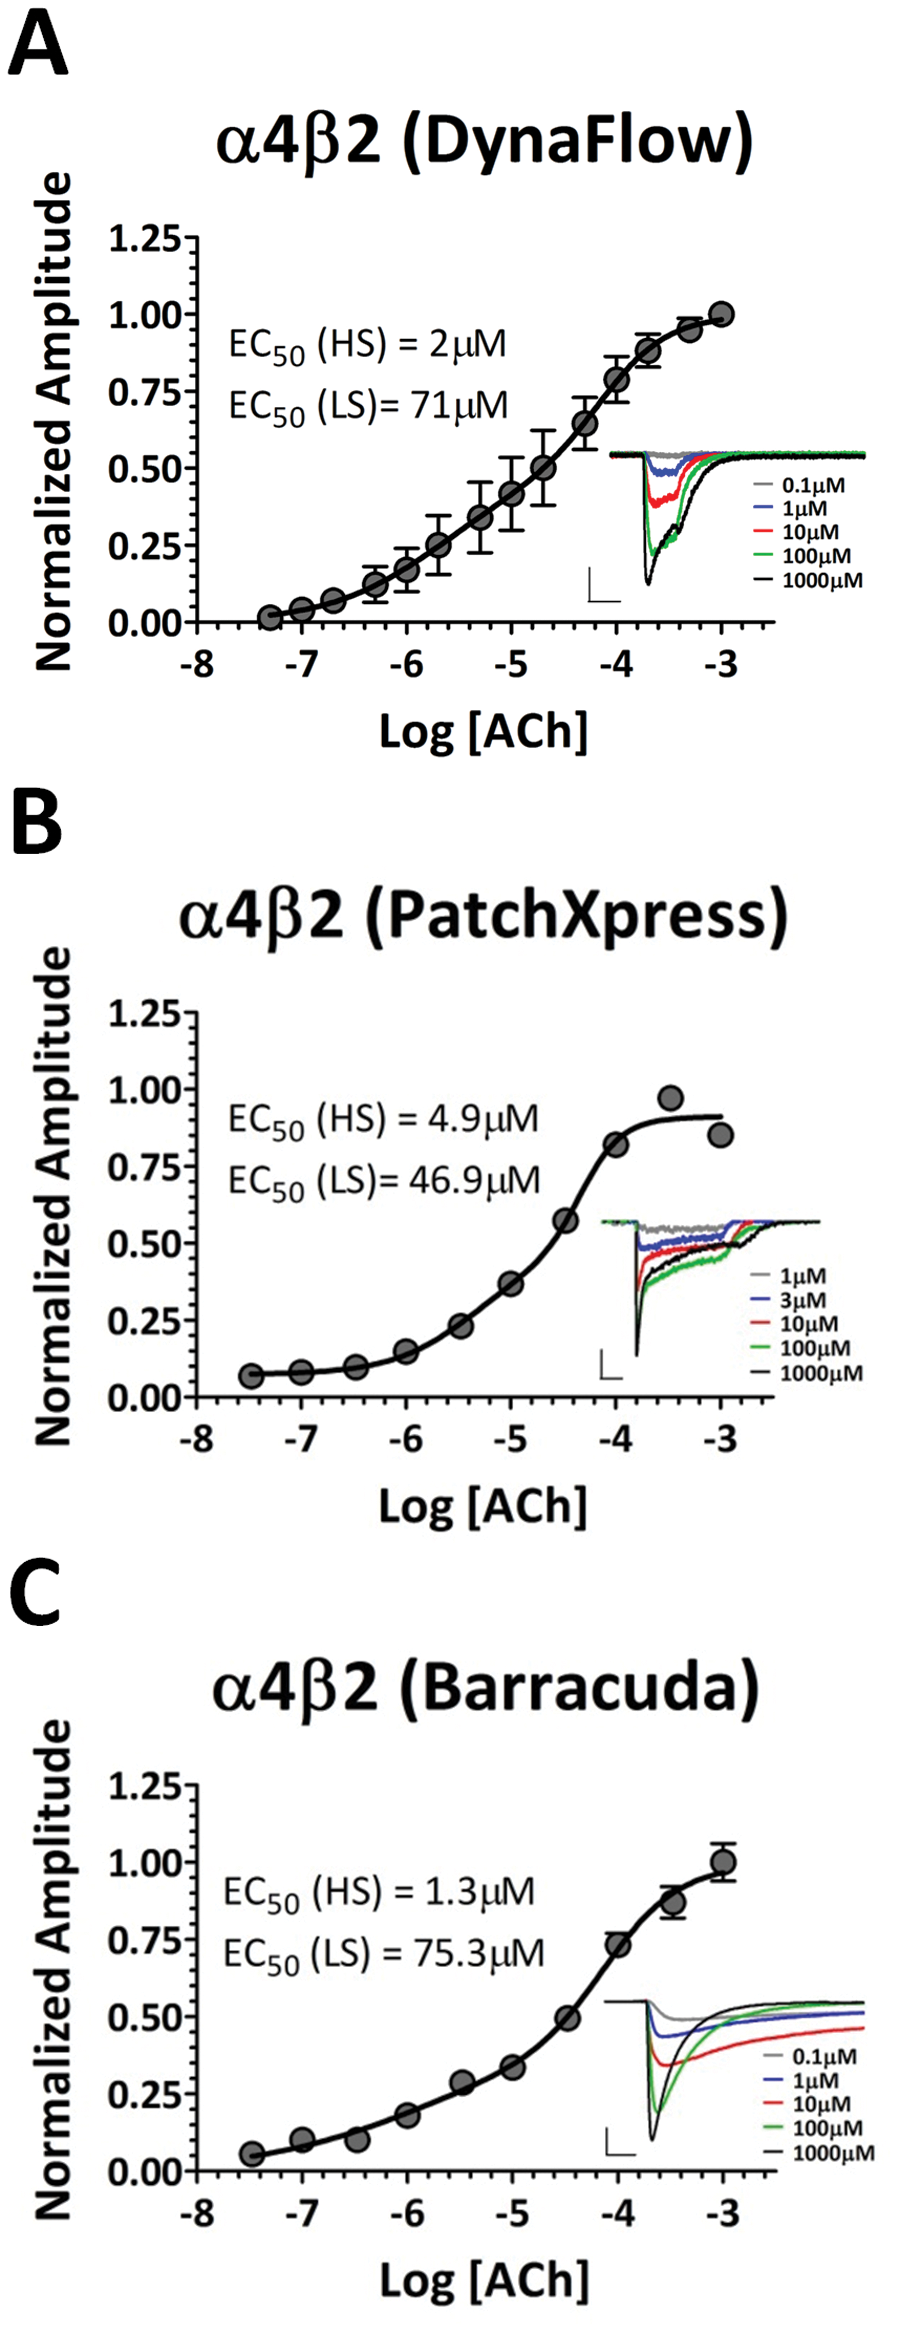
Concentration-response curves for acetylcholine (ACh) activation of α4β2 receptors. (
Figure 2B shows the average concentration-response curve for ACh activation of α4β2 receptors using the automated platform PatchXpress. This automated platform allows for much higher throughput as compared with manual recordings, in that repeated compound applications can be performed on 16 separate whole-cell recordings simultaneously. Here, individual cells were exposed to 2 s applications of increasing concentrations of ACh, with a 60 s washout period between each application. Similar to the above, each cell was exposed to a 10-point concentration range, with the dose-response curve best fit with a dual Hill equation. Using this approach, average EC50 values of 4.9 µM for HS α4β2 receptors and 46.9 µM for LS α4β2 receptors were obtained (n = 21).
Figure 2C shows the average of two experiments performed using the IonWorks Barracuda to determine the concentration-response curve for ACh activation of α4β2 receptors. The Barracuda platform offers the highest available throughput in that 384 individual recordings can be obtained in one experiment. For each run, a 384 well plate was loaded so that each concentration of a 10-point concentration range was tested in 32 wells. During individual runs on the Barracuda platform, some wells are excluded from analysis (see the Methods for exclusion criteria); therefore, the normalized responses from each concentration in Figure 1C represent the average of 60 to 64 wells (the sum of two experiments), with each well representing the average of a possible 64 cells using the PPC method. The maximum number of cells tested for each concentration of ACh per experiment was therefore 2048 (30 wells, 64 cells per well). For each experiment, wells were exposed to varying concentrations of ACh without a washout period. The average EC50 values for both runs were 1.3 µM for HS α4β2 receptors and 75.3 µM for LS α4β2 receptors, with the error bars in Figure 2C representing the variability between the two runs.
Similar methods were used to obtain ACh-elicited responses from α3β4 receptors as described for α4β2 receptors across all three platforms. For α3β4 receptors, concentration-response plots were best fit with a single Hill equation ( Fig. 3 ), resulting in EC50 values of 28.4 µM, 22.7 µM, and 18.6 µM obtained with the DynaFlow, PatchXpress, and Barracuda systems, respectively.
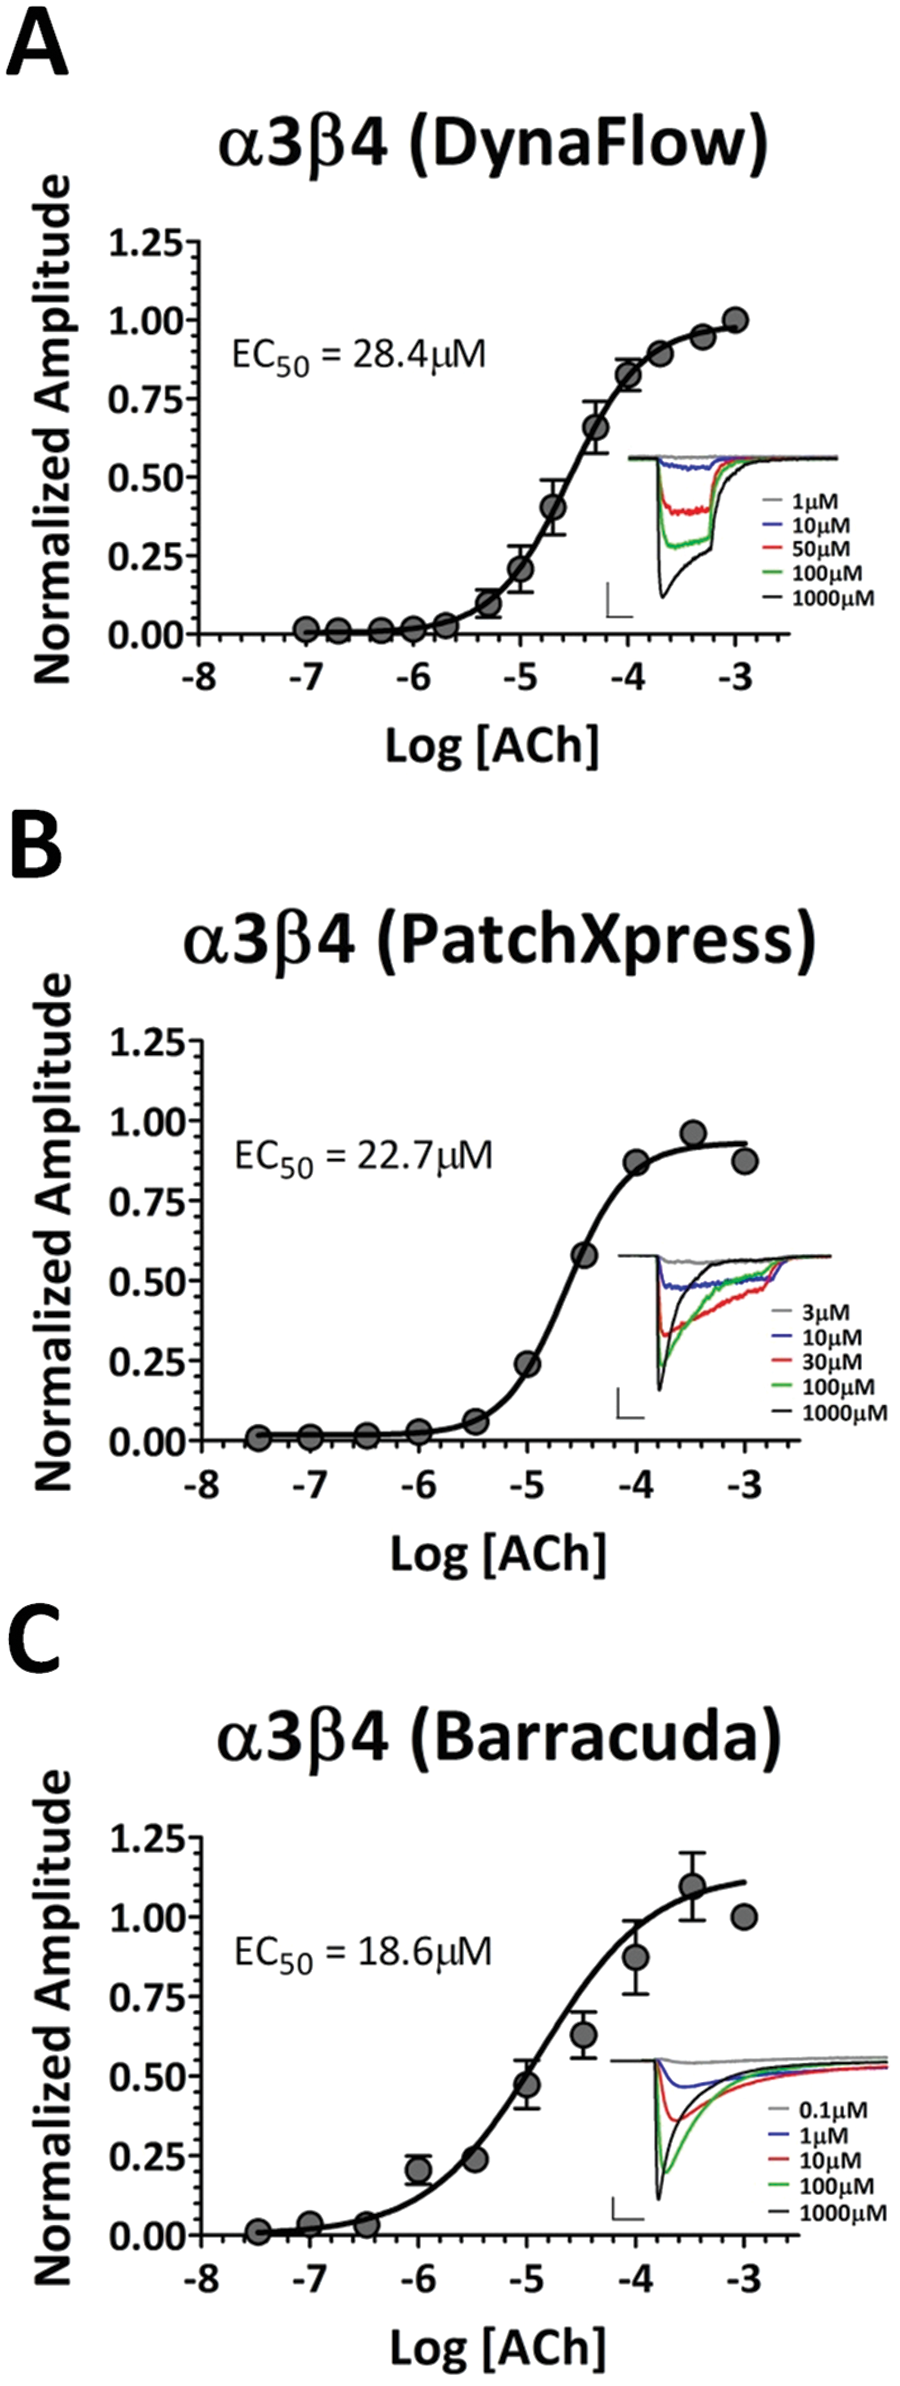
Concentration-response curves for acetylcholine (ACh) activation of α3β4 receptors. (
These results demonstrate that the obtained concentration-response curves were consistent across all three platforms, indicating relatively little variability from responses regardless of method (manual versus automated) or membrane seal quality and cell access (>1 GΩ seals and whole-cell access of individual cells for Dynaflow and PatchXpress platforms; >20 MΩ seals and perforated patch access of cell populations for the Barracuda system). In addition, these experiments validate the use of the IonWorks Barracuda system for high-throughput electrophysiology-based agonist assays for α4β2 and α3β4 nicotinic receptors.
Competitive Inhibition of α4β2 Receptors with DHβE
In addition to validating the use of the IonWorks Barracuda platform for determining EC50 values of potential agonists, we performed inhibition experiments with the Barracuda on α4β2 and α3β4 receptor-mediated currents using the β2-selective competitive antagonist DHβE. Figure 4A shows the concentration-response curve for DHβE in the presence of 10 µM ACh for α4β2 receptors obtained from manual recordings using the DynaFlow platform. Here, cells expressing α4β2 receptors were pre-exposed for 1 s to various concentrations of DHβE, followed by a 1 s coexposure of DHβE and 10 µM ACh. Responses were normalized to currents elicited with 10 µM ACh alone. The dose-response values were then fit with a single Hill equation to yield an IC50 of 79 nM. Figure 4B shows the concentration-response curves for DHβE in the presence of 30 µM ACh for α4β2 receptors using the Barracuda system. Coapplication of varying concentrations of DHβE and 30 µM ACh produced a concentration-response curve from the peak amplitude measurements with an IC50 of 623 nM. In addition, the decay constant for all responses was determined by fitting a single exponential decay function to each evoked current and normalized to the average decay constant produced by 30 µM ACh. This analysis resulted in a concentration-response curve from the measured decay constants with an IC50 of 154 nM ( Fig. 4C ). This difference between the IC50 for the peak amplitude and the IC50 for the decay constant was relatively small (~fourfold), indicating a similar potency of DHβE inhibition on both the peak amplitude and decay of α4β2 receptor-mediated currents.
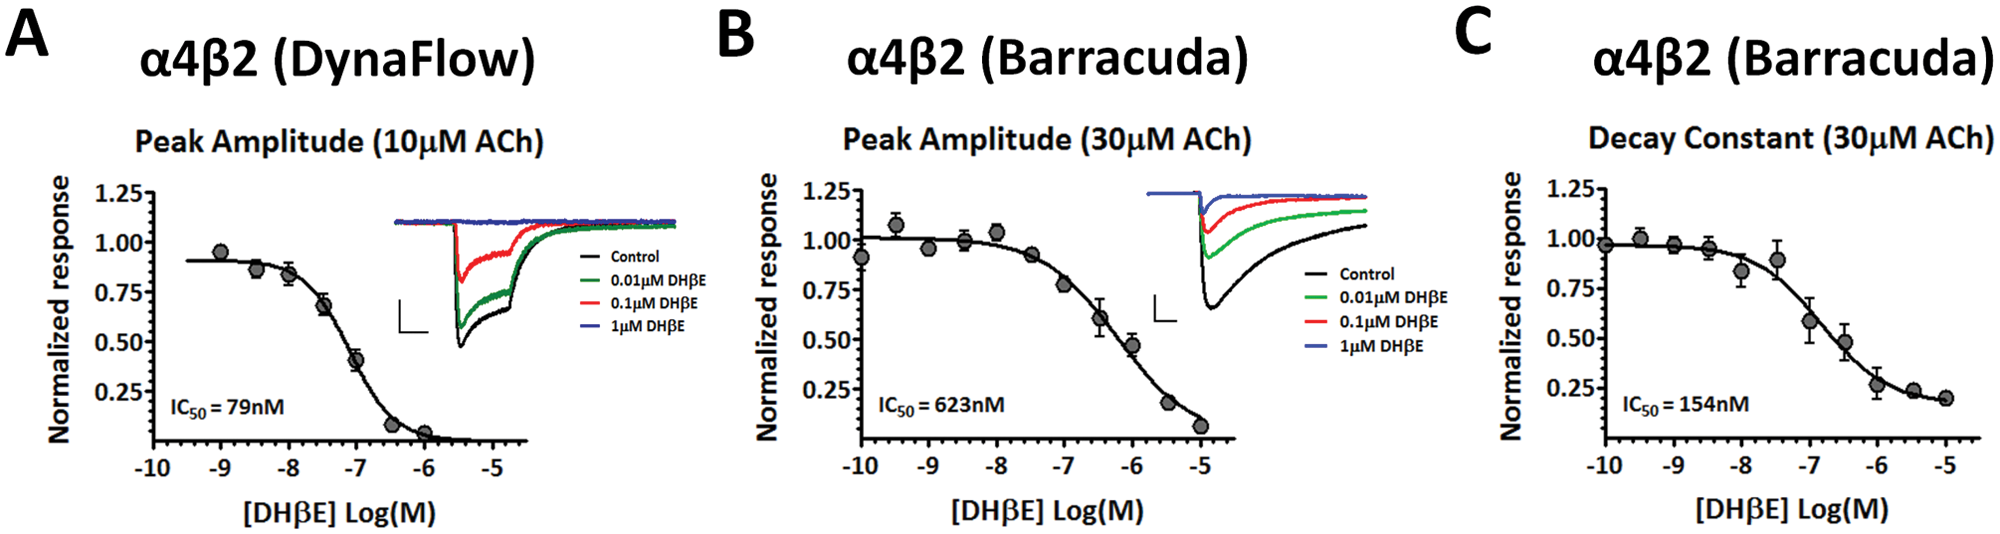
Inhibition of α4β2 receptor-mediated currents with DHβE. (
Similar experiments with DHβE were also performed with α3β4 receptors using the Barracuda platform. As expected, the β2-selective antagonist had no effect on α3β4-mediated currents up to 1 µM (data not shown), which is in line with previously published data.19,20
Although a similar concentration-dependent inhibition of α4β2 receptor-mediated currents was seen between manual and automated platforms, the IC50 values for DHβE inhibition varied more as compared with the EC50 values for ACh. This is most likely due to the method of antagonist exposure, with DHβE being preapplied during manual recordings and coapplied with ACh during experiments using the Barracuda platform, as well as the different test concentrations of ACh used. Previous data published from our lab on the DHβE inhibition of α4β2 receptors using the automated PatchXpress platform also showed a rightward shift in the concentration-response curve as compared with manual recordings, which was also most likely due to a coapplication rather than a preapplication procedure. 8 Nevertheless, the consistent concentration-dependent inhibition of α4β2 responses, along with the absence of DHβE inhibition of α3β4 responses, supports the use of high-throughput electrophysiology for screening competitive antagonists of nicotinic receptors.
Uncompetitive Inhibition of α4β2 and α3β4 Receptors with Mecamylamine
Previous studies demonstrating the uncompetitive inhibition of NNRs with the open channel blocker mecamylamine did so by showing a progressive inhibition over the course of multiple repeat agonist applications.11,21 This use-dependent block of NNRs therefore became greater with reoccurring receptor activation, meaning as the amount of mecamylamine exposure during the channel’s open state increased, the probability for mecamylamine to enter the open pore and block the channel also increased. We used the DynaFlow platform to perform similar experiments, in which 10 µM ACh was repeatedly applied to α4β2 receptors before, during, and after the addition of different concentrations of mecamylamine. As can be seen in Figure 5A , repeated coapplications of 10 µM ACh and mecamylamine resulted in a progressive increase in current inhibition, and this effect was concentration dependent. We next plotted concentration-response curves for responses from the 1st and 10th application of ACh in the presence of mecamylamine ( Fig. 5B ). This type of approach has been carried out to differentiate between IC50 values for the resting block and open channel block of sodium channels. 22 The IC50 value for the resting block of α4β2 receptors (first application) showed a relatively low potency inhibition (15 µM), whereas the inhibition curve for the open channel block of α4β2 receptors was greatly shifted to the left (IC50 = 787 nM). This higher potency inhibition during repeated receptor activation is in agreement with previously published results. 21
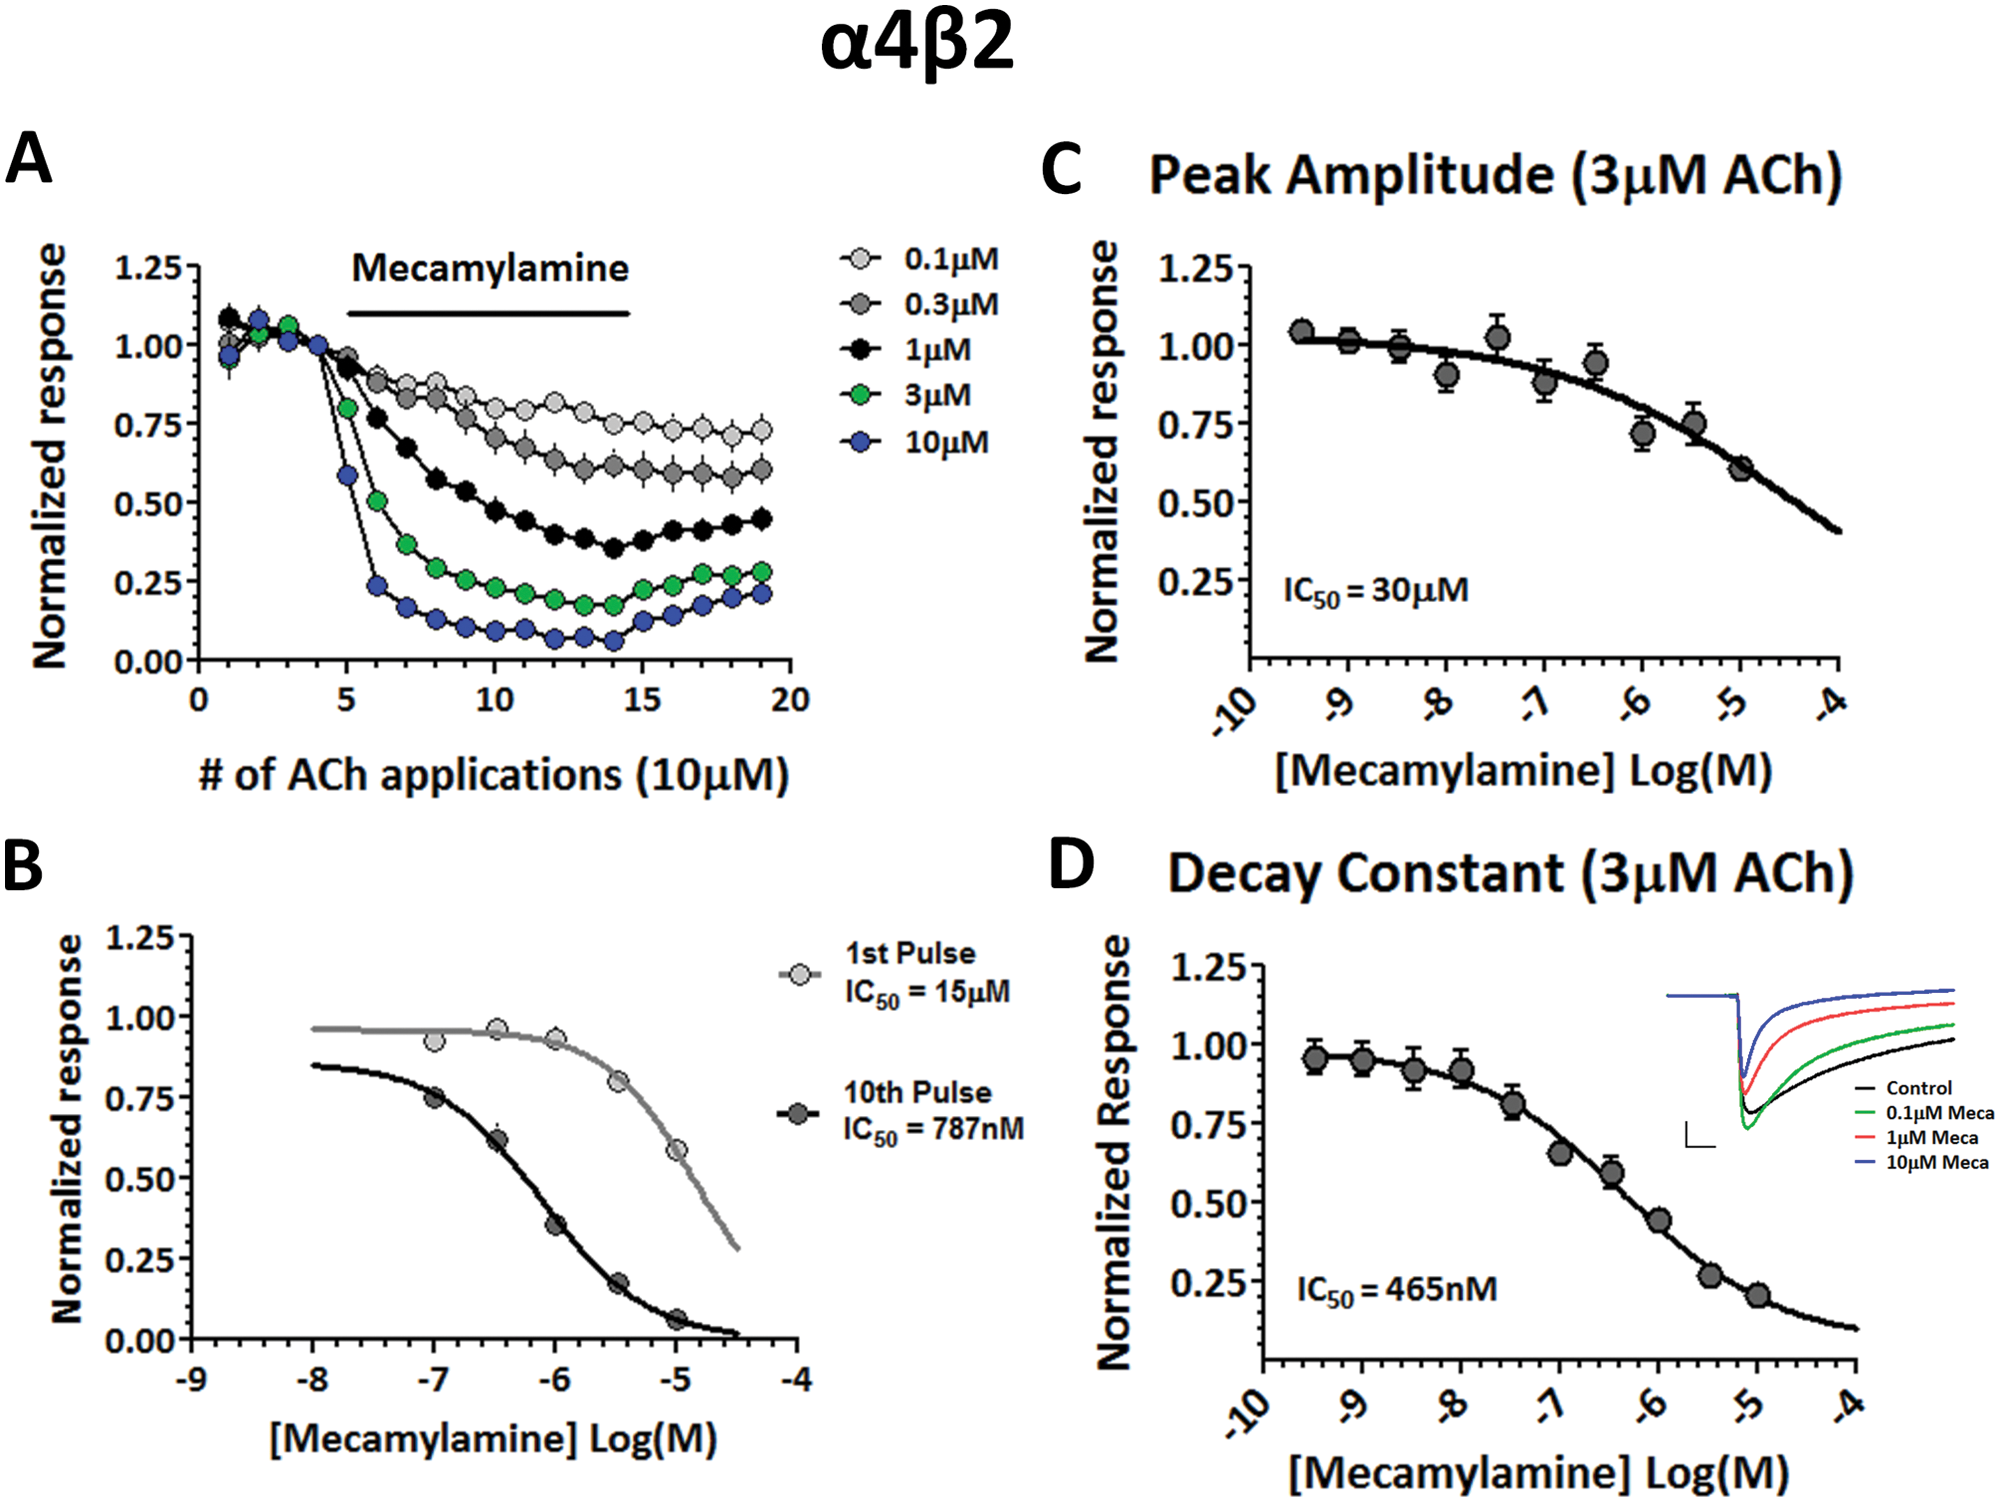
Open channel block of α4β2 receptors with mecamylamine. (
Because compounds in vivo maintain a certain concentration that is dependent on their pharmacokinetics, and a greater number of channel openings can occur at high frequencies, the more potent inhibition with mecamylamine seen during the 10th application of ACh likely reflects a more physiologically relevant concentration range. To determine a more pertinent IC50 for open channel blockers on a higher throughput scale, we used the automated IonWorks Barracuda platform. One limitation, however, is that the IonWorks Barracuda platform is unable to actively wash out compounds; therefore, repeated applications of ACh in the presence of mecamylamine is not possible. To overcome this, we measured both the peak current amplitude and the kinetics of the current decay during the continuous presence of varying concentrations of ACh and mecamylamine ( Fig. 5C , D ). ACh and mecamylamine were coapplied to α4β2 receptors, and the current response was recorded for 8 s in the presence of both compounds. Current decays were then fit with a single exponential function to determine the kinetics of the open channel block over the 8 s time period. Our hypothesis was that during constant activation of the α4β2 receptors, mecamylamine would have a greater chance of blocking the pore of the activated, open receptors, thereby increasing the extent of inhibition over the time of coapplication. Figure 5C shows that activation of α4β2 receptors with a nondesensitizing concentration of ACh (3 µM) during coapplications of increasing mecamylamine concentrations resulted in a modest inhibition of the peak current and a relatively low potency IC50 value of 30 µM. Figure 5D demonstrates that when a concentration-response curve for the normalized decay constants is plotted, a larger overall inhibition is seen, with a much higher potency IC50 value of 465 nM that is comparable with IC50 values obtained with the DynaFlow platform and closely matches previously published data. 21
In addition to assessing mecamylamine’s effect on α4β2 receptors using both manual and automated electrophysiology platforms, we tested mecamylamine’s ability to block α3β4 receptors as well. Figure 6 shows an experiment performed with the DynaFlow platform to determine the effect of applying varying concentrations of mecamylamine on repeated applications of 30 µM ACh to cells expressing α3β4 receptors. Similar to α4β2 receptors, the coapplication of mecamylamine resulted in a progressive inhibition of subsequent ACh applications, and this effect was again concentration dependent ( Fig. 6A ). We also plotted concentration-response curves for responses from the 1st and 10th application of ACh in the presence of mecamylamine to determine IC50 values for the resting and open channel block of α3β4 receptors, respectively ( Fig. 6B ). Also similar to α4β2, the open channel block was much more potent with an IC50 of 164 nM, as compared with the lower-affinity inhibition resulting from a resting block of the receptors (IC50 = 3.25 µM).
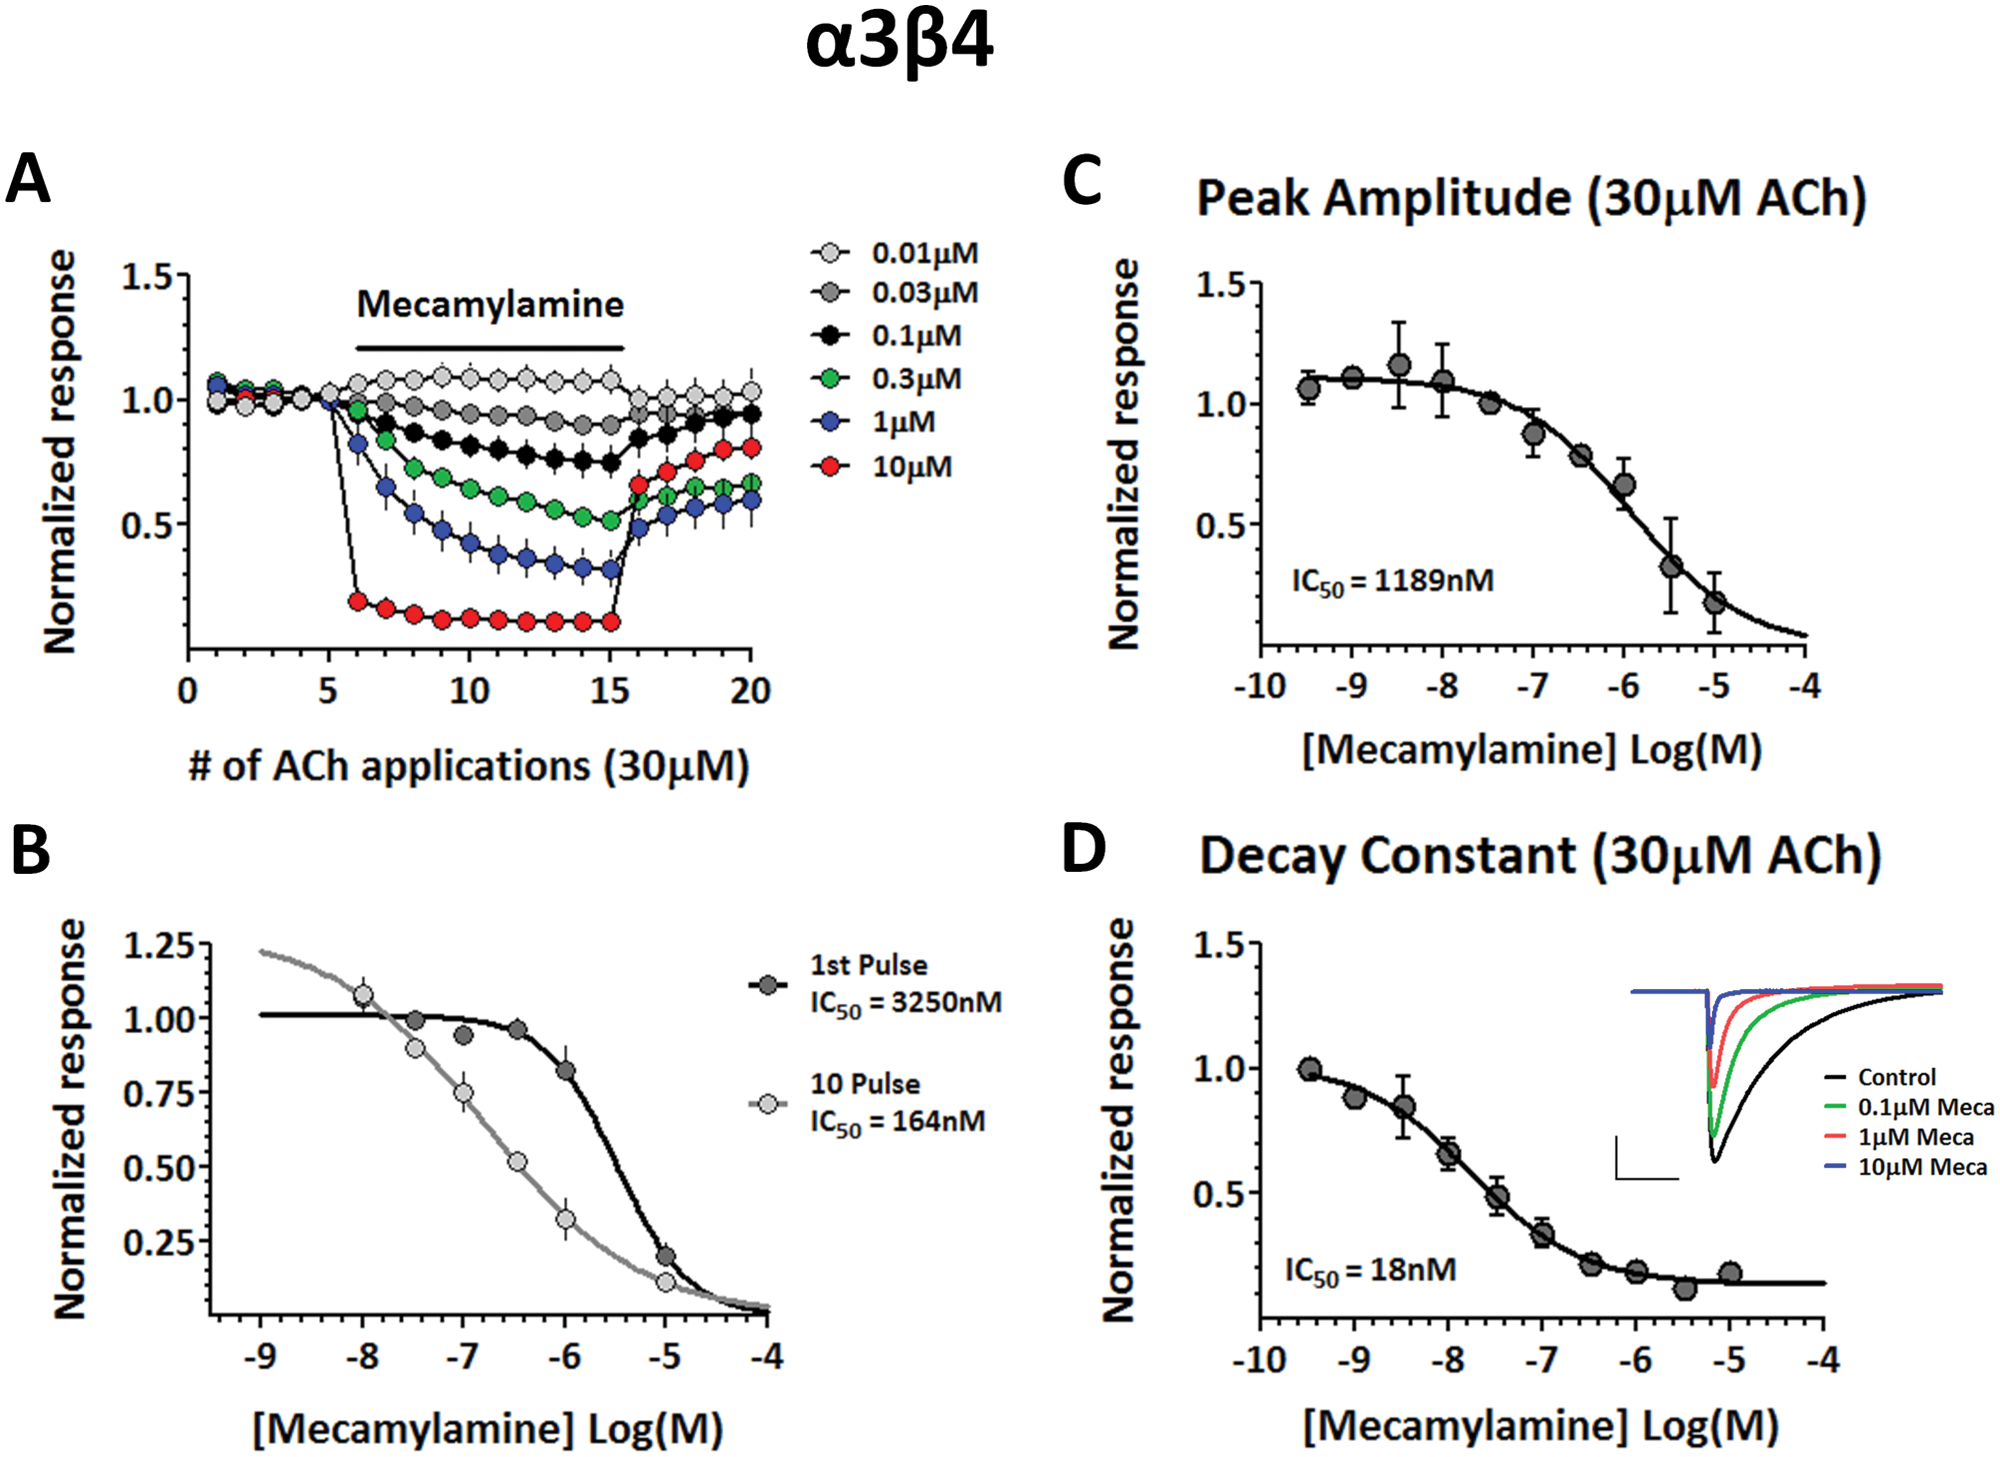
Open channel block of α3β4 receptors with mecamylamine. (
We then used the IonWorks Barracuda platform to perform similar experiments to those described above involving α4β2 on cells expressing α3β4 receptors. We determined the amplitude and current decay measurements elicited by coapplications of different concentrations of ACh and mecamylamine and compared them with the IC50 values obtained with manual patch-clamp recordings shown in Figure 6A , B . Similar to α4β2, inhibition by mecamylamine of α3β4-mediated responses was much more potent on the temporal component of the current, resulting in a much more potent inhibition of the current decay (IC50 = 18 nM), as compared with the peak current (IC50 = 1.2 µM). Also similar to α4β2, the IC50 value of the measured current decay for α3β4 receptors was more potent as compared with the IC50 determined for the open channel block obtained through manual recordings of repeated ACh applications (α4β2, DynaFlow: 787 nM, Barracuda: 465 nM; α3β4, DynaFlow: 164 nM, Barracuda: 18 nM). This shift to the left could be explained by the possibility of reaching a plateau level of inhibition when measuring mecamylamine’s effects on the current decay during its constant ACh exposure in the Barracuda system, as compared with the limited number of discrete, repeated ACh applications used during manual recordings that may not allow for this plateau inhibition to be reached for all concentrations of mecamylamine.
The differences between the IC50 for the peak amplitude and the IC50 for the decay constant obtained with inhibition by mecamylamine were much larger in magnitude (~65-fold for both α4β2 and α3β4 receptors) as compared with the differences seen with the competitive antagonist DHβE shown in Figure 3 (fourfold). This indicates that in contrast to DHβE, the uncompetitive antagonist mecamylamine had a much more potent inhibitory effect on the kinetics of the aggregated current response as compared with the peak amplitude.
These results validate the utility of the Barracuda system for high-throughput electrophysiology screening of nicotinic antagonists, as well as suggest the potential use of the additional analysis of current kinetics as a way to discriminate between competitive and uncompetitive antagonists.
Discussion
In this article, we demonstrate, for the first time, the utility of a high-throughput electrophysiology planar electrode–based system to produce reliable measurements of both nicotinic agonists and antagonists by comparing measurements across three different electrophysiology platforms: Dynaflow (manual electrophysiology), PatchXpress (medium-throughput automated electrophysiology), and IonWorks Barracuda (high-throughput automated electrophysiology). In addition, through the use of a custom-written MATLAB function to obtain additional current metrics, we suggest a potential method for differentiating between competitive and uncompetitive antagonists by comparing the relative potency of the antagonist to inhibit the peak current amplitude versus its ability to alter the kinetics of the aggregated current response.
In this study, we measured ACh-evoked responses from α3β4 and α4β2 receptors that showed dose-response relationships which were best fit with either a single or double Hill equation, respectively, and yielded EC50 values that were consistent between manual patch clamp (DynaFlow) and the automated PatchXpress 7000A and IonWorks Barracuda platforms. Despite the differences between seal quality and access between the three platforms, the EC50 values were very comparable, suggesting that EC50 values obtained for novel compounds from the Barracuda system would represent a fairly accurate measure for primary screening. A similar conclusion could be made for the high-throughput screening of competitive antagonists. Although the IC50 values for the known β2-selective competitive antagonist DHβE were not as consistent across the three platforms, our data support the use of high-throughput electrophysiology for a first-pass identification of potential novel competitive antagonists.
In addition to validating the use of high-throughput electrophysiology for screening nicotinic agonists and antagonists, we also compared results from experiments using the uncompetitive antagonist mecamylamine obtained with the Barracuda to those obtained through manual recordings using the DynaFlow system. Uncompetitive inhibitors (open channel blockers) hold considerable promise as therapeutics for numerous clinical indications.10–12 The therapeutic use of uncompetitive inhibitors began to receive attention following the first report that described the NMDA receptor antagonist memantine’s clinically relevant mechanism of action as being an open channel blocker. 23 Chen and colleagues 23 showed that the clinical tolerability of an NMDA antagonist could be explained by its ability to block the receptor only when activated with a relatively fast off rate from the channel. These properties made memantine appealing because they allowed it to attenuate high- frequency pathological activity without affecting normal synaptic transmission. 24
Typically, there are two different ways to measure inhibition via open channel block: (1) resting block (classical) and (2) use-dependent block after reoccurring stimulation.11,21 A resting block of receptors represent the most common and widely accepted way to measure inhibition of receptor function by determining the degree of inhibition following a single coapplication of agonist and antagonist, thus neglecting a potential time and/or use dependence of inhibition. It could be speculated that this type of measurement does not adequately represent physiologically relevant concentrations for the use-dependent action of open channel blockers because the presence of the compound in the brain (hours) would substantially exceed the time of a single agonist exposure (milliseconds). Both spontaneous openings and repeated receptor activation through endogenous transmitter release would create an environment in which open channel blockers would have long-lived, intermittent access to multiple channel openings. Therefore, different approaches were needed to characterize open channels blockers that are more relevant to physiological conditions.
To address this use-dependent mechanism of action for open channel blockers, an approach of reoccurring receptor activation in the presence of a single concentration of antagonist was described.11,21 This approach suggests that the first coapplication of agonist and open channel blocker would inhibit a only small proportion of channels, with subsequent coapplications leading to additional and therefore overall increasing inhibition of the whole-cell response. The existence of this use-dependent type of inhibition has been confirmed for both NNRs and NMDA receptors11,25 using manual patch clamp techniques and represents a more accurate depiction of the action of uncompetitive antagonists. However, these types of manual recordings are both time and labor intensive and are therefore not amenable to higher-throughput screening assays.
A third approach that we suggest in this report for measuring use-dependent inhibition is based on the notion that open channel blockers produce changes in the kinetics of the whole-cell response as well as the amplitude. 26 Because whole-cell currents are the sum of several single-channel openings, and responses obtained with the Barracuda using PPC methods are a sum of up to 64 individual cells, aggregate nicotinic receptor currents elicited by a continuous exposure to ACh would represent the sum of thousands of events consisting of multiple, repeat channel openings. Coapplication of an open channel blocker would therefore result in a larger, cumulative current inhibition over time, which would be represented by increased inhibition during the decay of the whole-cell response. This claim is supported by the IC50 values calculated by analyzing the decay kinetics of the responses being significantly more potent than the IC50 values obtained by measuring the peak amplitude of the responses. These more potent IC50 values closely match plasma concentrations for therapeutic doses of mecamylamine used for central nervous system indications 27 and therefore may represent a better measure of functional inhibition for uncompetitive inhibitors during compound screening. One disadvantage should be considered in using this approach. It may be speculated that this measure would be accurate only for compounds that have been demonstrated to have no activity at the orthosteric binding site of the receptor, because some of the measured inhibition could be mediated by desensitization of the receptor.
To summarize our present work, we have reported the use of a high-throughput electrophysiology-based platform for assessing the effects of ACh and 2 antagonists on both α4β2 and α3β4 nicotinic receptors. We found consistent concentration-dependent responses across three electrophysiology platforms that support the use of the high-throughput PPC platforms for the screening of novel nicotinic compounds. In addition, we propose that the Barracuda system can also be reliably used for higher-throughput screening of LGIC uncompetitive inhibitors that become more effective during periods of repeated channel activation. The IC50 values calculated from the more potent inhibition of the current decay would then represent more physiologically relevant concentrations that could be used to inform dosing parameters for future behavioral experiments.
Footnotes
Acknowledgements
Dynaflow is a registered trademark of Cellectricon AB. PatchXpress 7000A and IonWorks Barracuda are registered trademarks of Molecular Devices, Inc.
Abbreviations
ACh, acetylcholine; DHβE, dihydro-beta-erythroidine; LGIC, ligand-gated ion channel; NMDA, N-methyl-D-aspartic acid; NNR, neuronal nicotinic receptors.
Declaration of Conflicting Interests
The authors declared no potential conflicts of interest with respect to the research, authorship, and/or publication of this article.
Funding
The authors received no financial support for the research, authorship, and/or publication of this article.