
Abstract
The authors conducted a high-throughput screening campaign for inhibitors of SV40 large T antigen ATPase activity to identify candidate antivirals that target the replication of polyomaviruses. The primary assay was adapted to 1536-well microplates and used to screen the National Institutes of Health Molecular Libraries Probe Centers Network library of 306 015 compounds. The primary screen had an Z value of ~0.68, signal/background = 3, and a high (5%) DMSO tolerance. Two counterscreens and two secondary assays were used to prioritize hits by EC50, cytotoxicity, target specificity, and off-target effects. Hits that inhibited ATPase activity by >44% in the primary screen were tested in dose–response efficacy and eukaryotic cytotoxicity assays. After evaluation of hit cytotoxicity, drug likeness, promiscuity, and target specificity, three compounds were chosen for chemical optimization. Chemical optimization identified a class of bisphenols as the most effective biochemical inhibitors. Bisphenol A inhibited SV40 large T antigen ATPase activity with an IC50 of 41 µM in the primary assay and 6.2 µM in a cytoprotection assay. This compound class is suitable as probes for biochemical investigation of large T antigen ATPase activity, but because of their cytotoxicity, further optimization is necessary for their use in studying polyomavirus replication in vivo.
Introduction
Polyomaviruses (PyVs) are nonenveloped viruses with double-stranded DNA genomes that can transform cells and promote tumor formation. Nine PyVs are known to infect humans; in addition, one nonhuman primate PyV, Simian Virus 40 (SV40), was unknowingly introduced into the population as a contaminant of the original polio vaccine. Approximately 50% to 80% of humans are seropositive for one of these viruses. 1
SV40, a well-characterized model for examining the mechanisms of cell growth control and cancer, induces tumors in rodents; current evidence suggests that SV40 is not tumorigenic in humans. 1 SV40 is closely related to two other PyVs (JC and BK viruses) that can infect humans, resulting in morbidity and mortality in immunocompromised patients. JC virus is neurotropic and causes progressive multifocal leukoencephalopathy, a demyelinating disease of the central nervous system with high mortality. A role for JC virus in gastrointestinal malignancies has also been suggested recently. 2 BK virus establishes a lifelong persistent infection in kidney epithelial cells, and reactivation within these cells results in a lytic infection in immunocompromised patients. BK virus is also urotheliotropic and causes interstitial nephritis, known as BK- or PyV-associated nephropathy, which is associated with high graft loss if not recognized and treated early. 3
All PyVs encode a viral protein, the large T antigen (TAg), which is essential for viral replication. TAg is a multidomain protein transcribed early after infection and contains an N-terminal J-domain, the central Origin Binding Domain, and the C-terminal helicase domain. TAg forms a double hexamer that uses host cellular protein factors to coordinate bidirectional DNA replication 4 in addition to binding to and inactivating p53 and the retinoblastoma tumor suppressor family of proteins. In 1997, it was reported that TAg encodes a functional J-domain chaperone. 5 The N-terminal J-domain, which stimulates the ATPase activity of the Hsp70 chaperone, is essential for both virion assembly and disruption of retinoblastoma binding, and mutations that compromise adenosine triphosphate (ATP)–dependent chaperone function block viral replication and cellular transformation. Last, the oncogenic potential of SV40, JC, and BK viruses can be recapitulated by TAg alone. 6
SV40 TAg mutants that lack ATPase activity cannot replicate. ATP binding to the TAg ATPase domain stimulates TAg hexamerization and dodecamer assembly, which partially melts the viral DNA and promotes association with proteins required for replication. 7 TAg is also an ATP-dependent helicase, which obligatorily facilitates the unwinding of DNA during viral replication. 8 Mutations that reduce TAg’s endogenous ATPase activity also block viral replication. 9
TAg is conserved among polyomviruses, 9 and inhibitors of TAg may also be effective across the PyV family. Recent efforts used in vitro assays that measured inhibition of TAg-mediated p53 interactions 10 and TAg-mediated ATP hydrolysis 7 and led to the identification of new TAg inhibitors. However, these inhibitors exhibit low potency and/or low specificity and are not amenable to chemical optimization strategies. Therefore, the isolation of novel TAg inhibitors with unique chemical scaffolds is vital, given the recent correlation of new PyVs with diseases, 11 the expansion of susceptible immunosuppressed populations worldwide, and documented increases in PyV-associated diseases. 12
To this end, we have successfully performed a high-throughput screen for novel PyV inhibitors. A biochemical, fluorescence intensity assay in a 1536-well microplate format was developed to measure TAg ATPase activity in the presence of potentially inhibitory small-molecule compounds from the National Institutes of Health (NIH) Molecular Libraries Probe Centers Network (MLPCN) compound collection. Counterscreens for hit toxicity, assay interference, and secondary assays used quantitative, established techniques for target validation and allowed for prioritization of primary screen “hits” based on IC50, cytotoxicity, and target specificity. Three small molecules that inhibited the ATPase activity of TAg were identified, and one of these interfered with the replication of SV40 in infected cells. Further chemical optimization derived a fourth effective biochemical inhibitor of TAg ATPase activity (bisphenol A), but the use of this inhibitor for in vitro or in vivo investigations is complicated by its cytotoxicity.
Materials and Methods
Recombinant TAg expression and purification
TAg was purified as previously described 13 and stored at –80 °C until use.
Assay validation conditions
The early validation assays were conducted in 384-well black, clear-bottom microplates (#3712; Corning, Inc., Corning, NY). Assay buffer was 100 mM Tris-HCl, 20 mM KCl, 6 mM MgCl2, and 0.1 mg/mL bovine serum albumin (BSA), pH 7.4. Then, 5 µL of test compound (20 µM final concentration, as described below) in 5% DMSO/assay buffer was added to the respective plate wells, and 15 µL of TAg (14.4 ng/µL, 216 ng total) in assay buffer was added to each well and allowed to incubate for 30 min at ambient temperature. Following incubation, 5 µL of 5 mM ATP (A7699; Sigma-Aldrich, St. Louis, MO) in assay buffer was added to the respective wells and incubated for 120 min at ambient temperature. Total reaction volume (without endpoint reagent) was 25 µL. Commercially available kits (e.g., Malachite Green Phosphate Assay Kit, POMG-25H [BioAssay Systems, Hayward, CA] and the ADPHunter-Plus Kit [DiscoverX, Freemont, CA]) were used according to the manufacturer’s instructions. Enzyme and buffer volumes were dispensed using a WellMate (Matrix, Hudson, NH). Compounds were dispensed manually. The final DMSO concentration was 1.0%.
Pilot and primary assay conditions
The assay was conducted in 1536-well black, clear-bottom microplates (#3891; Corning, Inc.) and was used for the pilot, primary screens, and the confirmatory evaluation of hits. Initially, 250 nL of test compound (single dose, 20 µM final concentration, as described below) in 5% DMSO/assay buffer (indicated above) was added to the respective plate wells. A total of 750 nL of TAg (14.4 ng/µL, 10.8 ng total) in assay buffer was added to each well and incubated for 30 min at ambient temperature. Following incubation, 250 nL of 5 mM ATP in assay buffer was added to the respective wells and incubated for 120 min at ambient temperature. Total reaction volume (without endpoint reagent) was 1.25 µL. Reagents were dispensed using a BioRAPTR FRD (Beckman Coulter, Fullerton, CA). Compounds were dispensed using an Echo 500 Series Liquid Handler (Labcyte, Sunnyvale, CA). Final DMSO concentration was 1.0%.
Endpoint readings
The endpoint method was by fluorescence detection using the ADP Hunter Kit 14 and the manufacturer’s instructions. The plates were bottom-read using an EnVision plate reader (PerkinElmer, Waltham, MA) with excitation/emission at 530/590 nm, respectively.
Controls and compound addition
The positive control (MAL2-11B) was diluted in 5% DMSO/assay media and added to the control wells of each plate (250 nL at 5× concentration, for a final reaction concentration of 100 µM) before the addition of TAg. Additional controls included full reaction wells (containing TAg, DMSO blank, and ATP) and background wells (containing assay buffer, DMSO blank, and TAg) on each plate. DMSO concentration was 1% for all plate wells.
Counterscreens
In each assay, compounds were added in dose–response format.
Cytotoxicity
This assay was in a 384-well plate format and used Madin-Darby canine kidney (MDCK) cells. The cytotoxicity assay was conducted for 72 h, after which cell viability was determined using Cell-Titer Glo (Promega, Madison, WI). 15
Assay interference
This counterscreen was performed using the primary assay method (above) but without TAg (buffer only). A final concentration of 10 µM adenosine diphosphate (ADP) was used instead of ATP, and the assay was read 10 min following the addition of the endpoint reagents.
DNA replication assays
DNA replication assays, using a reporter plasmid that contained the SV40 origin of replication, were performed as previously described. 7
Cell culture
MDCK cells (CCL-34, passage 55; American Type Culture Collection [ATCC], Manassas, VA) and African green monkey kidney cells (BSC-40, CRL-2761; ATCC) were used for the cytoprotection and viral load reduction assays. Cells were cultured in Dulbecco’s modified Eagle’s medium (DMEM) with 2 mM L-glutamine, 1× penicillin/streptomycin, and 10% fetal bovine serum (FBS) and maintained at 37 °C, 5.0% CO2 to 90% confluence before use.
Cytoprotection assays
BSC-40 cells in DMEM/10% FBS with 4 mM L-glut (assay media) were plated in 96-well microplates at 15 000 cells/well. After 18 h, test compounds were diluted in doses to a final well concentration in the range of 200 to 1.6 µM, added to the cells, and incubated for 30 min. Afterward, 100 TCLD50s (50% tissue culture lethal dose, the virus stock dilution that causes cell death in 50% of the cells at endpoint) of SV40 virus were added to each well. Cell viability was determined after 120 h using Cell-Titer Glo (Promega).
Compound handling for the high-throughput screening effort
The NIH MLPCN compound library was used for the primary high-throughput screening (HTS). Compounds (stored in 100% DMSO) were diluted into assay media by automation and added to the plates. The final compound concentration used in primary, single-dose screening was 20 µM.
Data acquisition and analysis
Ninety-six full-reaction wells, 96 background wells, and 64 control drug wells per plate were used to calculate the Z value 16 for each plate and to normalize the data on a per plate basis. Results for each concentration were expressed as percent inhibition (% Inhibition), which was calculated as follows: 100*[(Median Enzyme Control – High-Dose Control Drug) – (Test Well – High-Dose Control Drug)]/(Median Enzyme Control – High-Dose Control Drug). The dose–response data were analyzed using the following XLFit software equation: 205 (y = A + [(B – A)]/{1 + [(C/x)D]}, where A is the percent inhibition at the lowest inhibitor concentration, B is the percent inhibition at the highest inhibitor concentration, C is the inhibitor concentration at the middle of the curve, and D is the slope of the curve. A and B were locked at 0 and 100, respectively. From these curves, IC50 values were calculated for TAg, and CC50 values were calculated for MDCK cell cytotoxicity. A therapeutic index (SI) for compounds showing TAg inhibition was calculated as SI = CC50/EC50. Raw data were imported to Activity Base Data Management software (IDBS, Alameda, CA) for determination of Z, signal to background (S/B), signal to noise (S/N), and percent inhibition for assayed compounds. Compounds showing greater than 44% inhibition of TAg ATPase activity were considered hits. Statistical calculations were performed according to Zhang et al. 16 Each assay validation step was performed in triplicate with the exception of the pilot validation screens, which were performed in duplicate.
Compound acquisition and/or synthesis
Many of the compounds were obtained from commercial sources. Experimental details for synthetic compounds and sources for commercial compounds are provided as supplemental material. All compounds, regardless of source, were purified by silica gel chromatography and analyzed by liquid chromatography/mass spectrometry (LC/MS) and nuclear magnetic resonance (NMR).
Results
Primary assay development and validation
During assay development, we defined the optimum endpoint detection method (fluorescence) and time, DMSO tolerance, optimum enzyme concentration, equivalency to other established ATPase assays (e.g., in comparison to malachite green), 7 and efficacy of a positive control, MAL2-11B, 7 to inhibit the ATPase activity of TAg. We initially adapted the assay in a 384-well microplate format. This included quantification of HTS assay parameters (coefficient of variation [CV], S/B, S/N, and Z value) and characterization of the positive and negative control conditions, values, and compounds. The assay was linearly miniaturized into 1536-well microplates for validation. Validation included a survey of edge and liquid-handling effects, as well as reagent and read stability, and was completed by duplicate pilot screening of a 6390-compound library. Each development and validation step was performed in triplicate, unless otherwise noted.
Malachite green is used to determine the amount of free phosphate liberated as a product of TAg-mediated ATP–hydrolysis. This assay is based on the complex formed between malachite green molybdate and free orthophosphate under acidic conditions. The limiting reagent in screening a large library of compounds (>300 000) was the amount of purified TAg available for screening. Because the expression and purification of recombinant TAg were both economically and temporally costly, it was necessary to miniaturize the assay as much as possible while maximizing robustness and S/B. We performed a comparison of the malachite green assay and a commercially available product, the ADP Hunter kit, to measure inhibition of TAg-mediated ATPase activity. The ADP Hunter fluorescent signal is red-shifted, minimizing potential interference from fluorescent compounds, but has the caveat that compounds that inhibit the reagent enzyme cascade or are themselves inherently fluorescent will result in a false signal using ADP Hunter. We evaluated both assay methods for S/B, Z, control drug interference, read stability, sensitivity, and DMSO tolerance. We first compared the limits of detection (sensitivity) of both the malachite green and ADP Hunter assays. The limit of ADP detection for the ADP Hunter assay was twofold lower than that for free phosphate in the malachite green assay ( Fig. 1A ). The ratio of S/B values at 1 µM substrate was 2.04 for ADP Hunter and 1.06 for malachite green. The maximal S/B values were 19.3 (using 33 µM ADP with ADP Hunter) and 7.75 (using 100 µM phosphate with malachite green). This prompted us to choose the ADP Hunter endpoint methods for all subsequent validation experiments.
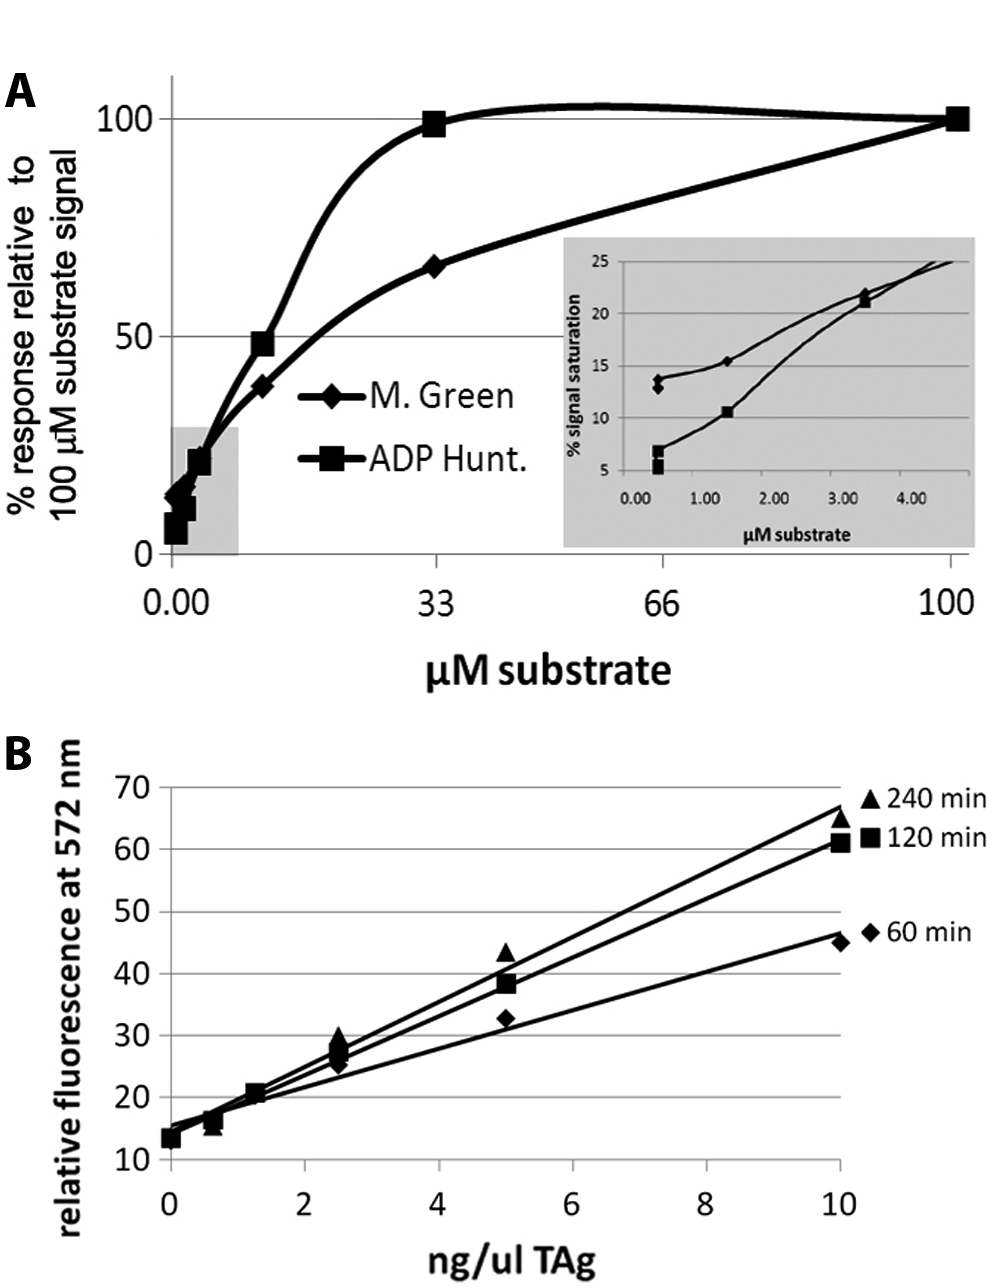
Comparison of assay sensitivity using the malachite green and adenosine diphosphate (ADP) Hunter endpoint methods. (
Sensitivity to DMSO was also determined. Compound libraries are generally stored in DMSO, which at higher concentrations (>1%) may dramatically affect enzymatic activity, cellular membrane permeability, 17 or viability. The assay tolerated DMSO concentrations up to 5% without detrimental effect. We standardized the assay to run in 1% DMSO for all subsequent experiments. In these conditions, the background value using ATP only (–TAg) accounts for contaminating ADP in the ATP stock and was 23% of the signal observed with the addition of TAg. Additional experiments using the control compound MAL2-11B (at a final concentration of 100 µM) 7 determined that DMSO did not interfere with the assay sensitivity, and MAL2-11B inhibited an average of 80% of TAg activity in these conditions, whereas the intensity of the background (ATP only) signal was unchanged, indicating that 100 µM MAL2-11B did not interfere with ADP detection (data not shown). We determined the optimum incubation time (120 min) and minimum TAg concentration (8.6 ng/µL) necessary to achieve an S/B >3. We also demonstrated that the TAg-dependent rate of ATP→ADP hydrolysis was constant over the assay period and directly proportional to the TAg concentration ( Fig. 1B ). 18 Last, as reported previously, 7 the TAg preparations used in this study contained the same contaminants as in a TAg preparation of mutant 5061. 19 The 5061 mutant lacks ATPase activity. Thus, the ATPase activity of wild-type TAg, as used here, is derived from the protein and not from contaminants in the preparation.
Pilot and primary screening
To complete our assay validation, we linearly reduced the well volume of the reaction for direct transference into a 1536-well microplate format and conducted a duplicate pilot screen of 6390 compounds at 20 µM. Table 1 lists the pilot screen data. It shows that 68% of the hits that decreased fluorescence in each pilot screen more than 19% (which was the S/N threshold) correlated with each other, indicating that the assay reliably identified potential ATPase inhibitors. Compound aggregation induced by the resulting hits, which might lead to false positives, was not an issue as each compound that emerged as a hit was examined in steady-state ATP assays, using a previously reported method. 20 These assays employ conditions that mirror those used in the screen but take place in a 20-µL reaction volume in which protein and/or compound precipitation can be readily detected. In fact, compound aggregation of MAL2-11B under these conditions was previously observed in the laboratory in these assays but only when used at a final concentration of >300 µM; however, in the current study, aggregation was not observed for any of the compounds that were confirmed as hits when used at the indicated, effective concentrations in vitro (data not shown).
Summary of the T Antigen ATPase High-Throughput Screening Assay Pilot Validation and Primary Screen
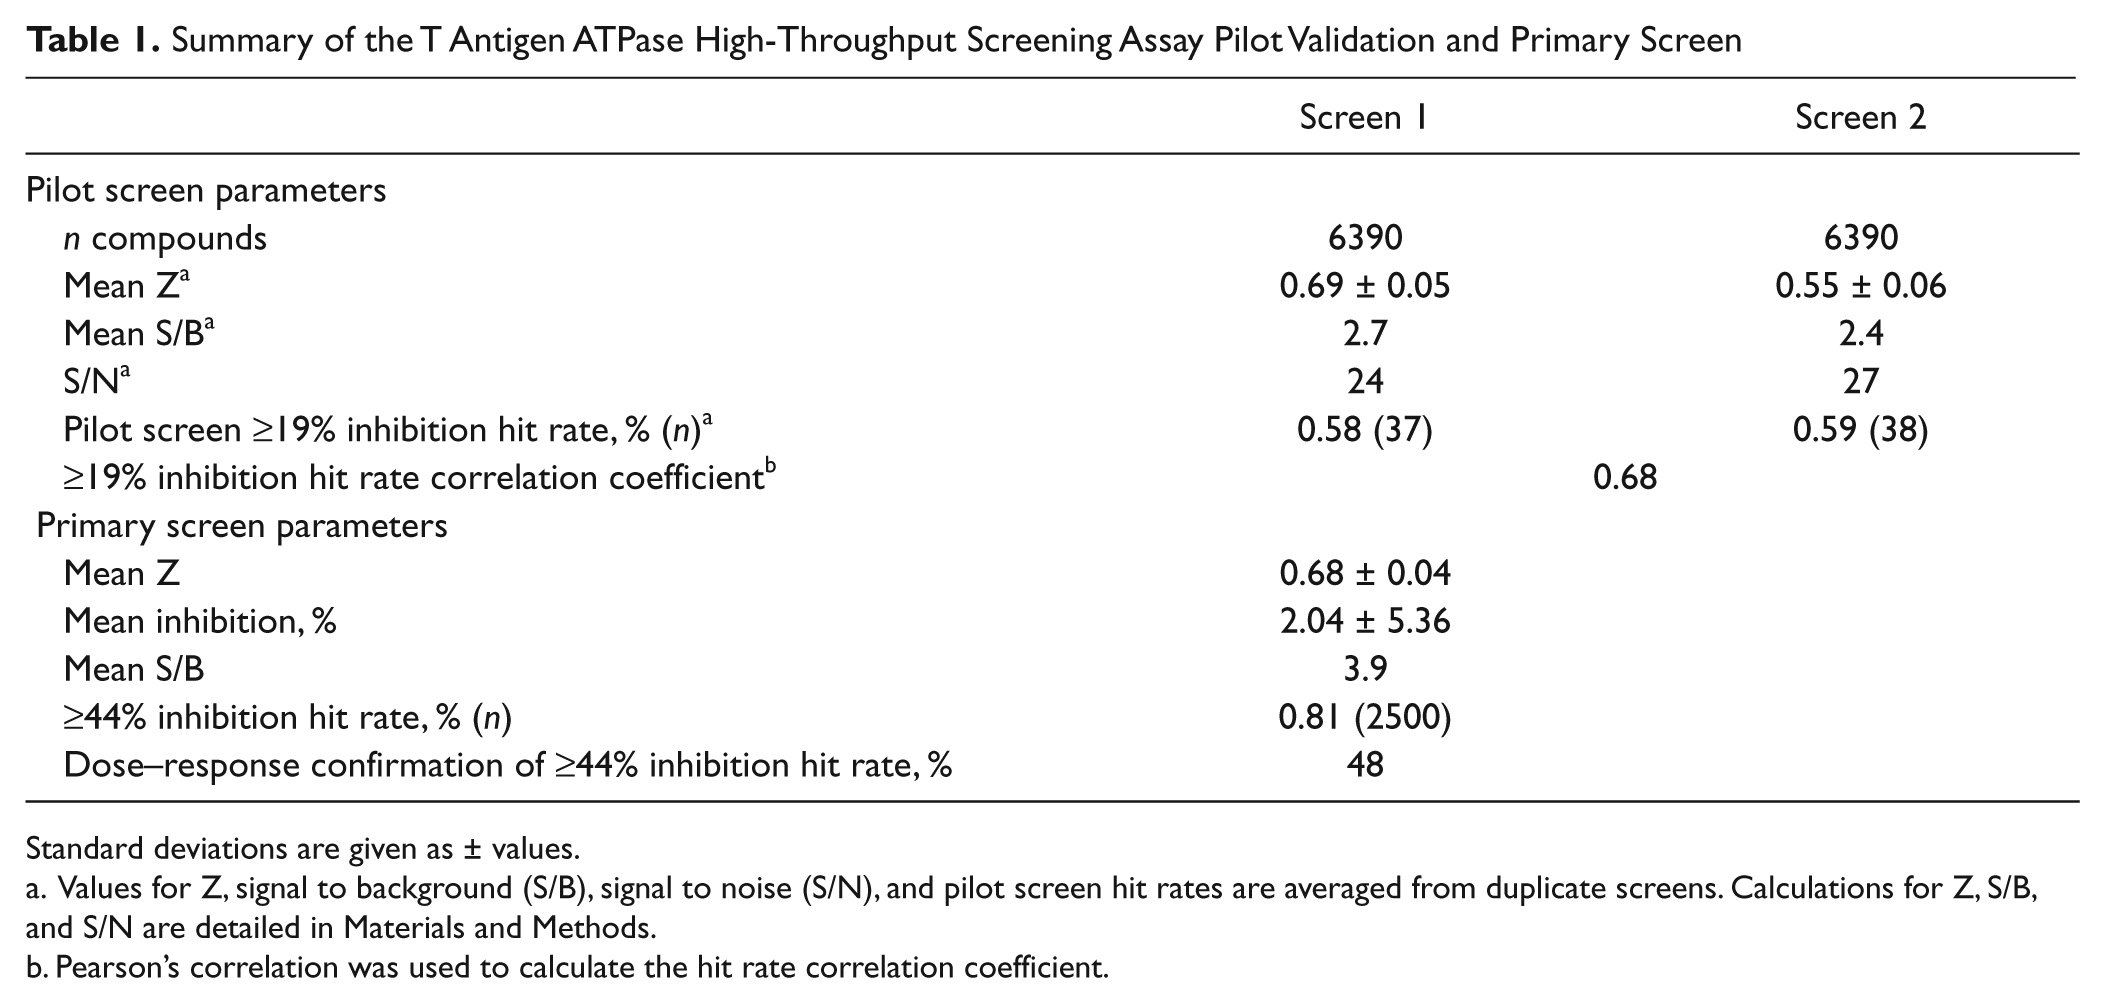
Standard deviations are given as ± values.
Values for Z, signal to background (S/B), signal to noise (S/N), and pilot screen hit rates are averaged from duplicate screens. Calculations for Z, S/B, and S/N are detailed in Materials and Methods.
Pearson’s correlation was used to calculate the hit rate correlation coefficient.
We then performed a full primary screen (in a single dose at 20 µM) of the NIH MLPCN compound collection (306 015 compounds). Primary screening data are summarized in Table 1 . Some differences in hit rate and S/B were observed between the pilot and primary screens, and this can be attributed to the differences in compound diversity in the chemical libraries used and differences in reagent preparations. In total, 2153 hits that inhibited ATPase activity by greater than 44% were available for confirmation. These were screened in dose response (from 100 µM to 0.16 µM) for assay interference, cytotoxicity, and ATPase inhibition. Assay interference counterscreening (using 10 µM ADP) was performed concurrently with the confirmatory assay to exclude compounds that inhibit the coupling enzymes in the assay kit. The interference assay was designed to work within the same signal range as the primary assay. ADP was titrated, and the concentration that gave the approximate TAg-mediated signal seen in the absence of inhibitory compounds was determined to be 10 µM. Compounds that inhibited the ADP signal in a dose-responsive manner (with an IC50 less than twofold of that observed with TAg and ATP) were excluded as false positives. Compounds that inhibited in the primary screen but had no effect in the counterscreen were considered active. Finally, a cytotoxicity screen in MDCK cells was performed, and compounds that had a CC50 less than twofold the TAg-inhibitory IC50 were excluded. Of the 2153 compounds tested, 104 reduced TAg-mediated fluorescence without assay interference or extreme toxicity. The primary assay IC50 values for these compounds ranged from <0.16 to 53 µM.
Assay hit characterization by secondary assays
In total, 104 confirmed hits were further restricted by their degree of drug-likeness. Compound promiscuity (the number of times hits were identified in other PubChem primary screens) was also surveyed, and compounds identified as hits in >20% of assays were excluded from further consideration, as were chemical scaffolds that were not amenable to medicinal chemistry. Three compounds ( Fig. 2 ) were selected for further evaluation using targeted, mechanistic secondary assays (detailed below). These compounds (PubChem SIDs 85281215, 85281217, and 85281218) were purchased from commercial sources, purified, and retested in the primary assay for confirmation of activity. The IC50s for the three ranged from 7 to 27 µM, whereas the control compound MAL2-11B had an IC50 of 19.5 µM ( Fig. 2 ). Huryn et al. 21 recently reported that the IC50 for MAL2-11B is 50 µM. The 2.5-fold difference reported here likely reflects the amount of ATP in the assays (1 mM), which may act as a secondary factor in triggering TAg polymerization 22 and thus affects ATPase activity.
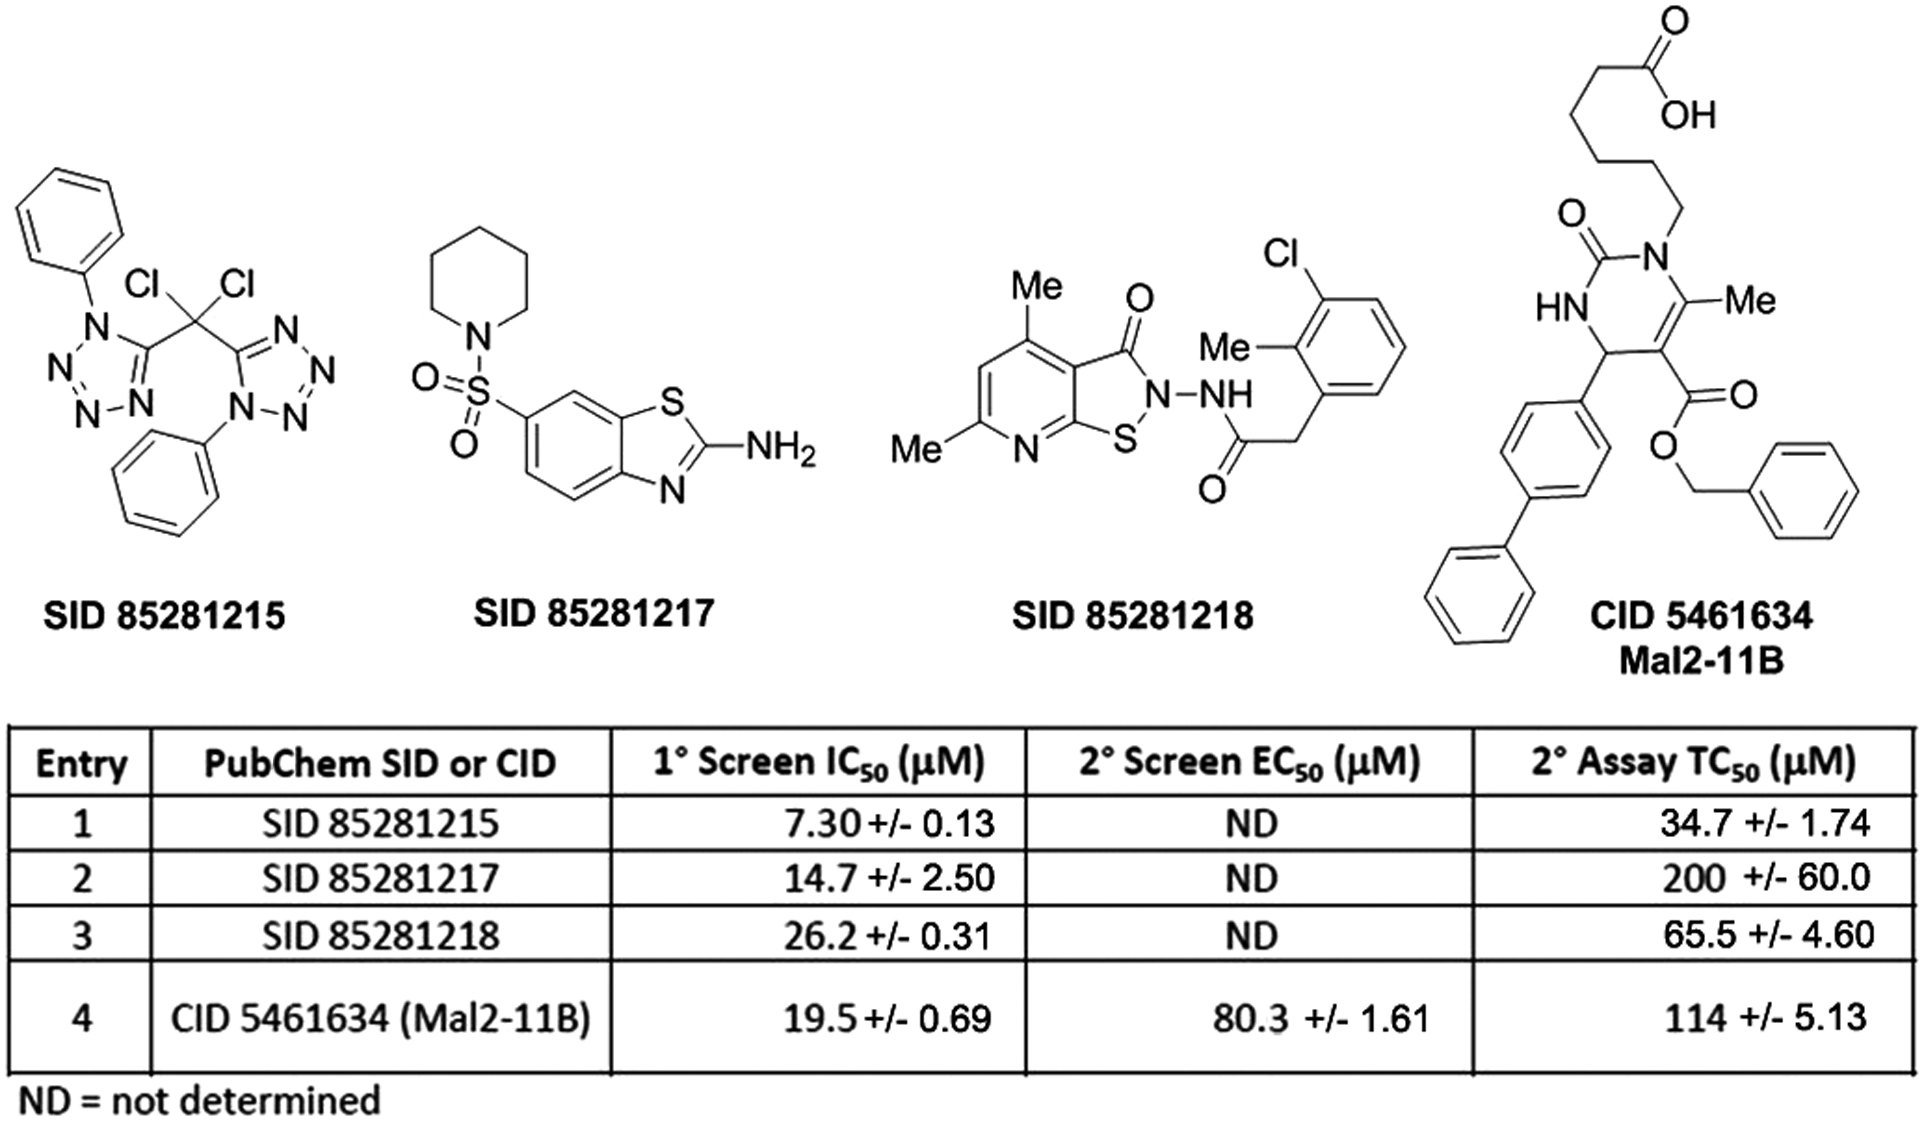
Compounds confirmed as active against SV40 T antigen (TAg) ATPase activity in a biochemical assay. Structures of confirmed hits and control compound MAL2-11B are depicted. The corresponding biochemical inhibitory concentrations (IC50), the cell-based effective concentrations (EC50), and the cytotoxic concentrations (TC50) are tabulated for each compound. ND, values were not determined because of high compound cytotoxicity.
To determine target specificity, we tested the three compounds in a biochemical assay for TAg-dependent DNA replication ( Fig. 3 ). In this assay, TAg recruits cellular machinery from supplied HeLa cell lysate to polymerize trace radioisotope-labeled nucleotides into replicating DNA over time. Each compound was tested at 30, 100, and 300 µM. SID 85281215 was the most potent biochemical inhibitor of DNA polymerization, and DNA replication was absent at 300 µM.
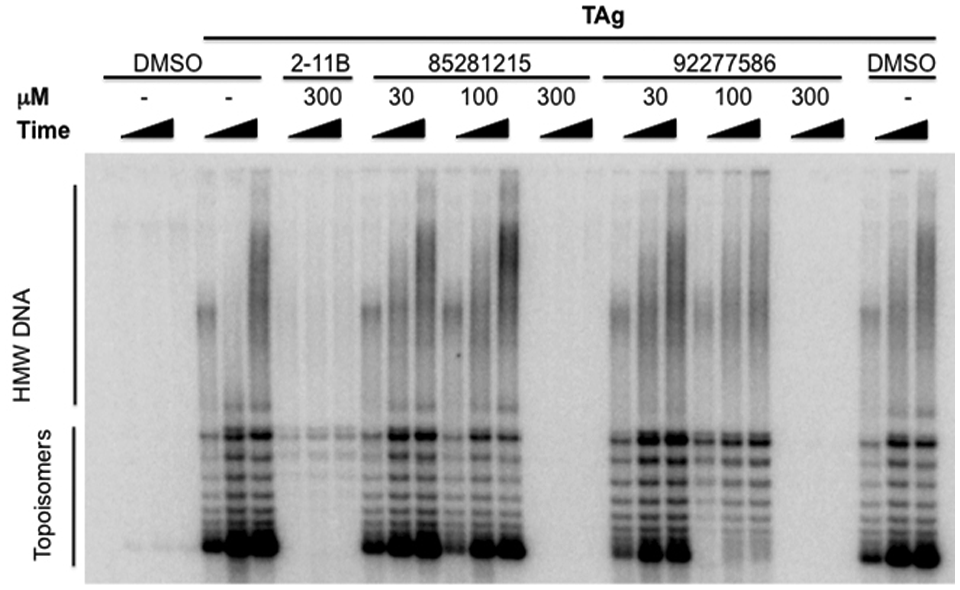
Specificity for T antigen (TAg) is demonstrated by DNA replication assays. The figure compares the effects of increasing concentrations of MAL2-11B (2-11B) and SIDs 85281215 and 92277586 on TAg-dependent DNA replication. Products were analyzed by urea–polyacrylamide (PA) gel electrophoresis. Polymerization of high molecular weight DNA (HMW DNA) increases in uninhibited lanes and decreases where compound-mediated enzymatic inhibition occurs. The concentration of compound in µM is indicated at the top. Increasing reaction time is indicated by a black wedge.
To examine in vitro efficacy of these chemotypes, we tested the three compounds in a cytoprotection assay with SV40 virus in BSC-40 cells. Only SID 85281215 sustained cell viability (16% at 50 μM) in the cytoprotection assay, but the effect was limited due to cytotoxicity near the effective concentration (EC50) ( Fig. 2 ). The 50% toxic concentration (TC50) values for the test compounds ranged from 34 µM to greater than 200 µM ( Fig. 2 ).
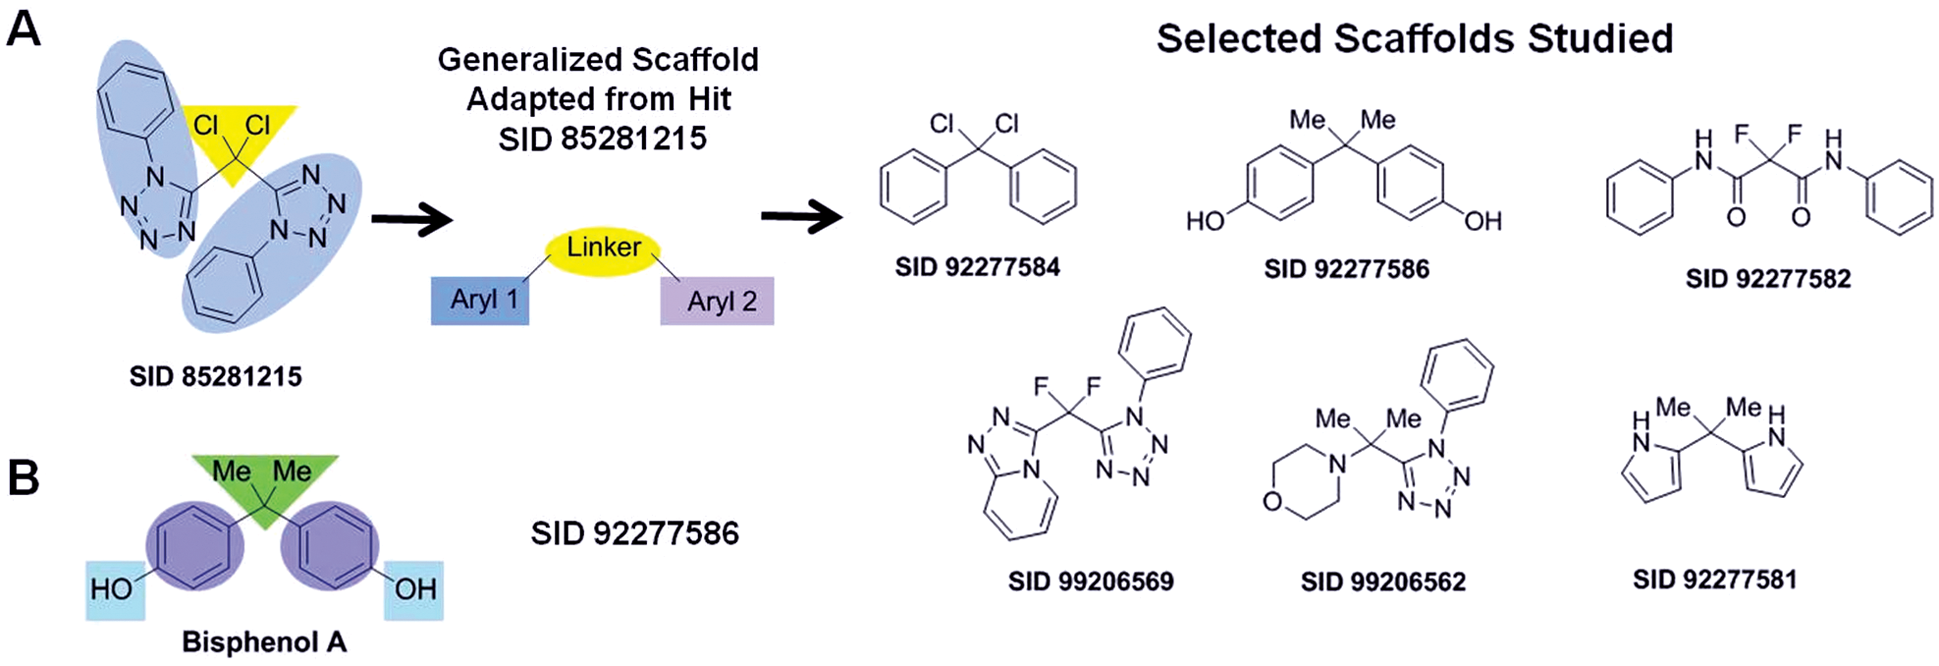
Analog design and syntheses
Chemical optimization was initiated on compound SID 85281215, and similarly, tethered bis-aryl scaffolds were investigated (
Fig. 4A
). Bisphenol A (SID 92277586) was purchased as part of this exploratory structure–activity relationship (SAR) effort. The compound possessed a narrow therapeutic margin. To improve this profile, a standard SAR approach was undertaken to reveal the importance of various structural features of this scaffold (shaded regions,
Fig. 4B
). After optimization efforts and by using the biochemical and in vitro assays described above, we confirmed SID 92277586 as the most effective TAg inhibitor. In the primary assay, this compound IC50 was 41.4 µM (
(
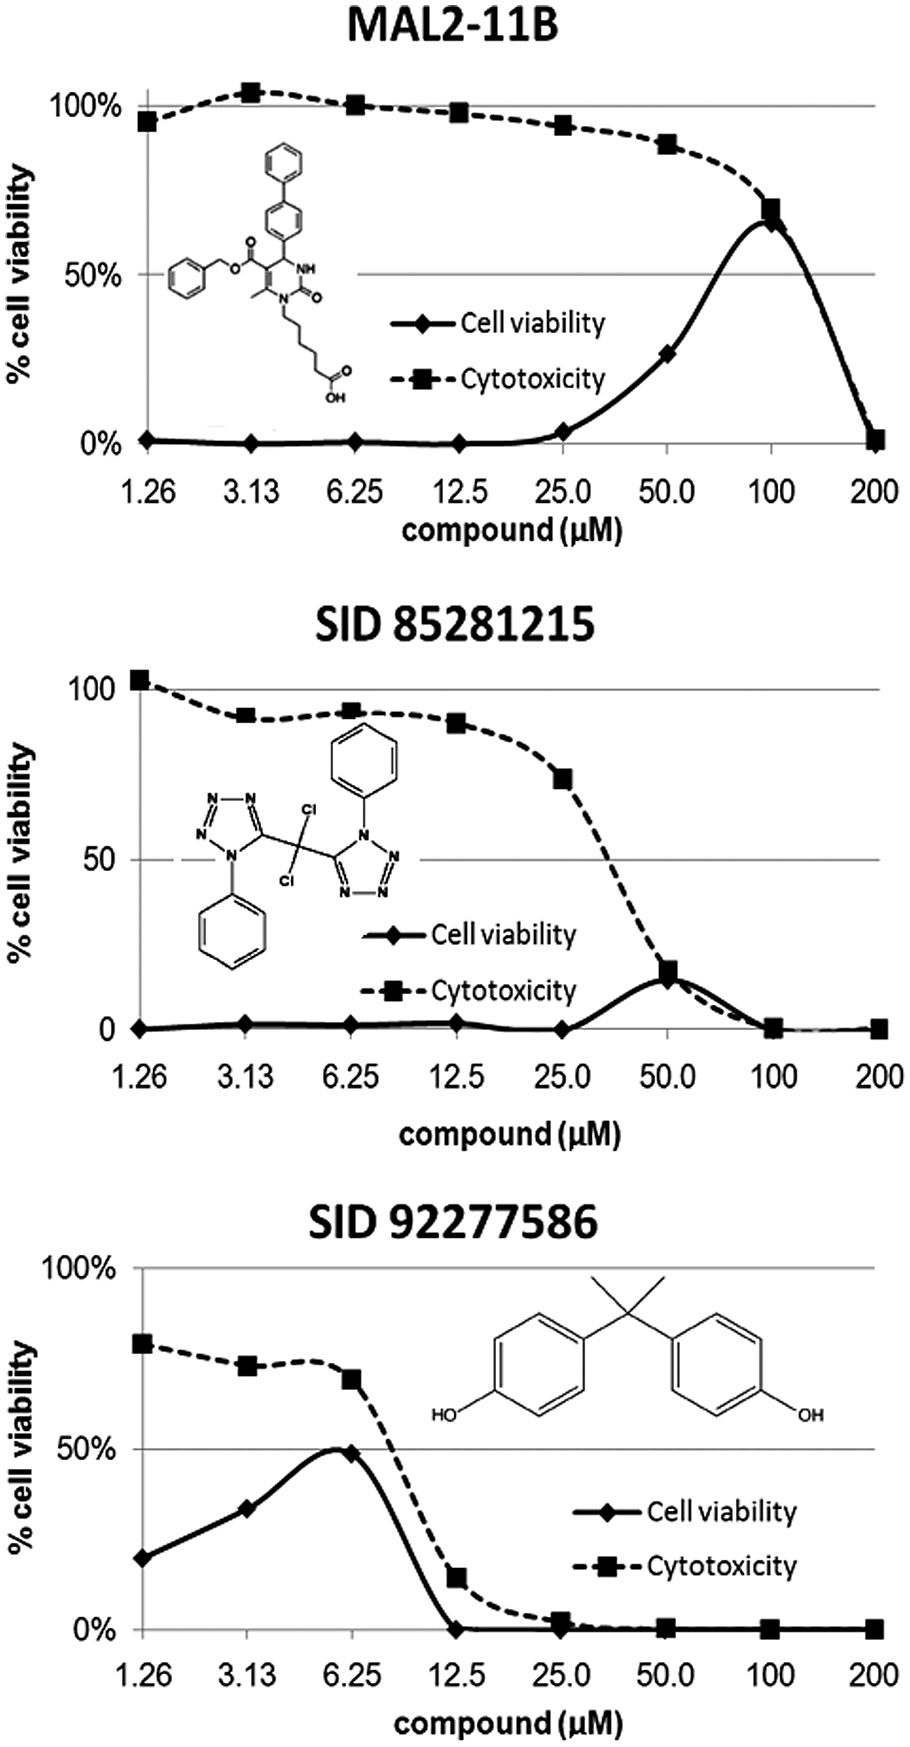
In vitro inhibition of SV40 virus replication. Compounds were tested (200–1.26 µM) in cytoprotection assays using BSC-40 cells, and % cell viability was measured 5 days post–drug or post–viral infection. The dashed line represents cells + compound only (cytotoxicity), and the solid line represents cells + compound + virus (cytoprotection). The curves are plotted but not fit to a specific mathematical model. The EC50 and TC50 values given in Figure 2 were derived using the equation described in Materials and Methods.
Discussion
We employed a high-throughput, biochemical primary screening assay to identify compounds that inhibit the SV40 large T antigen ATPase activity as potential inhibitors of SV40 viral replication. During the assay development, we defined assay parameters and validated the screen. We performed a primary screen and several counterscreens. Last, we performed secondary assays for specificity and in vitro efficacy.
We designed the HTS biochemical screen to address the lack of specific treatments for PyV-related diseases. We hypothesized that inhibitors of SV40 TAg might also be effective against more clinically relevant PyVs. Other small molecules that inhibit the TAg ATPase activity have been identified recently. One recently identified compound, MAL2-11B, inhibits the replication of SV40 in infected cells; however, because of its low potency, solubility, and cell permeability, it is not suitable as a therapeutic. This compound was used as the primary screen positive control. 7
Ultimately, a desirable lead compound would be one that reduces the replication rate of SV40 virus by specifically inhibiting ATPase and DNA replication activity of TAg (with an EC50 <10 µM), is nontoxic (SI >10), and has a broad applicability for other PyVs, including those that afflict humans (i.e., JC and BK viruses). One of the three primary screen hits, SID 85281215 (a bis-tetrazole scaffold), showed minimal in vitro efficacy but had a low selectivity. Further chemical optimization of SID 85281215 resulted in an additional compound (SID 92277586) with high biochemical efficacy, moderate in vitro efficacy, and, again, low selectivity. Although these compounds are effective probes in a biochemical system, their inherent toxicity limits their use in cell-based systems. However, the chemical scaffolds are starting points for continuing chemistry efforts to synthesize related compounds with lower effective and higher toxic concentrations.
The four compounds identified as TAg inhibitors (SIDs 85281215, 85281217, 85281218, and 92277586) are part of the MLPCN library and have been screened in several hundred different assays and formats. Table 2 summarizes the numbers of times the three primary screen compounds were identified as hits versus the total number of assays in which they were screened, and it also shows target-specific assays in which all three compounds were identified. The compounds have been shown to inhibit hydroxyprostaglandin dehydrogenase 15-(NAD) isoform 1, 23 prostaglandin E receptor 2, 24 phosphopantetheinyl transferase, 25 microtubule-associated protein tau aggregation, 26 mint1, 27 and nuclear receptor ROR-gamma. 28 These targets are similar in that they all possess DNA-binding or ligand-binding domains, although there is limited information available to link these characteristics. The observation that the three compounds identified in our primary screen as TAg ATPase inhibitors also have overlapping activity in six other targeted screens suggests that the compounds specifically inhibit the targets and do not operate in a nonspecific manner.
Summary of Hit Coincidence of T Antigen ATPase Inhibitors
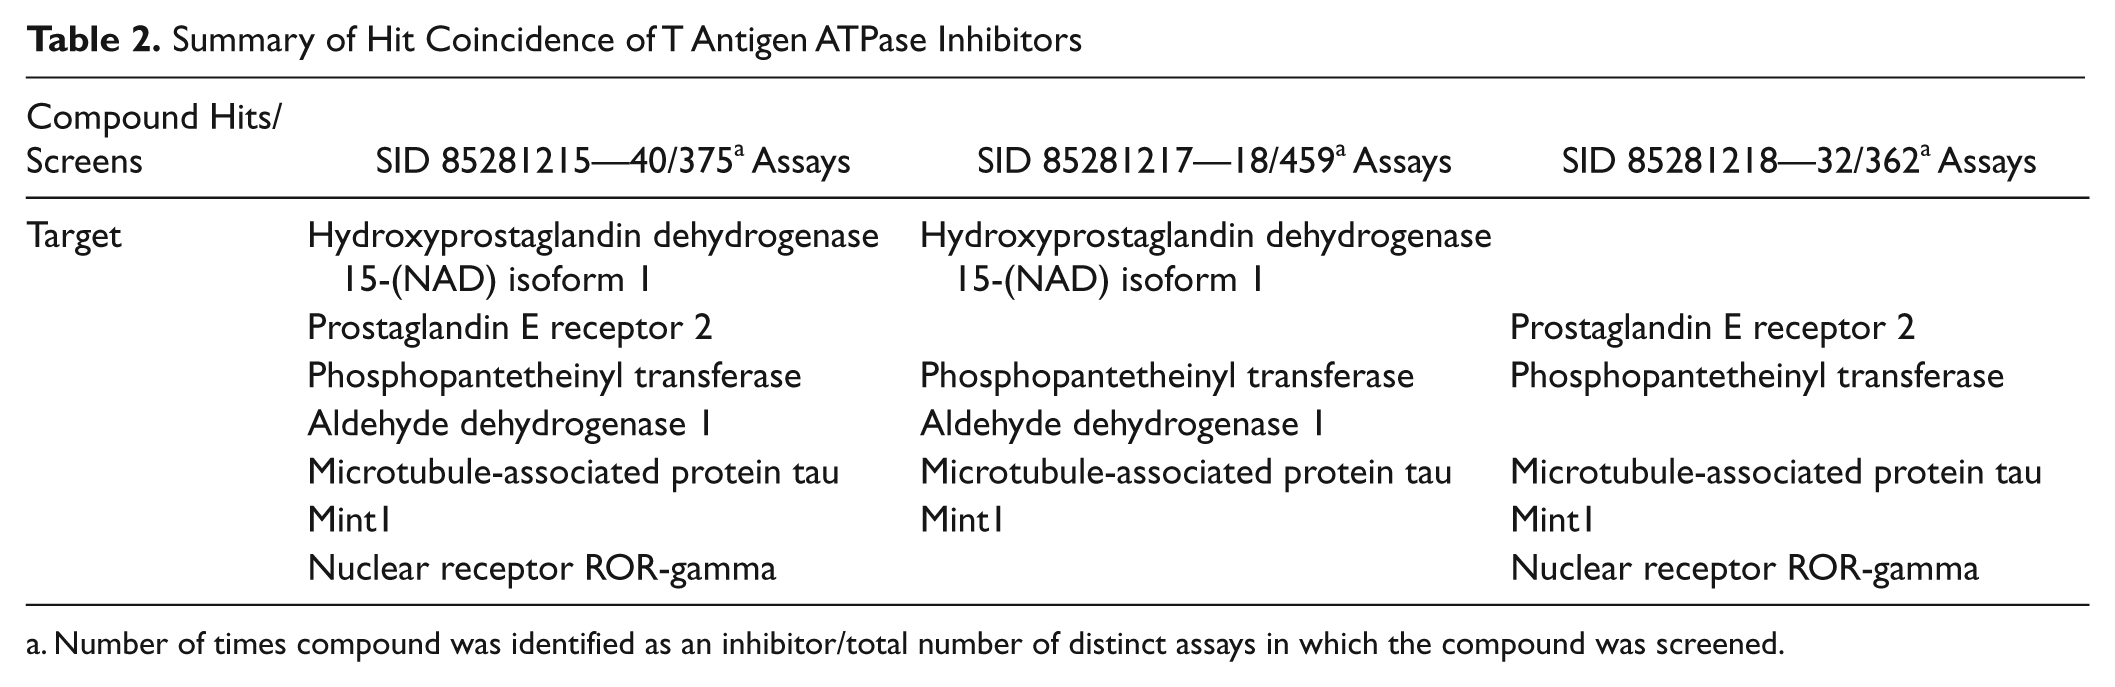
Number of times compound was identified as an inhibitor/total number of distinct assays in which the compound was screened.
SID 92277586, also known as bisphenol A (BPA), has been shown to be estrogenic and cytotoxic at low concentrations. 29 Bisphenol compounds have previously been identified as putative ATPase inhibitors, most notably as inhibitors of the Ca2+-ATPase of skeletal muscle sarcoplasmic reticulum 30 and internal store Ca2+-ATPases. 31 Compounds of this type have also been shown to inhibit cell growth by acting as inhibitors of topoisomerase IIα. 32 The convergence of these two activities may account for the biochemical and cytotoxicity assay results shown here for compounds 85281215 and 92277586. More recently, BPA was found to induce activation of ERK1/2 and transcriptionally regulate c-fos in human breast cancer cell lines, thereby implicating the compound in carcinogenesis. 33 Studies have reported the adverse effects of µM concentrations of BPA on the nervous system and, potentially, on neonatal brain development 34 as well as reproductive organ development. 35 Although the cytotoxicity of BPA in different cell types varies tremendously, the cytotoxicity of BPA in BSC-40 cells (African green monkey kidney epithelial cells) at ~10 µM suggests that it is particularly nephrotoxic.
In summary, primary and secondary screening has led to the discovery of a bisphenol that specifically inhibits the ATPase activity of SV40 large T antigen. Data from the confirmatory and secondary assays were analyzed to identify key scaffolds for additional SAR studies and lead optimization efforts. This compound proved to be a more potent biochemical inhibitor of TAg ATPase activity than currently available molecules such as MAL2-11B but had a low selectivity when tested in vitro for SV40 viral replication inhibition. Although the in vitro/vivo use of compounds identified by this particular screen is limited because of the cytotoxic effects, this screening algorithm itself was successful and could be applied to evaluate other small-molecule libraries for inhibitors of TAg and consequently PyV replication.
Footnotes
Acknowledgements
This work was done with support from NIH grant 1R03MH084077-01 to J. L. Brodsky and the University of Pittsburgh George O’Brien Kidney Research Center (DK79307), 1 U54 HG005034-01 to the Southern Research Biocontainment Screening Center, and 1R03MH081231-01 to the University of Kansas Specialized Chemistry Center.
References
Supplementary Material
Please find the following supplemental material available below.
For Open Access articles published under a Creative Commons License, all supplemental material carries the same license as the article it is associated with.
For non-Open Access articles published, all supplemental material carries a non-exclusive license, and permission requests for re-use of supplemental material or any part of supplemental material shall be sent directly to the copyright owner as specified in the copyright notice associated with the article.