
Abstract
Predictions of the absorption, distribution, metabolism, excretion, and toxicity of compounds in pharmaceutical development are essential aspects of the drug discovery process. B-CLEAR is an in vitro system that uses sandwich-cultured hepatocytes to evaluate and predict in vivo hepatobiliary disposition (hepatic uptake, biliary excretion, and biliary clearance), transporter-based hepatic drug-drug interactions, and potential drug-induced hepatotoxicity. Automation of predictive technologies is an advantageous and preferred format in drug discovery. In this study, manual and automated studies are investigated and equivalence is demonstrated. In addition, automated applications using model probe substrates and inhibitors to assess the cholestatic potential of drugs and evaluate hepatic drug transport are examined. The successful automation of this technology provides a more reproducible and less labor-intensive approach, reducing potential operator error in complex studies and facilitating technology transfer.
Keywords
Introduction
T
Until recently, experiments modulating the tight junctions in SCH were exclusively performed manually in 6- and 24-well formats. These experiments are complex in nature, involving parallel timed incubations in Plus (+) Buffer and Minus (–) Buffer, and may include multiple substrates at varying concentrations in the presence or absence of potential inhibitors. In the simplest SCH applications, new users are subjected to extensive training to develop proficiency in consistent timing, technique, and the execution of steps involving multiple liquid transfers of different solutions. The complexity of the SCH experiments increases with multiple substrates and inhibitors and varying concentrations. The complexity of SCH experiments is proportional to the probability of human error in the transfer of solutions, timing, and executing the correct sequence of steps in a consistent manner. Furthermore, with large studies approaching 16 or more plates per day, the likelihood of human error as a result of fatigue is elevated. The initiative to automate this technology was driven by the desire to develop a less labor-intensive format and to offer a reproducible user-independent process to consistently meet specific timing and temperature requirements. By providing an alternative to manually performing studies, automation enables an inexperienced user to consistently generate quality data.
Drug-induced liver toxicity is the frequent reason for withdrawal of Food and Drug Administration–approved drugs from the market. 8 Inhibition of hepatic uptake and efflux, leading to alterations in bile acid disposition, has been indicated as a possible mechanism of hepatotoxicity and can be predicted using SCH.9,10 Cholestasis results in elevated levels of bile acids in the bloodstream. These elevated levels can result from the inhibition of hepatic uptake of bile acids, primarily inhibition of sodium-dependent taurocholate co-transporting polypeptide (Ntcp), or from the inhibition of biliary efflux of bile acids by the bile salt export pump (Bsep). Because the increased intracellular concentration of bile acids causes hepatotoxicity, serum levels may not accurately reflect the hepatotoxic potential of a drug. The SCH technology described here can differentiate between inhibitors that cause an increase in intracellular concentration of bile acids and those that do not, providing relevant in vitro predictions of drug-induced hepatotoxicity. 11 The ability to differentiate inhibitors that alter the intracellular concentration of bile acids is a function of the analytical variability and the system variability. Typically, a 10% to 15% total variability is observed, and usually a 20% change from control is the minimum degree of relevant change.
In addition to the critical role transporters play in the safety and efficacy of a drug, transporter-based drug-drug interactions are being increasingly reported and recognized as important to evaluate during drug development. Inhibition or induction of transporters can result in considerable changes in drug exposure, altering the safety or efficacy of a drug. 12 Because SCH retain in vivo–relevant expression levels of uptake and efflux transporters, this technology provides an optimal system for the evaluation and prediction of transporter-based drug-drug interactions. SCH experiments using model substrates for clinically relevant transporters and compounds of interest can predict specific transporter interactions with specific compounds.
SCH applications are often performed using radiolabeled substrates or substrates that require LC-MS analysis. The use of fluorescent probes can reduce the time and cost associated with liquid scintillation counting and LC-MS analysis. Fluorescent bile acid derivatives have been used to evaluate hepatic transport, investigate alterations in bile acid transport by cholestatic drugs, and study concentration-dependent inhibitory effects in sandwich-cultured rat hepatocytes (SCRH).13–15 Sulfoglow 1a was selected as a novel substrate to evaluate with automated studies because it is a water-soluble, fluorescent molecule with some structural similarities to bilirubin, and it is rapidly taken up and excreted intact following intravenous injection into rats. 16 Bilirubin and its glucuronide conjugates are well-recognized markers of hepatic dysfunction. 17
Here, we demonstrate the use of the applications described above using SCRH in a fully automated format. Results support that an automated platform for experiments modulating the tight junctions in SCH, useful as a tool in drug development and lead optimization to study the behavior of compounds in the liver, is now available.
Materials and Methods
Materials
B-CLEAR 24-well sandwich-cultured rat hepatocytes kits were provided by Qualyst, Inc. (Durham, NC). Cyclosporin A, erythromycin estolate, rifamycin SV, and nitrofurantoin were purchased from Sigma-Aldrich (St. Louis, MO). d8-TCA, a stable label of sodium taurocholate, ethanesulfonic acid (1,1,2,2-tetradeutero-2-[[(3α,5β,7α,12α)-2,2,4,4-tetradeutero-3,7,12-trihydroxy-24-oxocholan-24-yl]amino]-, monosodium salt) was custom synthesized by Martrex, Inc. (Minnetonka, MN). Rosuvastatin and d4-taurocholic acid (d4-TCA) were purchased from Toronto Research Chemicals (North York, Ontario, Canada). Sulfoglow 1a (1-ethyl-2,7,9-trimethyl-3,5-dioxo-3H,5H-dipyrrolo[1,2-c:2′,1′-f]-pyrimidine-8-sulfonic acid sodium salt) was kindly provided by Dr. David Lightner (University of Nevada, Reno), and Alexa Fluor 594 was purchased from Invitrogen (Carlsbad, CA). High-performance liquid chromatography (HPLC)–grade methanol from Honeywell Burdick & Jackson (Muskegon, MI) and Fluka mass spectrometry–grade ammonium acetate from Sigma-Aldrich (Milwaukee, WI) were used in sample preparation and analysis.
Automated and manual hepatobiliary disposition comparison study
Manual hepatobiliary disposition studies
Culture media were removed, and hepatocytes were washed and then conditioned for 10 min at 37 °C with Plus (+) or Minus (–) Buffer (Qualyst, Inc.). Conditioning buffer was removed, and cells were treated with Plus (+) Buffer containing substrate (2.5 µM d8-TCA) for 10 min at 37 °C. Substrate solution was removed, and cells were washed with cold Plus (+) Buffer to remove residual substrate. Study plates were stored at –80 °C for subsequent analysis.
Automated hepatobiliary disposition studies
All steps described above were also executed by a Microlab STAR (Hamilton Company, Reno, NV) with custom liquid and plate handling processes. The Microlab STAR had a pipetting arm consisting of 12 pipetting channels, and the workstation was equipped with required accessories, including a 4-position temperature-controlled plate carrier for 37 °C incubations, warming and cooling reservoirs, and a plate tilter to enable complete liquid aspiration. User interaction is required prior to starting an automated run for placement of 24-well SCRH assay plates on the temperature-controlled plate carrier and the addition of buffers and substrate solutions to reservoirs in warming and cooling modules as appropriate for the study. Hepatobiliary disposition studies are the simplest automated SCH application described here, requiring no more than 6 different buffers and substrate solutions to process four 24-well plates with walk-away operation.
Automated applications using SCRH
All steps below describing applications using SCRH for bile acid transport studies, drug transport studies, and fluorescent probe evaluation were fully automated with walk-away operation using a Microlab STAR (Hamilton Company). Prior to starting an automated SCRH experiment, user interaction is required to place up to four 24-well SCRH assay plates on the temperature-controlled plate carrier and to add buffers, substrate solutions, and inhibitor solutions to reservoirs in warming and cooling modules as appropriate for the user-selected B-CLEAR experiment.
Automated bile acid transport studies
Culture media were removed and hepatocytes were washed with Plus (+) or Minus (–) Buffer, then conditioned with Plus (+) or Minus (–) Buffer either in the presence or absence of inhibitor (50 µM cyclosporin A or erythromycin estolate) for 10 min at 37 °C. Conditioning buffer was removed, and cells were treated with Plus (+) Buffer containing 2.5 µM d8-TCA, a model substrate useful to assess bile acid disposition, in the presence or absence of inhibitor for 10 min at 37 °C. Substrate co-incubation solution was removed, and cells were washed with cold Plus (+) Buffer to remove residual substrate. Study plates were stored at –80 °C for subsequent analysis. The experiment setup for bile acid transport studies is more complicated than hepatobiliary disposition studies; four 24-well SCRH plates can require up to 36 different buffer, substrate, and inhibitor solutions.
Automated drug transport studies
Cells were washed as described above, then conditioned with Plus (+) or Minus (–) Buffer either in the presence or absence of inhibitor (50 µM rifamycin SV) for 10 min at 37 °C. Conditioning buffer was removed, and cells were treated with Plus (+) Buffer containing 2.5 µM substrate (d8-TCA, rosuvastatin, or nitrofurantoin) in the presence or absence of inhibitor for 10 min at 37 °C. Substrate co-incubation solution was removed, and cells were washed with cold Plus (+) Buffer to remove residual substrate. Study plates were stored at –80 °C for subsequent analysis. The experiment setup for drug transport studies is the most complex of the applications discussed here and can require more than 60 different buffer, substrate, and inhibitor solutions to complete four 24-well SCRH experiments.
Automated fluorescent probe evaluation
Cells were washed as described above, then conditioned with Plus (+) or Minus (–) Buffer either in the presence or absence of inhibitor (10 µM rifamycin SV or erythromycin estolate) for 10 min at 37 °C. Conditioning buffer was removed, and cells were treated with Plus (+) Buffer containing 2.5 µM sulfoglow 1a in the presence or absence of inhibitor for 15 min at 37 °C. Substrate co-incubation solution was removed, and cells were washed with cold Plus (+) Buffer to remove residual substrate. Study plates were stored at –80 °C for subsequent analysis. The complexity of the fluorescent probe evaluation experiment setup was comparable to the hepatobiliary disposition or bile acid transport studies.
Sample preparation for LC-MS/MS analysis
Automated-manual comparison and bile acid transport study samples
A volume of 500 µL of lysis solution [70:30 methanol:water (v:v) containing 25 nM d4-TCA (internal standard)] was added to each well of previously frozen 24-well plates containing study samples. Analytical standards and quality control (QC) samples were prepared by spiking a known amount of d8-TCA into a blank cell plate followed by the addition of lysis solution as described for study samples. Standards were prepared over the range of 0.5 to 50 pmole/well and delivered to the blank cell plate with a 10 µL volume addition per well. QC samples were prepared at the lower limit of quantitation and the upper limit of quantitation. Plates were shaken for approximately 15 min, and the cell lysate solution was transferred to a 96-well Unifilter Plate (Whatman, Piscataway, NJ). Lysate was filtered into a deep-well plate by centrifugation (2000 rcf for 5 min). The sample filtrate was evaporated to dryness, and the samples were reconstituted in 200 µL sample diluent containing 60% methanol and 40% 10 mM ammonium acetate (native pH) and mixed for 15 min on a plate shaker. The reconstituted samples were transferred to a 96-well Unifilter Plate (Whatman) and filtered into a Costar 3956 96-well plate (Corning, Corning, NY) plate by centrifugation (2000 rcf for 2 min) and sealed with a silicone capmat (Whatman) prior to LC-MS/MS analysis. Liquid-handling steps were performed using a Microlab STAR (Hamilton Company) automated platform. For these non-GLP studies, assay variability was not assessed.
Drug transport study samples
A volume of 300 µL of lysis solution, [70:30 methanol:water (v:v) containing 6.25 nM d4-TCA (internal standard)], was added to each well of previously frozen 24-well plates containing study samples. Plates were shaken for approximately 15 min and the cell lysate solution was transferred to a 96-well Unifilter Plate (Whatman, Piscataway, NJ). Cell lysate solutions from samples treated with different substrates, but under the same inhibitor conditions, were combined by transferring to a single filter plate well. Combining samples expedites LC-MS/MS analysis by decreasing the number of injections. Lysate was filtered into a deepwell plate by centrifugation (2000 rcf for 5 min). The sample filtrate was evaporated to dryness and reconstituted in 200 µL sample diluent containing 80% methanol and 20% 10 mM ammonium acetate (native pH), and mixed for 15 min on a plate shaker. The reconstituted samples were transferred to a 96-well Unifilter Plate (Whatman) and filtered into a Costar 3956 96-well plate (Corning) plate by centrifugation (2000 rcf for 2 min) and sealed with a silicone capmat (Whatman) prior to LC-MS/MS analysis. Liquid-handling steps were performed using a Microlab STAR (Hamilton Company) automated platform.
LC-MS/MS analysis
A Shimadzu binary HPLC system (Shimadzu, Columbia, MD) composed of LC-10ADvp pumps, a CTO-10Avp oven, and an SIL-HTc 96-well autosampler was used. The chromatographic column was a Thermo Scientific (Thermo Fisher Scientific, Waltham, MA) Hypersil Gold C18 (100 × 1.0 mm, 3 µm) with matching guard column. Column temperature was maintained at 35 °C. A mobile phase gradient, consisting of 0.5 mM ammonium acetate (native pH) and methanol, was used at a flow rate of 50 µL/min and a total run time of 5 min for automated-manual comparison and bile acid transport study samples for a run time of 10 min for drug transport study samples. An injection volume of 10 µL was used. For automated-manual comparison and bile acid transport, analytical standards were injected at the beginning of a run, and QCs were injected at the middle and end of a run. Tandem mass spectrometry, with negative ion electrospray ionization, was conducted with a Thermo Electron TSQ Quantum Discovery MAX (Thermo Fisher Scientific) with an Ion Max ESI source. The transitions monitored at unit resolution for d8-TCA, rosuvastatin, nitrofurantoin, and d4-TCA were (precursor m/z > product m/z) 522 > 128, 480 > 418, 779 > 475, and 518 > 124, respectively. LC-MS/MS data were processed using Xcalibur software (Thermo Fisher Scientific). For automated-manual comparison and bile acid transport study samples, unknown values were calculated from a standard curve generated using Xcalibur software and expressed as picomoles per well. Analytical run ruggedness was evaluated based on percentage accuracy of back-calculated values for the standards and QCs. Acceptance criteria for percentage accuracy of standards and QCs were typically within 15%. For drug transport studies, unknown values are expressed as peak area ratio values.
Sample preparation for fluorescent intensity analysis
Fluorescent probe evaluation samples
A volume of 500 µL of lysis solution (70:30 methanol:water [v:v] containing 5 nM Alexa Fluor 594 [internal standard]) was added to each well of previously frozen 24-well plates containing sulfoglow 1a study samples. Standards and QC samples were prepared by spiking a known amount of sulfoglow 1a into a blank cell plate followed by the addition of lysis solution as described for study samples. Plates were shaken for approximately 15 min, and the cell lysate solution was transferred to a 96-well Unifilter Plate (Whatman). Lysate was filtered into a deep-well plate by centrifugation (2000 rcf for 5 min). A 200 µL volume of the sample filtrate was transferred to a Costar 3915 96-well plate (Corning) for fluorescent intensity analysis. Liquid-handling steps were performed using a Microlab STAR (Hamilton Company) automated platform.
Fluorescent intensity analysis
Fluorescent intensity measurements were performed with a SPECTRAmax GEMINI XS (Molecular Devices) microplate spectrofluorometer using the fluorescence read mode. Settings to measure the fluorescent intensity of sulfoglow 1a and Alexa Fluor 594 (internal standard) were excitation wavelengths at 420 nm and 580 nm, emission wavelengths at 530 nm and 640 nm, and cutoffs at 495 nm and 630 nm, respectively. For sulfoglow 1a, background fluorescence was subtracted from fluorescence intensity measurements. The background-corrected fluorescent intensity was expressed as a ratio relative to internal standard fluorescent intensity. Unknown values were calculated from a standard curve using Prism 4.03 (GraphPad Software, San Diego, CA) and expressed as picomoles per well. Ruggedness for this analysis was evaluated based on percentage accuracy of back-calculated values for the standards and QCs to be typically within 15%. For these non-GLP studies, assay variability was not assessed.
Data analysis
For automated-manual comparison, bile acid transport, and fluorescent probe evaluation studies, accumulation was calculated in cells + bile [Plus (+) Buffer] and cells [Minus (–) Buffer] by subtracting the amount of substrate (picomoles per well) in nonspecific binding control plates from the amount of substrate (picomoles per well) in study samples and dividing by protein content (milligrams of protein per well). Protein content is an SCRH lot-specific value provided by Qualyst, Inc. The biliary excretion index (BEI) was calculated according to the following equation:
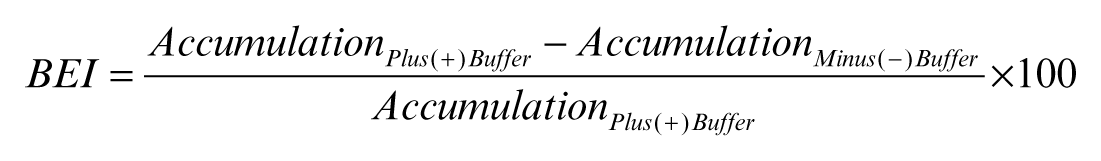
The in vitro biliary clearance (Clbiliary) was determined using the following equation and was scaled to body weight using 0.2 g protein/g liver weight and 40 g liver/kg body weight 18 :
For bile acid transport studies performed in the presence or absence of inhibitors, the accumulation in cells + bile and cells, BEI, and biliary clearance were expressed as percentage control (no inhibitor).
For the drug transport studies, it was not necessary to quantitate picomoles per well values of a substrate to determine changes in transport related to the presence of an inhibitor. Inhibitor effects on a model substrate may be expressed as a percentage of control based on peak area ratio values relative to the control (no inhibitor present). The BEI is calculated using the previous BEI equation, with peak area ratio values substituted for accumulation in Plus (+) Buffer and Minus (–) Buffer.
Statistical comparisons of automated-manual hepatobiliary studies were compared using a paired t-test in Prism 4.03 (GraphPad Software) or Excel (Microsoft Corporation, Redmond, WA) 2-way analysis of variance (ANOVA). Differences were considered significant at p < 0.05.
Results and Discussion
Automated and Manual Hepatobiliary Disposition Study Comparison
Automated and manual experimental procedures are described in the Materials and Methods section and require specific timing, temperature, and wash conditions. The fully automated 24-well format was successfully developed using the Hamilton Microlab STAR platform. The optimized manual execution of an SCH experiment was largely conserved in the development of an automated protocol with the exception of the final wash with cold Plus (+) Buffer to remove residual substrate. A manual cold wash involves swirling the plate to remove residual substrate, and the automated cold wash is static because of time constraints associated with washing. The manual plate swirling has been replaced with automated wash cycles of larger volume. The automated wash procedure is more consistent because the manual wash swirling technique varies with users. An inconsistent removal of residual substrate can introduce variability and effect final results. The STAR platform was equipped with 12 pipetting channels, a plate tilter to allow for complete liquid aspiration, and accessories for temperature control of plates and solutions.
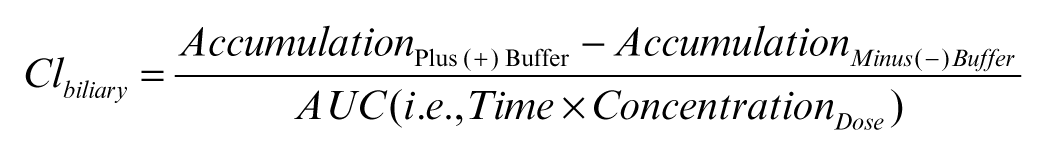
Automated and manual 24-well uptake studies were performed using d8-TCA, a substrate historically used as a control compound in SCH experiments and evaluations. Studies comparing results from automated and manual studies were executed in parallel using the same lot of SCRH and a single source of prepared reagents. Results between studies conducted manually and automated from 3 independent studies, with triplicate wells for each condition, were compared using the paired t-test (p < 0.05) and demonstrated no statistically significant difference in accumulation (cells + bile or cells), BEI, or Clbiliary for d8-TCA ( Fig. 1 ). SCRH are derived from primary cells, and expected differences in lot-to-lot activity are observed in this set of data and are consistent between automated and manual studies. Intraplate evaluations of a single condition (i.e., 24 replicates) for automated and manual methods were analyzed by 2-way ANOVA; observations suggest that the relative standard deviations for either methodology were not different, and variability in accumulation across the plates appeared to be random. Similar relative standard deviations between automated and manual studies suggest the variability observed (less than 15%) was biological in nature and that automation did not introduce additional variability in the system. Several automated applications using this technology to evaluate hepatic transport are discussed.
Comparison of 3 independent hepatobiliary dispositions of d8-TCA in sandwich-cultured rat hepatocytes studies performed either automated or manually. The y-axis represents accumulation (pmoles/mg protein) in cells + bile and cells and is shown as the mean ± SD of triplicate conditions, % biliary excretion index, and Clbiliary in mL/min/kg body mass.
Effects of inhibitors on bile acid transport in SCRH
A subset of compounds, previously found to inhibit the uptake and/or efflux of bile acids in 6-well manual SCRH, was selected based on different inhibition properties to be evaluated in an automated 24-well format.
11
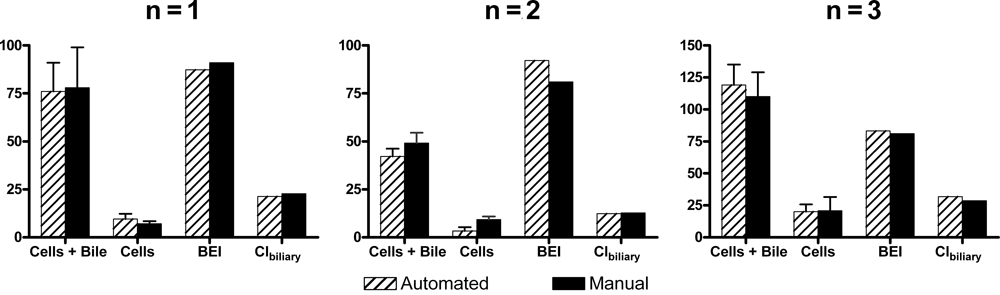
Automated experiments using SCRH were performed using d8-TCA as a model probe for bile acid transport, with cyclosporin A as an efflux inhibitor or erythromycin estolate as an uptake inhibitor. Results are shown as percentage control (no inhibitor;
Fig. 2
). In the presence of cyclosporin A, the BEI of d8-TCA was decreased, suggesting inhibition of the canalicular efflux transporter, Bsep (
Fig. 2B
). There was a greater than 50% decrease in the mass of d8-TCA in the cells + bile, consistent with an inhibition of uptake, and about a 300% increase in mass inside the cells (
Fig. 2A
). The mass of d8-TCA inside the cell increased because the inhibition of efflux was greater than the inhibition of uptake of d8-TCA. In the presence of erythromycin estolate, uptake was primarily affected because there was a greater than 90% decrease in the mass of d8-TCA inside the cells + bile (
Fig. 2A
), consistent with inhibition of the basolateral uptake transporter, Ntcp. The BEI of d8-TCA was not altered in the presence of erythromycin estolate, indicating that the Bsep-mediated efflux of d8-TCA was not inhibited. As long as the quantity of mass is greater than the analytical assay’s lower limit of quantitation, the BEI should remain unchanged. (
Automated sandwich-cultured rat hepatocyte (SCRH) studies demonstrating its utility to evaluate the effects of known inhibitors (50 µM cyclosporin A or erythromycin estolate) on bile acid transport using d8-TCA as a probe. (
Effects of inhibitor on the transport of model substrates by clinically relevant hepatic transporters using SCRH
Model substrates for clinically relevant transporters may be used in SCH to predict hepatic transporter interactions with a compound of interest. The following substrates were selected for SCRH drug transport studies: d8-TCA for Ntcp- and Bsep-mediated transport, rosuvastatin for organic anion-transporting polypeptide (Oatp)- and multidrug resistance–associated protein 2 (Mrp2)–mediated transport, and nitrofurantoin for breast cancer resistance protein (Bcrp)–mediated transport. Ntcp and Oatp are basolateral (uptake) transporters, and Bsep, Mrp2, and Bcrp are canalicular membrane (efflux) transporters. Automated experiments using SCRH were performed using these model substrates in the presence and absence of an inhibitor. Rifamycin SV (50 µM) was selected as a positive study control inhibitor with measurable effects on the accumulation and BEI of these model substrates. Rifamycin SV is useful as a study control to ensure assay performance and evaluate the functional activity of hepatic transporters. Results are presented in Figure 3 as percentage control (no inhibitor). In the presence of rifamycin SV, the cellular accumulation of d8-TCA increased to 200% of control. The accumulation in cells + bile and the BEI decreased to approximately 50% of control ( Fig. 3A ). Rosuvastatin accumulation in cells + bile, cells, and the BEI all decreased by greater than 85% of control ( Fig. 3B ). Rifamycin SV decreased the BEI of nitrofurantoin by approximately 50% with a minimal effect on the cells + bile and resulted in a 200% increase in accumulation in cells ( Fig. 3C ). All results are in agreement with analogous manual studies. 19
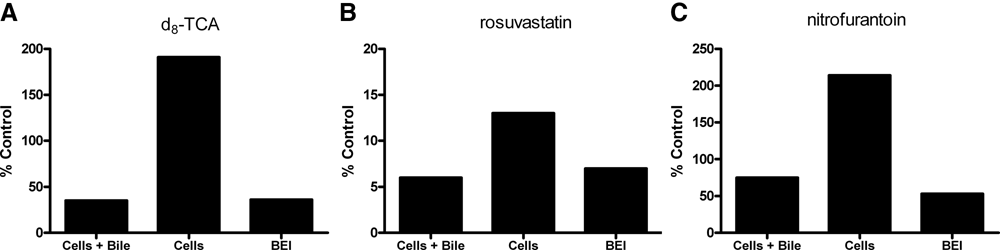
Automated sandwich-cultured rat hepatocyte (SCRH) studies showing inhibitor effects (50 µM rifamycin SV) on the transport of model substrates by clinically relevant hepatic transporters (substrate, transporter): (
Automated SCH experiments with these model substrates, in the presence or absence of a compound of interest, can provide useful preclinical information and determine specific transporter interactions with a compound and can identify the potential for transporter-based drug-drug interactions. Further studies are being performed in our laboratories to identify robust substrates for additional transporters.
Evaluation of a fluorescent probe using SCRH
Sulfoglow 1a is a fluorescent and water-soluble analog of xanthobilirubic acid, a dipyrrinone model for bilirubin ( Fig. 4 ) that is taken up by unknown hepatic transport proteins and is excreted into bile by Mrp2 and an Mrp2-independent pathway. 16 The hepatobiliary disposition of this substrate was evaluated in automated SCRH studies, and results consistently showed significant accumulation (cells + bile = 180 ± 27 pmoles/mg protein; cells= 110 ± 9.2 pmoles/mg protein) and a relatively high BEI (41 ± 8.6) in SCRH (n = 6), which are both desirable probe quantities.
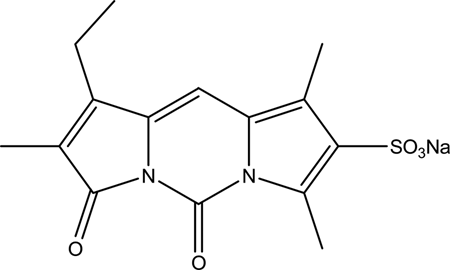
Chemical structure of 1-ethyl-2,7,9-trimethyl-3,5-dioxo-3H, 5H-dipyrrolo[1,2-c:2′,1′-f]-pyrimidine-8-sulfonic acid sodium salt (sulfoglow 1a).
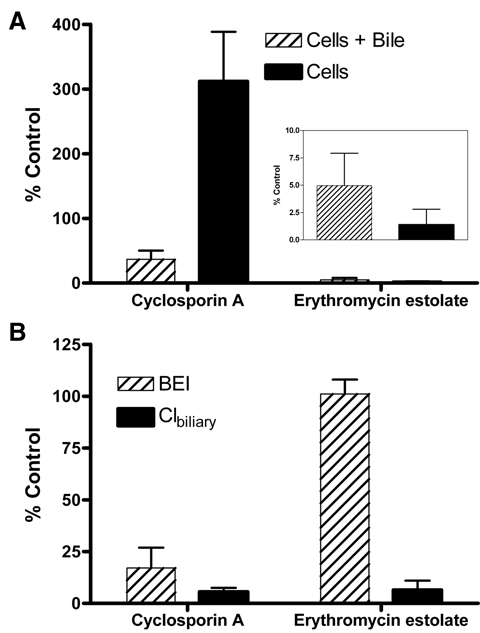
Automated SCRH experiments were performed using sulfoglow 1a in the presence and absence of transport inhibitors (erythromycin estolate or rifamycin SV). In the presence of either inhibitor, a dose-dependent decrease in accumulation in cells + bile and cells was observed, suggesting inhibition of uptake of sulfoglow 1a by both inhibitors ( Fig. 5A ). Erythromycin estolate inhibited the biliary efflux of sulfoglow 1a, as indicated by the decrease in the BEI. The BEI for sulfoglow 1a was unaltered in the presence of up to 30 µM rifamycin SV. Possible explanations for rifamycin SV, an Mrp2 inhibitor, having no effect on the BEI of sulfoglow 1a are suboptimal concentration for inhibition of efflux or the efflux compensated for by a non-Mrp2 transporter. Accumulation in the cells of sulfoglow 1a is decreased with each inhibitor, consistent with a greater effect on uptake relative to efflux. The Clbiliary decreases in the presence of both efflux and uptake inhibitors and is greatest when both uptake and efflux are inhibited ( Fig. 5B ). Data are presented as percentage control (no inhibitor). The fluorescent intensity of sulfoglow 1a dose solutions, with and without inhibitor, were measured and had the same relative fluorescent units, confirming that the changes in fluorescent intensity representing accumulation are related to hepatic transport.
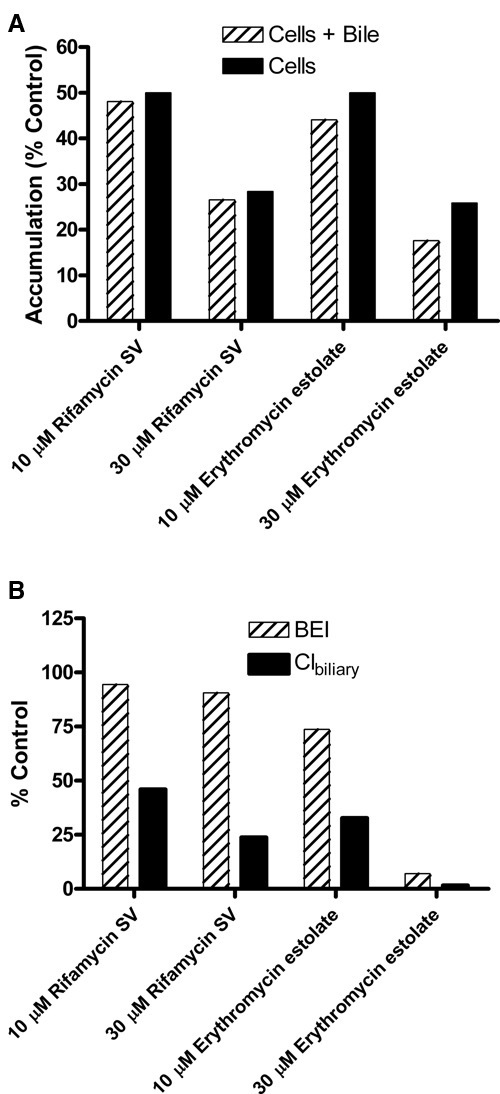
Automated sandwich-cultured rat hepatocyte (SCRH) studies demonstrating the utility of a fluorescent probe, sulfoglow 1a, to evaluate inhibitor effects (10 µM or 30 µM rifamycin SV or erythromycin estolate) on hepatobiliary disposition. (
This work demonstrates the successful automation of SCH application to predict hepatobiliary disposition, assess the cholestatic potential of drugs by inhibition of bile acid transport (uptake and efflux) in SCRH, and determine inhibitor effects on clinically relevant transporters using model substrates. B-CLEAR studies may be performed as a secondary or small-scale screen in drug development and/or lead optimization to assist in making these predicting and defining ADMET properties of drug candidates. 20 The automation of experiments to study hepatic transport by modulating tight junctions in SCH is an important milestone in the advancement of this technology.
Footnotes
Acknowledgements
The authors thank Dr. David Lightner of the University of Nevada, Reno, for kindly providing the sulfoglow 1a compound; Ali Safavi of The Hamilton Company for exceptional support and technical expertise; and Robert Hart for his critical review of this article.