



Abstract
Dose-response curves, resulting in estimates of endpoints such as the IC50, are fundamental to drug discovery. However, some estimates are more reliable than others. It is important to know just how reliable an estimate is if we want to base decisions on it or use it in further modeling. In this study, the authors propose a new measure of endpoint reliability, based on the concept of desirability first introduced by Harrington. The solution is not dependent on the application used to analyze the experimental data, provided a number of parameters to characterize the dose-response curve are available. The authors show how this score can be used as an objective and consistent measure to rank screening results, combine information from groups of experiments, and determine optimal levels of characterization of a compound’s biological activity.
Introduction
I
Each compound’s IC50 endpoint is estimated from fitting a sigmoid function to measurements (responses) at a range of doses, which constitute the dose-response curve. To help characterize a screening result, several quantitative and categorical quality flags are routinely used at Pfizer for each curve and stored in the corporate database together with the numeric value of the IC50. Examples of flags are the number of outliers removed from the curve fit and whether any of the curve parameters have been fixed by the user. Recording these flags ensures that curve fits are produced and characterized consistently across biological assays. However, faced with a mixture of up to 7 text and numeric parameters having different validity ranges, the users of downstream applications tend either to simply ignore them or to visually inspect the individual curves.
In this study, we propose a way of aggregating quality flags to characterize screening results that is based on the Harrington-Derringer desirability concept 4,5 for multiparameter optimization. The concept of desirability was developed to allow optimization of a product or process subject to many potentially conflicting properties having different orders of magnitude. This new measure, the D-score, is a number on a 0 (poor) to 1 (good) scale, which can be attached to each IC50 result. The D-score is derived using a combination of different features of the dose-response data points and of the fitting process used to determine the IC50.
Within this article we review our analysis and explore some of the applications of the D-score. These include quality control of the whole screen and identification of potential issues and inconsistencies in the screening results, as well as generation of an effective number of replicates to assess the need for further experiments and modification of the summarization rules to estimate the average IC50 for a compound.
In the following section, we review our derivation of the D-score and show how we incorporated it in our data analysis. In the Results and Discussion sections, we examine our findings when applying this concept to in-house screening data and suggest further extensions and applications of this method.
Materials and Methods
Point and censored IC50s
The terms endpoint and IC 50 are used interchangeably throughout the text to denote the result of fitting experimental points to a sigmoid (4-parameter logistic) dose-response curve. We will mainly refer to the logarithm in base 10 of this quantity, the logIC50, rather than to the quantity itself.
Endpoint results can be classed as point or censored values. When the sigmoid curve can be fitted to the experimental points—and the fitted IC50 is within the range of doses used—then a point value is determined (e.g., IC50 = 10 nM). When a fit cannot be obtained or the fitted IC50 is outside the range of doses, the reported value is left censored if the IC50 is estimated to be at most the minimum dose (e.g., IC50 < 1 nM) and conversely right censored if the estimate is at least the maximum dose (e.g., IC50 > 1 µM).
It is clear that point and censored IC50s contain different kinds of information. One would be tempted to keep the point IC50s and ignore the rest. However, censored values provide valuable information as well, both for screen validation and compound activity evaluation. We have therefore taken both point and censored results into account for our study.
Desirabilities
The concept of desirability was introduced in 1965 to aid optimization of a product or process subject to many and potentially contrasting properties, for instance, a mixture of numerical and categorical parameters, measured on different scales. Desirability methods are flexible, are easy to interpret and to implement, and have become increasingly popular in drug discovery with applications to compound selection, 6-8 library design, 9 and the drug-ability of molecular targets. 10
The first step in defining a desirability score (or D-score) is to choose the n properties that affect the product’s formulation. Then, for each property i (i = 1 . . . n), its values are mapped to a function ranging between 0 and 1. This is the individual desirability index for the given property (Di), a mathematical expression of how varying the property affects its individual contribution to the overall goal. The D-score is a composite function of the individual Di, bound by construction to a 0 to 1 scale, where higher values represent more desirable characteristics. In our study, we chose a simple multiplicative formula:

Although several shapes have been proposed, there is no set prescription for which functional form to assign to each Di. The desirability indexes represent the practitioner’s judgment of how varying individual properties affects product quality. The same is true for the selection of the properties themselves. The key to constructing a D-score is to identify the properties and mappings that are relevant and meaningful for the goal and context at hand—domain expertise is an essential ingredient in this process.
D-score for point IC50s
When an IC50 fit is available, we can find information about the reliability of the endpoint estimate in the curve parameters and quality flags that are generated with the fit. These are the coefficient of variation of the fitted IC50 (CV), the variability of points around the fit (SD), the amount of curve available (CC), the number of free parameters in the curve (DoF), and the percentage of points excluded from the fit (Pexcl). These parameters are defined in Appendix A and Appendix B. At first glance, it would seem reasonable to use all these properties as components in the D-score. After examining and comparing a large number of curves, however, we observed that some of these properties are highly correlated. In particular, the CV is an expression of the actual fit and is therefore dependent on both the intrinsic scatter of experimental measurements and the amount of user intervention in the fitting procedure.
So we adopted the following approach: we first performed a range of numerical simulations on the CV at varying values of the other parameters, and then we used this information to correct the CV for its dependency on SD, DoF, and CC. We decided to consider Pexcl as an independent variable since, in practice, the decision to exclude points from a curve fit is made by analysts for reasons often unrelated to the quality of the fitted curve parameters.
The final form for the D-score for point IC50s is

where CV′ represents the corrected CV and is a function of SD, DoF, and CC. Dcv′ and Dexcl are the 2 desirability indexes. The derivation of CV′ and DCV′ is described in Appendix A, whereas Dexcl is defined in Appendix B.
Regardless of the specific method used to fit the curve and estimate the parameters such as the IC50 (or any other derived endpoint; e.g., IC80), as long as a standard error (and therefore a CV) is available, the D-score can be calculated.
D-score for censored IC50s
In some cases, the true value of the IC50 cannot be estimated from a sigmoid fit, and the result is stored as the right (left) dose boundary with an operator > (<) attached to it. This result carries no indication of how far from this boundary the endpoint is likely to be and how reliable this estimate is. So again we investigated whether it is possible to use the information contained in the dose-response curve and distinguish between (1) a truly inactive compound with a flat response (“flat liner”), (2) a small delocalized signal, and (3) a noisy response. Note that in this context, the highest D-score is assigned to the flat liner, as it represents stronger evidence that the true IC50 is indeed beyond the dose boundary.
In the absence of a sigmoid fit, we needed a different way to characterize the curve. Our rationale in this case was to choose curve parameters that were both straightforward to compute and discriminative enough between these 3 classes of results. The standard deviation of the response and the slope of the log dose-response points (fitted to a straight line) do separate out different types of results quite well. To illustrate this,

where s denotes the slope (straight-line fit), d the standard deviation, and m the mean of the response. The fourth term is identical to the one in the point D-score in (1) and takes care of the excluded points.

Censored IC50s only. Plot of the slope (s) of the log-dose response as fitted to a straight line versus the standard deviation (d) of the response for a typical screen. The curves have been grouped according to D-values as (
Clearly, there should be a continuum between the D-scores derived from the point and censored IC50s, therefore we have chosen the functions so that an IC50 from a typical curve with a point estimate at the end of the dose range matches one from an equivalent curve that just produces a censored value.
The mathematical formulation of the desirability indexes (2) is shown in Table 1 . For censored values, additional information about the expected directionality of the curve (increasing or decreasing) and the IC50 class (left or right censored) must be supplied to evaluate the D-score, as it affects the meaning of the result: for instance, a flat response centered around zero is consistent with a right-censored IC50 if the expected dose response is increasing.
Equations for the Components of the D-Score for Censored IC50s as Defined in Equation (2)

The symbols denote the slope of linear fit to response versus log dose (s), the standard deviation of the response (d), and the average value of the response (m). When the curve direction is decreasing, the sign of s is reversed before using it in the formula. For Dm, the definition of the variable t depends on the sign of the operator (< or > corresponding to left or right censored, respectively) and on the directionality of the dose-response curve. In addition, the value of factor is determined by the sign of t. All the possible combinations are shown in the table on the right.
Effective number of replicates
As part of assay development, a standard compound is routinely run on each assay plate to give a measure of the assay variability. This measure is then used to provide an optimal level of replication N for the assay. This number gives an indication of how many times we should test compounds in that assay to be confident that the geometric mean of the IC50s for each compound will be within 2-fold of the “true” IC50 value.
However, although the standard is often chosen at a potency that will generate a full dose-response curve and thus high D-scores, this is not true for all compounds. Therefore, the optimal level of replication for the standard will not generally be the same as the optimal N for other test compounds. If we view the D-score as a measure of how much meaningful information is contained in each IC50, then we can define an effective N (N*) relative to the standard compound as

where the ratio between the mean D-score for the test compound and for the standard compound is used as a scaling factor. A discussion of a possible use of the effective N is given in the Results section.
Summarization rules
Once data for N endpoints are collected, they are averaged (summarized) to yield an estimate of the true potency. We have investigated the usage of the D-score as a weight in calculating these averages to see the effect of taking into account the reliability of each IC50 determination in the summarization process. To further complicate matters, the N measurements do not always provide all point IC50 estimates. Indeed, about 25% of the data we examined in the present study (a figure that is consistent with previous tests over several screens) generate sets of IC50s that are mixtures of point and censored values or are made of censored values determined at different dose windows.
Accordingly, we have categorized the summarization groups (dose-response curves that are summarized to produce a mean IC50) as follows: (A1) all point values, (A2) all right censored, (A3) all left censored, (B1) point and right-censored values, (B2) point and left-censored values, and (C) both left-censored and right-censored values (with or without point values). Case (C) was encountered only in a handful of compounds, cannot be reliably summarized, and therefore has been excluded from this study. While case (A1) is straightforward, there is no hard-and-fast rule for treating (A2-3) and (B1-2). Here we have to deal with information of hybrid content, and we need a paradigm to determine the best operational estimate of the true IC50.
We estimate the average logIC50 (equivalent to the geometric mean of the IC50) over a number N of curves as the weighted mean of the individual logIC50s, using the D-scores as weights. We chose to divide the results into sets having the same dose window DW and IC50 class C (C = point, right censored, or left censored) and perform the summarization in 2 stages.
Let yij = logIC50j be the jth logIC50 (j = 1, . . ., Ni) in the ith dose window DW and class C combination (i = 1, . . ., k) and Dij the corresponding D-value. Then,


And then,


With this method, each (DW,C) set contributes exactly 1 average logIC50. The result ȳ in (4) is an estimate of the mean logIC50. When point and censored values are combined (sets B1-2), we also need to provide an estimate of the “mean” operator to assign to this endpoint. We choose the operator that contributes the most to the overall D-score of each summarization group by the following algorithm: (1) divide each summarization group into sets of different IC50 classes, (2) calculate the total contribution to D in each set, and (3) if the point set contributes more than half of the total D, then the mean logIC50 is deemed a point value; otherwise, the mean logIC50 is a censored value of the same sign (left or right).
We have compared our estimate to the mean logIC50 calculated using our current in-house algorithm (denoted as mean0 logIC50), which does not take curve quality into account, by computing the fold deviation Δ in the IC50 as the antilog of the absolute difference between the 2 means.

Results
Scoring of individual curves
Figure 2 shows examples of different types of curves—and different screens and compounds—leading to point ( Fig. 2A ) and censored ( Fig. 2B ) IC50 values for a range of D-scores. Curve A is an example of a high level of user intervention. There is a medium fit with CV = 42 and DCV′ = 0.6, but the score is sharply penalized by the removal of 47% of the points leading to Dexcl = 0.02. On the other hand, curve B represents a good free fit with CV = 13. Although 2 points were removed, this does not have much impact on the final score, as the shape of the desirability index for excluded points remains high for Pexcl <20%. Curve C has little noise but data for just over half a curve. In this case, the screeners chose not to fix the top, resulting in a free fit with a high CV = 57 and DCV′ = 0.4.

Examples of 6 dose-response curves generating (
Curves D, E, and F share the same published endpoint as right-censored logIC50 > −4.61. In curve D, we do have a signal, although slightly less than half the curve is present, whereas curve E is a flat liner with virtually no response. Our algorithm assigns a higher score to curve E as compared to D because the D-score for censored values evaluates the characterization of the endpoint, including the operator (>), and therefore curve E contains more information: the endpoint is more clearly outside the dose range. Curve F has been classified as noisy; the data are a long way away for the expected increasing dose-response curve and are thus scored very low. Note also that the IC50 had been classed as right censored by the analyst.
Although most scientists would agree on what a very good or a very bad result looks like, a higher level of subjectivity is usually attached to results of “medium” reliability because of the many competing factors contributing to the IC50s’ quality and because the true IC50 value is unknown in most real examples. The testing of the effectiveness of our approach therefore relied on detailed examination of screening results and on achieving consensus among the practitioners regarding the overall ranking of the curves. The usefulness of the present algorithm lies in its power to add context to the screening data so that ranking of screens and compounds and aggregation of results can be performed without the need to examine all the individual curves. In the following sections, we discuss some of these applications.
Screen analysis
The reproducibility of the activity of the standard compound is usually considered a good indication of the stability of an assay. Overall, the D-scores of standard compounds tend to be high (we observed a typical average D of around 0.8), and therefore their true activity can be expected to be very close to the measured one. This is not true for all test compounds. In general, we expect the D-score to provide a heuristic measure of how well we have characterized the activity (or lack thereof) of a compound by testing it under a given set of experimental conditions with a given fitting process. In the same way, the mean D-score of a screen can give us an indication of how suitable that screening procedure was to identify active or inactive compounds. To test the discrimination power of this measure, we have compared average D-scores taken over all dose-response curves for different screens and for different runs within the same screen. Figure 3A shows the distribution of the average D-score calculated separately for 26 screens. Figure 3B shows the same quantity evaluated for 435 individual runs within a single screen (for this screen, the average D-score is 0.6). In both cases, we observe a well-defined spread in the values of the average D-score, which, as expected, is more pronounced where individual runs rather than mean screen desirabilities are compared. Note the different levels of statistics as well as granularity: a run comprises of at most ~300 curves, whereas screens contain from 103 to 105 curves. Complementing the existing quality control tools with the D-score would therefore add context to quality control charts, enabling the analysts to both compare different screens and track over the course of an individual screen to identify unexpected outliers and trends that might otherwise be missed.

Distribution of the average D-score for (
Effective number of replicates
The effective N (denoted N*) can be viewed as the “real” level of replication achieved for the corresponding compound as opposed to the nominal N. When we determine a suitable level of replication N based on the standard, this will naturally apply to test compounds that give rise to IC50s with similar D-scores as the standard. If the test compounds generate IC50s with lower D-scores, we will need to increase the replication to produce the same amount of information. For example, if the assay replication is set at N = 4, we will need IC50s from 4 curves that are at least as good as the standard in terms of their D-scores. If the test compound has IC50s from poor curves, then more data for that compound will be needed to obtain the required precision in the estimated mean.
Figure 4 shows an example plot of N* versus N for a screen with 2994 test compounds. In this example, the average replication over the whole set of results for the screen is N̄ = 3.1, whereas the average effective replication is N̄* = 1.9. Of the compounds tested N = 3 times, 22% do not make this threshold when the D-score is taken into account. If any of the compounds where N* is very different from N are of interest to the medicinal chemists, then it is important to recognize the need to further characterize these compounds with additional experiments. In combination with the chosen structure-activity relationship (SAR) analysis strategy, comparing N to N* can provide a way to quickly highlight compounds in need of extra attention.

Plot of effective N (N*) versus the number of replicates N for a screen with 2994 test compounds. The diagonal line represents N = N*. The horizontal line separates compounds with N* above and below the recommended N = 3.
Alternative, standard-independent methods (such as the minimum significant ratio 11 ) have been developed to characterize the reproducibility of potency estimates. Although, in itself, the D-score is not a method for assessing inter- or intra-assay variability, it could potentially be used to add information to any summary statistic by acting as a weight and, for example, help differentiate between a scatter of results obtained from high-confidence or, conversely, from incomplete/noisy curves.
Summarized endpoints
Table 2 shows our results for the analysis of 10,915 compounds with N > 1 replicates and where individual IC50s are not all identical within a summarization group. Of these, 75% are made of curves where all the endpoints are point values (summarization group A1; see Materials and Methods). The remaining 25% consists mostly of right-censored values on their own or mixed with point values.
Results for the Analysis of the Effect of Summarization Rules for 10,915 Compounds from Different Screens

For each summarization group, the table displays the total number of compounds in the group (Num compounds), the percentage of compounds in the group with respect to the total number of compounds (%), the number of compounds with less than 2-fold deviation Δ (equation (6)) from the original summarization rules, and the average fold deviation (mean Δ) for the group. For instance, group A1 contains 8144 compounds, that is, 75% of the total 10,915. When the summarization rules described in Materials and Methods are applied to these compounds, 7969 of them do not show significant deviation from the results of applying the original summarization rules. The average departure of the results from the results of original summarization rules for this group is 1-fold, indicating no marked overall effect.
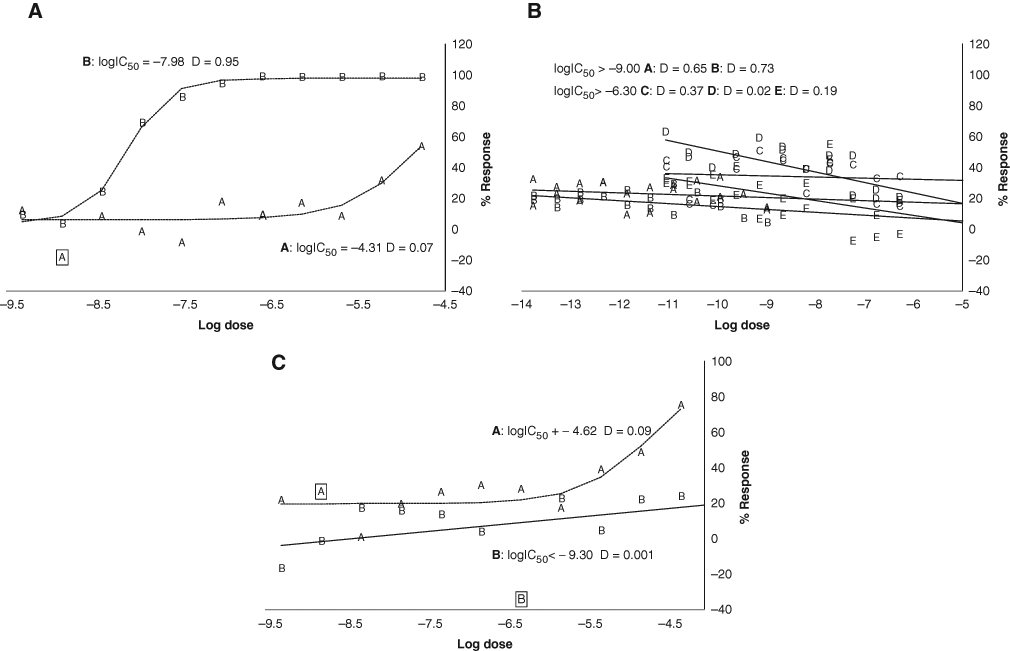
Examples of summarization groups. Points are labeled according to the curve they belong to: (
In case (A1) Δ from equation (6) is quite small and within 2-fold for 98% of the compounds. The main factor affecting its value is relative curve quality, and the averaging algorithm naturally biases toward better fits, as shown in Figure 5A . When dealing with all censored values (A2-3), our summarization method can significantly affect the result when compounds are tested at different dose ranges. This is exemplified by Figure 5B , where we show a compound with N = 5 tested at 2 dose ranges. The main reason for this difference is that the current rules select the highest logIC50 as the mean value, regardless of curve quality, whereas our method weighs the relative information provided by the different dose windows. Although none of the curves is perfectly flat or noise free, overall the curves at higher doses are less reliable, and therefore their contribution is weighted down. When the endpoints are summarized over data with mixed operators, in some cases our method assigned the same operator to the summarized result, but often it did not. Table 2 shows the results further divided according to whether the mean operator was consistent or not with the in-house algorithm. Although the deviations in the mean endpoint are not huge, obviously assigning a different operator has a potentially high impact in the interpretation of the result. The reason for this difference is again the relative curve reliability between different subgroups, as exemplified by Figure 5C .
In screening experiments, compounds may fail quality control for a variety of reasons. The corresponding results are generally not published in the database and therefore play no part in the average (weighted or not). In some instances, however, results that are suspicious from an experimental point of view may have been published. By using a weighted mean (using the D-score as a weight), these data are effectively excluded from summary measures. For instance, if there is a mixture of point estimates and censored values, the censored values will be downweighted if they come from curves such as Figure 2B(F). The D-score only uses the information available in the data and the curve fitting. Indeed, both a very low D-score and a mixture of point estimates and censored values may trigger an investigation into assay performance issues.
Discussion
Improvement in screening technologies and processes has meant that a large quantity of data can be delivered to scientists in a short time. Triaging biological activity results, however, is still a complex and error-prone task, and tools are needed to improve information extraction while optimizing the resources spent on screening and data analysis. We have investigated a methodology to combine existing information about the shape and quality of dose-response curves into a single score based on the Harrington desirability concept. The formulas to generate this score are easy to apply and provide a way to rank results, combine information from groups of experiments, and give a measure of how well a compound’s activity has been characterized experimentally.
Although objective measures underlie the derivation of the D-score, there is inevitably a degree of subjectivity that is introduced by the selection of which parameters best capture the screening experiment and how these parameters map onto the [0,1] range. Although other choices are possible, what is important is that these choices capture the essential features of the curve-fitting process and that the final score closely matches the screeners’ view of the data. Once the score has been validated against these requirements, it provides an objective and consistent way to compare IC50s across different screens and compounds, enabling scientists to isolate anomalous results and to focus attention on curves that require additional analysis. It is our experience during the validation phase that the score does indeed capture the analysts’ general view of the quality of the data they are routinely producing. Provided some basic attributes of the dose-response curve and its fitting parameters are available, this method can in principle be applied to any source of screening data, with potential use in the evaluation of data originating from external sources as the result of the outsourcing of screening activities or the merging of different organizations.
Footnotes
Appendix A
Appendix B
Appendix C
Acknowledgements
We thank Andreas Sewing, Graham Baker, Rachel Russell, Jerry Lanfear, Jian Wang, Frank Stühmeier, Andy Bell, Maria Flocco, Mark Gardner, and the primary pharmacology screening team at Pfizer Sandwich R&D for useful discussions and feedback. We thank the unknown referees for their comments and suggestions.