
Abstract
Identification of active compounds in high-throughput screening (HTS) contexts can be substantially improved by applying classical experimental design and statistical inference principles to all phases of HTS studies. The authors present both experimental and simulated data to illustrate how true-positive rates can be maximized without increasing false-positive rates by the following analytical process. First, the use of robust data preprocessing methods reduces unwanted variation by removing row, column, and plate biases. Second, replicate measurements allow estimation of the magnitude of the remaining random error and the use of formal statistical models to benchmark putative hits relative to what is expected by chance. Receiver Operating Characteristic (ROC) analyses revealed superior power for data preprocessed by a trimmed-mean polish method combined with the RVM t-test, particularly for small- to moderate-sized biological hits.
IDENTIFICATION OF ACTIVE COMPOUNDS IN high-throughput screening (HTS) contexts can be substantially improved by applying classical experimental design and statistical inference principles to all phases of HTS studies. Good experimental design at the data acquisition phase serves 2 broad purposes: (1) improves internal validity by reducing the possibility that observed effects have been caused by confounding factors and (2) minimizes unwanted variation in activity measurements stemming from human, biological, and equipment sources. Statistical methods at the data preprocessing (normalization) phase can further reduce unwanted variation, which cannot be controlled procedurally. At the inference phase, the magnitude of the remaining random error, inherent in any biological system, can be estimated by replicate measurements and taken into consideration when deciding which of the putative hits are sufficiently reliable to warrant follow-up. The information from the random error observed in a particular screen can also be used to estimate anticipated false-negative rates for future similar studies.
Although the advantages of statistical procedures for HTS were described more than a decade ago, 1 statistical treatment of HTS data is only now becoming more common as researchers search for ways to reduce false positives and false negatives. Various methods proposed to characterize the quality of screens 2-4 include: estimating of false-positive and false-negative rates as part of assay quality assessments, 5 removing bias within and across plates, 6-8 improving hit/nonhit ranking, 9 conceptualizing assay validation within a statistical framework, 10 and obtaining random error estimates for use in statistical tests to identify hits. 11,12 There remains a need, however, for elucidation of experimental design and data analysis principles tailored to HTS applications.
We extend our previous arguments 12 that popular methods for bias correction and inference are deficient and offer alternatives. We propose an analytical protocol that combines randomization, replication, and efficient statistical methods, allowing examination of model assumptions, calculation of p-values to benchmark putative hits, control of false-positive rates at levels specified by the experimenter, and an increase in true-positive rates for HTS applications.
Specifically, we use 4 data sets to compare various approaches for addressing unwanted variation in HTS measurements: experimental data obtained initially without randomization procedures (as is the case with most screening studies), a repeat of the experiment but with randomization procedures, a control experiment, and a dilution series. We counter the fundamental misunderstanding among many researchers that high correlations between replicate plates are desirable; we demonstrate why this typically reflects bias in the measurements rather than good biological reproducibility. We also show that normalization based on a trimmed-mean polish (TP) provides the desirable statistical characteristics of bias correction and measurement independence and performs better than Z-scores or B-scores. Finally, we show that TP scores, when combined with the RVM t-test approach, provide variance and p-value distributions that agree with theoretical expectations.
Methods
Experiment A: Nonrandomized immunofluorescent screen
Some 1120 chemical compounds were tested to determine if they correct the trafficking defect of the phenylalanine deletion mutant form of cystic fibrosis transmembrane conductance regulator (CFTR) protein ΔF508 (see supplementary information methods online). Fourteen 96-well plates were run in duplicate. Including incubation time, the screen was run in 4 days. Plates were processed in sets of 5, followed immediately by a duplicate set processed in the same sequence. Compounds that correct the mutant protein trafficking defect are detected by an increase in fluorescence (arbitrary units)—large measured values are more likely to be regarded as biologically valid hits.
Experiment B: Randomized immunofluorescent screen
This screen was the same as experiment A except for 2 aspects: processing order was randomized for all steps in the protocol, and replicates were obtained in 3 independent runs (i.e., blocks).
Experiment C: Measurement experiment
An inactive compound from experiment A was tested in all of the 80 middle wells of six 96-well plates. Plate processing order was randomized for all steps.
Experiment D: Dilution series in vitro translation assay
This experiment uses a different assay and target than the cystic fibrosis screen. A known protein synthesis inhibitor was arrayed within each of 6 replicated plates in 10 concentrations (0.0098, 0.0195, 0.039, 0.078, 0.1563, 0.2344, 0.3125, 0.4687, 0.625, and 1.25 µM). Four replicates of each of the 10 concentrations and 24 negative controls (DMSO) were randomly located in the 64 middle wells of 96-well plates. Positive controls (anisomycin at 50 µM) and negative controls (DMSO) were placed in alternating wells on the 1st, 2nd, 11th, and 12th columns. Firefly and renilla luciferase activity measurements were obtained for each well; low measured values corresponded to hits.
To circumvent the unrealistically high proportion (40/64) of true hits within each plate, we generated random samples from the data to mimic hit proportions that might be expected from a standard primary screen. Removing potential row and column biases with the TP score normalization method was deemed inappropriate for these data because differences among the rows and columns reflected biological differences in addition to any potential biases. Let i = 1,...., I rows; j = 1,...., J columns; and p = 1,...., P plates. Accordingly, the data were normalized as follows:
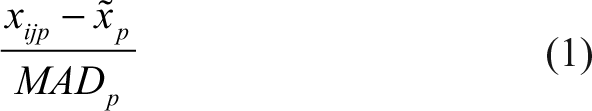
where xijp is the compound measurement corresponding to the well located in row i, column j, and plate p; x̃ p and MADp are, respectively, the median and the median absolute deviation of all measurements within plate p.
For each of 100 simulation runs, we randomly sampled (with replacement) 1120 normalized measurements from the empirical data set (14 plates × 80 values per plate). Some 1064 “nonhits” were sampled from the 144 negative control measurements (6 plates × 24 values per plate). Four consecutive concentrations were chosen. For each concentration, 14 hits were sampled from the 24 concentration-specific measurements (6 plates × 4 replicate values per plate), yielding a rate of true hits of 5% within each simulation run. We repeated this simulation for 3 different sets of concentrations (i.e., the 4 highest, the 4 lowest, and the 4 in the middle). Hits were identified according to various statistical criteria, and false-positive/false-negative rates were calculated (see Inferential Statistics section below).
Preprocessing statistics
We compared 3 non-control-based normalization methods. First, the Z-score method:
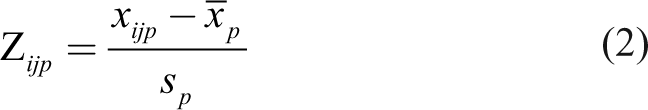
where xijp is the compound measurement corresponding to the well located in row i, column j, and plate p; x̃ p and sp are, respectively, the mean and the standard deviation of all measurements within plate p.
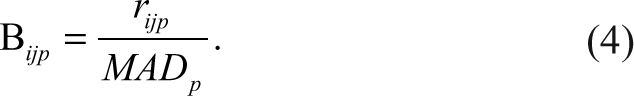
Second, for the B-score, the residual (rijp ) of the measurement for row i and column j on the pth plate is obtained by fitting a 2-way median polish 13 and is defined below as

The residual is defined as the difference between the observed result (yijp ) and the fitted value ( ŷijp ), defined as the estimated average of the plate (µ̂ p ) + estimated systematic measurement offset for row i on plate p (R̂ ip ) + estimated systematic measurement column offset for column j on plate p (Ĉ jp ). The median polish is an iterative algorithm that alternates row and column operations. Considering the rows first, for each row, the row median is subtracted from every element in that row. For each column, the median of the revised numbers is then subtracted from every element in that column. This continues until all medians are 0 or reach some predefined minimal difference from 0. For each plate p, MADp is the median absolute deviation of all residuals within the plate (rijp ). The B-score, without the smoothing function, 6 is calculated as follows:
Third, the TP(10) score method:
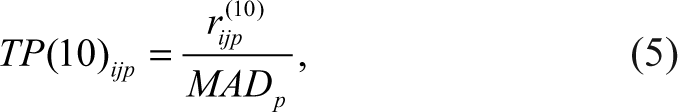
where rijp (10) are the residuals obtained by a 2-way polish 13 using the S-Plus (TIBCO Spotfire, Somerville, MA) 2-way function with trim = 0.10.
All 3 methods rescale measurements so that they are comparable across plates; in addition, the B-score and the TP score correct for row and column effects and are resistant to outliers. 6
Inferential statistics
The p-values to decide which compounds should be deemed as hits were defined using statistical tests on K replicates. For each compound measurement, a standard 1-sample t-test with K − 1 degrees of freedom was calculated as
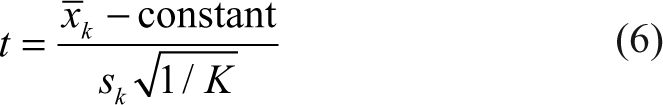
where x̃ k and sk are the arithmetic mean and the standard deviation, respectively, of the K replicated normalized measurements; the constant was taken to be zero. The ratio is then evaluated against a t-distribution with K − 1 degrees of freedom for estimation of associated p-values. Because of cost and time issues, the number of replicates is usually very small. As such, this test relies on imprecise estimates of variance and has corresponding low sensitivity (high false-negative rates).
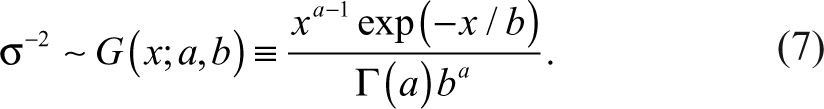
The RVM 1-sample t-test provides a compromise between the low sensitivity of the 1-sample t-test and the strong common error assumption of a 1-sample z-test. Compound-specific variances are assumed to follow an inverse-gamma distribution with parameters a and b as follows 14,15 :
We estimated the a and b parameters by fitting the sample variances to an F-distribution according to the maximum likelihood method described by Wright and Simon 15 :

The RVM t-test is calculated as
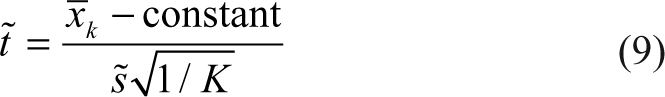
where
t̃ follows a t-distribution with K − 1 + 2a degrees of freedom. Note that variance ( s̃ 2) is estimated by a weighted average of the compound-specific variances s k 2 and an estimate (ab)−1 of the “typical” error variance underlying the error distributions of different compounds, with weights equal to (K – 1) and 2a, respectively. 12 This leads to an increase of 2a degrees of freedom over the standard t-test.
Results
Examination of raw data
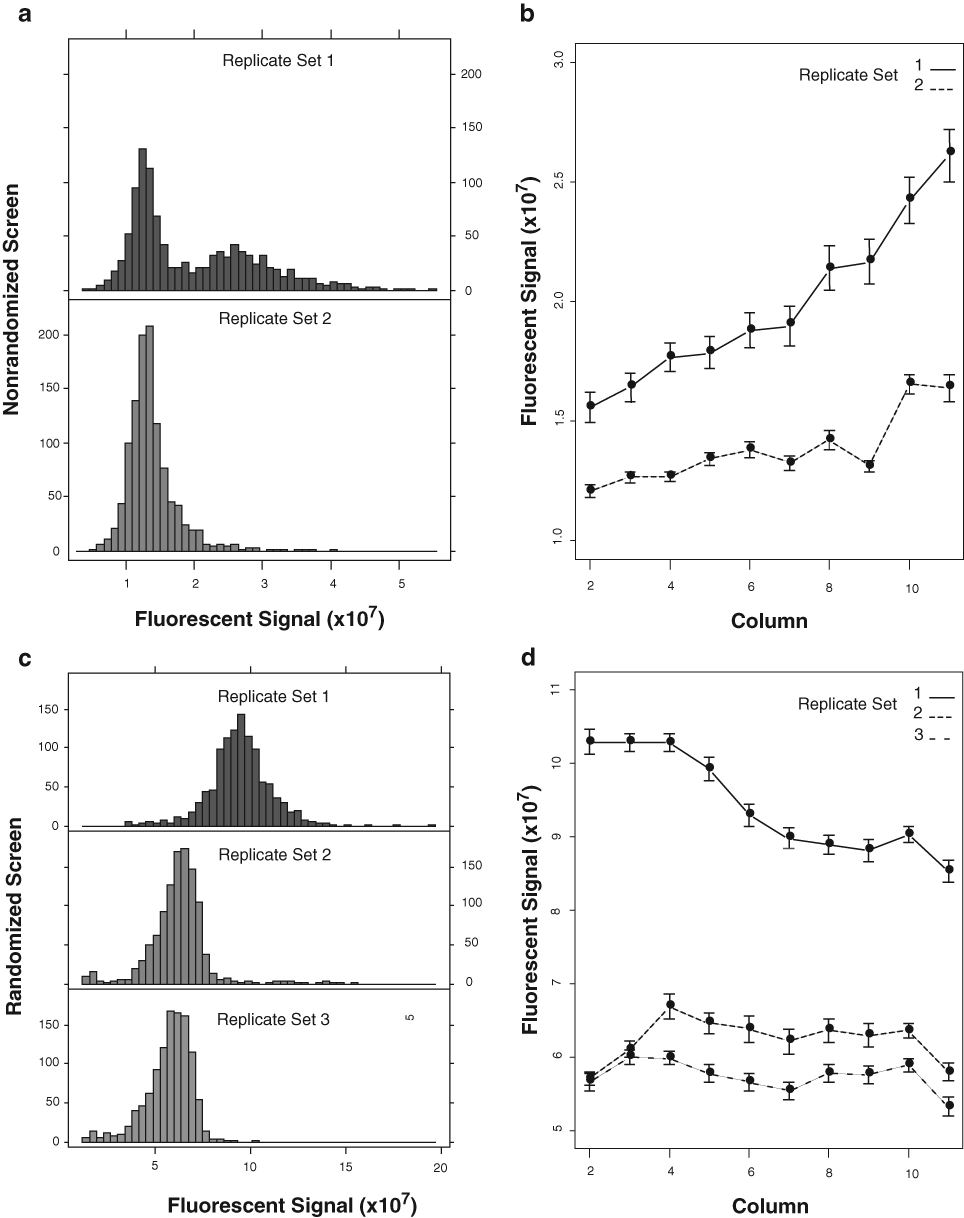
Graphical display of raw data for each replicate set of immunofluorescent screens. (
Data preprocessing
Unwanted variation in the measurements that cannot be controlled procedurally may nonetheless be minimized by appropriate normalization of the data (see Methods section for more details on the procedures).
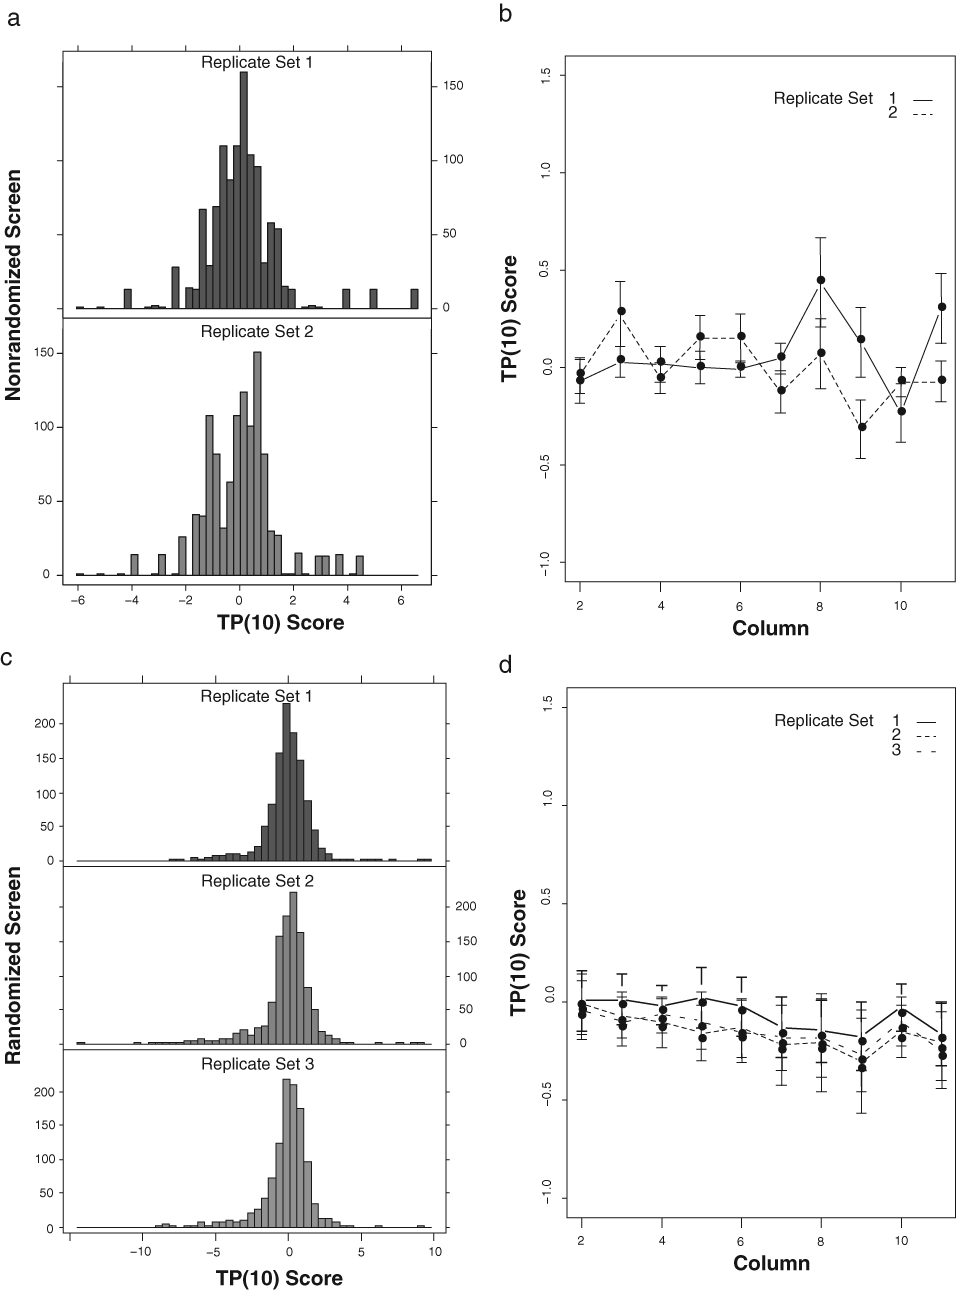
Graphical display of preprocessed data using the TP(10) score method. (
The advantages of TP(10) scores are illustrated further in
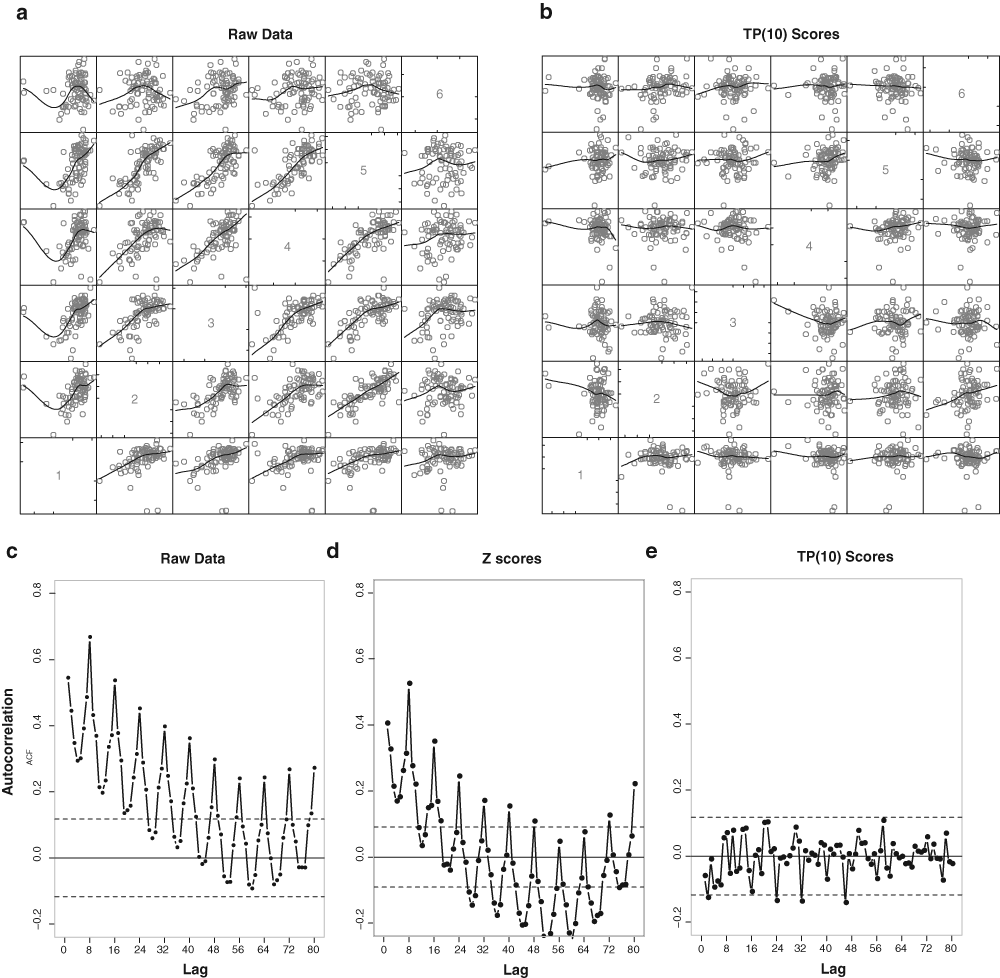
Pairwise scatter plots between plates for both raw and preprocessed data, for pairwise comparison of plates, from the measurement experiment (experiment C) in which the same compound was tested in all wells of 6 plates. (
Because Z-scores retain any row and column biases, they can generate nonnormally distributed data of various types even if the true underlying biological signals are normally distributed. Although B-scores correct these biases, they can transform normally distributed data into long-tailed distributions, producing excess numbers of false positives.
16
In agreement with these previous findings, both the Z-score and the B-score data produced nonnormally distributed data for the experiment C data (
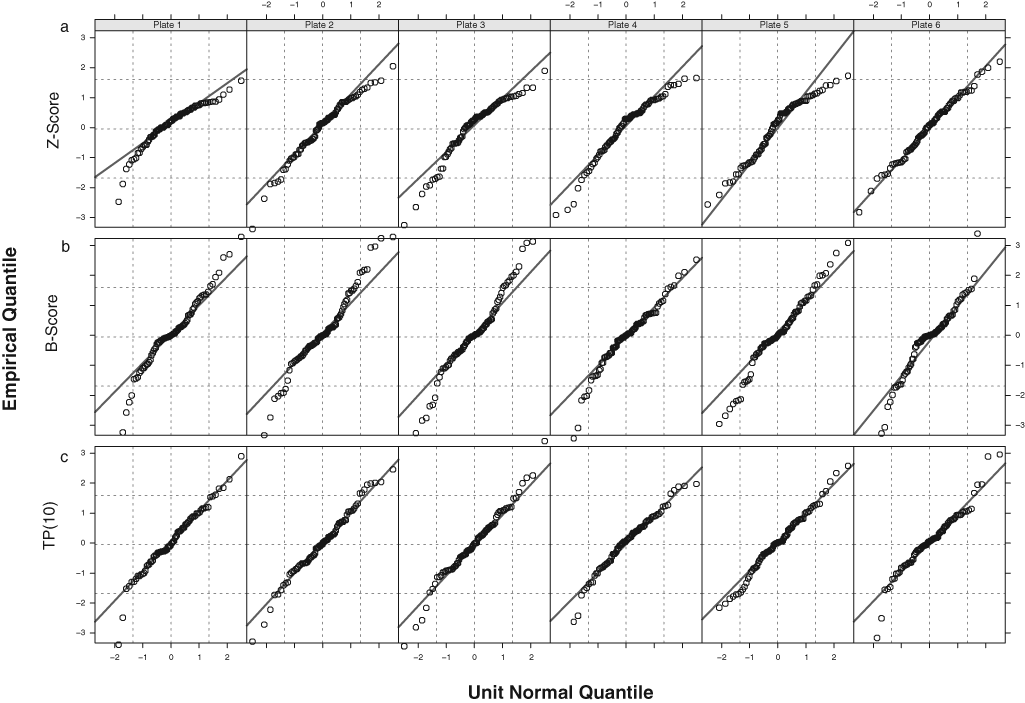
Normal QQ plots for the measurement experiment (experiment C) data show pronounced deviations from normality for (
Hit detection
One major advantage of replicates is that formal statistical models can be used to benchmark putative hits relative to what is expected by chance under the statistical model.
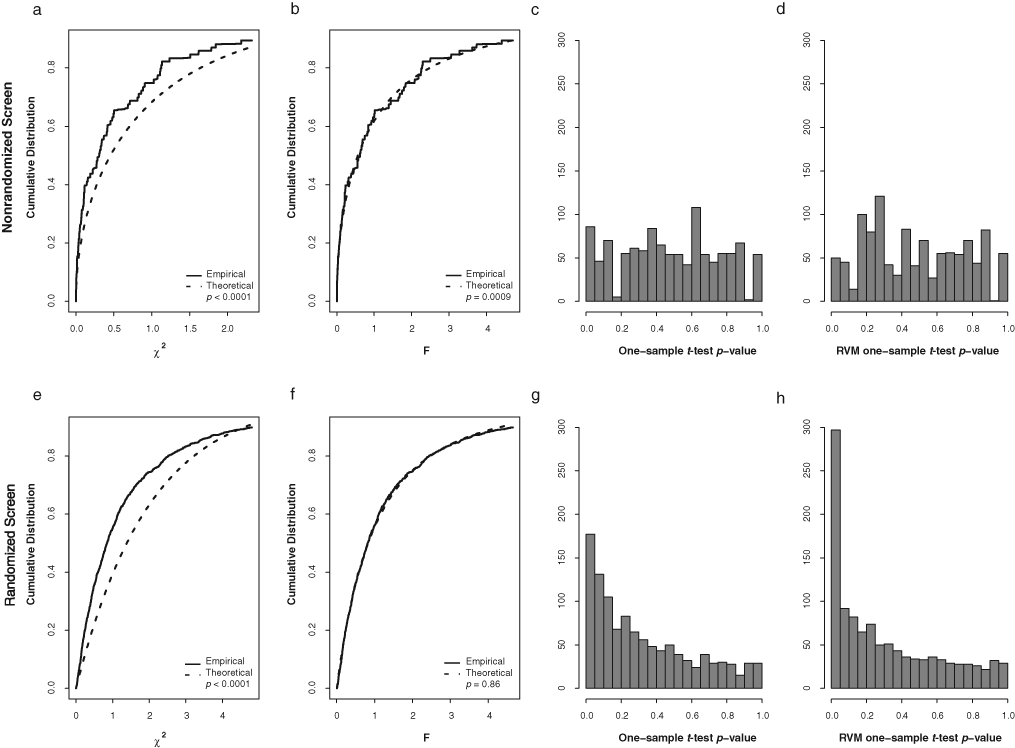
Checking of assumptions for statistical testing. (
As with our previous findings,
12
the distributions of sample variances did not conform to the constant variance assumption (chi-square distribution) implicitly assumed by the Z-score statistic applied to unreplicated data across compounds or across replicates for each compound for both the nonrandomized and randomized screens (
Other considerations
In the 2 immunofluorescent screens (experiments A and B), statistical hits were expected in both directions, and accordingly, we examined 2-tailed p-value distributions as a check of assumptions. Decrease of fluorescent signal may arise from a number of different causes. A compound may be toxic, remain in the cell during the experiment, and have the ability to quench the fluorescence of the tag on the secondary antibody or bind to the cystic fibrosis transmembrane regulator close to the location of the 3HA tag and mask the antibody binding site from the antibody detection. For the biological purposes of the studies, however, the interest lies in the activity measurements that correspond to high positive TP(10) score values (increase in fluorescence). Accordingly, it is appropriate to estimate 1-tailed p-values for hit detection, with the understanding that effects in the opposite (negative) direction will be ignored, no matter how large the effects might be.
Outliers among replicates threaten the validity of results obtained from statistical tests based on means (such as the ones employed here). Outliers are difficult to detect, however, when there are few replicates. One method to circumvent this problem in the current context is to investigate whether any of the replicate variances (rather than the individual fluorescent values) may be considered outliers. The advantage is that outlier variances are more readily detected because there are many variances distributed according to a known distribution under the RVM model used here. The idea is that compounds with individual replicate fluorescent outliers should have unusually large variances. The F-distribution (
Finally, interpretation of individual p-values needs to be understood within the multiple testing context. For example, 5% of the compounds are expected to have p-values ≤ 0.05 merely by chance. For the randomized screen, 9% of the individual p-values were ≤ 0.05, suggesting that hits are present (
Empirical demonstration of statistical power
We performed a dilution series experiment (experiment D: dilution series in vitro translation assay; see Methods) in which various concentrations of an active compound were randomly assigned well positions on a 96-well plate.
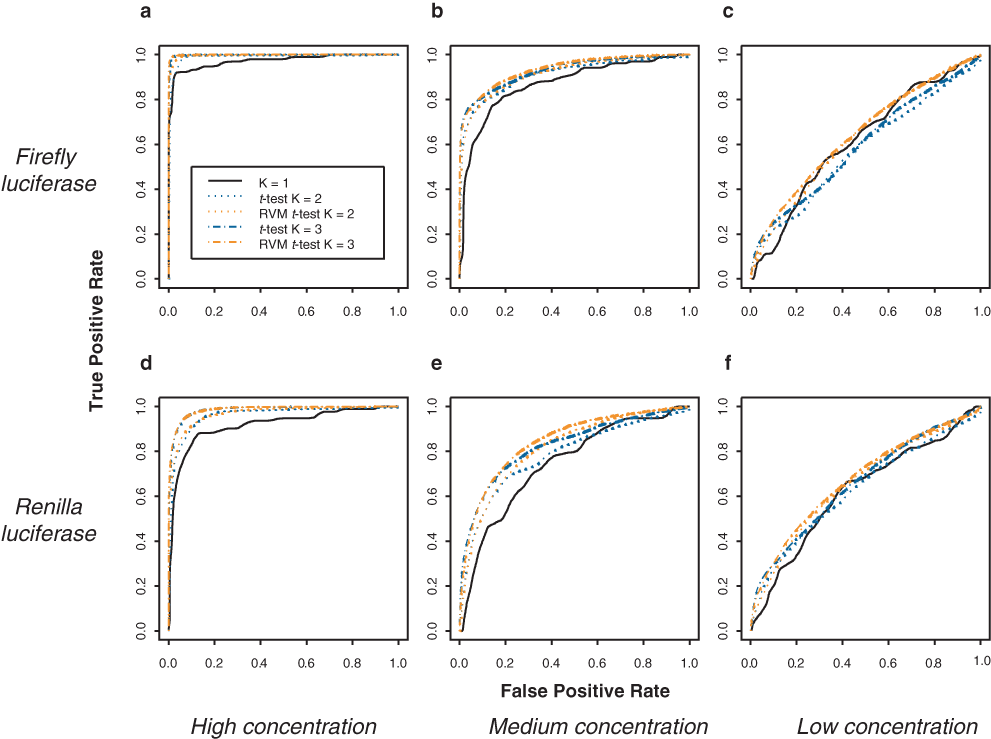
Receiver operating characteristic (ROC) curves to compare power achievable with various inferential approaches and various numbers of replicates. Data were generated according to a dilution series experiment (experiment D). The black line represents the rank ordering of activity measurements in the absence of replicates. The color curves illustrate the benefit of using statistical tests based on replicates. (
Discussion
We provide experimental design principles and statistical methods to improve hit detection in HTS. Our results illustrate that sensitivity and specificity of screens can be increased by (1) robust preprocessing of raw data that removes row and column effects and (2) statistical inferential methods based on replicates and that borrow strength from other compounds to improve variance estimates. Gains in accuracy and reproducibility that can be achieved by such an approach are especially noteworthy for decreasing the false-negative rate among low- to moderate-sized biological hits.
For unavoidable sources of variation, we recommend randomization and blocking of processing steps to provide the means to make valid assessments of compounds’ activity levels by minimizing the effects of potential confounds such as processing order. To reduce differences across blocks and thus increase precision, we adopted the rule to “block what you can and randomize what you cannot” 18(p93) (see also Box 19 ). In the immunofluorescence randomized screen, for example, we defined a block as a replicated run, and we randomized plate processing order within each run.
Various exploratory graphics 20 of raw and preprocessed data allow assessment of measurement adequacy before performing further statistical analysis. We suggest examining data distributions to check against gross measurement errors. Plots of plate and row/column means can highlight a frequent source of bias that can be minimized by robust preprocessing methods such as the TP score. Autocorrelation plots can provide checks for measurement independence. Scatter plots of replicate plates can reveal biases in the measurements. It is essential in all of these methods to compare the observed data to measurement expectations.
In Malo et al., 12 we argued in favor of non-control-based normalization methods and specifically recommended the B-score procedure. 6 We have noted more recently, however, that the B-score can potentially generate excessive false positives because normally distributed null data generate long-tailed B-score distributions. 16 We propose the trimmed-mean polish as an alternative to the B-score, which has good robustness and superior distributional properties with normally distributed data. In this study, we used a trim value of 10%, although higher trim values should be used if more than 10% true hits are expected within some columns or rows (to a maximum of 50%, the value used by the B-score method).
With replicates, the significance threshold for hit identification can be based on p-values offering the advantage of understanding the probability of what is expected by chance alone. The RVM approach we used here is particularly well suited for HTS applications with few replicates. As in the early days of microarrays, HTS researchers have begun to use duplicate measurements as recommended by screening centers such as the Harvard Medical School Screening Center (http://iccb.med.harvard.edu/screening/guidelines.htm).
Triplicate measurements, however, offer several advantages over duplicates. With triplicates, undesirable outlier measurements can be detected and corrected before the statistical analyses are performed to improve sensitivity and specificity. Triplicate measurements and the RVM approach may be less necessary when the primary goal of a study is to determine large effects (“low-hanging fruit”). The substantial increases in statistical power afforded by these methods gain in importance, however, when there is interest in detecting small to moderate effects (e.g., when screening small molecular fragments with the objective of identifying small fragments with modest biological activity). For the t-statistic, one additional replicate provides large gains when sample sizes are small. For example, the critical t-value 5% false-positive threshold for identifying a hit with a 1-sample t-test with 2 replicates is 12.7, whereas the threshold for 3 replicates is 4.3. Lesser gains are observed for 4 and 5 replicates (thresholds of 2.57 and 2.28, respectively). Additional degrees of freedom can be achieved with the RVM t-test, which acts as a proxy for adding replicates. 12,14,15,21
High-throughput biotechnologies present challenges and opportunities for statistical inference relative to the more traditional low-throughput contexts. The typically small number of replicates available contravenes the standard statistical practice of obtaining larger sample sizes. Conversely, the very large number of features (compounds, genes, etc.) present in high-throughput studies can be leveraged, for example, through empirical Bayes approaches such as the RVM model. Our results suggest that in addition to these analytical considerations, researchers need to consider randomization as an integral part of the screening process. Ultimately, consensus on the merits of specific pre-preprocessing, statistical inference, and study design methods will be decided by their respective performances in applied contexts.
Footnotes
Acknowledgements
We thank Janie Lapointe for generating the randomized and the nonrandomized screen data.
This work was supported by the “Informatics and Chemical Genomics” funding to RN under the Genome Quebec Phase II Bioinformatics Consortium program and Le Fonds Québécois de la Recherche sur la Nature et les Technologies (FQRNT) grant 119258 (Statistical Methods for High-Throughput Screening).
References
Supplementary Material
Please find the following supplemental material available below.
For Open Access articles published under a Creative Commons License, all supplemental material carries the same license as the article it is associated with.
For non-Open Access articles published, all supplemental material carries a non-exclusive license, and permission requests for re-use of supplemental material or any part of supplemental material shall be sent directly to the copyright owner as specified in the copyright notice associated with the article.