
Abstract
Tumors that display a highly metastatic phenotype contain subpopulations of cells that display characteristics similar to embryonic stem cells. These cells exhibit the ability to undergo self-renewal; slowly replicate to retain a nucleoside analog label, leading to their definition as “label-retaining cells”; express specific surface markers such as CD44+/CD24–/low and CD133; and can give rise to cells of different lineages (i.e., they exhibit multipotency). Based on these characteristics, as well as their demonstrated ability to give rise to tumors in vivo, these cells have been defined as tumor-initiating cells (TICs), tumor-propagating cells, or cancer stem cells (CSCs). These cells are highly resistant to chemotherapeutic agents and radiation and are believed to be responsible for the development of both primary tumors and metastatic lesions at sites distant from the primary tumor. Established cancer cell lines contain CSCs, which can be propagated in vitro using defined conditions, to form 3D tumor spheroids. Because the vast majority of studies to identify cancer-associated genes and therapeutic targets use adherent cells grown in 2 dimensions on a plastic substrate, the multicellular composition of these 3D tumor spheroids presents both challenges and opportunities for their imaging and characterization. The authors describe approaches to image and analyze the properties of CSCs within 3D tumor spheroids, which can serve as the basis for defining the gene and protein signatures of CSCs and to develop therapeutic strategies that will effectively target this critically important population of cells that may be responsible for tumor progression.
Keywords
Introduction
S
Materials and Methods
Cell lines and conditions
The MARY-X tumor spheroids were derived from the only xenograft model currently available that recapitulates inflammatory breast cancer in patients, as previously described, and are of the luminal B breast cancer subtype. 11-14 The SUM149 and SUM190 cell lines were developed from patients with inflammatory breast cancer and were generously provided by Dr. Stephen Ethier (Wayne State University, Detroit, MI). 7,15,16 SUM149 cells are of the basal-like breast cancer subtype, and SUM190 cells are of the luminal B breast cancer subtype. MARY-X tumor spheroids and SUM149 and SUM190 inflammatory breast cancer cells were cultured at 37°C under 5% CO2 in a humidified incubator. For low-adherence culture conditions, cells were plated into ultra-low attachment plates (Corning Life Sciences, Salt Lake City, UT) and maintained in mammary epithelial basal medium (MEBM®; LONZA, Hopkinton, MA) supplemented with 10 mL B27 (Invitrogen, Carlsbad, CA), 20 ng/mL epidermal growth factor (EGF; Invitrogen), 20 ng/mL basic fibroblast growth factor (bFGF; Invitrogen), 4 µg/mL heparin (Sigma-Aldrich, St. Louis, MO), and 2 mM L-glutamine to enrich for tumor spheroid formation.
Stabilization of 3D tumor spheroids
Tumor spheroids consisting of the SUM149 breast cancer cell line that contained stably transduced luciferase–IRES–green fluorescent protein (GFP), designated as SUM149-GFP, were stained with 5 µM of MitoSOX Red (Invitrogen) and with 20 µM of the nuclear stain DRAQ5™ (Biostatus Ltd., Leicestershire, UK). Cells were incubated at 37°C for 10 min followed by washing twice with phosphate-buffered saline (PBS). CyGEL™ (Biostatus Ltd.) was prepared for use as described by the manufacturer, cooled on ice, and made isotonic by addition of 40× PBS. CyGEL™ was added to the 3D SUM149-GFP tumor spheroids, and then cells were loaded onto cooled slides. Doubled-sided tape was used between the slide and coverslip to maintain the shape of the tumor spheroids. Imaging was performed using a confocal laser scanning system (LSM 510, Carl Zeiss, Peabody, MA;
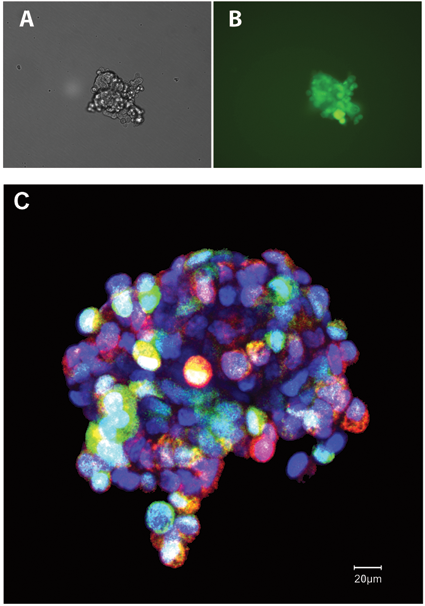
Stabilization of 3D tumor spheroids. (
Detection of CD44+/CD24–/low markers
To detect the presence of CD44 and CD24 surface markers, we fixed MARY-X tumor spheroids in cold methanol/acetone (1:1) for 20 min. Fixed tumor spheroids were then incubated with 1% normal donkey serum diluted in PBS for 30 min to block nonspecific antibody binding. Cells were incubated with antihuman CD44 (clone 515, phycoerythrin [PE] conjugated; BD Pharmingen, San Jose, CA) and antihuman CD24 (clone eBioSN3, fluorescein isothiocyanate conjugated; eBioscience, San Diego, CA) for 45 min. The nuclei were counterstained with the DNA dye, Hoechst 33342 (5 µg/mL; Sigma-Aldrich). The stained cells were imaged on a Nikon fluorescent microscope with a Roper camera and MetaVue software (Universal Imaging Corporation, Downington, PA). A representative phase contrast image of a multicellular MARY-X tumor spheroid is shown in
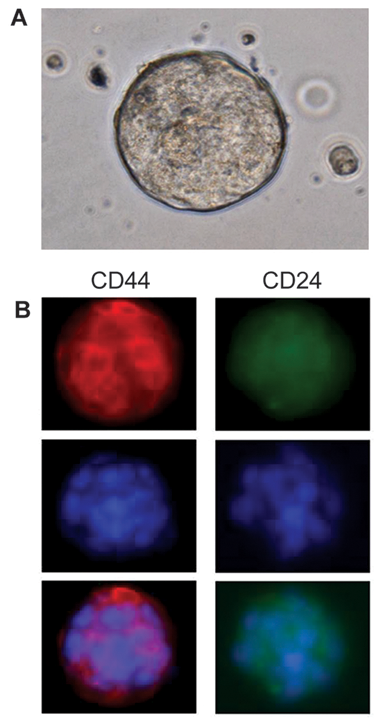
Imaging of CD44/CD24 surface markers on 3D tumor spheroids. (
Clonogenic growth as a surrogate marker of self-renewal activity of cells within 3D tumor spheroids
The ability of CSCs to exhibit self-renewal can be analyzed based on the ability of a single CSC to give rise to a clone of cells, defined as clonogenic growth, over a period of 14 to 21 days. To analyze clonogenic growth, we maintained single-cell suspensions of SUM149 breast cancer cells as described above. After 7, 14, and 21 days in culture, 0.5% thiazolyl blue tetrazolium bromide (MTT; Sigma-Aldrich) was added to each well to visualize colonies formed by single cells, and samples were returned to the incubator for 1 h. Colonies derived from single cells were identified and quantitated using an Oxford-Optronix GelCount automated mammalian cell counting instrument (Sarasota, FL), and data were analyzed using GelCount software. As an example of the utility of clonogenic assays, studies were performed to assess the effects of the histone deacetylase (HDAC) inhibitor, suberoylanilide hydroxamic acid (SAHA), on clonogenic growth of breast cancer cells. Single-cell suspensions of SUM149 breast cancer cells were treated with either DMSO as the solvent control or with SAHA at concentrations of 0.25, 0.6, 1.2, 2.5, 5, and 10.0 µM, with each concentration run in triplicate. After 10 days in low-adherence culture conditions, tumor spheroids were labeled as described above, spheroid formation was measured by GelCount analysis of MTT staining, and data were analyzed using GelCount software.
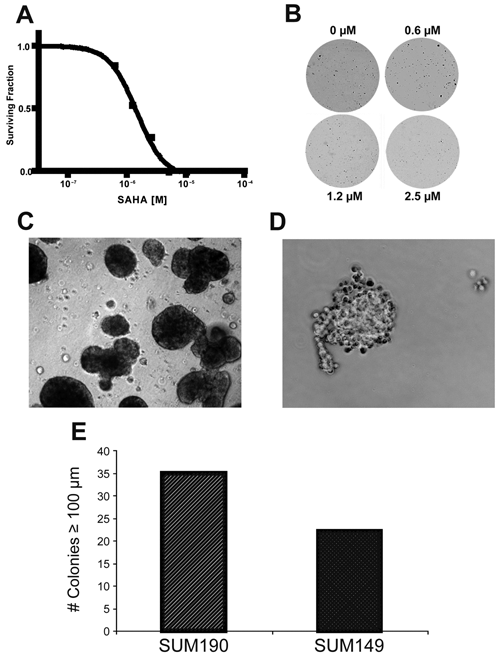
Imaging clonogenicity of tumor spheroids as a measure of self-renewal capacity. (
Clongenicity assessed by analysis of anchorage-independent growth in soft agar
An alternative approach to the assessment of clonogenicity based on clonal efficiency is to analyze the ability of single-cell suspensions of tumor cells to form colonies in a soft agar semisolid medium. Anchorage-independent growth of tumor cells disassociated from tumor spheroids was assessed by seeding cells into 6-well culture plates containing a base of 2 mL MEBM® medium containing 1% fetal bovine serum (FBS) and 0.5% agar in each well. Cells were disassociated from SUM149 and SUM190 cells and were plated into 6-well culture dishes containing the base of media, serum, and 0.5% agar using a cell concentration of 5 × 10⁴ cells diluted in 2 mL of media containing 1% FBS and 0.35% agar. Plates were viewed twice weekly using phase contrast microscopy to determine time of visible colony growth. Studies were terminated at 14 to 21 days after seeding depending on the size of the colonies. Colonies were viewed and photographed, and the number and size of colonies were quantitated. Colonies developed from single cells were imaged using light microscopy, and a representative image of clones developed from SUM149 and SUM190 tumor spheroids is shown in
Identification of label retaining cells within tumor spheroids
SUM149 tumor cells were cultured to approximately 75% confluence in adherent culture and then incubated with 5 µM EdU (Invitrogen) in F12 media (Invitrogen) supplemented with 10% FBS, 5 µg/mL insulin (Sigma-Aldrich), 1 µg/mL hydrocortisone (Sigma-Aldrich), and antibiotic/antimycotic (Invitrogen) for 4 h at 37°C. Cells were washed 4 times with Hank’s balanced salt solution (HBSS), fresh media containing serum and supplements were added, and cells were cultured overnight. Cells were treated with trypsin to remove from culture plates, followed by treatment with soybean trypsin inhibitor (Sigma-Aldrich), and then maintained as tumor spheroids as described above. Cells were then filtered through a 40-micron filter and resuspended in MEBM® at a density of 25,000 cells/mL in ultra-low-adherence plates, and cells were allowed to grow for 7 or 14 days. Resultant tumor spheroids were placed onto slides using a cytospin cell centrifuge at 400 rpm for 3 min, and slides were air dried. Slides were rinsed with PBS, fixed in 4% paraformaldehyde diluted in PBS for 15 min at room temperature, and then washed in 3% BSA in PBS 3 times for 5 min. Cells were permeabilized using 0.5% Triton X-100 in PBS for 20 min at room temperature, followed by 3 consecutive washes in 3% BSA diluted in PBS. The “Click-iT” reaction cocktail (Invitrogen) was added to the cells using the manufacturer’s instructions and incubated for 30 min at room temperature, followed by 3 washes in PBS. Cells were then incubated with the DNA dye TO-PRO-3 (Invitrogen) at a dilution of 1:300 in PBS for 15 min. Slides were then washed 3 times for 10 min each in PBS, mounted in Vectashield mounting medium (Vector Laboratories, Burlingame, CA), and examined using fluorescence microscopy. Images were captured using a confocal laser scanning system (LSM 510, Carl Zeiss) at a 60× magnification. Z-stack images were collected through whole-tumor spheroids, and images were analyzed using Image J software and Adobe Photoshop.
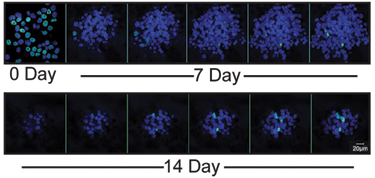
Identification of label-retaining cells within 3D tumor spheroids. Confocal microscopy images of SUM149 cells within 3D tumor spheroid colabeled with the nucleoside analog EdU and TO-PRO-3 DNA dye at time zero. Over 7 to 14 days in low-adherence culture conditions, SUM149 tumor spheroids decreased in size, along with a decrease in the numbers of cells within the SUM149 tumor spheroid that retained both the EdU label and DNA dye. Quantitation of the cells that retained both EdU and DNA dye reveals that the “label-retaining cells” were 70% at time zero and 4% of the total population of cells within multicellular tumor spheroids at day 14.
Identification of bipotent CSCs within 3D tumor spheroids
SUM149 tumor spheroids were cultured in low-adherence culture as described above, maintained in culture for 7 to 14 days, and isolated and prepared for imaging by cytospin centrifugation onto slides at 300 rpm for 3 min; cells were rinsed with PBS and fixed in 4% paraformaldehyde diluted in PBS for 15 min. Slides were washed 3 times with PBS for 5 min each, and cells were then permeabilized using 0.1% Triton-X 100 in PBS for 5 min. Slides were then incubated in 5% normal goat serum diluted in PBS for 1 h to block nonspecific antibody binding. Slides were incubated with primary Cytokeratin (CK) 18 antibody (Clone DC10, Neomarkers, Fremont, CA) at a dilution of 1:500 and CK14 antibody (Clone AF64, Covance, Vienna, VA) at a dilution of 1:500 in PBS overnight at 4°C. Slides were washed 3 times with PBS and then incubated with either goat antimouse Alexa Fluor® 488 at a dilution of 1:400 for 60 min for detection of CK18 or with goat-antirabbit antibody conjugated to Alexa Fluor® 568 at a dilution of 1:400 for 60 min for detection of CK14. Slides were washed in PBS 3 times for 5 min each, incubated with TO-PRO-3 (Invitrogen) in PBS at a dilution of 1:300 for 15 min, washed 3 times for 10 min each in PBS, mounted in Vectashield mounting medium, and analyzed using a confocal laser-scanning microscopy system. Z-stack images were collected and projections were generated using Image J software.
17
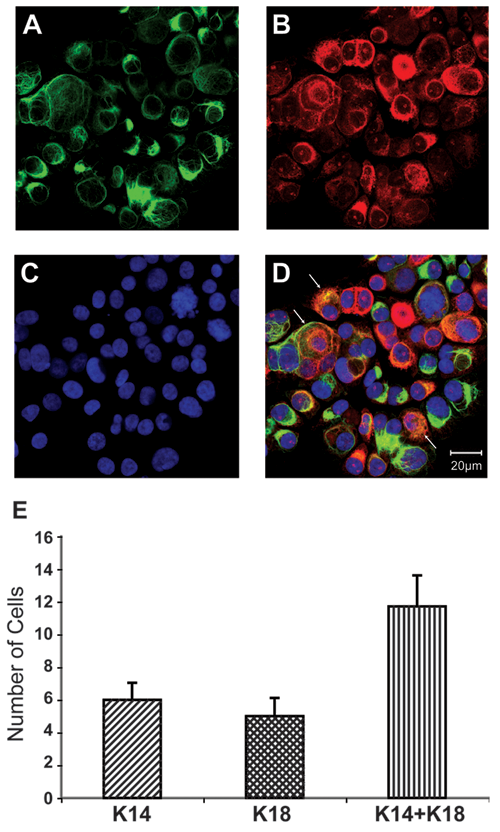
Imaging bipotent cells within 3D tumor spheroids. Confocal microscopy images of (
Results and Discussion
Stabilizing 3D tumor spheroids for live-cell imaging
The first challenge in imaging tumor spheroids is to stabilize the 3D multicellular structures that will allow high-quality images to be captured and analyzed. Because the 3D tumor spheroids are in liquid media and are not adhered to a substrate, tumor spheroids are difficult to image when floating as free spheroids.
Identification of CD44+/CD24–/low-expressing cell subpopulations within tumor spheroids
CSCs have been shown to exist as relatively rare subpopulations within the bulk of tumor cells in a variety of different tumor types, including breast tumors, that can initiate tumors when injected into mice and appear to play a role in the development of distant metastasis.
1,2,7,21,22
CSCs have been identified and quantitated based on the presence of specific surface markers, including CD44+, with a loss or lower level of expression of CD24, and epithelial-specific antigen.
1,7
CD44 is a cell surface glycoprotein that functions as a hyaluronic acid receptor and is involved in cell-cell interactions. CD24 is also a glycoprotein but is expressed on cells with a more differentiated phenotype. A representative phase contrast image of a MARY-X tumor spheroid is shown in
Numerous studies have now confirmed that cells expressing CD44+/CD24–/low are associated with a metastatic phenotype, suggesting that there is clinical relevance for characterization of CSCs expressing CD44+/CD24– surface markers. 21,22 Although CD44 appears to be a marker for less differentiated cells within solid tumors that can initiate tumors and have a role in development of metastatic lesions, interestingly, there is evidence that CD24+ tumor cells have phenotypic plasticity and can undergo alterations that result in their having increased expression of the CD44 surface marker. 23 Approaches to image CSCs in 3D are currently of great interest for their potential utility in identifying individual cancer patients who have tumors with very aggressive phenotypes, with the potential of developing individualized therapeutic strategies for each cancer patient based on definition of the characteristics of their tumor, including the expression of surface markers characteristic of CSCs. Although there certainly remains considerable controversy about the importance and role of individual markers expressed by putative CSCs, there is no doubt that imaging approaches will remain critical to defining the role of these putative stem cells in tumor development and metastasis. Although flow cytometry remains the gold standard for characterization of CSCs that express specific cell surface markers associated with an aggressive phenotype, the disassociation procedures required to obtain single-cell suspensions for flow cytometric analysis result in loss of information about cell-cell interactions and the position of specific cells within 3D tumor spheroids.
Identification of cells capable of self-renewal
One well-characterized trait of CSCs is their ability to undergo self-renewal, which maintains the CSC population and, in some cases, can result in expansion of the pool of CSCs.
7
Self-renewal can be determined based on analysis of clonogenicity of single cells disassociated from 3D tumor spheroids and based on analysis of growth of anchorage-independent clones in a semisolid soft agar medium. The first method to quantitate self-renewal of CSCs is based on analysis of the ability to cells to exhibit clonogenicity, which is defined as the ability of a single cell to form a multicellular colony. The resultant formation of colonies derived from a single cell can be imaged and counted using an instrument that functions as an optical counter, in this case, the Optronix GelCount instrument.
Another assay that has been used to assess the ability of cells to exhibit self-renewal is the quantitation of cells seeded as single cells that grow as anchorage-independent colonies in a semisolid medium such as soft agar. Anchorage-independent growth is an assay that has been used as a gold standard to assess clonogenic growth over the past 3 decades.
24
In addition to the utility of these methods to image and analyze cells capable of self-renewal, the use of the soft agar assay provides a means to expand specific populations of cells capable of exhibiting self-renewal isolated from primary tumors, pleural effusion aspirates, and tumor cells within bone marrow aspirates of patients or circulating tumor cells isolated from serum of patients bearing solid tumors. These methods provide the capability to expand populations of cells with self-renewal characteristics, which allows for their subsequent isolation and characterization of the genomic, proteomic, and microRNA signatures of these rare populations capable of self-renewal that are often resistant to conventional therapies and radiation and have been demonstrated to be involved in both development of primary tumors as well as metastatic disease.
Imaging and quantitation of label-retaining cells within 3D tumor spheroids
Similar to embryonic stem cells, CSCs have a very slow turnover time and therefore can take up and retain a DNA label, which has resulted in their definition as label-retaining cells.
27,28
These slowly cycling cell populations have routinely been identified and quantitated in vivo based on analysis of the kinetics of the retention of nucleosides such as 3[H]-thymidine or the nucleoside analog bromodeoxyuridine (BrdU).
29
For in vitro studies, label-retaining cells have most commonly been detected and quantified using flow cytometry and/or confocal microscopy with antibody-based detection of the incorporation and retention of BrdU.
30-32
More recently, another nucleoside analog, 5-ethynyl-2′-deoxyuridine (EdU), has been shown to be useful to identify and quantitate cells that incorporate nucleoside analog into their DNA and retain it over long periods of time (>10 days) in vitro.
33,34
EdU is incorporated into the DNA of cells in the S phase of the cell cycle and can be detected using “click” chemistry, which is a relatively new chemical system based on a copper catalyzed covalent chemical reaction between an azide and an alkyne.
35-38
This reaction has proven very useful in allowing the irreversible attachment of small molecular probes to a wide array of biomolecules for in vitro analysis of multiple parameters. For this protocol, the EdU solution contains the alkyne, and the dye of choice, such as Alexa Fluor® 488 dye, contains the azide. There are several advantages to using EdU labeling combined with click chemistry compared to using antibody-based detection of BrdU. To allow access of anti-BrdU antibodies into the nuclear DNA containing incorporated BrdU, extensive denaturation by acid, heat, and/or enzymatic treatment with DNAse is required. The denaturation steps required for detection of BrdU incorporation can lead to significant distortions of cell morphology and are not readily amendable to imaging and analysis of label-retaining cells in multicellular 3D spheroids. In contrast, the small size of the dye azide allows for efficient detection of incorporated EdU with no denaturation requirement. The protocol from the manufacturer of the EdU Click-iT detection system (Invitrogen) uses a standard paraformaldehyde-based fixation and permeabilization with the detergent saponin, which allows the detection reagent to rapidly stain EdU incorporated into DNA without alterations in cell or nuclear morphology. This staining protocol is compatible with cell cycle dyes and can be multiplexed with antibodies against both surface markers as well as with intracellular markers. The detection of EdU using this approach allows assays to be multiplexed, with a choice of fluorescent probes that can be used for detection of label-retaining cells in combination with detection of multiple other surface and intracellular markers. Currently, EdU incorporation using click chemistry detection methods cannot be used for live-cell imaging, but there are now approaches using copper-free click chemistry reactions that have been shown to be useful for labeling live cells for in vivo imaging.
39,40
With the continued improvements in the detection systems using click chemistry, it will likely be a very short time before we can detect multiple parameters, including label-retaining cells, among live cells within multicellular 3D spheroids. Our studies using EdU and click chemistry demonstrate that this approach provides a facile means to use confocal imaging to quantitate label-retaining cells within 3D SUM149 tumor spheroids over a period of 14 days.
Imaging approaches to characterize multipotency of CSCs within 3D tumor spheroids
In addition to self-renewal, tumors that exhibit a highly metastatic phenotype also exhibit the ability to give rise to phenotypically diverse progeny that are within other lineages, consistent with the hierarchy of the tissue of origin.
7
As an example of approaches to assess the multipotency of CSCs derived from established breast cancer cell lines, 3D SUM149 tumor spheroids were stained with antibodies directed against CK18, which identifies breast cancer cells within the luminal lineage, and with antibodies directed against CK14, which identifies breast cells within the myoepithelial cell lineage. As shown in
Summary and Conclusions
There is increasing evidence that tumor-initiating cells (i.e., cells with a CSC phenotype) may also be critical determinants of tumor latency and local recurrence and may be responsible for the development of metastasis at sites distant from the primary tumor. In addition, tumor cells with characteristics of CSCs exhibit plasticity and may be responsible for resistance to chemotherapy and/or radiation. The cancer stem cell hypothesis has significantly altered the approaches being used to define and characterize the specific population of cells that are believed to be the appropriate targets for the development of effective cancer therapies for multiple tumor types. It is now clear that the use of in vitro models of CSCs using low-adherence culture conditions that enrich for propagation of cells with CSC characteristics is critical to our understanding of the role and functions of CSCs. With this evolution in our understanding of the basis of tumor progression, there is a concomitant need for development of strategies to effectively image, isolate, characterize, and analyze tumor cells with the CSC phenotype in culture conditions that support formation of 3D tumor spheroids. The approaches described here may provide a basis for identification of cells with CSC characteristics within 3D tumor spheroids, allowing these relatively rare populations of cells to be analyzed. The methods described in the present study provide a means to analyze the ability of these specific populations to retain label, undergo self-renewal and form anchorage-independent colonies derived from a single cell, and express specific surface characteristics, as well as identify the specific cells that retain their multipotency. Taken together with the increasing number of novel reagents such as the thermo-reversible CyGEL™ reagent that stabilizes live 3D tumor spheroids, allowing for high-resolution imaging of CSCs, and “click” chemistry combined with nucleoside analogs, allowing for identification of the cells capable of retaining label, investigators interested in analysis of the properties of CSCs now have an increased number of tools to add to their “technology tool kits” that will allow them to further characterize the role and functions of CSCs in tumor initiation and tumor metastasis using imaging and quantitative approaches that allow for analysis of 3D tumor spheroids.
Footnotes
Acknowledgements
Supported in part by the American Airlines–Komen For the Cure Foundation Promise Grant KG081287 (FMR) and the State of Texas Fund for Rare and Aggressive Breast Tumors. The expert assistance of Mr. David Baker for preparation of graphics and images in this manuscript is gratefully acknowledged.