
Abstract
Because of the wide use of single-nucleotide polymorphisms (SNPs) as markers of genetic variation, several high-throughput genotyping methods have been developed and applied during the past decades. High-resolution melting (HRM) is a very attractive, advanced, fast, and cost-effective SNP genotyping technology based on the analysis of the melting profile of PCR products, using intercalating fluorescent dyes to monitor the transition from unmelted to melted DNA. The authors used HRM for genotyping 215 human DNA samples for SNPs in the ABCB1, NQO1, and SLC19A1 genes and 96 samples for SNPs in the IL1A and IL12B genes with the aim of assessing HRM sensitivity and accuracy in comparisons with the TaqMan® assay in view of large-scale, high-throughput SNP-typing applications. The potential effect of PCR product size, TM, GC content, and SNP position on HRM performances was explored with amplicons that were heterogeneous for these factors. Discrimination power ranged from 91.4% to 98.4%, being significantly lower only when the number of rare homozygotes dropped to 1 or few units. The availability of specific and validated assays, in addition to a better standardization of HRM experimental conditions, can considerably reduce time and costs of large-scale genotyping studies with a negligible risk of failure or misclassification.
Keywords
Introduction
S
To date, many real-time PCR-based approaches have been used for SNP-typing in large-scale studies. One of the most commonly applied is the TaqMan® method, also known as the 5′ exonuclease assay, which makes use of 2 fluorescently labeled probes for allelic discrimination. The presence of allele-specific probes guarantees a high sensitivity, offering appreciable advantages in terms of time and labor savings. Other classical PCR-based genotyping techniques, such as the allele-specific oligonucleotide PCR (ASO-PCR) assay or the restriction fragment length polymorphism PCR (RFLP-PCR) assay, still remain the most affordable for low-budget studies.
High-resolution melting (HRM) analysis was first introduced in 1997 by Ririe et al. 3 as the natural extension of a real-time monitoring process of PCR reactions. In brief, melting profiles of PCR fragments describe the amount of double-stranded DNA that dissociates into single-stranded DNA during incubation at increasing temperatures, monitored by measuring the fluorescence emitted by an intercalating dye. In particular, melting temperature (TM) is defined as the temperature at which half of the DNA amount is denatured. The quantity of information available from melting analyses has exponentially increased with the introduction of highly saturating intercalating dyes such as LCGreen (Idaho Technology, Inc., Salt Lake City, UT) or EvaGreen (Biotium, Inc., Hayward, CA), which can be added at high concentration without inhibiting PCR reactions.
During the past few years, HRM has been successfully applied to mutation detection, presequence scanning, methylation studies, and SNP-typing. 4-6 The well-known SNPs HbC (G16A) and HbS (A17T) of beta-globin gene and another polymorphism in the HTR2A gene were first reported as a successful genotyping approach through melting profile analysis. 7 Liew et al. 8 showed that all possible base changes in SNPs can be effectively genotyped and provided some guidelines for improving allelic discrimination power of HRM.
Irrespective of its good performances, so far HRM has not encountered wide application in large-scale SNP-typing studies. This is probably due to some limitations, such as the low capacity of discriminating the 2 homozygote profiles when TM differences are minimal. As a matter of fact, contribution of a base substitution to the TM of an amplicon can vary depending on the nature of modification and the type of nucleotide involved. Numerous solutions have been proposed and applied to effectively overcome this problem, 4 which is becoming steadily less critical with the new systems, which are highly improved in hardware and software. Indeed, as shown by Seipp et al., 9 even multiplex genotyping assays can be designed and successfully performed by HRM.
Although in principle, every system registering DNA melting transition is suitable to HRM analysis, during the past few years, some ad hoc instruments have been developed, although with different performances. As thoroughly investigated by Herrmann et al., 10,11 sensitivity and accuracy, among other experimental factors, also rely on the specific performances of the instrument used for HRM analysis. In the present work, we have used the Bio-Rad CFX96 thermal cycler, coupled with the Bio-Rad Precision Melt Software, both newly introduced tools for HRM application. This system is purposely designed to achieve high-speed, very good temperature uniformity and precision and fast settling times. Moreover, the optical device, specifically calibrated for the dyes used for HRM analysis and developed to allow multiple readings per time unit, is expected to ensure better performances than the instruments tested by Herrmann et al. 10,11 We have designed specific HRM assays for the detection of 5 different SNPs in human genes with the aim of evaluating the suitability of the technique and the instrument for large-scale SNP-typing studies. Sensitivity (the number of genotypes obtained over the total reactions), specificity, and accuracy of the genotyping procedure by HRM have been compared to TaqMan® assays.
Materials and Methods
Subjects and DNA samples
Subjects genotyped in this study represent a subset of a large sample of the Italian population, available in our laboratory as reference. Genomic DNA was extracted from EDTA-blood samples using the Jetquick Blood & Cell culture kit (Genomed, Löhne, Germany). To assess whether the DNA concentration could be a critical parameter affecting HRM discrimination, PCRs were conducted on a small subset of samples, starting at a concentration of 10, 30, and 90 ng. After this initial trial, 10 ng of DNA was always used in PCR reactions. All genotypes were assessed in parallel by TaqMan® assay, and at least 1 sample for each genotype was selected to be submitted to sequence analysis to verify genotype assignment and used as internal control at each run.
SNPs
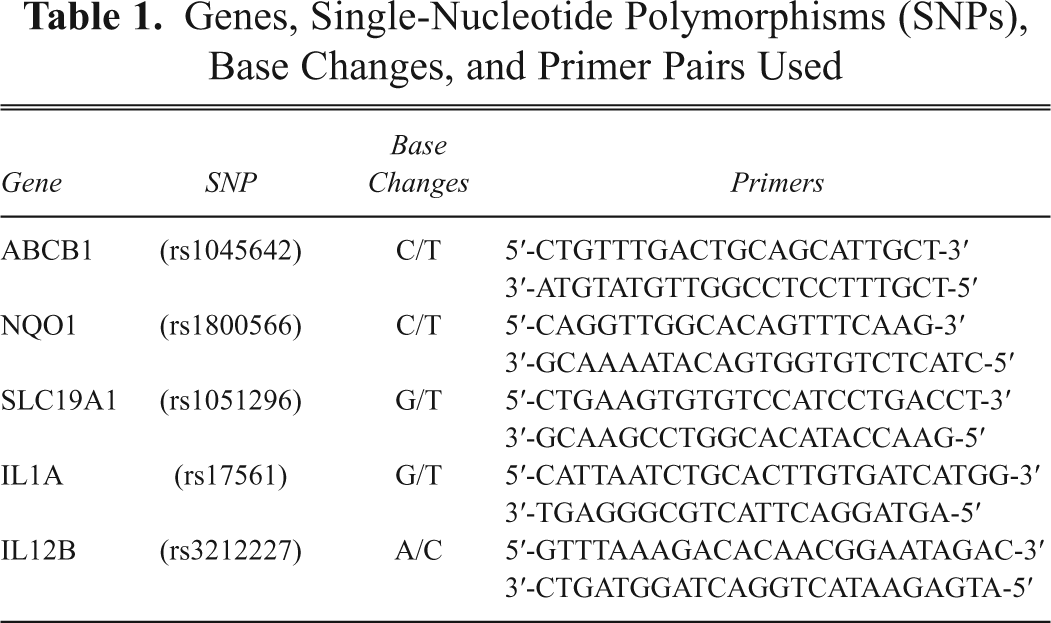
Five SNPs, described in Table 1 , were selected to include the most common variations in the human genome (i.e., 2 C/T transitions, 2 G/T transversions, and 1 A/C transversion). SNP rs1045642, also known as Ile1145Ile or C3435T, is a silent substitution in exon 26 of ABCB1 (ATP–binding cassette transporter superfamily, member 1 B) gene. SNP rs1800566 is a missense change causing the Pro187Ser substitution in exon 6 of the NQO1 (NAD(P)H quinone dehydrogenase 1) gene. SNP rs1051296 is a G/T transversion situated in the regulatory 3′UTR region of folate-carrier SLC19A1 gene. A total of 215 samples were analyzed for these 3 SNPs, including at least 1 reference control for each run, whereas a smaller set of 96 samples was analyzed for 2 other SNPs in the interleukin genes. One of them is SNP rs17561, a G/T transversion that determines a missense change Ala114Ser in exon 5 of the IL1A gene. The last polymorphism investigated was SNP rs3212227, an A/C transversion in the 3′UTR regulatory region of the IL12B gene.
Genes, Single-Nucleotide Polymorphisms (SNPs), Base Changes, and Primer Pairs Used
PCR and HRM protocols
PCRs have been performed in a volume of 25 µL per reaction in a 96-well Bio-Rad CFX96 RealTime PCR System (Bio-Rad, Inc., Hercules, CA). Reaction mixtures included 10 ng of genomic DNA as template, 200 mM each primer (Eurofins MWG Operon, Inc., Ebersberg, Germany), 1X Sso Fast EvaGreen SuperMix (Bio-Rad), and sterile H2O. Amplification protocol started with 98°C/2 min followed by 40 cycles of 98°C/15 s and 60°C/30 s. Specificity of each primer pair (i.e., absence of artifacts, multiple PCR products or primer-dimers), and PCR yield was checked by agarose gel electrophoresis and by melting analysis. After an initial step of 98°C/30 s and 55°C/30 s, melting curves were generated from 65°C to 95°C with increments of 0.3°C/cycle. Melting profiles were analyzed with the Bio-Rad Precision Melt Software, as described in the following paragraphs.
TaqMan® protocol
Primers and probe mix were available as premade and validated TaqMan® genotyping assays (ABI, Applied Biosystems, Foster City, CA), and all PCR reactions were carried out using the TaqMan® Genotyping Master Mix (ABI, Applied Biosystems). Genotyping was performed using a 96-well iCycler iQ RealTime PCR system (Bio-Rad) following the instructions of the supplier.
HRM assays
For the analysis of melting profiles and genotype discrimination, Bio-Rad Precision Melt Software was used. Samples with melting profiles, seemingly too different from the common features of other DNA samples in the same run, were considered as outliers and removed from analysis, as shown in Figure 1 . For each SNP, normalization conditions in the premelt and postmelt regions were set up in accordance with recommended guidelines and tested on sequenced reference samples, at least one for each genotype, to obtain the best discrimination of the 3 expected clusters. The same conditions were then applied to all other samples in all runs. A clustering has always been generated and compared with the one obtained by visual inspection and manual call. High-resolution melting profiles of genotypes at 5 loci considered in this study are shown in Figure 2 .
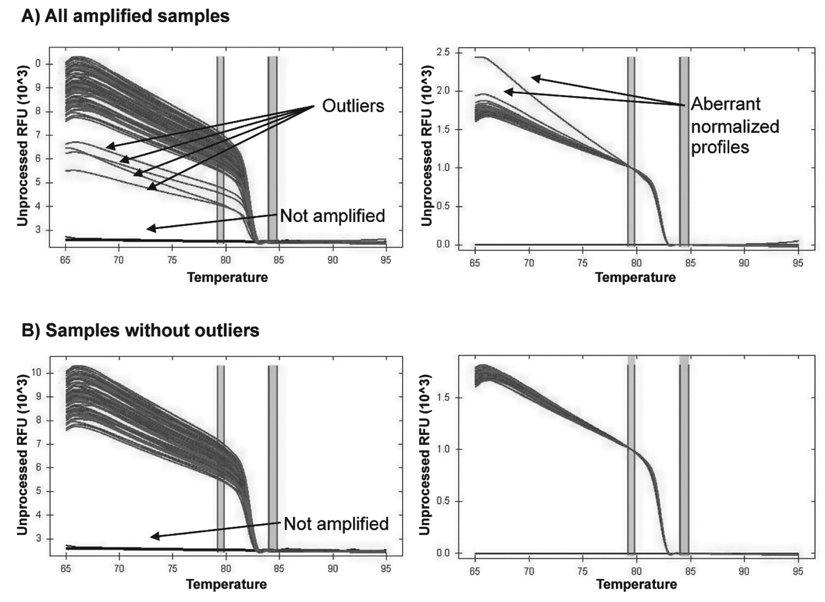
Example of melting curve graphs without (left) or with (right) temperature normalization obtained in standard conditions. See Materials and Methods for details. Occasional outliers (
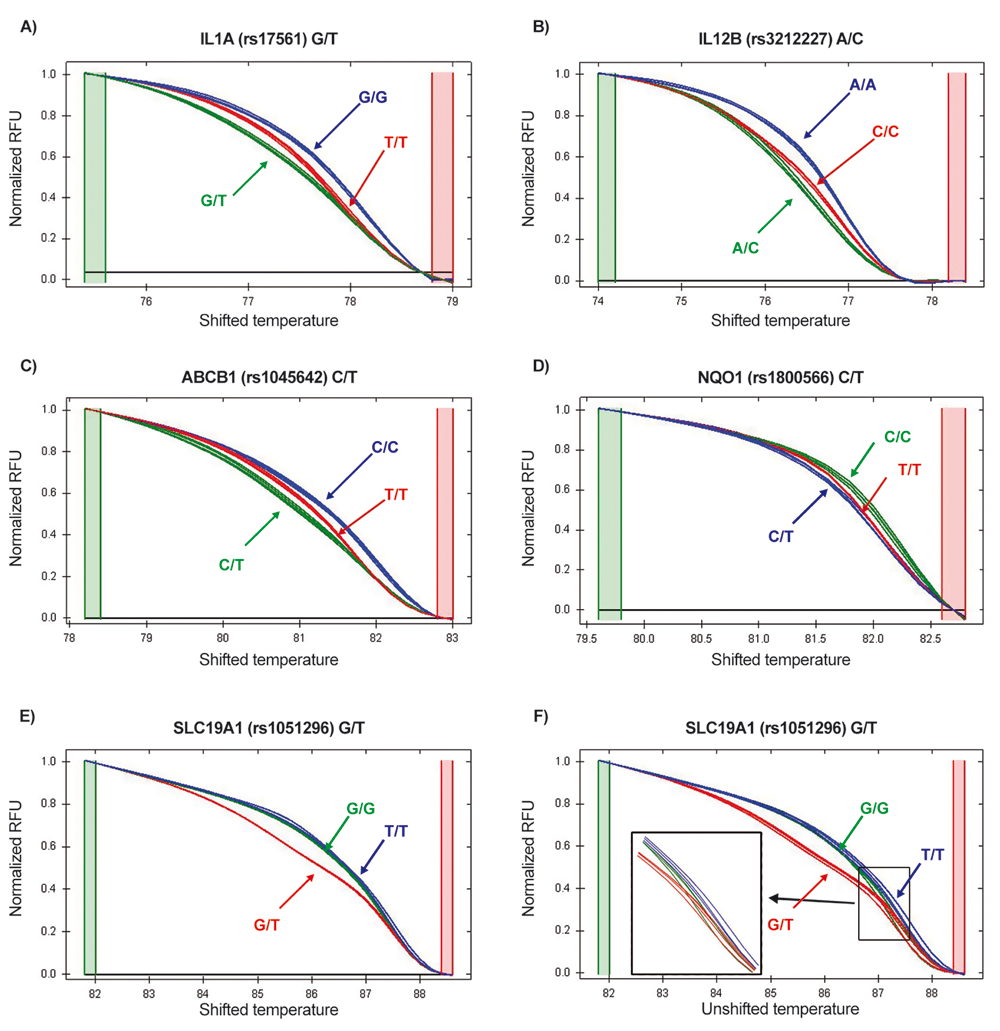
Normalized high-resolution melting curves from (
Results
We compared sensitivity, specificity, and accuracy of HRM with those of TaqMan® assays. We focused our attention on several factors that could possibly affect the performances of HRM genotyping procedure, such as DNA input and amplicon characteristics (melting temperature, length, GC content, and SNP position) and other parameters such as sample size, minor allele frequency (MAF), and number of rare genotypes expected (RGE). Our data show a mean level of HRM sensitivity, defined as the number of genotypes obtained over the total reactions, of 92.52% (range, 81.2%-96.8%). The TaqMan® assay instead gave a mean sensitivity of 96.16% (range, 93.2%-98.1%). HRM accuracy, defined as the concordance ratio with TaqMan®, ranged between 91.4% and 98.4% (mean 94.07%). Of the total 783 genotypes obtained, 41 resulted in incorrect calls, 32 of which occurred in the 2 homozygote clusters and only 9 in the heterozygote ones. Detailed results are reported in Table 2 and Figure 3 .
Sensitivity and Accuracy of High-Resolution Melting (HRM) in Comparison to the TaqMan® Assay
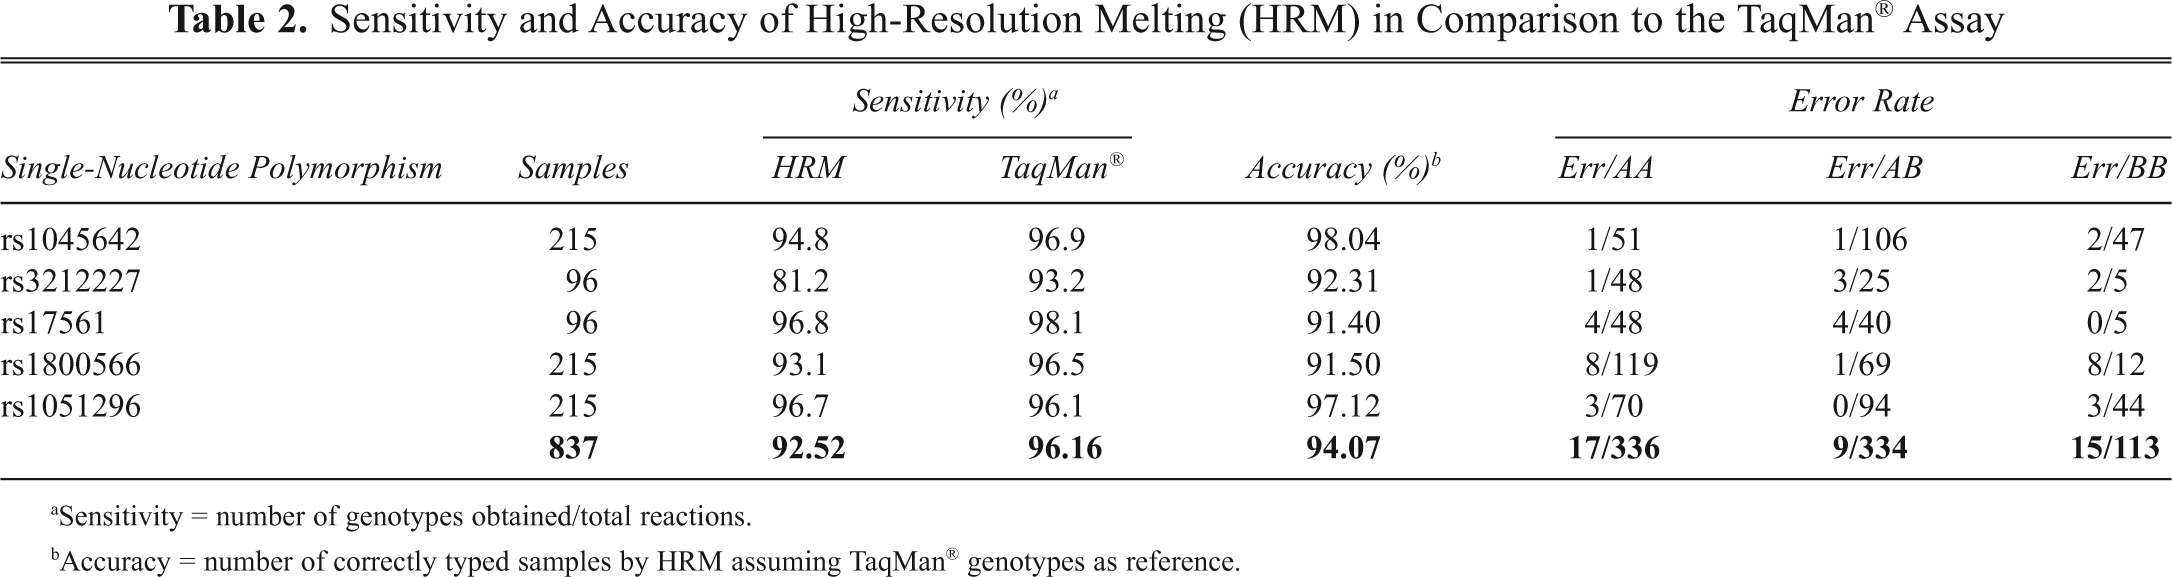
Sensitivity = number of genotypes obtained/total reactions.
Accuracy = number of correctly typed samples by HRM assuming TaqMan® genotypes as reference.
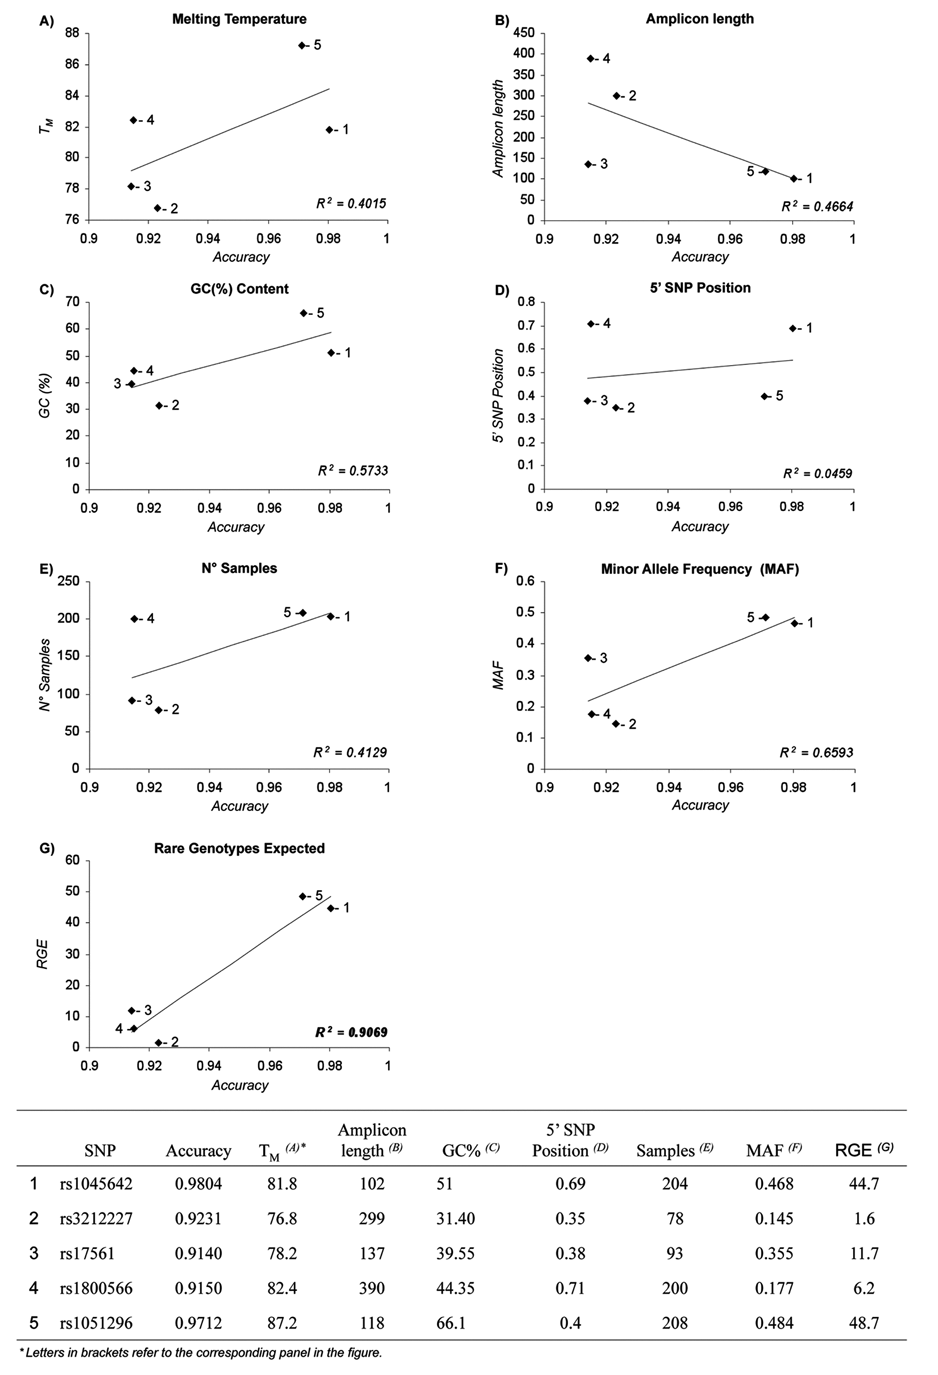
Plots of linear regression analysis of each variable by high-resolution melting accuracy.
Importance of standardized DNA input
The effects of different starting DNA amounts on PCR amplification, melting profile, and allelic discrimination were also evaluated: in particular, 10, 30, and 90 ng genomic DNA were used as a template with a subset of samples. Slight differences in amplification yield did not affect melting profiles or allelic discrimination at any concentration evaluated (data not shown). Therefore, the amount of 10 ng DNA was chosen as standard input for HRM and TaqMan® assays.
Influence of PCR fragment characteristics
Amplicons were heterogeneous for length, TM, GC content, and SNP position—that is, the ratio between the number of bases at 5′ extreme preceding the base change and the total amplicon length (
Fig. 3
). Although the best accuracy was obtained with the 2 shortest amplicons (102 and 118 bp) and with amplicons with higher TM, HRM efficacy was not significantly influenced by any of these variables (
Relevance of other quantitative variables
One of the critical parameters relevant in a large-scale genotyping studies is the number of samples investigated at each time. However, as shown in Figure 3E , there was no significant correlation between sample size and HRM accuracy. We have also investigated if the frequency of each SNP and the genotype distribution could influence HRM accuracy. MAFs observed in our samples ranged from 14.5% to 48.4%, and no correlation with HRM accuracy has been observed ( Fig. 3F ). Instead, RGE, which is given by the product between MAF and sample size, interestingly showed a good correlation with HRM accuracy ( Fig. 3G ).
Discussion
In recent years, an increasing amount of reports on HRM has appeared in the literature, suggesting that HRM is bound to become one of the most used methods for genome analysis in the future. Nevertheless, whether HRM is suitable for large-scale, high-throughput genotyping applications is the subject of debate and was the underlying spur to the present work. As illustrated before, our results show a mean level of HRM sensitivity of 92.52% that rises to 96.16% for the TaqMan® method. Differences between HRM and TaqMan® sensitivity are probably attributable to variables that commonly affect PCR efficiency, such as target sequence, DNA quality and concentration, and so on. Allele-specific probes ensure higher tolerance of the TaqMan® method to these factors. Indeed, we refer to sensitivity after a single run of genotyping, and this level could be surely improved by repeating the analysis in optimized conditions. Assuming a correct allele discrimination by the TaqMan® assay, checked by direct sequencing of some reference samples used as internal controls in each reaction, we assessed the average accuracy of genotyping by HRM that was 94.07%. It is worth noting that the highest number of mistyping concerned the 2 homozygote genotypes, as it was already reported as one of the major issues with HRM that should be taken into account when designing the assay. In fact, heterozygote detection is easier with the presence of both homo- and heteroduplex melting profiles, whereas homozygote discrimination can be more difficult because differences in TM, and consequently in melting curves, can be very small, depending on the type of base change.
We tested HRM accuracy with amplicons of different length (up to 390 bp), TM, GC content, and SNP position, allowing us to examine which of these factors could have an effect on HRM accuracy. All these factors can be taken into account during the assay design step, although we found no significant influence of any of them. In addition, our results confirm that the position of the SNP along the amplicon does not influence the discrimination capability of HRM, as already observed by Reed and Wittwer. 12 Several authors suggested using short amplicons to accentuate TM differences, even if good results have been reported with amplicons up to 400 bp. 12 Nevertheless, one should keep in mind that in principle, the assay strongly relies on the specificity of the PCR products obtained, and this is certainly reduced with short DNA stretches, so that the best approach is testing several primer pairs to obtain the shortest and most specific product. Besides, a better discrimination of homozygotes can be obtained with longer amplicons for the presence of multiple melting domains. 6
As we have shown, the sample size could be a critical parameter for a successful analysis because the number of expected “rare genotypes” significantly affected HRM accuracy. This observation could be explained by considering that while analyzing hundreds of melting profiles, it is more difficult to recognize a cluster of one or few samples than a cluster of tens, especially when differences in melting profiles are minimal. Even if this should not be a problem with large-scale applications, it would be of great interest to develop a specific tool of the software used for the analysis of melting profiles, enabling adjustment for the number of samples expected to fall in a specific cluster on the basis of allele frequencies when known. In this way, the allelic discrimination power of HRM would be further refined.
Our results offer a comparative point of view between different approaches and merge with many reports in the literature. Indeed, this article also represents the first report on HRM analysis performed by the new Bio-Rad CFX-96 combined with the Precision Melt Analysis Software, with which we have explored the robustness of this technique. In conclusion, our data confirm HRM ability to discriminate between genotypes with a high level of sensitivity and accuracy in assays not expressly designed to meet all HRM requirements. If the question is, “Is this efficiency and accuracy acceptable for large-scale studies?” the answer, in our opinion, is yes. In large-scale studies, variation in sensitivity and accuracy around 95% can be considered adequate, having negligible effects on the results of the study. One of the major points in these studies is the cost of genotyping that would obviously vary depending on the experimental design. Commercially available HRM reaction mixes may guarantee standardized manufacturing procedures and reproducibility in the results, with costs that are comparable to other real-time PCR mixes. Just by considering that HRM does not require specific labeled probes, if one can achieve a comparable level of accuracy by using a commercial HRM mix, the advantages in terms of savings are very attractive. The most recent platforms allowing HRM can also be used for quantitative real-time PCR, so the same system is suitable for many DNA sequence analyses, for genotyping known SNPs and detecting unknown point mutations and small rearrangements, and for methylation studies, too. Future technology developments and automated systems that are already available allow us to take for granted that experimental variables influencing HRM will be controlled steadily better. Indeed, with the increase in popularity of this technique and by sharing experiences, researchers will develop experimental systems optimized for HRM, at least for a large number of well-characterized mutations.
Footnotes
Acknowledgements
This work has been realized in collaboration with Bio-Rad, Inc., which provided the CFX-96 RealTime PCR System, the Precision Melt Analysis Software, and other supplies.