
Abstract
Recently, it has been shown that 2-photon fluorescence correlation spectroscopy of single glycosylated 20-nm fluorescent spheres allows measurement of the relative carbohydrate binding affinities of unlabeled proteins and that these modified spheres can mimic the glycocalix of cell or virus surfaces. An especially useful extension would be the analysis of mixtures of nanospheres that each contain different fluorescent labels and are thus differentially “encoded.” If the surfaces of these encoded nanospheres are modified with various receptors, many different biomolecule-surface interactions and concurrent reactions can be measured quickly and simultaneously in a single-reaction vessel. An essential prerequisite for this general assay principle is the ability to identify with an accuracy of nearly 100% any encoded nanosphere present in a mixture on a single-particle level. Here the authors present a method that indeed allows certain identification of differently encoded nanospheres during single transits through the focal volume of a microscope objective (ø~200-500 nm) in aqueous solution. This opens the way for using the encoded nanospheres in 1-well measurements of a large variety of biomolecular receptor-ligand interactions, inhibition and concurrent reactions, and thus either for testing the behavior of ligands in a mimicked complex biomolecular environment or for a fast simultaneous measurement of a multitude of receptor-ligand interactions.
Introduction
M
Here we present an extension of this detection scheme to confocal single-transit detection and identification of differently fluorescent-labeled 20-nm beads (“encoded nanospheres”). This will enable us to investigate a multitude of possible receptor-ligand interactions and competing reactions in a single-reaction batch and in very short measuring times. 10 We show that very reliable detection of single transits of distinct nanospheres through the focal volume is possible. Analysis of the fluorescence lifetimes of photon bursts arising from such single transits, as well as the distributions of detected counts with detectors for different wavelengths, allows a clear identification of encoded nanospheres. This opens the door for fast multiparameter analysis of complex mixtures such as cell extracts.
Materials and Methods
Investigated nanospheres
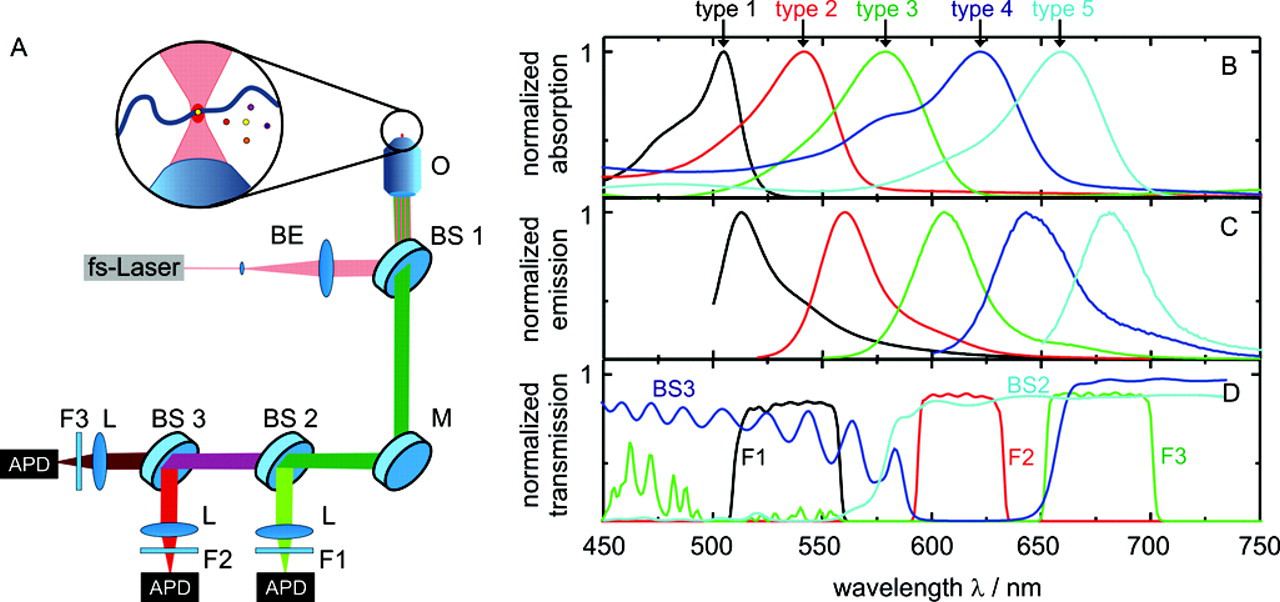
We investigated 5 distinct types of bodipy dye-derivatized polystyrene nanospheres. Three aldehydesulfate-modified, 20-nm beads (C29096, 1% solids, Molecular Probes, Eugene, OR) and 2 carboxylate-modified beads of 20 nm and 40 nm in diameter (F8782 and F10720, 2% and 5% solids, Molecular Probes) were obtained. The absorption and emission spectra of the beads are shown in Figure 1B , C . They were measured using a Cary UV-VIS-NIR spectrophotometer (Varian, Palo Alto, CA) and a Fluorolog FL 3-22 (Jobin Yvon, Longjumeau, France).
(
Before measuring, all samples were sonicated for 6 min to obtain monodisperse solutions and diluted to the appropriate concentration between 0.1 and 1 nM for the respective measurements into ultrapure water. When testing the identification filter functions, the sample mixtures contained the different types of nanospheres in the same amount.
Experimental setup
All fluorescence experiments were carried out on a triple-color 2-photon confocal setup ( Fig. 1A ) that has been described in detail previously. 11 The advantage of using 2-photon excitation is that it enables simultaneous excitation of all different fluorescence dyes without a complicated excitation filter system. Briefly, to create a diffraction-limited focal spot, a pulsed home-built mode-locked titanium:sapphire laser (800 nm, 87 MHz, ca. 100 fs) is reflected by a dichroic beam splitter (BS1, 715 DCPXR, AHF, Tübingen, Germany; for spectra of filter system, see Fig. 1D ) into an objective (UApo 40×, water immersion, Olympus, Hamburg, Germany). The emitted fluorescence light detected in epi-direction is successively divided by 2 dichroic mirrors (BS2, 590 DSCPXR and BS3, 645 LP, AHF), resulting in 3 distinct spectral regions: green, red, and dark red. Following further cleanup by bandpass filters (F1, HQ 535/50; F2, HQ 615/40; F3, HQ 675/50, AHF), the fluorescence light is focussed onto avalanche photodiodes (SPCM-AQR-13, Perkin-Elmer, Waltham, MA) and recorded with a time-correlated single-photon counting (TCSPC) card (TimeHarp200, Picoquant, Berlin, Germany). Data evaluation such as correlational analysis and burst identification is performed by a self-written C++ program.
Nanosphere characterization
Each type of encoded nanosphere results in a characteristic count distribution in the 3 different detectors (see Fig. 1C , D ). The experimental count distribution of a distinct nanosphere ( Table 1 ) is in very good agreement with theoretical expectations evaluated from the spectra. In addition, Table 1 summarizes the diffusion time τ D and fluorescence lifetime τ fl of each bead type. The fluorescence lifetime was analyzed by tail fitting a monoexponential decay to the fluorescence decay curves evaluated by TCSPC. To determine the diffusion time, we calculated fluorescence autocorrelation curves from the fluctuating fluorescence signals (for further details on FCS, see, e.g., Schwille, 6 Eigen and Rigler, 12 and Schwille et al. 13 ). Subsequently, equation (1) was fitted to the curves obtained in this way.
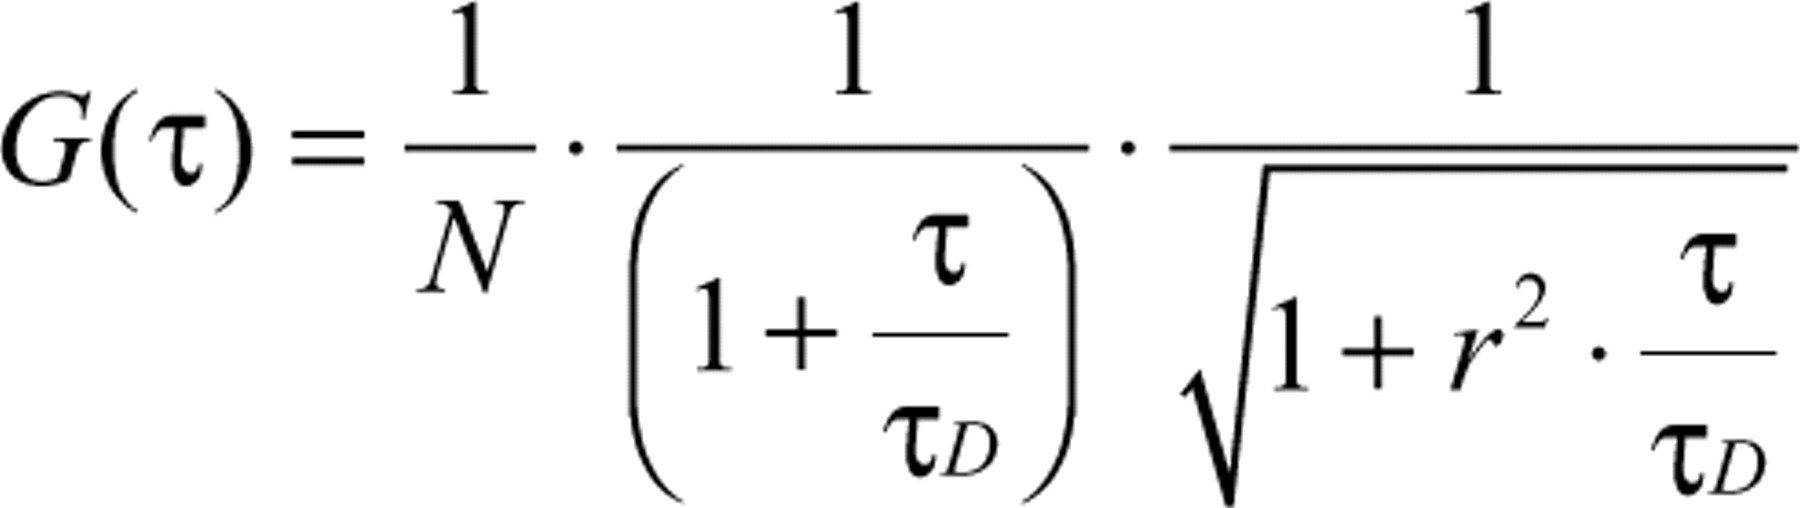
Here τ is the correlation time, N is the average number of particles in the focal volume, τ D is the diffusion time, and r ≈ 0.25 is the width-to-length ratio of the 3D Gaussian-shaped focal volume. 6,12,13
Bead-Type Classification Data
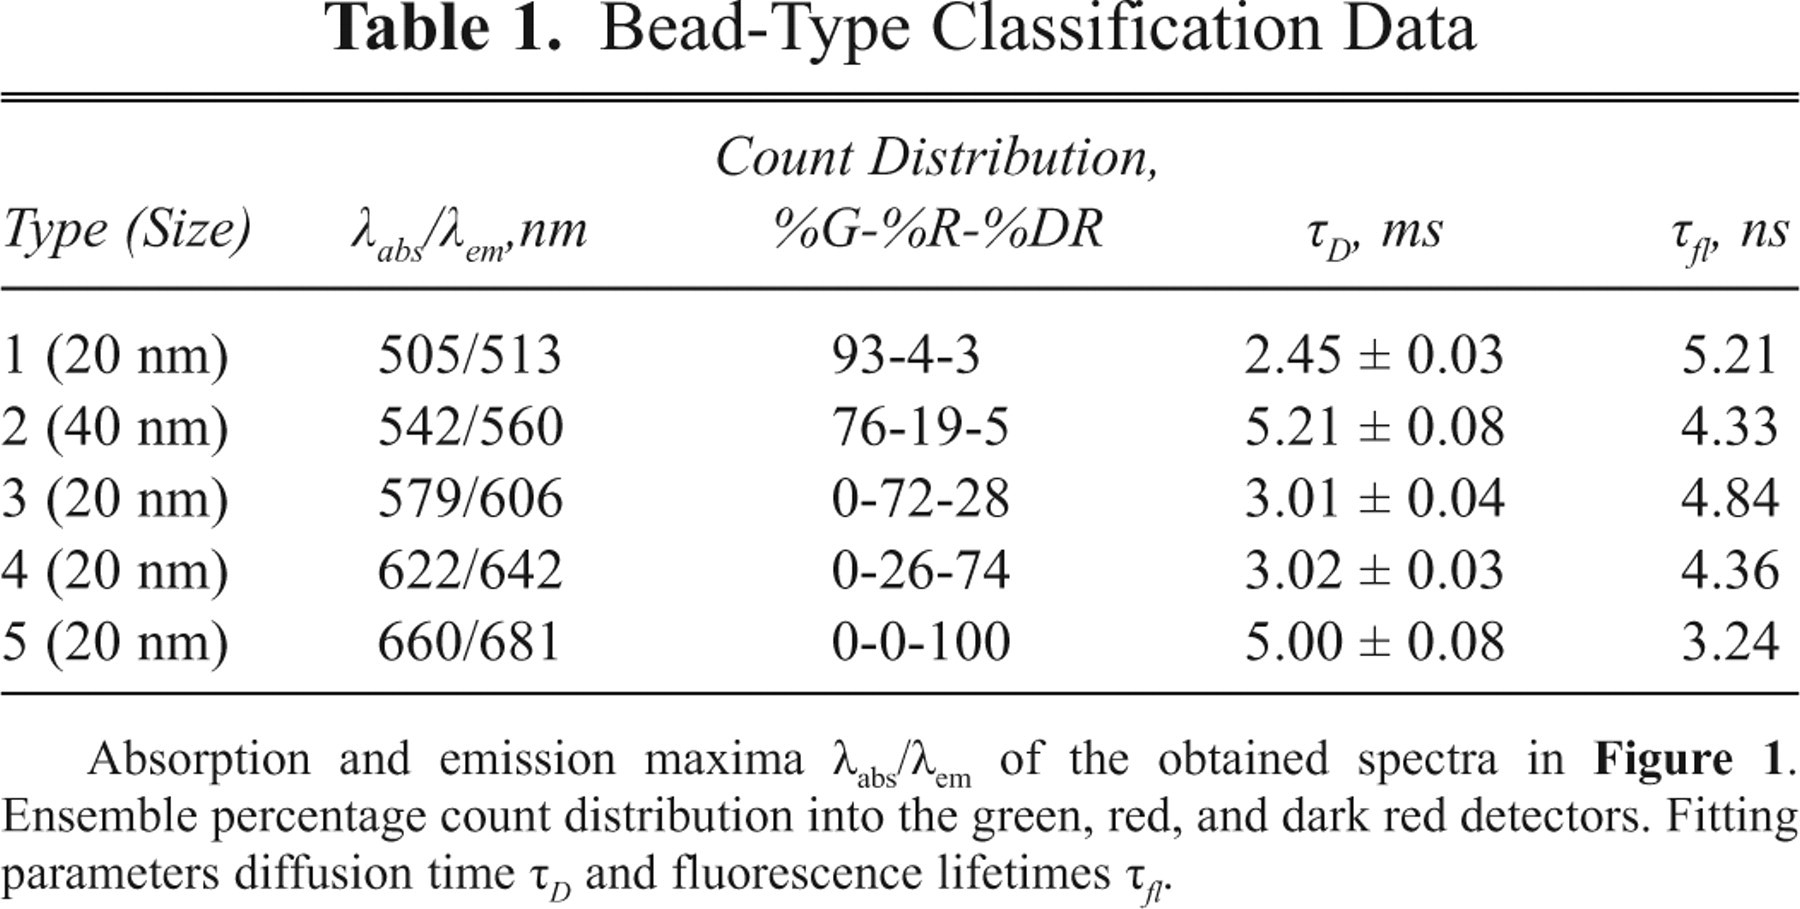
Absorption and emission maxima λabs/λem of the obtained spectra in Figure 1 . Ensemble percentage count distribution into the green, red, and dark red detectors. Fitting parameters diffusion time τ D and fluorescence lifetimes τ fl .
Assigning fluorescence bursts to individual encoded nanospheres
The development of identification schemes for assigning fluorescence bursts in the 3 detectors to individual encoded nanospheres consisted of the following steps. First, valid photon bursts belonging to real single-particle transits have to be detected and characterized. Subsequently, single nanosphere identification filter functions based on the different parameters such as count distributions or fluorescence lifetime were generated from data observed with pure samples. Finally, these filter functions were employed to assign identities to photon bursts in all possible permutations of mixtures of the nanospheres.
Photon burst detection
The time-dependent fluorescence fluctuation data were used to bin photon counts into 1-ms intervals (binnings). To improve burst boundary determination, we used a Lee filter (parameters m = 7, σ0 = 60; for details, see Enderlein et al. 14 ) to smooth the time-dependent fluorescence traces detected in the 3 detectors. The burst boundaries were determined based on fluorescence intensities exceeding and falling below a fixed threshold (see Fig. 2 ). A burst observed in 1 of the 3 detector time traces was assigned as valid when the photons counted during a burst exceeded a total of 200 and if the burst height exceeded 20 counts per binning. A burst was always assigned to the detector channel with the largest number of counts. Photon counts occurring in the additional 2 detectors during the burst time period will be referred to as crosstalk X in subsequent paragraphs.
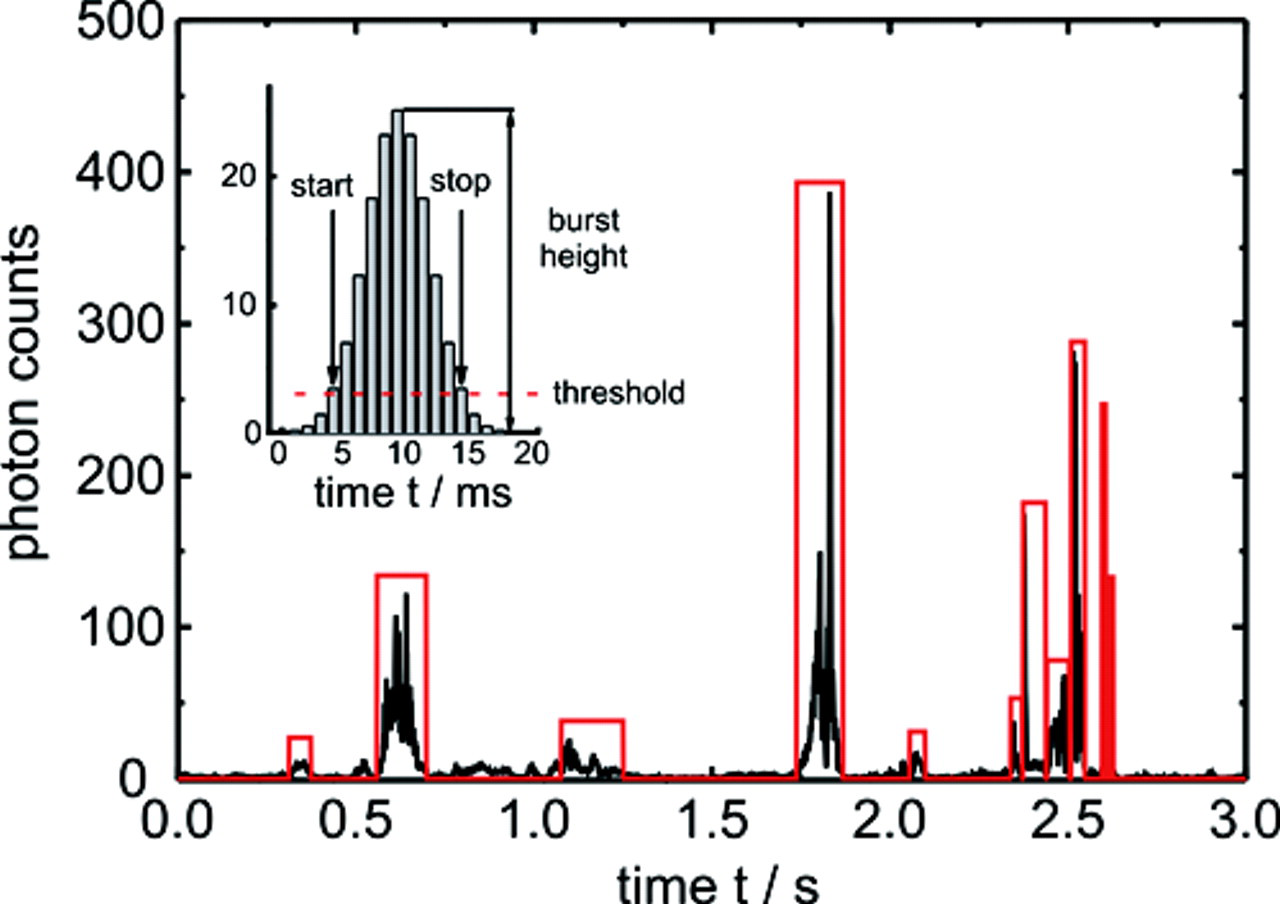
Typical time trace of a pure type 2 sample. Valid bursts in the green detector are enclosed in a box. Inset: Burst detection scheme with threshold (dashed line) and resulting burst parameters.
Photon burst characterization
To characterize the validated bursts, we determined the fluorescence lifetime (burst-integrated fluorescence lifetime [BIFL]) for each single burst 15 and the burst-integrated count ratio (BICR). We define the BICR as the ratio of the sum of counts, C(i), observed in the detector to which a valid burst was assigned and the sum of crosstalk photon counts, X(i), detected in the other detectors:
(Here, i assigns the sequential number of binnings. The determination of the BIFL was again performed by tail-fitting a monoexponential decay (for further details, see, e.g., Fries et al. 15 ).
Generation of identification filter functions
The filter functions for the identification of the bursts were based on the BIFL and crosstalk values and first optimized using pure samples of nanospheres. Each type of nanosphere results in certain lifetime and crosstalk values. Therefore, burst value histograms of the pure types were determined and used for the comparison with the histogram of an unknown burst. For the actual identification of bursts, the count ratio for each binning during a valid burst is computed. The probability that an unknown burst belongs to a distinct type of nanosphere is dependent on the frequency of a certain lifetime or crosstalk value within each burst. Assuming a Gaussian distribution around the average count ratio, for example, the probability P(i,j) that the binning i under investigation belongs to a certain bead type j follows equation (3):
Here, c represents the actual photon count number of
the binning i and the detector for which a valid
burst was identified. The average crosstalk photon counts  and the corresponding standard
deviation σ(c,j),
which are valid for a distinct bead j, are compared
to the actual measured crosstalk photon counts x(i), and the probability that the
binning belongs to bead type j is calculated.
and the corresponding standard
deviation σ(c,j),
which are valid for a distinct bead j, are compared
to the actual measured crosstalk photon counts x(i), and the probability that the
binning belongs to bead type j is calculated.
The final assignment of a burst to a nanosphere type is performed by the calculation of certainty factors that are defined as the probability that any observed value reflects a distinct type divided by the sum of all probabilities that the same value belongs to the other types.
Multiplication of all certainty factors of all binnings gives a measure of certainty that a burst belongs to a particular type x in comparison to another type y. When the certainty factor for a distinct type of nanosphere was at least 10 times higher than the certainty factors for all other possible types, then this burst was regarded as unambiguously assigned to this type of nanosphere.
Improved assignment based on valid binning criteria
For a further improvement of the assignment accuracy, all values of distinct
binnings are discarded that do not lie within 1 standard deviation for a distinct
value  characterizing a distinct type of
nanosphere. If more than 35% of all binnings of a valid burst do not fulfill this
requirement, the entire burst will be discarded for the identification (henceforth
called no-match cases). As shown in the Results and Discussion section, the number
of unassignable bursts increases only slightly, but the probability for false
assignments decreases drastically. To gain statistically sound data, we analyzed
at least 1000 fluorescence bursts per encoded nanosphere type.
characterizing a distinct type of
nanosphere. If more than 35% of all binnings of a valid burst do not fulfill this
requirement, the entire burst will be discarded for the identification (henceforth
called no-match cases). As shown in the Results and Discussion section, the number
of unassignable bursts increases only slightly, but the probability for false
assignments decreases drastically. To gain statistically sound data, we analyzed
at least 1000 fluorescence bursts per encoded nanosphere type.
Results and Discussion
When testing the filter functions on pure-type samples, we were able to assign burst identities with a high accuracy (see Fig. 3A ). Types 1, 3, and 5 exhibited less than 1% mismatch and no-match cases. Type 2 exhibited 5% mismatch with type 1 and 5% no-match cases. Type 4 exhibited 4% mismatch with types 3 and 5 and 2% no-match cases. Applying the additional valid binning criteria, it is possible to reduce mismatches significantly to below 1% for all types. Naturally, these more stringent conditions lead to an increase in the number of no-match cases of up to about 15% ( Fig. 3B ).
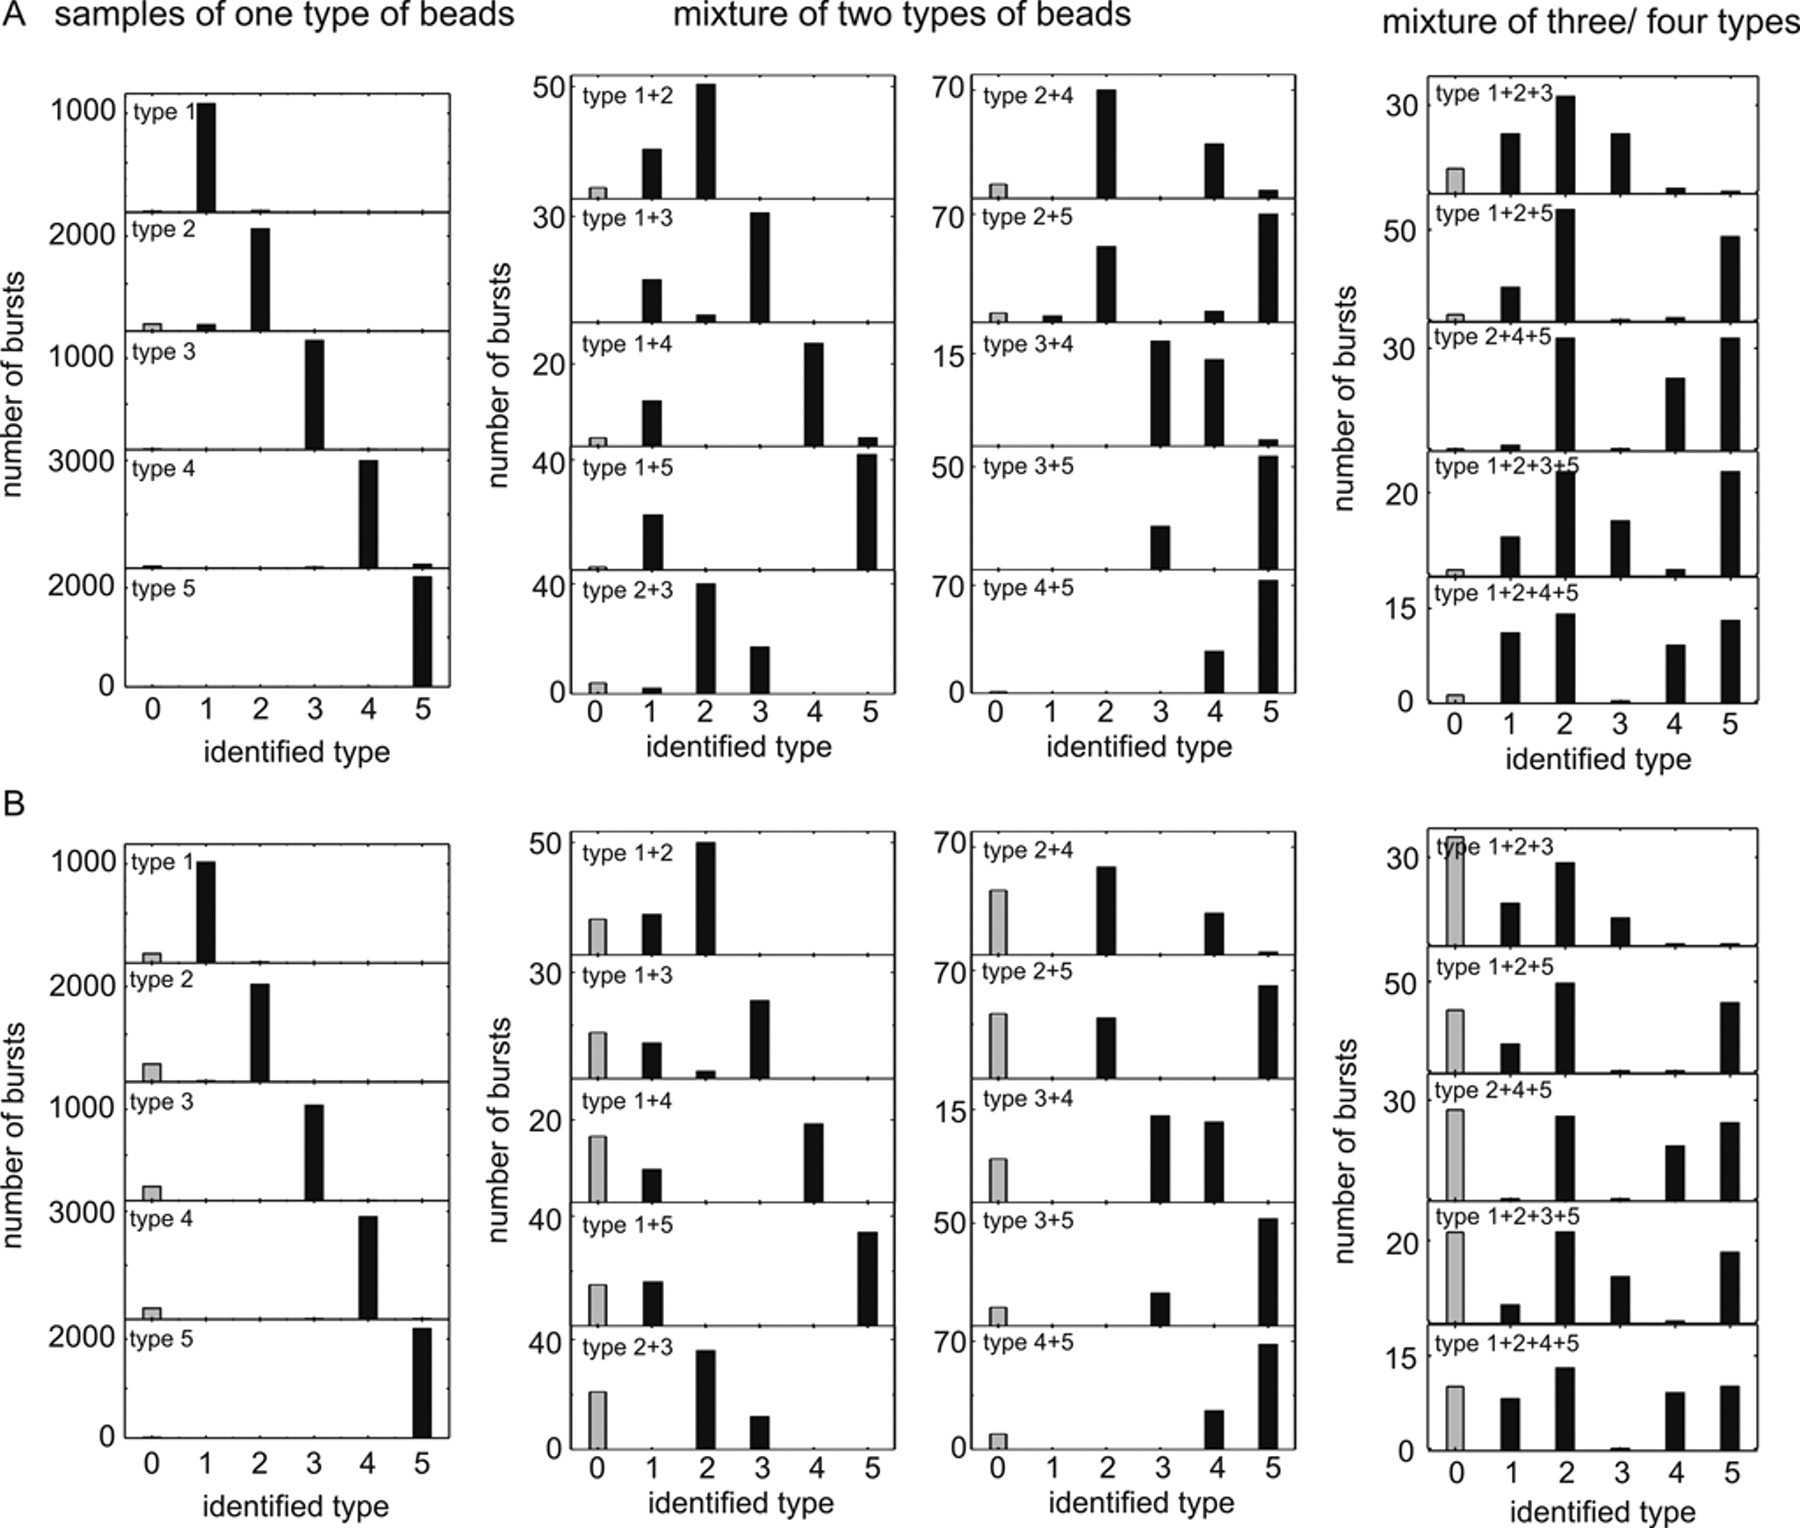
Bead identification histograms of pure-type samples and several bead-type
mixtures. The bead types contained in the samples are printed next to each
histogram. Black bars represent assigned bursts to distinct types. The height of
each bar reflects the actual relative concentration of the beads within the
mixtures. Gray bars represent no-match cases. (
We then produced mixtures of all permutations of the 5 bead types. First, we tested all 2-bead mixtures to see whether all types could be distinguished from each other. As one could expect, the BICR and BIFL filters that were calculated only for entire bursts and not for individual binnings and that on the pure-type samples yielded acceptable albeit inferior results (data not shown) failed completely on the mixtures, resulting in considerably higher error rates. However, also applying the per-binning filter function yielded very good results ( Fig. 3A ). Figure 3B shows the effectiveness of the additional valid binning criteria. Almost all mismatch classifications disappeared, whereas the no-match cases increased only slightly. Differences in the number of detected bursts originated from variations in absolute concentrations of mixture components and, to a smaller extent, from different particle brightness and diffusion times, which influenced the burst detection probability. From these data, it is now possible to derive absolute concentrations of the encoded nanosphere types as well as cross-binding from the numbers of detected bursts.
In addition, Figure 3 shows the corresponding histograms of multiple bead mixtures containing up to 4 different types. As can be seen, a very effective assignment of the detected bursts to the right types is possible by using the different filters and additional criteria.
Although fluorescence lifetime is in general a robust and accurate tool to distinguish fluorescence labels in ensemble measurements, 15 it turned out that this filter function alone does not yield acceptable identification results. This is because the BIFL distributions of the 5 bead types are too broad and overlap to a large extent. Comparing the BICR and the per-binning ratio filters, we found the latter to be superior for two major reasons. The BICR filters examine a burst as an indivisible entity and are therefore susceptible to even minor count rate disturbances during a burst. This results in cases of false burst identification and cases where no type could be assigned. The binning filters, on the other hand, can tolerate disturbances up to a certain degree due to their sequential analysis principle. Furthermore, the additional valid binning criteria significantly improve the performance.
In conclusion, we showed that it is possible to identify robustly differentially encoded nanospheres in mixtures during single transits through the focal volume of a microscope setup. The binning-resolved analysis of photon bursts proved itself to be an effective identification tool that is largely resistant to count rate disturbances and compensates for the nonuniformity of the used nanospheres. We succeeded in identifying 5 distinctly labeled nanospheres in mixtures with a classification probability of >99% in aqueous solution. In future studies, investigations with multiple-colored nanospheres are planned that will drastically enlarge the number of separable types. Also, the use of quantum dots that have significantly longer lifetimes but much narrower spectral bandwidths will be of special interest. Because of these particular properties, we expect that an even larger number of individual nanoparticle types will be distinguishable when using filter systems with narrow bandpass filters.
Our approach opens the use of encoded nanospheres for single-well measurements of a large variety of biomolecular receptor-ligand interactions and their respective inhibition in complex mixtures such as cell extracts. It will also allow the investigation of concurrent reactions and can be used, for example, to test the behavior of ligands in a mimicked complex biomolecular environment or for a fast simultaneous measurement of a multitude of receptor-ligand interactions. Combined with our previous study of agglomeration processes of labeled nanospheres, it should now be possible to extract vital qualitative and quantitative information on carbohydrate-protein interactions such as cell recognition without the need for protein labeling. 5 Once individual beads of one type can be identified in a mixture, the same FCS analysis can be done for this type, giving the same information as in the aggregation experiments described in Pohl et al. 5 If nanospheres of different diameters and/or surface receptor densities are used, the influence of the surface curvature and/or binding partner densities can be elucidated.
If a biological system is investigated that is not subject to aggregation upon binding of the proteins to the beads, the diffusion time still will be affected and can be analyzed either by FCS or the average burst width belonging to that bead type. If that is not sensitive enough, the protein can be fluorescently labeled. Then beads with 2 different fluorescence colors will clearly and robustly indicate binding.