
Abstract
Introduction:
Attention deficit hyperactivity disorder (ADHD) is a neurodevelopmental disorder that affects 3% of children in the world.
Objective:
In this work, we seek to compare the different brain activations of pediatric patients with and without ADHD.
Methods:
A functional resonance examination with BOLD contrast was applied using the MOXO-CPT test (Continuous Performance test with single and double visual-auditory distractors).
Results:
Differences in BOLD activation were observed indicating that control children regularly presented negative BOLD activations that were not found in children with ADHD. Inhibitory activity in audiovisual association zones in control patients was greater than in patients with ADHD. The inhibition in the frontal and motor regions in the controls contrasted with the overactivation of the motor areas in patients with ADHD, this, together with the detection of cerebellar activation which attempted to modulate the responses of the different areas that lead to executive failure in patients with ADHD.
Conclusions:
In view of these results, it can be argued that the lack of inhibition of ADHD patients in their executive functions led to a disorganization of the different brain systems.
Introduction
Attention deficit hyperactivity disorder (ADHD) is a chronic neurodevelopmental disorder with different manifestations in childhood, adolescence, and adult life (Barkley, 1997; Barkley et al., 2002). It is characterized by attentional lability, impulsive behavior style, sterile hyperactivity, and fragility of the mechanisms of adaptation to the environment, without the presence of said symptoms being justified by other psychopathological problems (Barkley, 1997). The British Association of Psychopharmacology (Narbona, 1997) points out that both genetic and environmental factors can play an important role in alterations in brain circuits. The approaches used to study ADHD are divided into genetic, neurochemical, structural, and functional (Berberat et al., 2021). Diagnosis, due to the absence of specific biomarkers common to the entire spectrum of patients, evaluation and treatment are based on clinical phenotypes. It would be necessary to establish a sophisticated causal framework that accounts for the heterogeneity of the disorder, integrating findings from genetic, neuroimaging and neuropsychological studies and finally virtual (Diaz-Orueta et al., 2016). Although there is controversy and it is not a requirement to formulate a diagnosis of ADHD, there is a broad consensus in considering the neuropsychological evaluation as a very useful resource in the approach to this pathology (Barkley, 1994; Holmes et al., 2010; Iriarte et al., 2016). However, a review by Gualtieri and Johnson (2005) criticizes the lack of ecological validity of ordinary psychoeducational batteries, which at most may only be an indirect measure of ADHD. These authors state that attention deficits, motor hyperactivity, and cognitive impulsivity may or may not be evident when a child is in a small, one-person room with an adult. Also, that the “freedom of distraction” factor of the Wechsler Intelligence Scale for Children-Third Edition (WISC III) (Holmes et al., 2010), may not be a reliable or a valid index of attention or a diagnostic screening measure to identify children with ADHD. At this point, Gualtieri and Johnson opened the door to other types of ADHD assessment tools, such as computerized tests.
Examples of computerized testing approaches include Continuous Performance Testing (CPT) (Areces, Dockrell, et al., 2018; Bart et al., 2014; Epstein et al., 2003). Other similar tests are the Servera and Llabrés Children’s Sustained Attention Task, the Integrated Visual and Auditory Continuous Performance Test, or the Continuous Variables of Attention Performance Test (Díaz-Orueta et al., 2014). However, all these types of tests are commonly criticized for their low ecological validity (Fernández et al., 2014; Riccio & Reynolds, 2001). In addition, many authors (Díaz-Orueta et al., 2014; Holmes et al., 2010) maintain that these assessment tools have sufficient sensitivity to ADHD, but the specificity is not adequate. Efforts to find improved assessment methods that offer higher ecological validity, as well as better sensitivity and specificity levels, have led to new techniques for assessing ADHD that are based on the use of Virtual Reality (VR) (Areces, Dockrell, et al., 2018; Areces, Rodríguez, et al., 2018).
Virtual Reality reproduces three-dimensional (3D) environments in which the examined person interacts dynamically, with a feeling of immersion in that environment like the presence and exposure to a real environment (Climent et al., 2010). Several studies have shown the practical utility of VR in the healthcare environment, in different fields, such as the rehabilitation of cerebral palsy (Cherniack, 2011), treatment of pain or distraction (Das et al., 2005) or the identification and treatment of older people with cognitive disorders (Cherniack, 2011). All in all, the scientific evidence of its usefulness is still limited, and more research and studies are required (Iriarte et al., 2016).
MOXO is a continuous performance test created in 2013 by Neuro Tech Solutions, Nes Ziona, Israel, in which the goal is for the patient to maintain their attention pointing to the correct targets (just like in the TOVA test) (Soto José, 2016). In this test, unlike the previous one, both auditory and visual external stimuli are added, which act as distractors for the patient (Epstein et al., 2003), this test is usually performed on a computer where the patient will observe in search for the correct stimuli, under different distractors, to which he must press the keyboard once he finds the predetermined image or stimuli, the choice of this test was due the possibility of adapting the test to be performed during an MRI and also taking into account its good sensitivity and specificity. It is a scientifically proven test to assess ADHD (Jacoby & Lavidor, 2018; Slobodin et al., 2018, 2020). This test identifies attention difficulties with 90% reliability, generates an attention profile for each patient, accurately measures: hyperactivity, attention, response time, and impulsivity and generates quantitative data. At the end it presents a performance report. Quantitative measures offer numerical data to compare scores before and after treatment. It can identify how distracting factors affect patient performance. Information that allows tracking the performance of the patient in all stages of the test. MOXO has been proposed as a virtual test that allows differentiating subjects with ADHD from control groups (Berger et al., 2013; Jacoby & Lavidor, 2018). It must be cleared that the diagnosis of ADHD is clinical, so MOXO is only considered a support tool for it, its disadvantages are that it requires a controlled environment where there are no distractors added to those within the test, in addition to the fact that the tool fails to determine some specific factors such as anxiety related to impulsivity, it requires a license to use which has a fee, in addition to requiring a good internet connection. Its proper performance depends on the patient following the instructions properly, for the above MOXO has a test start to verify that the patient has clearly understood the instructions.
Functional magnetic resonance imaging with BOLD contrast is an imaging technique that highlights the areas of the central nervous system (CNS) that change their energy consumption (oxygen) during neurological activity (Uğurbil, 2018). It is known that this contrast varies with different types of diseases such as: neurodegenerative (de Celis et al., 2015), neurological disorders (Alonso et al., 2015), and even simple plastic learning processes (de Celis et al., 2012). It is therefore an ideal instrument to study the response of ADHD patients to different stimuli. BOLD and fMRI have been used to study ADHD in the past and there are many publications in the field (de Celis et al., 2019; De Silva et al., 2019; Guerrero et al., 2016; Tobón et al., 2020; Rubia et al., 2021). However, works that combines the use of MOXO with BOLD imaging studies with fMRI are, to our knowledge, scarce or non-existent.
It is known that ADHD affects executive functions and one of the main alterations is the inability to inhibit multiple stimuli and make appropriate decisions when confronted to them (Albrecht et al., 2015; Hall et al., 2016). All in all, a correlation between the functional changes observed at the brain level with the presentation of different stimuli has not yet been established. MOXO is a standardized virtual reality test in which the different stimuli are known and established. Through a BOLD contrast-enhanced MRI exam, it is possible to observe what is happening in these individuals and in other healthy ones and compare the different brain activations. It is very important to be able to validate whether there is consistency in the MOXO results of ADHD patients and controls, to better understand the pathophysiology of the disorder and support that MOXO may be considered as another vehicle for the diagnosis of ADHD (Berger & Cassuto, 2014; Berger et al., 2017; Cassuto et al., 2013).
Methods
Protocol
This study had permission from the ethics committee of the entity where the experiment was conducted. To complete it, the criteria of the Helsinki Treaty for human experimentation were met. The volunteers and their legal guardians were first informed. The corresponding letters of information and consent to participate in the study were latter signed. At any time, the volunteers were informed that they could abandon the protocol. All the information and volunteer data were anonymized.
In this study, functional magnetic resonance images were taken from children who were randomly recruited when attending the study hospital for consultation about other medical issues. During that first visit in which the selection took place, the corresponding ethical authorizations were signed. On a second and last visit, in the morning and after a night of rest and their “usual” breakfast, the patients underwent magnetic resonance imaging. Anatomical and fMRI-BOLD (functional) images were obtained. During a functional scan time, all patients (n = 24) completed the MOXO game (15–17 minutes) within the scanner. After imaging, the volunteer’s participation in the study was considered to have ended and he was sent home.
MOXO Game/Paradigm
MOXO is normally carried out on a simple computer without requiring any type of specific equipment, the test consists of eight different stages presented randomly and with a total duration of 14.5 minutes. Each of the eight different stages has an average duration of 50 seconds presented in the following way:
First stage (basic 1): without distractors, in which the vision is focused on a target image presented on a screen to the volunteers. They must click on the button-control-pad (BCP) as soon as the stimulus appears. The above could be considered a basal state of the patient without distracting load.
Second stage (visual 1): in this stage the test shows the same target stimulus as before. The subject must click once again the BCP in the same manner. In addition to these actions, visual distractors (cartoons with no sound) are presented to volunteers. At this stage, the distracting load is considered as small and attempts to analyze attention during visual distractors.
Third stage (visual 2): in this stage the test shows the same target stimulus as before. The subject must click once again the BCP as before. In addition to these actions, visual distractors (cartoons with no sound) are presented to volunteers. Visual distractors appear faster and more frequently than before. Here, the distracting load is considered average and attempts to analyze attention during visual distractors.
Fourth stage (Auditory 1): in this stage the test shows the same target stimulus as before. The subject must click once again the BCP as before. In addition to these actions, auditory distractors characterized by sounds of falling pines, baby cries, glasses colliding, lightsabres, and so on are presented to volunteers. No cartoons are presented and at this stage, the distracting load is considered as small. Here the program attempts to analyze attention during auditory disruptors.
Fifth stage (Auditory 2): in this stage the test shows the same target stimulus as before. The subject must click once again the BCP as before. In addition to these actions’ auditory distractors (same as in the fourth stage) appear more frequently and faster. No cartoons are presented and at this stage the distracting load is considered as average and attempts to analyze attention during auditory distractors.
Sixth stage (audio-visual 1): in this stage the test shows the same target stimulus as before. The subject must click once again the BCP. In addition to this, some visual and auditory stimuli in the form of cartoons and audios (same as in the previous sections), are presented as distractors. In this stage the load distractor is considered average and seeks attentional analysis in the face of intensely combined visual and auditory distractors.
Seventh stage (combo 2): In this stage the test shows the same target stimulus as before. The subject must click once again the BCP. Some visual and auditory stimuli are presented as distractors. Here and in contrast to previous phase distractors are presented more frequently and faster. In this stage the load distractor is considered as maximal and seeks attentional analysis in the face of intensely combined visual and auditory stimuli.
Eighth stage (basic 2): In this stage the test shows the same target stimulus as in the first stage. The volunteers must click on the BCP as soon as the stimulus appears. No visual and auditory distractions are presented. This stage simulates the phenomenon of sustained attention.
In order to carry out this study, it was necessary to break down each of the stages that occur during the test second by second. Adapting a projector and a BCP panel that would allow the patient to click according to the instructions indicated at the beginning. That was clicking each time he observed the target stimulus without paying attention to the different distractors. For all cases, the target stimulus was the same (cartoon of a child’s face with a yellow mask).
Volunteers
In this study, images were taken from 24 children (males) aged between 7 and 14 years (mean age 10 ± 1.54 years). These volunteers were subdivided into two groups: One ADHD and one Control, both with n = 12 and matched for age and weight. All of them were right-handed and did not present at the time of the study any other type of neurological disorder or any impediment that prevented them from undergoing an MRI scan. Children with ADHD have been previously evaluated by neurologists from this institution who made the diagnosis using DSM-V criteria, which state six or more symptoms related to inattention, six or more symptoms related to hyperactivity and impulsivity, all the above for at least the last 6 months (Table 1). In all cases, symptoms were ruled out as primary manifestations of mood, anxiety, personality, or substance withdrawal problems. The ADHD Rating Scale-5 tool was applied, it is designed to be completed by parents or teachers, consisting of 18 items for each of the symptoms that appear in the diagnosis of ADHD, similar to Likert in which each item is scored from 0 to 3 points (never/rarely, sometimes, often, very often) each. For this scale, the total score is matched to percentiles to make a correct evaluation of the results based on age and sex, for each of the symptoms of hyperactivity-impulsivity and inattention considering results above the 90th percentile as related to ADHD (DuPaul et al., 2016). Apart from this, all patients were under medication at the time of the scan and no comorbidities associated with ADHD were found in the evaluations.
Table Showing the 2 Groups (Cases and Controls) With the Results of the SNAP IV Scale at the Time of ADHD Diagnosis.
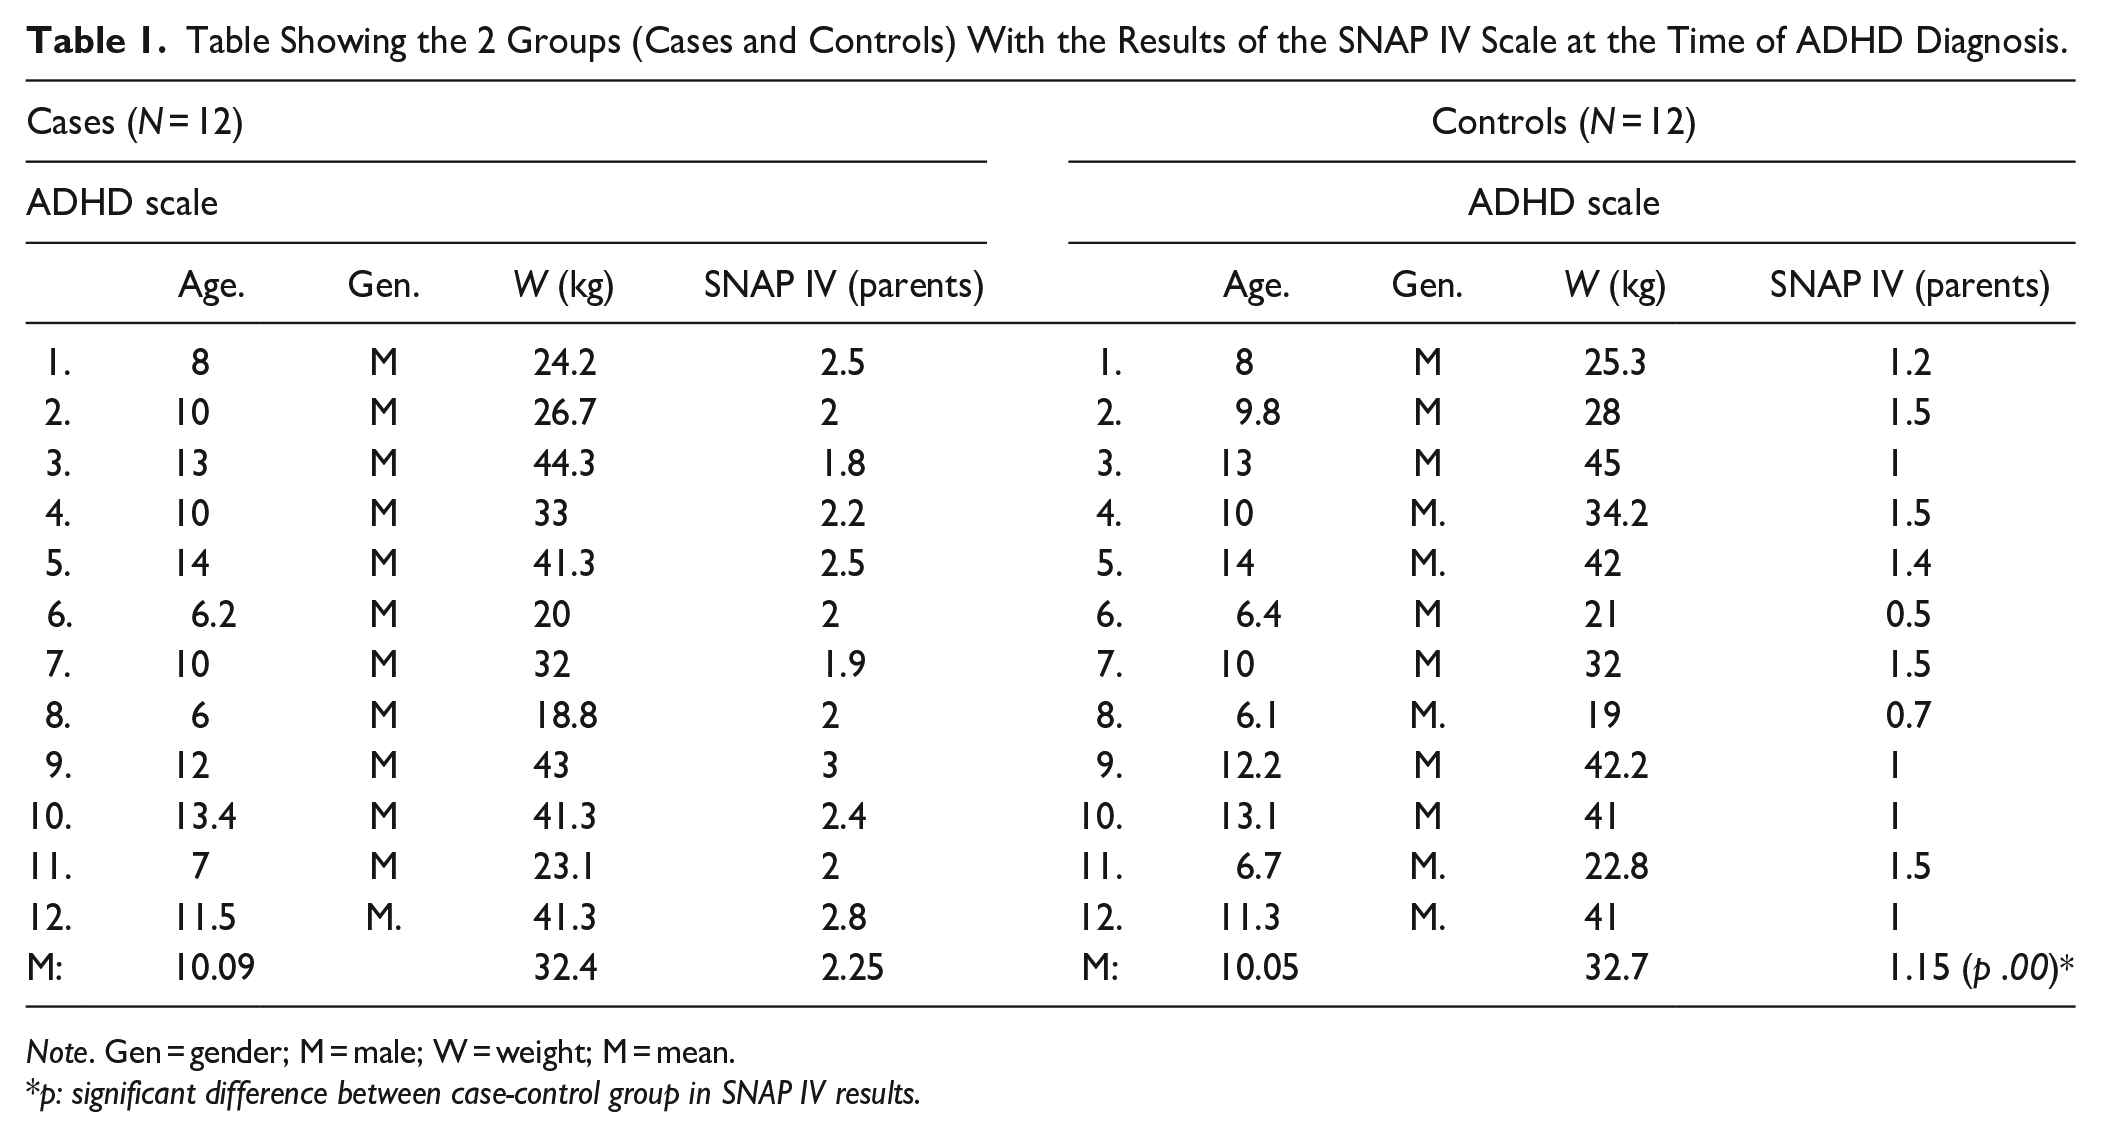
Note. Gen = gender; M = male; W = weight; M = mean.
p: significant difference between case-control group in SNAP IV results.
Hardware
All subjects underwent fMRI at 3T (Skyra, Siemens Healthcare, Erlangen, Germany) with a 32-channel head coil. MOXO game images and distractors were displayed on a screen via a mirror integrated in the head coil. All stimuli were presented in the center of the screen.
MRI Sequences
The acquired anatomical images were obtained with the T1-FLASH sequence, slice thickness 3.5 mm, TE = 2.49 milliseconds, TR = 285 milliseconds, flip angle = 70°, matrix dimensions of 320 × 256, for a field of view of 220 × 220 mm giving voxel dimensions of 0.687 × 0.687 × 3.5 mm.
The functional data was acquired with an echo planar imaging sequence, EPI, TR = 1,420 milliseconds, TE = 30 milliseconds, slice thickness 3.5 mm, matrix dimensions of 94 × 94, for a field of view of 250 × 250 mm giving voxel dimensions of 2.66 × 2.66 × 3.5 mm. Duration of 14 minutes and 39 seconds.
MR Image Analysis
This was a randomized event-related paradigm in which the different stimuli lasted for 3 seconds and periods of rest between stimuli were of 3 seconds. No jittering was included in the paradigm. All analysis was performed using programs based on the programming language MATLAB (® The MathWorks, Massachusetts, USA). Version 2017a was the one used in this project by authors. BOLD fMRI image pre-processing was performed with the CONN toolbox (https://www.nitrc.org/projects/conn, version 17a). Even if this is a toolbox usually employed for connectivity studies, the pre-processing steps are identical to those required by task related BOLD experiments. To this end, the standard pre-processing pipeline from CONN named: “Default preprocessing pipeline” was used. It included as a first step a functional data realignment and unwrap analysis in which a least square algorithm of six parameters (rigid body) spatial transformations, were applied to align all functional images to the first one. After, the realigned images were moved to a reference point (centering step). Then a slice time correction was performed on functional data (data acquisition during paradigm acquisition was ascending, and analysis was centered in the middle slice which was 18 for this case). After this step structural images were centered to the same position as functional images. The structural data was then Segmented and Normalized to an MNI template. The output of this step was cantered structural images ripped from the skull. All CSF, White and Grey matter was also stripped out of structural images and masks were built for each one of these tissues. Following structural segmentation and normalization, functional data was then normalized to MNI space and masked with the information and masks provided in the previous step. After normalization, ART correction was performed on functional data to eliminate outlier functional volumes according to the realignment parameters. Elimination of these outlier volumes was performed using scrubbing techniques. Finally, all the functional data were smoothed using a kernel which was 3 times the size of the in-plane resolution and the slice thickness. This, in order to fulfill the statistical parametric requirements that SPM software requires.
With the data already pre-processed, the next step in the analysis was to build general linear models (GLMs). To this end, SPM12 software (SPM12 Software–Statistical Parametric Mapping ucl.ac.uk) was used. Different first and second level contrasts of interest were created. First level contrasts would be those in which each one of the six possible stimuli of this paradigm, were studied for either the ADHD or the Control group. For example, the activation during a single auditory distractor in each child with ADHD. As there were six different stimuli (including all the distractors) at least six different first contrast for ADHD patients would be obtained and six for the control group as well. When first level contrast was being built, and as it is usual in the field, stimuli versus a silent period of stimulation were really calculated. This was done in order to eliminate physiological noise which might be present during both the stimuli and the silent periods. In the case presented here the screen with a grey cross was used as a silent or control stimuli. Second level contrasts were those in which the response to one of the six stimuli was compared between groups. An example would be the comparison of the double audio-visual stimuli between the ADHD and the Control group for each child.
For both cases of contrasts, statistical maps, product of a contrast, that had a significance threshold of p < .05 corrected for multiple comparisons (FE), were considered significant. Motion parameters were included as covariate parameters for noise in all contrasts built. Software applications such as the DAPRSFA VIEWER (Data Processing Assistant for Resting-State fMRI (DPARSF) | The R-fMRI Network (rfmri.org), version 6) were used to present the results of the functional study (T maps) on standard brain templates (MNI template). From them, data as position of the maximum of an activation or volume of the different activations were obtained.
It is worth mentioning that SPM in its first and second level contrasts, provided positive BOLD responses which is the most usual BOLD response studied in fMRI papers. Those are brain regions in which statistically BOLD signal was positively correlated (increased) with the stimuli applied to the subject of study. Lately, negative BOLD has also been a field of interest in research in Neurosciences. Negative BOLD represents brain areas in which the BOLD activation has been negatively correlated (decreased) with the stimuli applied. The meaning of positive and negative BOLD is still open to discussion, modulation, or quantification and its explanation is not the objective of this paper. In the discussion section we present some of this controversy to the reader. When using SPM, in order to obtain negative BOLD contrasts, the order of the stimuli which were being compared would be inverted. SPM would provide a spmT file indicating that it was a positive activation, but it would really correspond to negative BOLD activations. Auditory activation—Grey cross provides scientists with the positive BOLD result. Grey cross—Auditory Activation would provide scientists with the Negative BOLD activations.
Results
As MOXO is a CPT test with six different stimuli, as well as two different rest or silence periods (cross and gray screen); the number of first-order contrasts that can be computed is large. These first-order contrasts are presented below in Figure 1, where the individual and double distraction, both auditory and visual, are presented subtracted from a control (gray screen). Single and double gray screen auditory distractions are also included. All this for the members of each group (six first-order contrasts per group of volunteers).
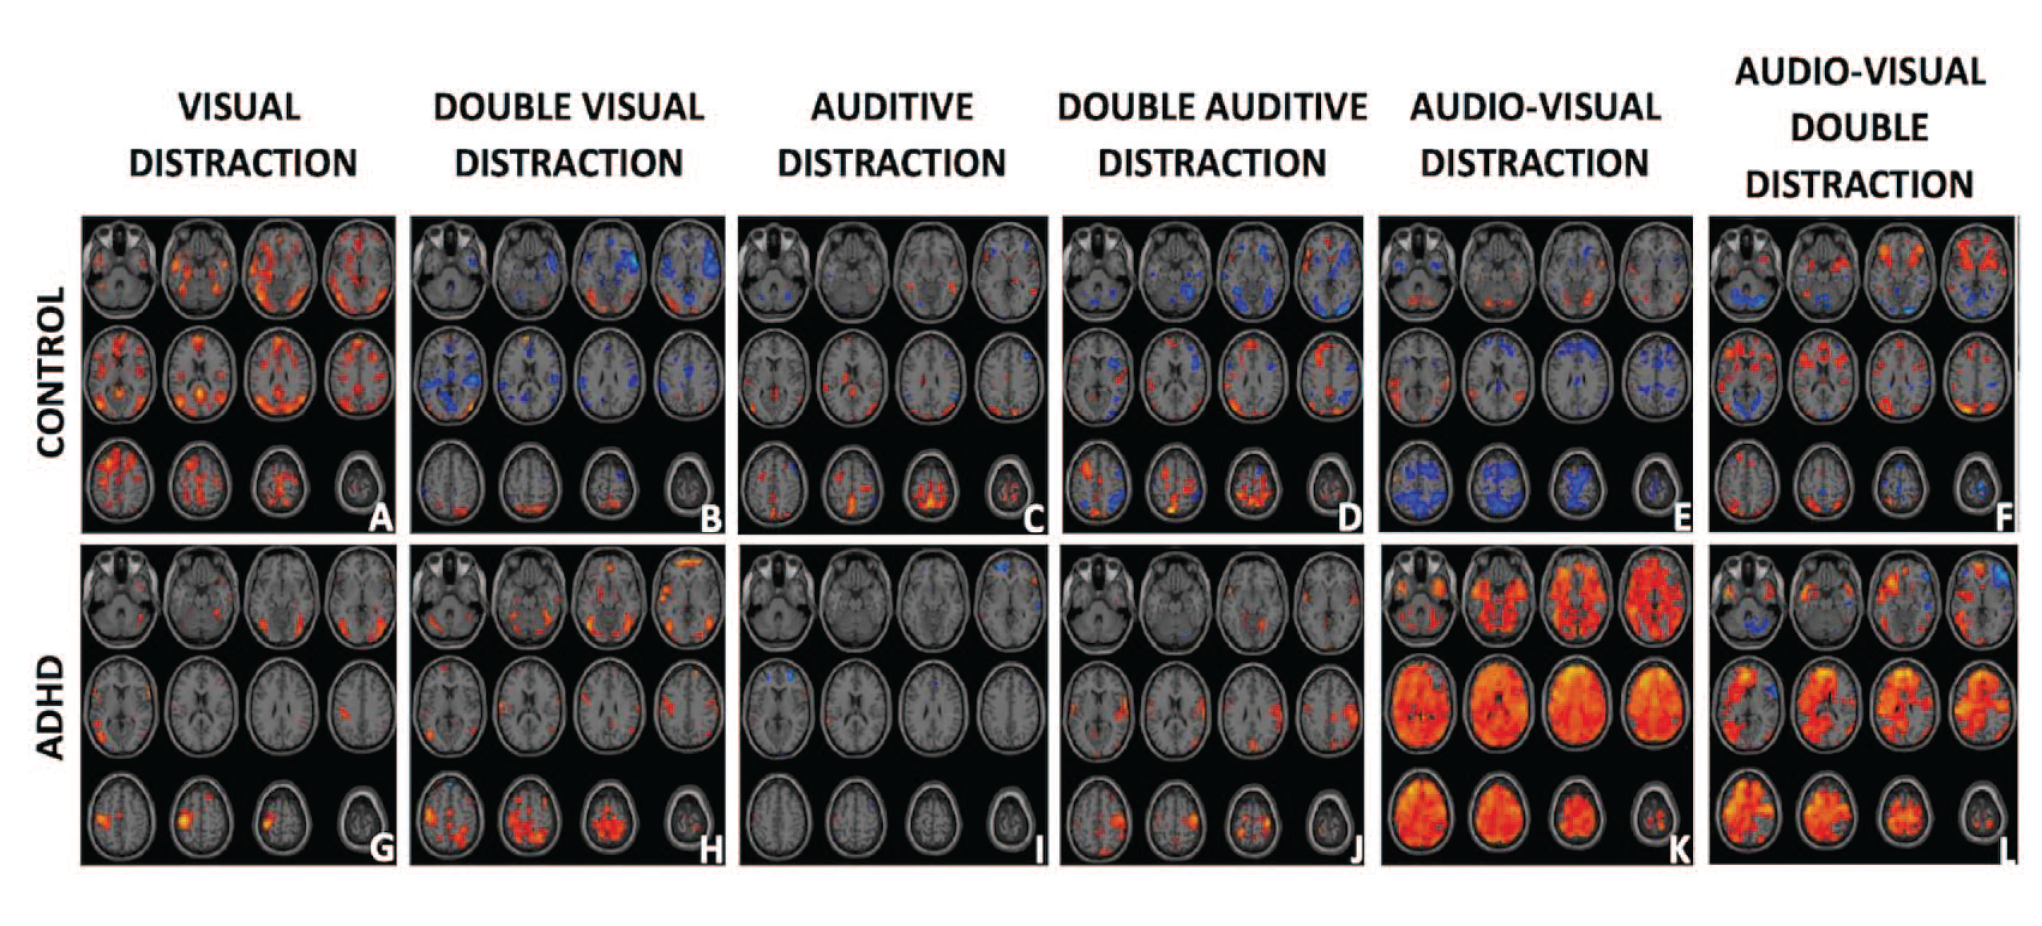
fMRI Brain activation from the study children (ADHD and Controls) under different distractors. Presented in the first row are the brain activations for the control group during the Gray Screen stimulus (an element of MOXO) with 1 visual distraction (a), double visual distraction (b), 1 auditory distraction (c), double auditory distraction (d), 1 audio-visual distractor (e), double audio-visual distractor (f). Similarly, in the second row, the results for the group of ADHD children (g–l) are presented. Warm colors represent BOLD brain activity correlated with the stimuli at the top of the column. Cold colors represent areas that were negatively correlated with stimuli. That is they presented a negative BOLD activation with that stimuli.
Finally, Figure 2 shows the differences for the six BOLD-fMRI stimuli comparing the response between the ADHD-CONTROL group. This means that hot color activations are stronger in the ADHD group than the control group and more consistent activations in the control-ADHD group will appear in cold tones.
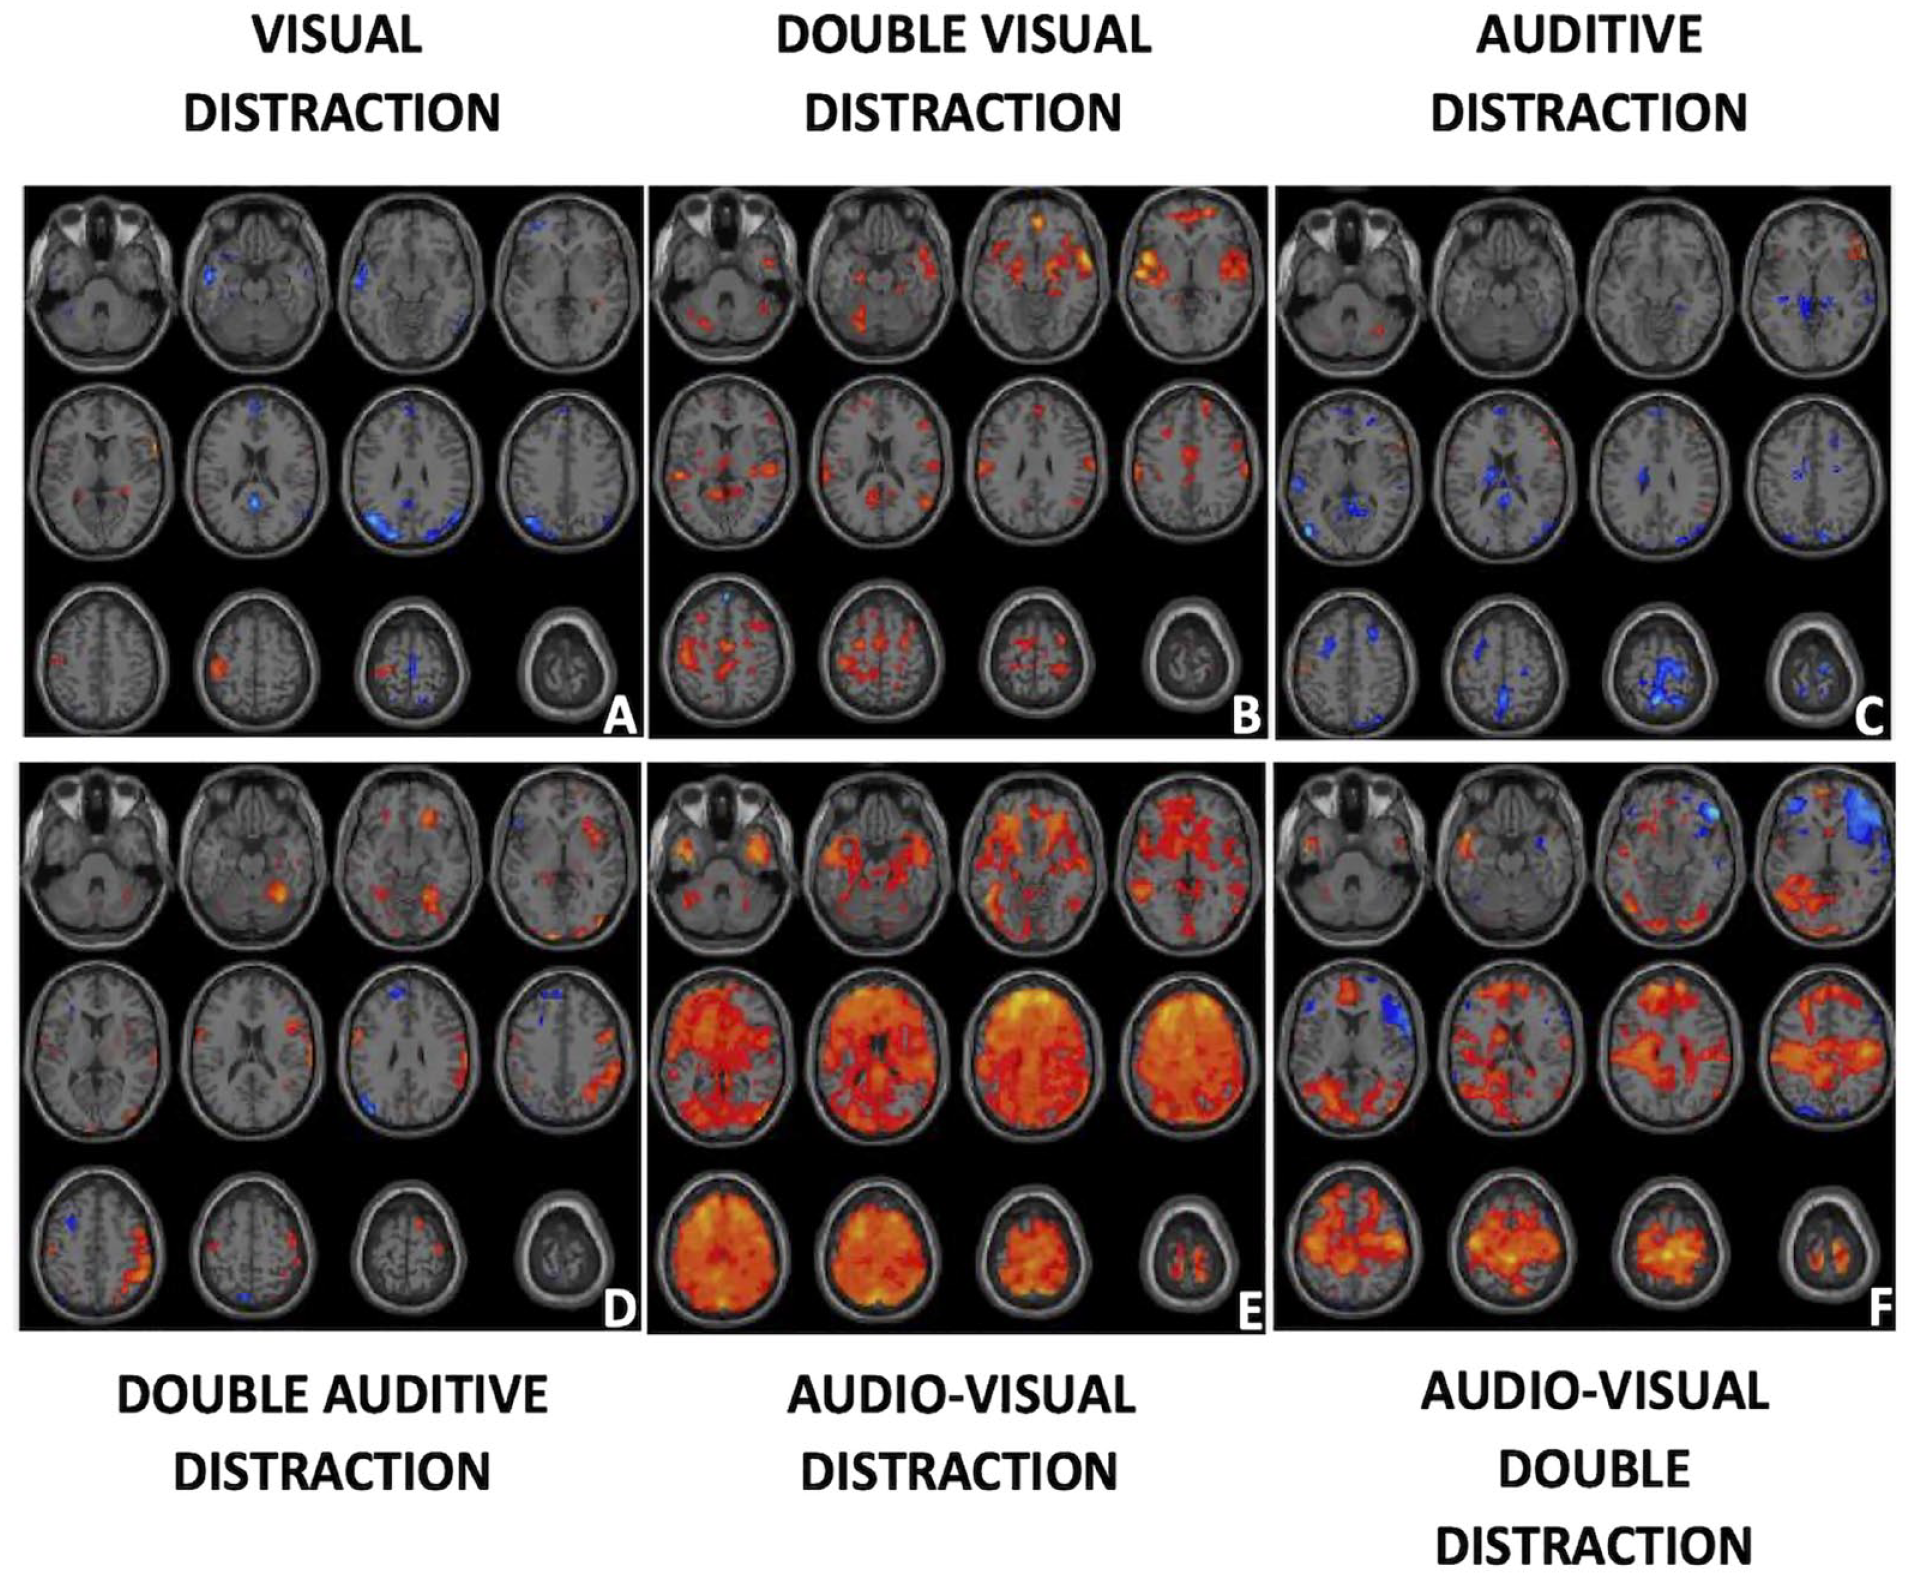
Differences between ADHD-Control. ADHD-Control fMRI activations are presented in a single row following Figure 1 format. Different stimuli are One visual distraction (a), double visual distraction (b), single auditive distraction (c), double auditive distraction (d), one audio-visual distractor (e), and two audio-visual distractors (f). Warm colors represent brain areas that were statistically, more activated for the ADHD group than the Control. Cold colors represent the opposite (Controls presented more extensive activity there than ADHD).
In Table 2 the negative BOLD activated regions of the control groups from Figure 1, for the six MOXO stimuli studied can be found. It presents the activated areas, its extension in voxels, the point of maximum activation and the degree of statistical significance for each region. The regions presented in Table 2 are classified either by Broadman Areas (BA) or Atlas Anatomical Labeled (AAL) areas. The regions and coordinates presented correspond to the maximum point of that activation cluster and it must be considered that an activation can have more than one maximum. When an activation presents more than one maximum, this was represented in Table 1 giving only a statistical value of T and one volume for that activation.
Shows Negative Regions Activated by BOLD in the Control Groups of Figure 1 for the Six Stimuli Studied Through MOXO.
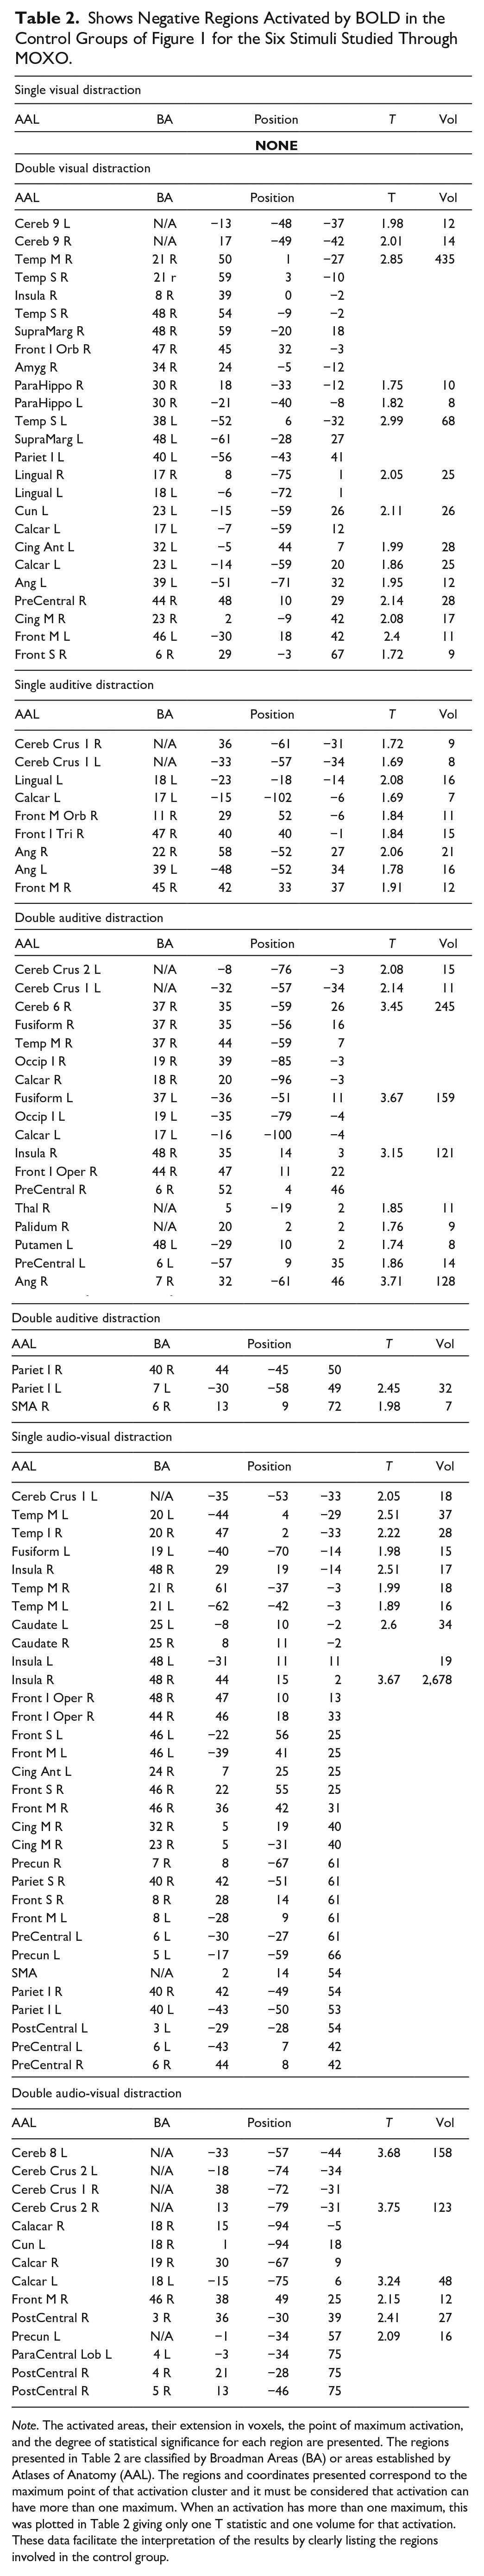
Note. The activated areas, their extension in voxels, the point of maximum activation, and the degree of statistical significance for each region are presented. The regions presented in Table 2 are classified by Broadman Areas (BA) or areas established by Atlases of Anatomy (AAL). The regions and coordinates presented correspond to the maximum point of that activation cluster and it must be considered that activation can have more than one maximum. When an activation has more than one maximum, this was plotted in Table 2 giving only one T statistic and one volume for that activation. These data facilitate the interpretation of the results by clearly listing the regions involved in the control group.
A reproducible negative response was found in at least three of the five contrasts in the following AAL regions: Cerebellum Crus 1, Angular, PreCentral, Middle Temporal, Middle Frontal, Calcarine, Insula, and Inferior Parietal. In a similar analysis of Broadman areas, the regions were found repeated in more than three contrasts: 6, 18, 19, 40, 44, 46, 48. In general, considering the negative BOLD of all contrasts A to F in Figure 1, there was a greater negative activation in the right hemisphere (2,697 voxels) than in the left (2,165 voxels) meaning a 20% greater in the right.
In Figure 2 and Table 3, it was found that for the simple stimuli (Figure 2a and c), the total activity of the Controls was greater than that of the ADHD (433 vs. 136 activated voxels). Therefore, focusing on the higher activations for Control, more activity was found in the following AAL regions: SMA, Para-central, Front Superior Medial, Posterior Cincture. If the Broadman regions were considered, these would be: 6, 10, 19, 21, 22, and 26. Results were lateralized to the left (269 vs. 141 activated voxels).
Shows the Most Relevant Activations in Figure 2.
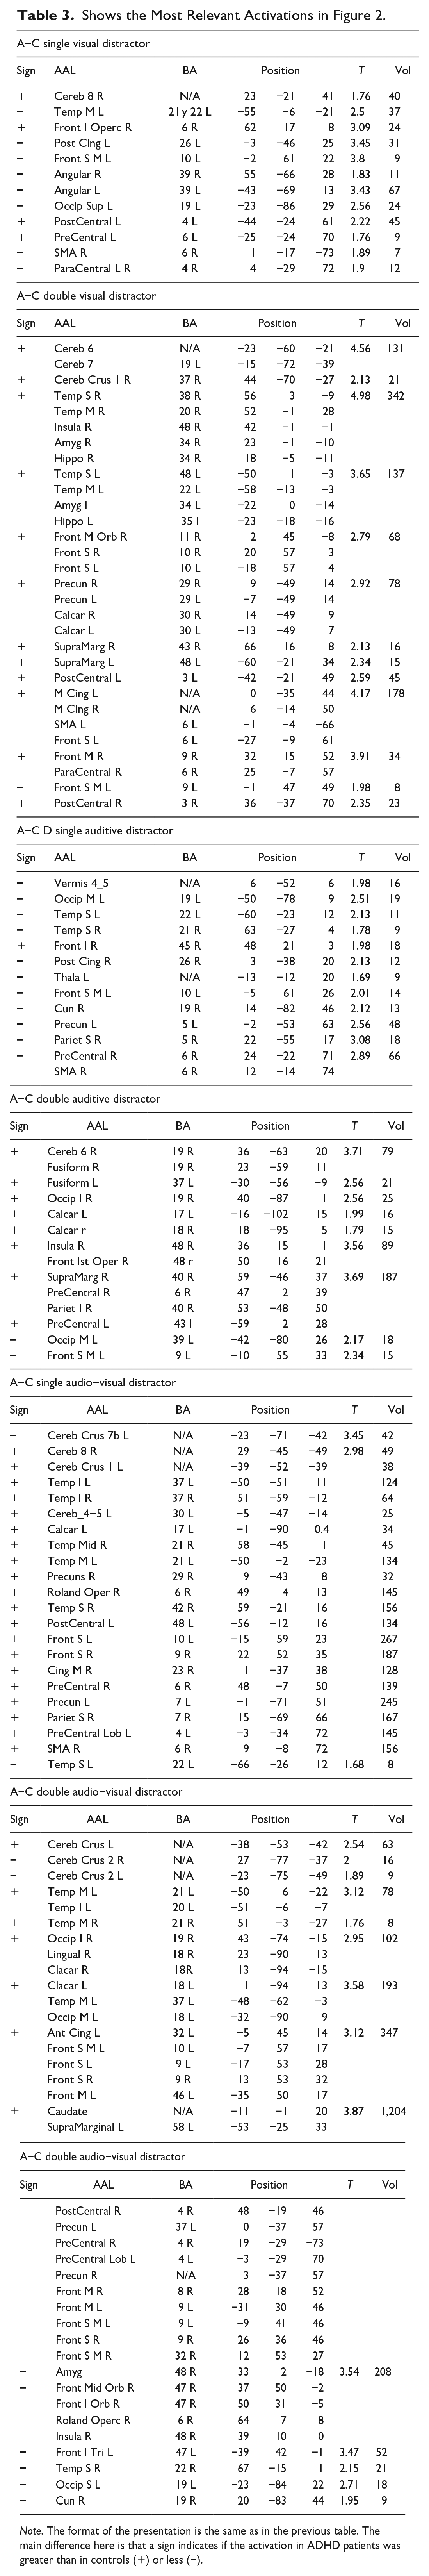
Note. The format of the presentation is the same as in the previous table. The main difference here is that a sign indicates if the activation in ADHD patients was greater than in controls (+) or less (−).
For the more “complicated” contrasts in Figure 2b, d, e, and f, greater activity was found in the ADHD group than in the Control group. The regions most involved in this effect were in AAL: Superior and Middle Temporal Lobe, Insula, Superior Frontal Lobe, Supramarginal, Post- and Pre-central, Precuneus, Calcarine. In BA regions, the following should be mentioned: 6, 10, 19, 22, 37, and 48. The results were slightly lateralized to the left with 2,952 voxels activated on the left side compared to 2,674 on the right.
Discussion
As a summary of the results from this work: First, both groups presented different BOLD activations. Second, the control group presented larger negative BOLD than the ADHD group, this was observable in Figure 1 in five of the six contrasts studied. Some of these regions with negative activations were Cerebellum Crus 1, Angular, PreCentral, Middle Temporal, Middle Frontal, Calcarine, Insula, and Inferior Parietal. Third, simple distractions elicited greater activations in Control versus ADHD as can be seen in Figure 2 in the first and third contrast. Fourth, double distractions caused greater activations in ADHD versus Control. This can be seen in Figure 2 contrasts B and D. Audiovisual activations were considered double or quadruple distractors, so they were considered extreme cases of double distractions. As seen in Figure 2 contrasts E and F, this effect was even greater than for the other two contrasts (B and D). Fifth, in terms of activated brain regions, it can be seen in Table 3 that for the simple contrasts (Figure 2a and c) there were more activations in controls than in ADHD in the regions of: SMA, Paracentral, Front Superior Medial, Posterior Cincture. This corresponded to the Broadman regions: 6, 10, 19, 21, 22, and 26. Sixth, when comparing the largest activations for ADHD versus Control in complicated stimuli (Figure 2b, d, e, and f) activations were found in regions such as: Superior and Middle Temporal Lobe, Insula, Superior Frontal Lobe, Supramarginal, Post- and Pre-central, Precuneus, Calcarine and in Broadman regions: 6, 10, 19, 22, 37, and 48. Regarding lateralization of activations, the most common negative representations in Controls had a greater right lateralization than left. Whereas in the ADHD–Control comparison, activations in ADHD were more prominent in the left hemisphere.
BOLD Activations for Different Stimuli. Negative BOLD Implications
It can be seen in the upper line of Figure 1 and in the results of Table 2, that there is a large presence of negative BOLD activation in CONTROL versus ADHDs. The origin of the BOLD signal is still a topic of much discussion in the scientific world due to its dependence on multiple variables (total neuronal activity and type of activity, O2 consumption or blood flow variations in regions to be studied, etc.). There is no definitive explanation of the weight of each parameter and, in general, what the BOLD can represent, neither in the positive nor in the negative case Mark et al., 2015; Song, 2012). The negative BOLD is considered by some authors as representative of inhibitory neuronal activity taking place in that brain region. This type of action is associated with reduced neuronal activity at the neurotransmitter level that consumes small amounts of O2. This activity is not large enough to require the vascular system to flood the region with fresh blood rich in O2 and therefore produce a positive BOLD signal. The result of that “disappearance” of O2 in that region is negative BOLD (Lauritzen et al., 2012; Wade, 2002). In the case of this study, the areas most affected by negative BOLD in control patients versus ADHD were Cerebellum Crus 1, PreCentral, Middle Temporal, Middle Frontal, Calcarine, Inferior Insula and Parietal, Angular. In a similar analysis of Broadman areas the regions found were: 6, 18, 19, 40, 44, 46, 48.
Of all the regions mentioned in the previous paragraph, all except Cerebral Crus 1 and 48 (hippocampus) are related in some way to the integration of auditory and visual stimuli. The Calcarine and Regions 18 and 19 are visual detection and visual association zones (Luck et al., 1996). The inferior parietal lobe that includes BA 40, supramarginal, and the Angular gyrus are related, among other functions, to the processing of sensory stimuli and the behavior based on them, as well as being modulators of attention (Yap et al., 2021). They are also part of default network structures. This network has several functions, but it has been found to be impaired and negatively correlated with other networks in patients with ADHD (Broulidakis et al., 2022). The insula is related to the functions of processing audio-visual stimuli in addition to introspection and to social emotions and emotion in general. The Median Frontal Lobe, which includes BA 6 (Premotor) and 46 (DLPFC), also fulfills these functions of audio-visual association. The premotor area, specifically, is strongly involved in the interpretation of visual and auditory stimuli from the environment so that the person can locate himself. Meanwhile, the DLPFC has many functions, especially of an executive nature and decision-making (McDermott et al., 2003; Yap et al., 2021). But among them, the visual working memory also stands out, in which several images are processed at the same time. Finally, the Middle Temporal Lobe is generally related to the formation of visual memory (because of its proximity to the hippocampus and activated in our experiments) (Schweren et al., 2015) as well as the processing of visual and auditory inputs (Luck et al., 1996). While BA 44 (in the Inferior Temporal Lobe) includes the Broca and is used among others for auditory perception. Therefore, in all these regions we hypothesize that inhibitory activities with neurotransmitters of this kind are taking place. This activity is possible in control patients, but not in ADHD patients due to the cerebral pathophysiology characteristic of this disorder. The net result is brain activity in those regions for control patients, the appearance of negative BOLD in those regions, and no activity in ADHD subjects.
The activities in other regions not so related to associative visual activity are: The BA 48 (hippocampus). This is a large inhibition center that if damaged causes animals to become hyperactive (Russell et al., 2005). It is also involved in spatial navigation, memory, and learning (Paloyelis et al., 2007). Therefore, showing activity in Control patients and not in ADHD is a result that could be expected. In contrast the Cerebellum Crus 1. Although it has always been considered a movement control center, more recently it has been found to have a role in the regulation of feelings and cognitive function in general (Chauhan et al., 2021).
All negative BOLD results, contrast with the bottom row of Figure 1, where the ADHD group hardly showed inhibition and/or negative BOLD of any kind. The results of comparison between stimuli between groups (Figure 1 and Table 2), are an indication of the different tactics that the brain used in the two groups, to process this type of information/stimuli. It is shown that mainly the areas involved in the association of audio-visual stimuli are the ones that are most affected by ADHD, presenting a lack of activity or a lack of inhibition that control patients, in contrast, present.
BOLD ADHD-Controls. Functional Networks
Of the three attention “disruptors,” it was the audio-visual one that produced the greatest positive activations in both groups. As it can be seen in Figure 2 and Table 3, these positive activations included regions for ADHD such as: Superior and Middle Temporal Lobe, Insula, Superior Frontal Lobe, Supramarginal, Post- and Pre-central, Precuneus. For the Controls, the activated zones were: Middle and Inferior Frontal Lobe as well as the Superior Temporal Lobe.
In the control group throughout the test, the activation of a strong inhibition, especially in the motor areas, was observed before the different stimuli. This ensured that the subjects did not make activation or omission errors in the MOXO test. This showed how the capacity for inhibition in daily life was essential to modulate the appropriate responses to different stimuli. It was even observed, when different stimuli were increased or mixed, how inhibition activation increased, favoring the making of right decisions. This occurred mainly in frontal regions, responsible for the attentional process and the inhibition of motor activators.
In contrast, the ADHD group showed multiple activations in different areas, which could be considered in two ways: On one hand, the lack of inhibition of these patients due to the defects in their executive functions, which lead to a disorganization of the different systems; caused each area separately to try to respond abnormally to the stimuli but in a disorganized way; making errors of stimuli and omissions, with common problems throughout the test. On the other hand, it could establish that the control of the attentional processes was not controlled by the frontal processes, and that they required a cerebellar activation that favored the organization of the tissue, trying to modulate the responses of the different areas, which lead to executive failure. The strong activation of motor areas helps understand why ADHD patients committed multiple execution errors as seen in the study.
Study Limitations
This study was limited by several reasons. Ones would be the number of volunteers employed in the study. N = 12 in each group. This is the minimum number of patients accepted in publications of the medical imaging with BOLD kind. This is because it is known to guarantee approximately a study power of 0.8 and acceptable statistical confidence intervals. A search of papers in the field show, that even if not ideal, there are fMRI studies performed with volunteer groups of n = 12 (Ellis et al., 2020; Rodriguez et al., 2021; Srirangarajan et al., 2021). However, it is indisputable that a larger number of patients would have helped improve the statistics and relevance of the study. Recently Szucs et al. (2020) shows that n = 12 might be too small in some cases in which data present large dispersion between volunteers. A greater number of volunteers would probably have helped by making the activated areas in the different contrasts more defined, reduced, statistically relevant and precise. In addition, more volunteers in the study would have allowed individual comparisons between patients without having to include all patients and make “averages” out of them. This analysis is undoubtedly of great interest since it would allow us to see if the results presented here for groups are also true for individual patients. Knowing if individually we could use MOXO to accurately diagnose and quantify ADHD and the results of a patient with this disorder are different from those of a control patient. This is a point of great interest since, based on previous experience, statistically significant differences between groups were usually found in ADHD, but at the individual level, the variability between patients made individual comparisons and analyses unfeasible (Alonso et al., 2015).
Another limitation of using MOXO-CPT in an fMRI study is the very large number of contrasts that can be constructed. There are six distractor stimuli and two baseline stimuli. The combination is enormous and if two or more research groups are added to it if we consider the different types of ADHD or comorbidities associated with it, they mean that there may be thousands of comparisons or contrasts to study. This work focused on the comparison between groups to answer the question of the difference in brain activations between ADHD and healthy. But undoubtedly, there is much information that has not been considered in all the other contrasts that can be studied. Its inclusion in this work, we think, would have made the document too expense, obscure, and would create many difficulties to derive any kind of useful conclusion from it (Czerniak et al., 2013; Samea et al., 2019).
Conclusions
As stated in the objectives of this study, different patterns of BOLD activation were found between the groups of ADHD patients versus Control. The results of comparison of stimuli between groups (Figure 1 and Table 2), are an indication of the different tactics that the brain used in the two groups to process this type of information/stimuli Mainly areas involved in the association of audio-visual stimuli, were the ones that are most affected by ADHD in this experiment, presenting either a lack of activity or a lack of inhibition that control patients showed in contrast. The results shown in the correlation of the BOLD contrast with the MOXO-CPT in patients with ADHD in comparison with the control group, our hypothesis is that the failure of a single system in these patients, probably it has to do with the important deregulation of the entire command system by different circuits. But it does seem that the most important thing is the deficit in the inhibition capacity of the most developed circuits. This leads to an activation of more basic and disorganized circuits in these patients. These results might allow us to reorient the therapeutic needs in these patients and understand the importance of early work in patients with ADHD to modulate the expressions and regulations of the attentional circuits and, above all, to improve the individual’s capacity for their quality of life.
Footnotes
Author Contribution Statement
All authors contributed equally to this article.
Declaration of Conflicting Interests
The author(s) declared no potential conflicts of interest with respect to the research, authorship, and/or publication of this article.
Funding
The author(s) received no financial support for the research, authorship, and/or publication of this article.
Ethical Statement
This study had permission from the ethics committee of the entity where the experiment was conducted. The ethics permit code for this study was: HIM/2019/016. To complete it, the criteria of the Helsinki Treaty for human experimentation were met. The volunteers and their legal guardians were first informed. The corresponding letters of information and consent to participate in the study were latter signed. At any time, the volunteers were informed that they could abandon the protocol. All the information and volunteer data were anonymized.