
Abstract
Objective:
ADHD has a multi-factorial etiology among which the inflammatory theory presupposition. We aimed to explore the interplay between blood inflammatory markers; neutrophil lymphocyte ratios (NLR), platelet\lymphocyte ratio (PLR), mean platelet volume (MPV), symptom domains, and severity of ADHD.
Method:
A total of 50 children with ADHD and 50 healthy controls were recruited. Children were assessed using the mini-international neuropsychiatric interview for children and adolescents (MINI-KID), the Wechsler intelligence scale for children, the Conners’ parent rating scale. Then, NLR, PLR, and MPV were measured.
Results:
There was a statistically significant difference between children with ADHD and the control group with regard to all blood inflammatory markers (except platelet count). The subtypes and severity of ADHD had no significant relation with NLR, PLR, and MPV.
Conclusion:
blood inflammatory markers are significantly high in children with ADHD but could not predict specific symptom domains or severity.
Introduction
ADHD is a common childhood psychiatric disorder with a complex etiology. The risk of developing ADHD could be attributed to different factors such as peri-natal problems whether environmental factors or nutrition, preterm birth, and exposure to heavy metals (Núñez-Jaramillo et al., 2021). Pathological findings in children with ADHD include small anterior cingulate gyrus and dorsolateral prefrontal cortex, in addition to decreased activity in the fronto-striatal region (Magnus et al., 2023).
The prevalence of ADHD among Egyptian children in the primary school accounted for 10.5%, with higher prevalence in males compared to females and in rural areas compared to urban areas (Younis et al., 2023). It has been demonstrated that children with ADHD exhibit increased use of mental health, social, and special education services (Pelham et al., 2007).
It has been established that immunological and inflammatory mechanisms may play an essential role in the patho-physiological predisposition and progression of neuropsychiatric disorders like ADHD, thereby accounting for impairments in children’s self-regulation at the emotional, cognitive, and behavioral levels (Leffa et al., 2018; Mazza et al., 2018; Miller & Goldsmith, 2017). This could be explained by several mechanisms, among them are; changes in cytokines, normal microglia, chemokines, astrocytes, and oxidative stress (Corona, 2020).
Scarce studies had addressed the relationship between blood inflammatory markers and ADHD. However, these studies yielded conflicting findings. Avcil (2018) reported that children with ADHD had significantly higher NLR, PLR, MLR, MPV, and neutrophil count values compared to the healthy control group. Indeed, Akinci and Uzun (2021) reported that only NLR and neutrophil count were significantly higher in female children with ADHD. Whereas, the studies of Binici and Kutlu (2019) and Elsadek et al. (2020) did not report any changes in the inflammatory parameters in children with ADHD. Meanwhile, Dietrich-Muszalska and Wachowicz (2017) suggested that platelets may have an active role in ADHD. While, Avcil (2018) found that platelet count was not significantly different between children with ADHD and control group.
Thereby, blood inflammatory biomarkers could allow better understanding of the disease status and/or predicting the prognosis of children with ADHD in various clinical situations with simple blood tests (Avcil, 2018; Lee et al., 2018). Indeed, blood inflammatory biomarkers can be used as a simple, easily obtained, and cost-effective marker of inflammatory activation that occurs in ADHD (Mazza et al., 2018). Prospective studies addressing the alterations in blood inflammatory markers following ADHD treatment could provide more information about the inflammatory process in ADHD (Onder et al., 2021).
The present study uses a series of established psychometric tests and blood inflammatory markers (NLR, PLR, and MPV) as biochemical markers to elucidate the role of blood inflammatory markers in children with ADHD, and to examine its relation to symptom domains and severity of illness.
This study was based on the hypothesis that blood inflammatory markers (NLR, PLR, and MPV) would be high in children diagnosed with ADHD compared to healthy controls, and it was hypothesized that blood inflammatory markers would correlate significantly with symptom domains and severity of ADHD. Thus, blood inflammatory markers could open a new field as a diagnostic and prognostic method in children with ADHD.
Data and Methods
Sample
A total of 100 participants were recruited from the psychiatric outpatient clinic at El-Matarya teaching hospital, the general organization for teaching hospitals and institutes, the Ministry of Health and Population. Using a PASS II program, a sample size of at least 35 children with ADHD, and 35 healthy controls achieved 80% power to reject the null hypothesis of zero effect size when the population effect size is 0.70 (a large effect size) and the significance level (alpha) is .050 using a two-sided two-sample equal-variance t-test. We recruited 50 children with drug-naive newly diagnosed ADHD and 50 matched healthy controls.
Male and female children diagnosed ADHD, with age range 6 to 11 years were included in the current study from the outpatient clinics after their parents or legal guardians had given an informed consent. While, children with co-existing current or past neuropsychiatric disorder/s, mental retardation, having any acute or chronic infection that could increase blood inflammatory markers level were excluded. We also excluded children who receive medications that could affect leucocytes and/or platelets’ count or function.
Children who fulfilled the inclusion criteria were subjected to the Mini-International Neuropsychiatric Interview for children and adolescents (MINI-KID; Sheehan et al., 1998) which was administrated by the researcher to reach the definite diagnosis of ADHD and to exclude any co-morbid psychiatric disorder. Then, the children were referred to the clinical psychologist to assess intelligence quotient using the Wechsler intelligence scale for children (WISC; Melika, 1998) and to assess the severity of ADHD using the Conners’ Parent Rating Scale Revised-Long version (El-Sheikh et al., 2002).
Healthy controls were recruited from the relatives of staff working at El-Matarya teaching hospital, the general organization for teaching hospitals and institutes, the Ministry of Health and Population. They were demographically matched with patients with ADHD. MINI-KID was applied to exclude any mental illness.
Measures
Clinical and Psychological Assessment of the Patient Group
Children with ADHD and their parents were interviewed and demographic characteristics, full psychiatric, and medical history was collected in El-Matarya teaching hospital designed psychiatric sheet. The clinical assessment covered the following topics; prenatal and postnatal periods such as bleeding during pregnancy, infections, any obstetric complications during delivery, post-natal cyanosis or jaundice, and low birth weight. Then, detailed motor and mental developmental milestones were assessed. The anthropometric measurements were taken in light clothing (no shoes). Height was measured to the nearest 0.1 cm with a stadiometer; weight was recorded on a digital platform scale accurate to 0.1 kg (BMI = weight [kg]/height [m2]; Dorian, 2010).
Socio-Economic Status Scale
The scale is an extended, updated, and validated form of the earlier socio-economic status scale developed by Fahmy and El Sherbini (1983) in order to cover more domains including; family, education and cultural, family possessions, economic, occupation, home sanitation, and health care with a total score of 84 (El-Gilany et al., 2012). According to the quartile of the calculated score, the scoring of is categorized into high, middle, low, and very low socio-economic status.
The Mini-International Neuropsychiatric Interview for Children and Adolescents (MINI KIDS)
The MINI-KID is a reliable and valid measure to confirm the diagnosis of ADHD and exclude any co-morbid psychiatric disorder, with an administration time of approximately 15 minutes (Ibrahim, 2002; Sheehan et al., 1998). It is based on a semi-structured interview that is administered through the clinician. It allows a wide coverage of psychiatric disorders according to DSM-IV and ICD-10. The authors used the Arabic version of the scale.
The Wechsler Intelligence Scale for Children (WISC)
The scale was intended to evaluate the cognitive and intellectual abilities of children and adults (Melika, 1998). The authors used this scale to exclude children with below average IQ. The verbal IQ and performance IQ was scored based on the results of testing, then a composite full scale intelligence quotient result (IQ) is computed. The mean administration time to complete the test is 60 to 90 minutes. The version used in this study was the Arabic version that was translated into Arabic language and had the reliability and validity tests done by Melika and Ismail (1998).
The Conners’ Parent Rating Scale Revised-Long Version
The scale consists of 80 items that are scored on 14 subscales of symptoms with an average administration time of 25 to 30 minutes (Conners et al., 1996; El-Sheikh et al., 2002). It scores the parents’ report of their child’s behavior during the past month on a 4-point-response scoring; (0) Not true or seldom true, (1) Just a little true, occasionally, (2) Often true, quite a bit, and (3) very often, very much true. The authors used this scale to assess the severity of ADHD. The version used in this study was the Arabic version that was translated into Arabic language and had the reliability and validity tests done by El-Sheikh et al. (2002).
Clinical and Psychological Assessment of the Control Group
Clinical interview and examination was carried out to confirm that children were healthy with no psychiatric or medical disorders. In addition, the prenatal, natal, postnatal and developmental history was obtained. MINI-KID was administrated by the researcher to confirm that children were free from any psychiatric disorders. BMI was calculated after obtaining the weight and height of the children.
Biochemical Assessment for the Patient and Control Group
Blood samples were collected from all participants through veni-puncture into a test tube containing an anticoagulant ethylene-di-aminetetra-acetic acid (EDTA) to prevent clotting of the sample. Then, the Complete blood count (CBC) was analyzed using automated analyzer after being placed on a rack in the analyzer. Blood cell counting was achieved by flow cytometry after aspiration and dilution of a very small amount of the specimen and passing it through an aperture and a laser flow cell. MPV also calculated measuring the average size of platelet (reference range; 9.7–11.5 fl). NLR was calculated by dividing the absolute neutrophil count by absolute lymphocyte count (the mean value reference range; 1.2–4.4). PLR was calculated by dividing platelet count by lymphocyte count (the mean value reference range; 75–199; Alexander, 2016).
Ethical Consideration
Agreement for this research was obtained from the authority of Ain Shams University, Ethical and Research Committee; and an informed oral and written consent were obtained from all participants’ parents or legal guardians enrolled in the current research, after a very clear explanation, providing information about the purpose of the study.
Analytical Approach
Data were tabulated and analyzed using IBM SPSS advanced statistics version 20 (SPSS Inc., Chicago, IL). Numerical data were expressed as mean and standard deviation or median and range as appropriate. Qualitative data were expressed as frequency and percentage. Chi-square test (Fisher’s exact test) was used to examine the relation between qualitative variables. For quantitative data, comparison between two groups was done using either student t-test or Mann-Whitney U test (non-parametric t-test). Spearman-rho method was used to test correlation between numerical variables. p > .05 = non-significant, while p < .05 = significant.
Results
Sample Description
Comparing children with ADHD with healthy control group with regard to socio-demographic data revealed; There was no statistically significant difference between the patient group and control group regarding age, sex, birth order, number of siblings, and socioeconomic status (p = .069, .102, .474, .821, and .566 respectively; Table 1).
Socio-Demographic and Clinical Data of the Participants.
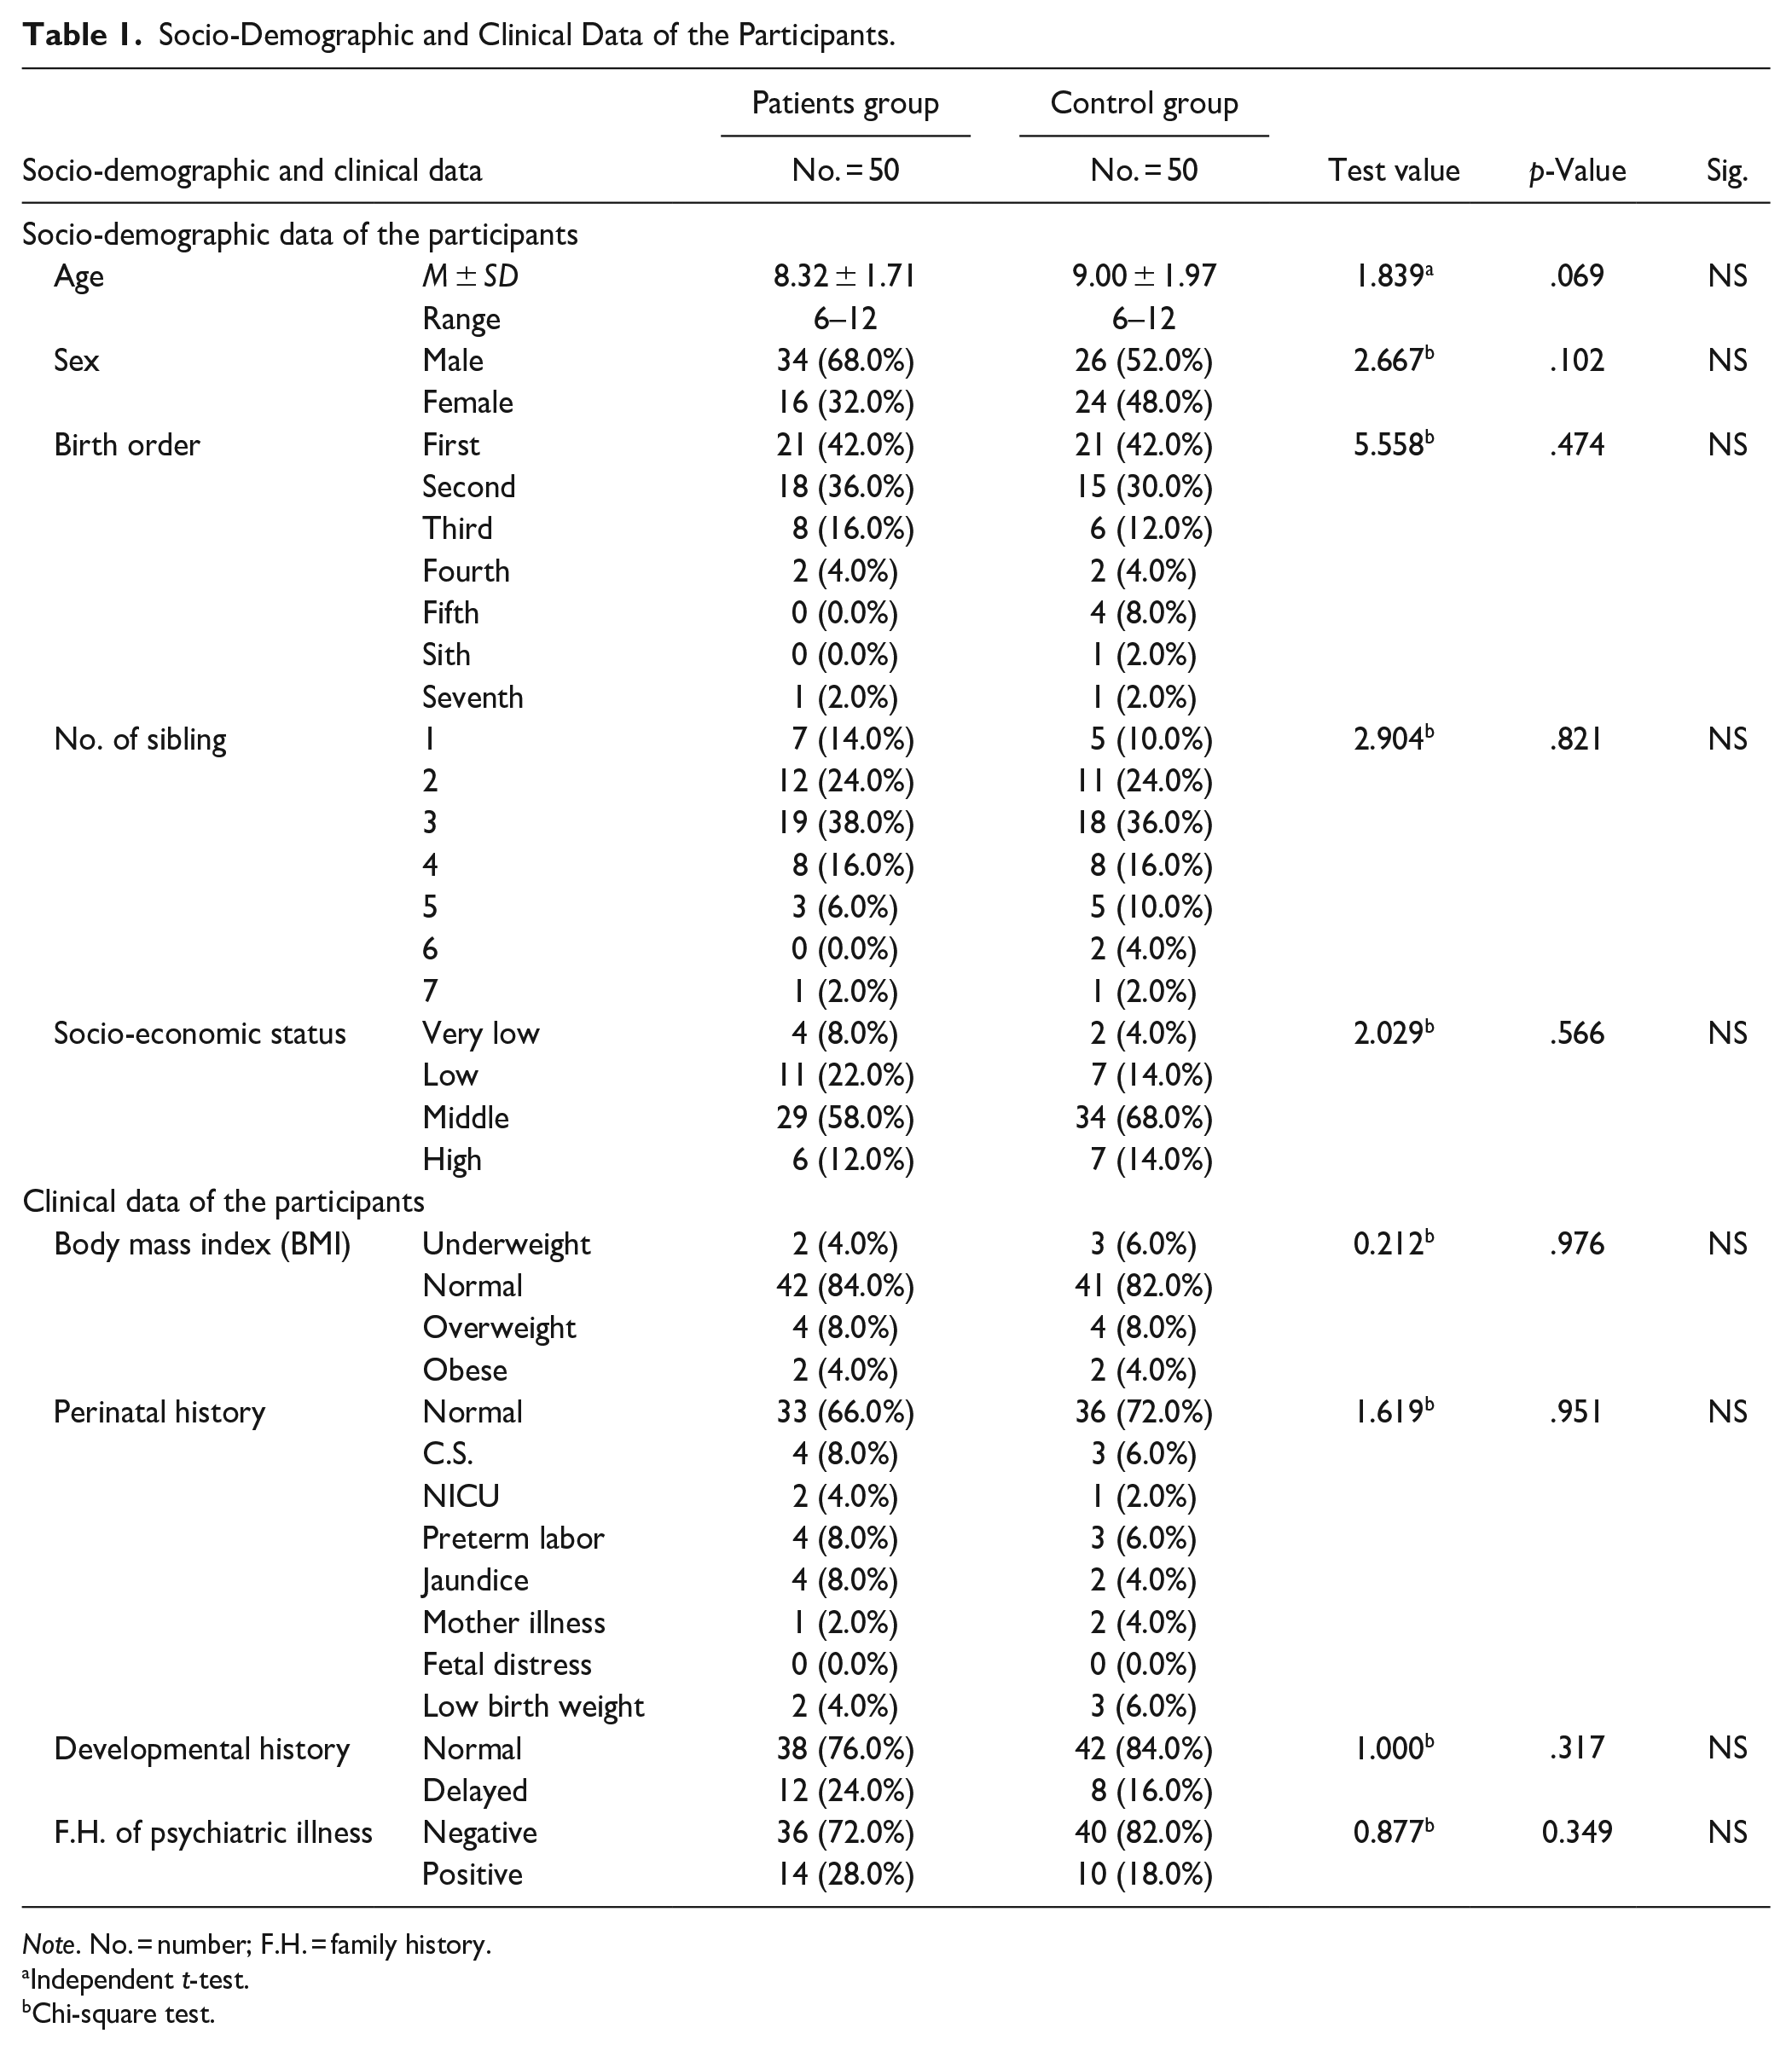
Note. No. = number; F.H. = family history.
Independent t-test.
Chi-square test.
Concerning clinical data, there was no statistically significant difference between the patient group and control group regarding body mass index (BMI; p = .976). Children with ADHD had more history of cesarean section (C.S.), neonatal intensive care unit (NICU) admission, jaundice, and preterm labor than the control group yet, with no statistically significant difference (p = .951). Children with ADHD had more history of developmental delay than the control group yet, with no statistically significant difference (p = .317). Indeed, children with ADHD had more positive family history of psychiatric disorders than the control group yet, with no statistically significant difference (p = .349; Table 1).
Clinical Characteristics and Profile of Children With ADHD
Clinical Characteristics of Children With ADHD
The commonest presentation of children with ADHD was hyperactivity (25, 50.0%), while the least common presentation was impulsivity (6, 12.0%). On applying MINI-KID; the commonest subtype of ADHD was mixed subtype (42, 84%), followed by inattentive subtype (5, 10%), then hyperactive subtype (3, 6%). The minority of children with ADHD (8, 16.0%) were taking medication for ADHD. The majority of them were on stimulant medication (5, 62.5%) (Table 2). On assessing children with ADHD using Conners’ parents rating scale; the majority had severe degree in the following subscales; oppositional (27, 54.0%), cognitive problem/inattention (23, 46.0%), hyperactivity (27, 54.0%), Conners’ ADHD index (23, 46.0%), Conners’ global index; restless impulsive (25, 50.0%), Conners’ global index (27, 54.0%), total DSM-IV inattentive (27, 54.0%), DSM-IV hyperactivity/impulsivity (28, 56.0%), and DSM-IV total (26, 52.0%). Meanwhile, the majority had mild degree in the following subscales; psychosomatic (20, 40.0%), social problem (26, 52.0%), and anxious/shy (28, 56.0%).
Clinical Characteristics and Profile of Children With ADHD.
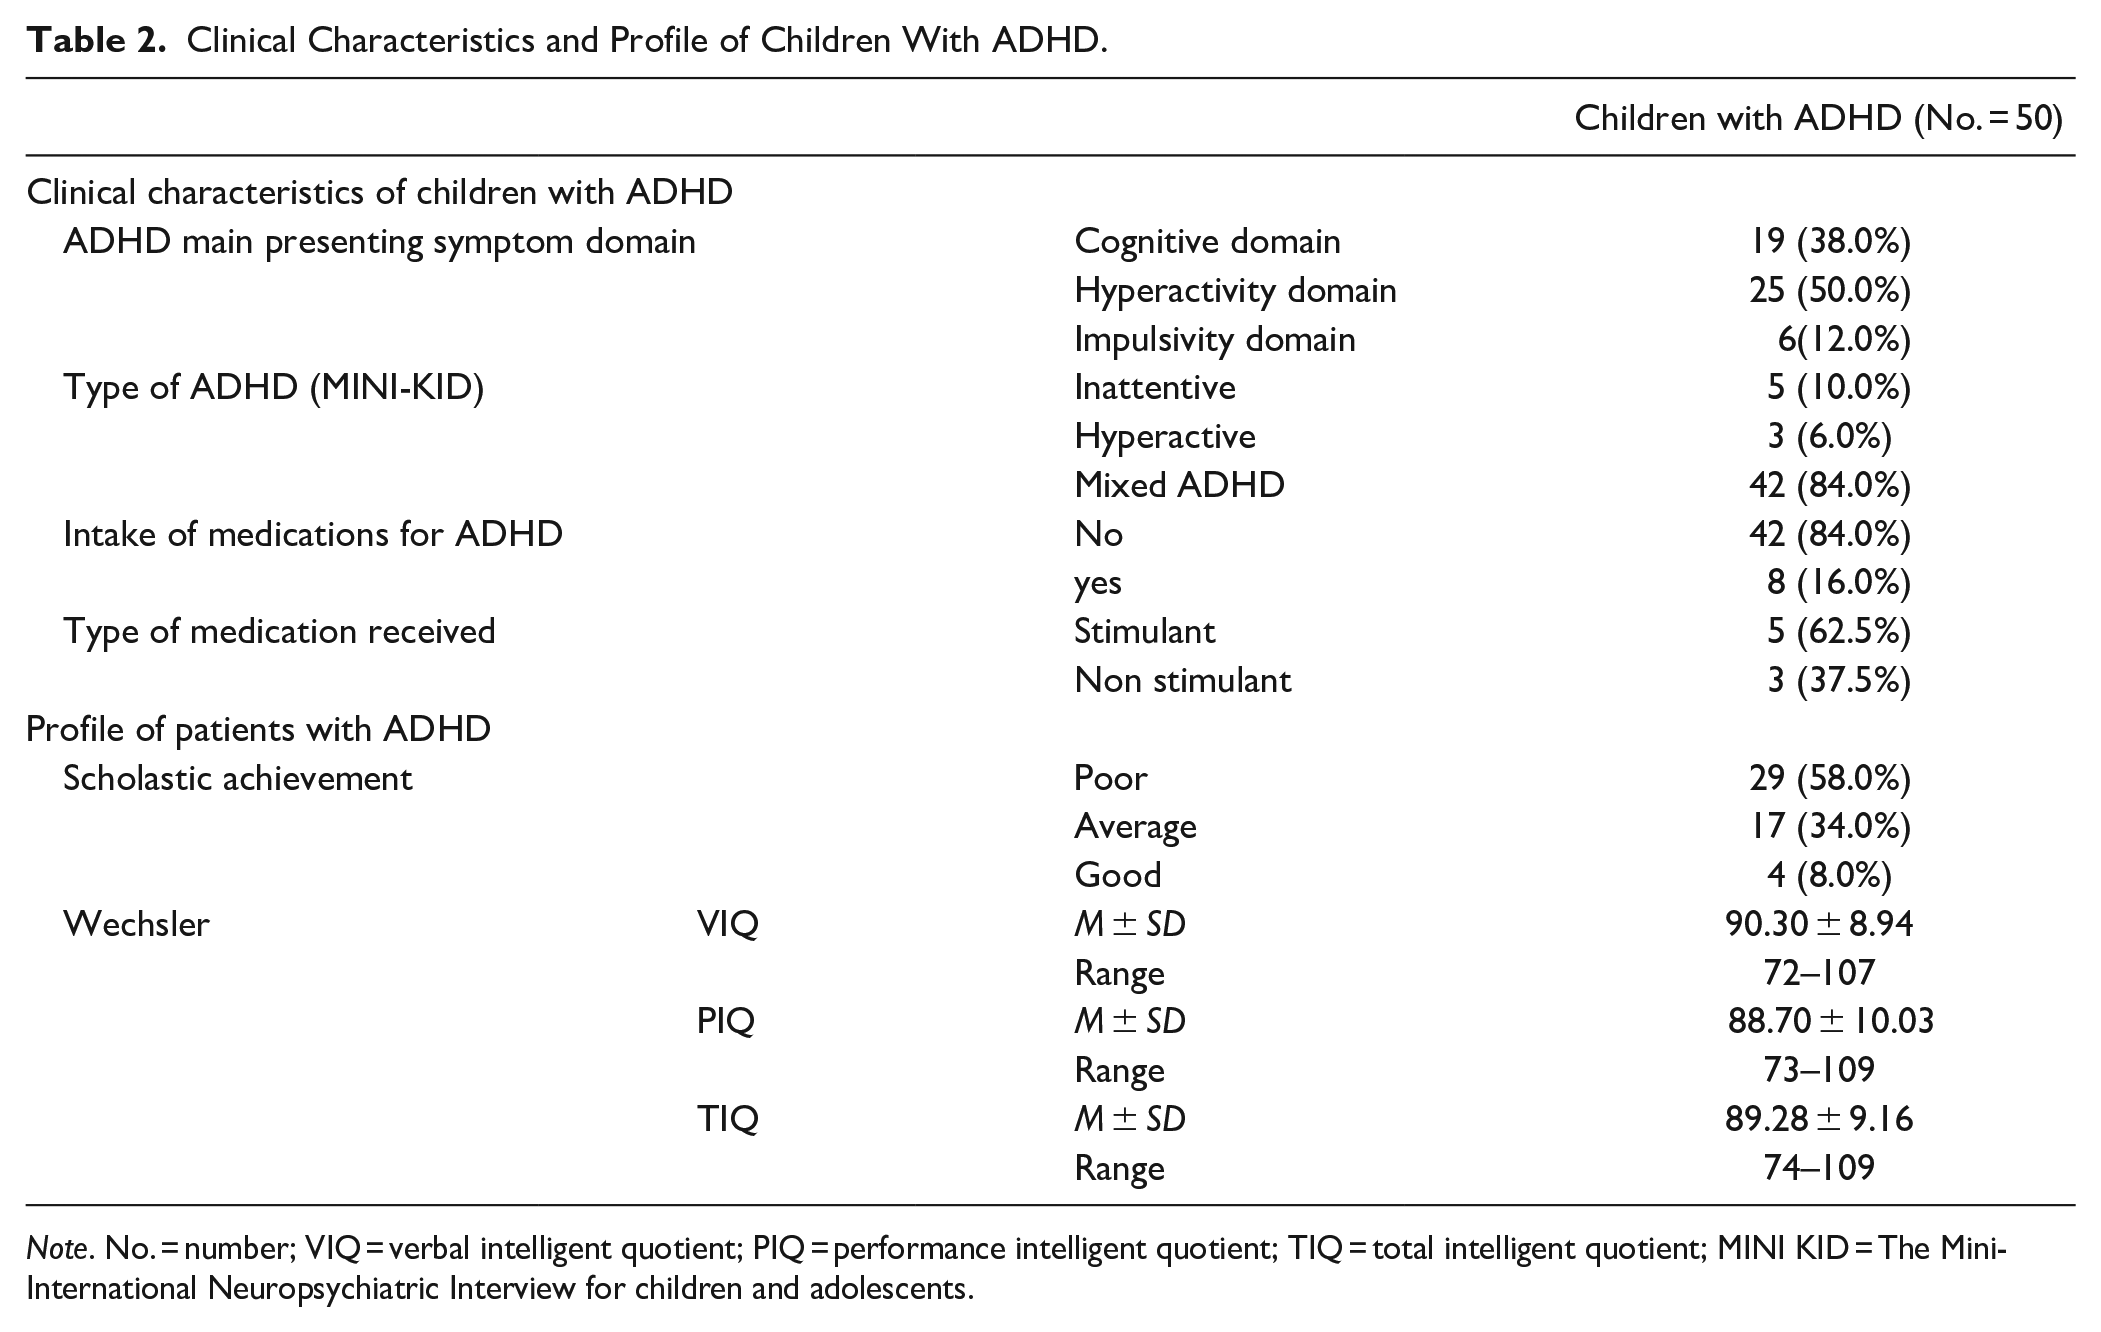
Note. No. = number; VIQ = verbal intelligent quotient; PIQ = performance intelligent quotient; TIQ = total intelligent quotient; MINI KID = The Mini-International Neuropsychiatric Interview for children and adolescents.
Profile of Patients With ADHD
Regarding scholastic achievement; the highest number of children with ADHD had poor scholastic achievement (29, 58.0%) while, 4 (8.0%) of children with ADHD had good scholastic achievement (Table 2).
With regard to the Wechsler intelligence scale for children; children with ADHD scored (90.30 ± 8.94) in verbal IQ, (88.70 ± 10.03) in performance IQ, and (89.28 ± 9.16) in total IQ (Table 2).
Blood Inflammatory Markers Among Children With ADHD Compared to the Control Group
There was a statistically significant difference between children with ADHD and the control group with regard to all blood inflammatory markers (except platelet count); neutrophil/lymphocyte ratio (p = .000), platelet/lymphocyte ratio (p = .002), mean platelet volume (p = .001), neutrophil count (p = .000), and lymphocyte count (p = .001; Table 3).
Blood Inflammatory Markers Among Children With ADHD Compared to the Control Group.
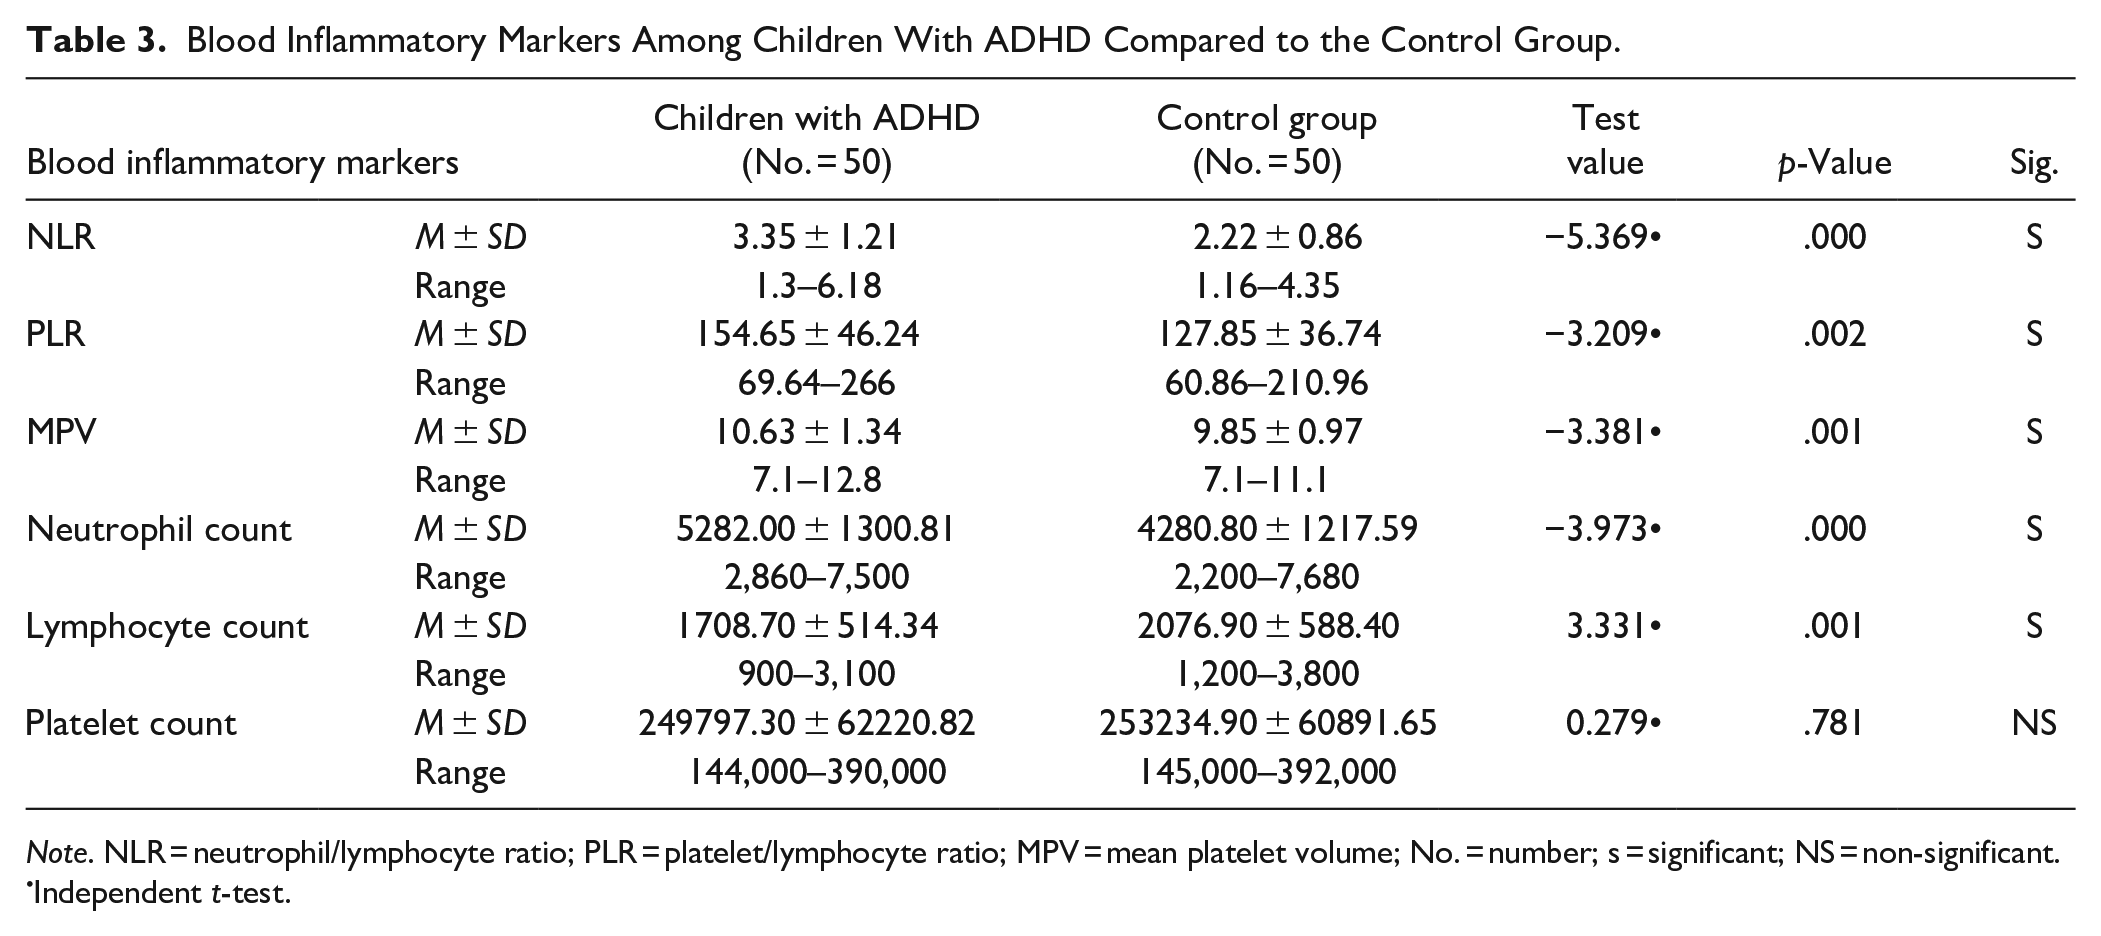
Note. NLR = neutrophil/lymphocyte ratio; PLR = platelet/lymphocyte ratio; MPV = mean platelet volume; No. = number; s = significant; NS = non-significant.
Independent t-test.
On measuring the cutoff value for the main blood inflammatory markers using the ROC curve; 33 children with ADHD (66%) had NLR > 3.07 (sensitivity = 66%, specificity = 84%, and area under curve (AUC) = 78.3%), 41 children with ADHD (82.0%) had PLR > 115.7 (sensitivity = 82.0%, specificity = 52%, and AUC = 67.6%), and 19 children with ADHD (38.0%) had MPV > 11.1 (sensitivity = 38%, specificity = 98%, and AUC = 68.4%; Table 4).
The ROC Curve Representing the Cut Off Value for NLR, PLR, and MPV.
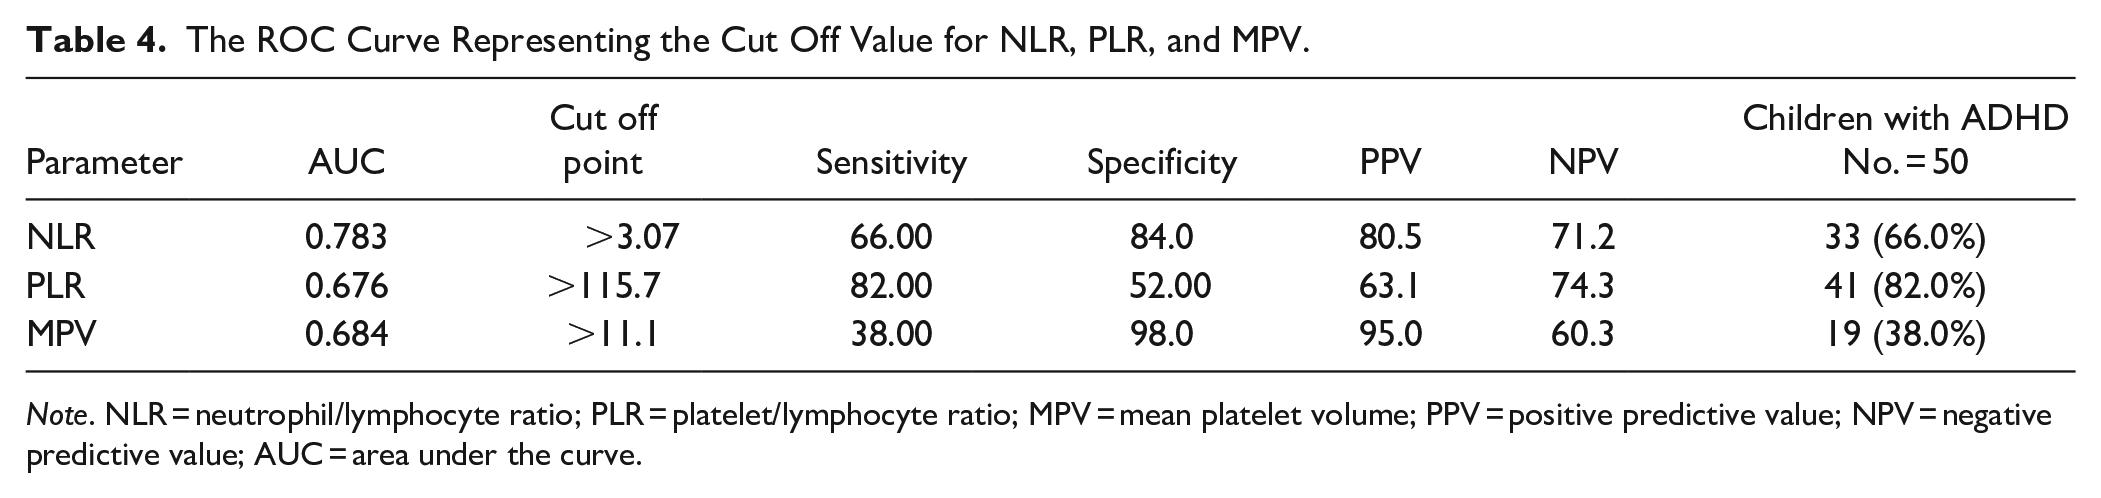
Note. NLR = neutrophil/lymphocyte ratio; PLR = platelet/lymphocyte ratio; MPV = mean platelet volume; PPV = positive predictive value; NPV = negative predictive value; AUC = area under the curve.
The Relationship Between Blood Inflammatory Markers, Socio-Demographic, Clinical Characteristics, and Profile of Children With ADHD
The Relationship Between Blood Inflammatory Markers and Socio-Demographic Characteristics
There was a statistically significant difference between MPV and sex (p = .010). There was statistically significant difference between NLR and birth order (p = .029). There was no statistically significant difference between NLR, PLR, MPV, and both socioeconomic status and age (Table 5).
The Relationship Between Blood Inflammatory Markers, Socio-Demographic, Clinical Characteristics, and Profile of Children With ADHD.
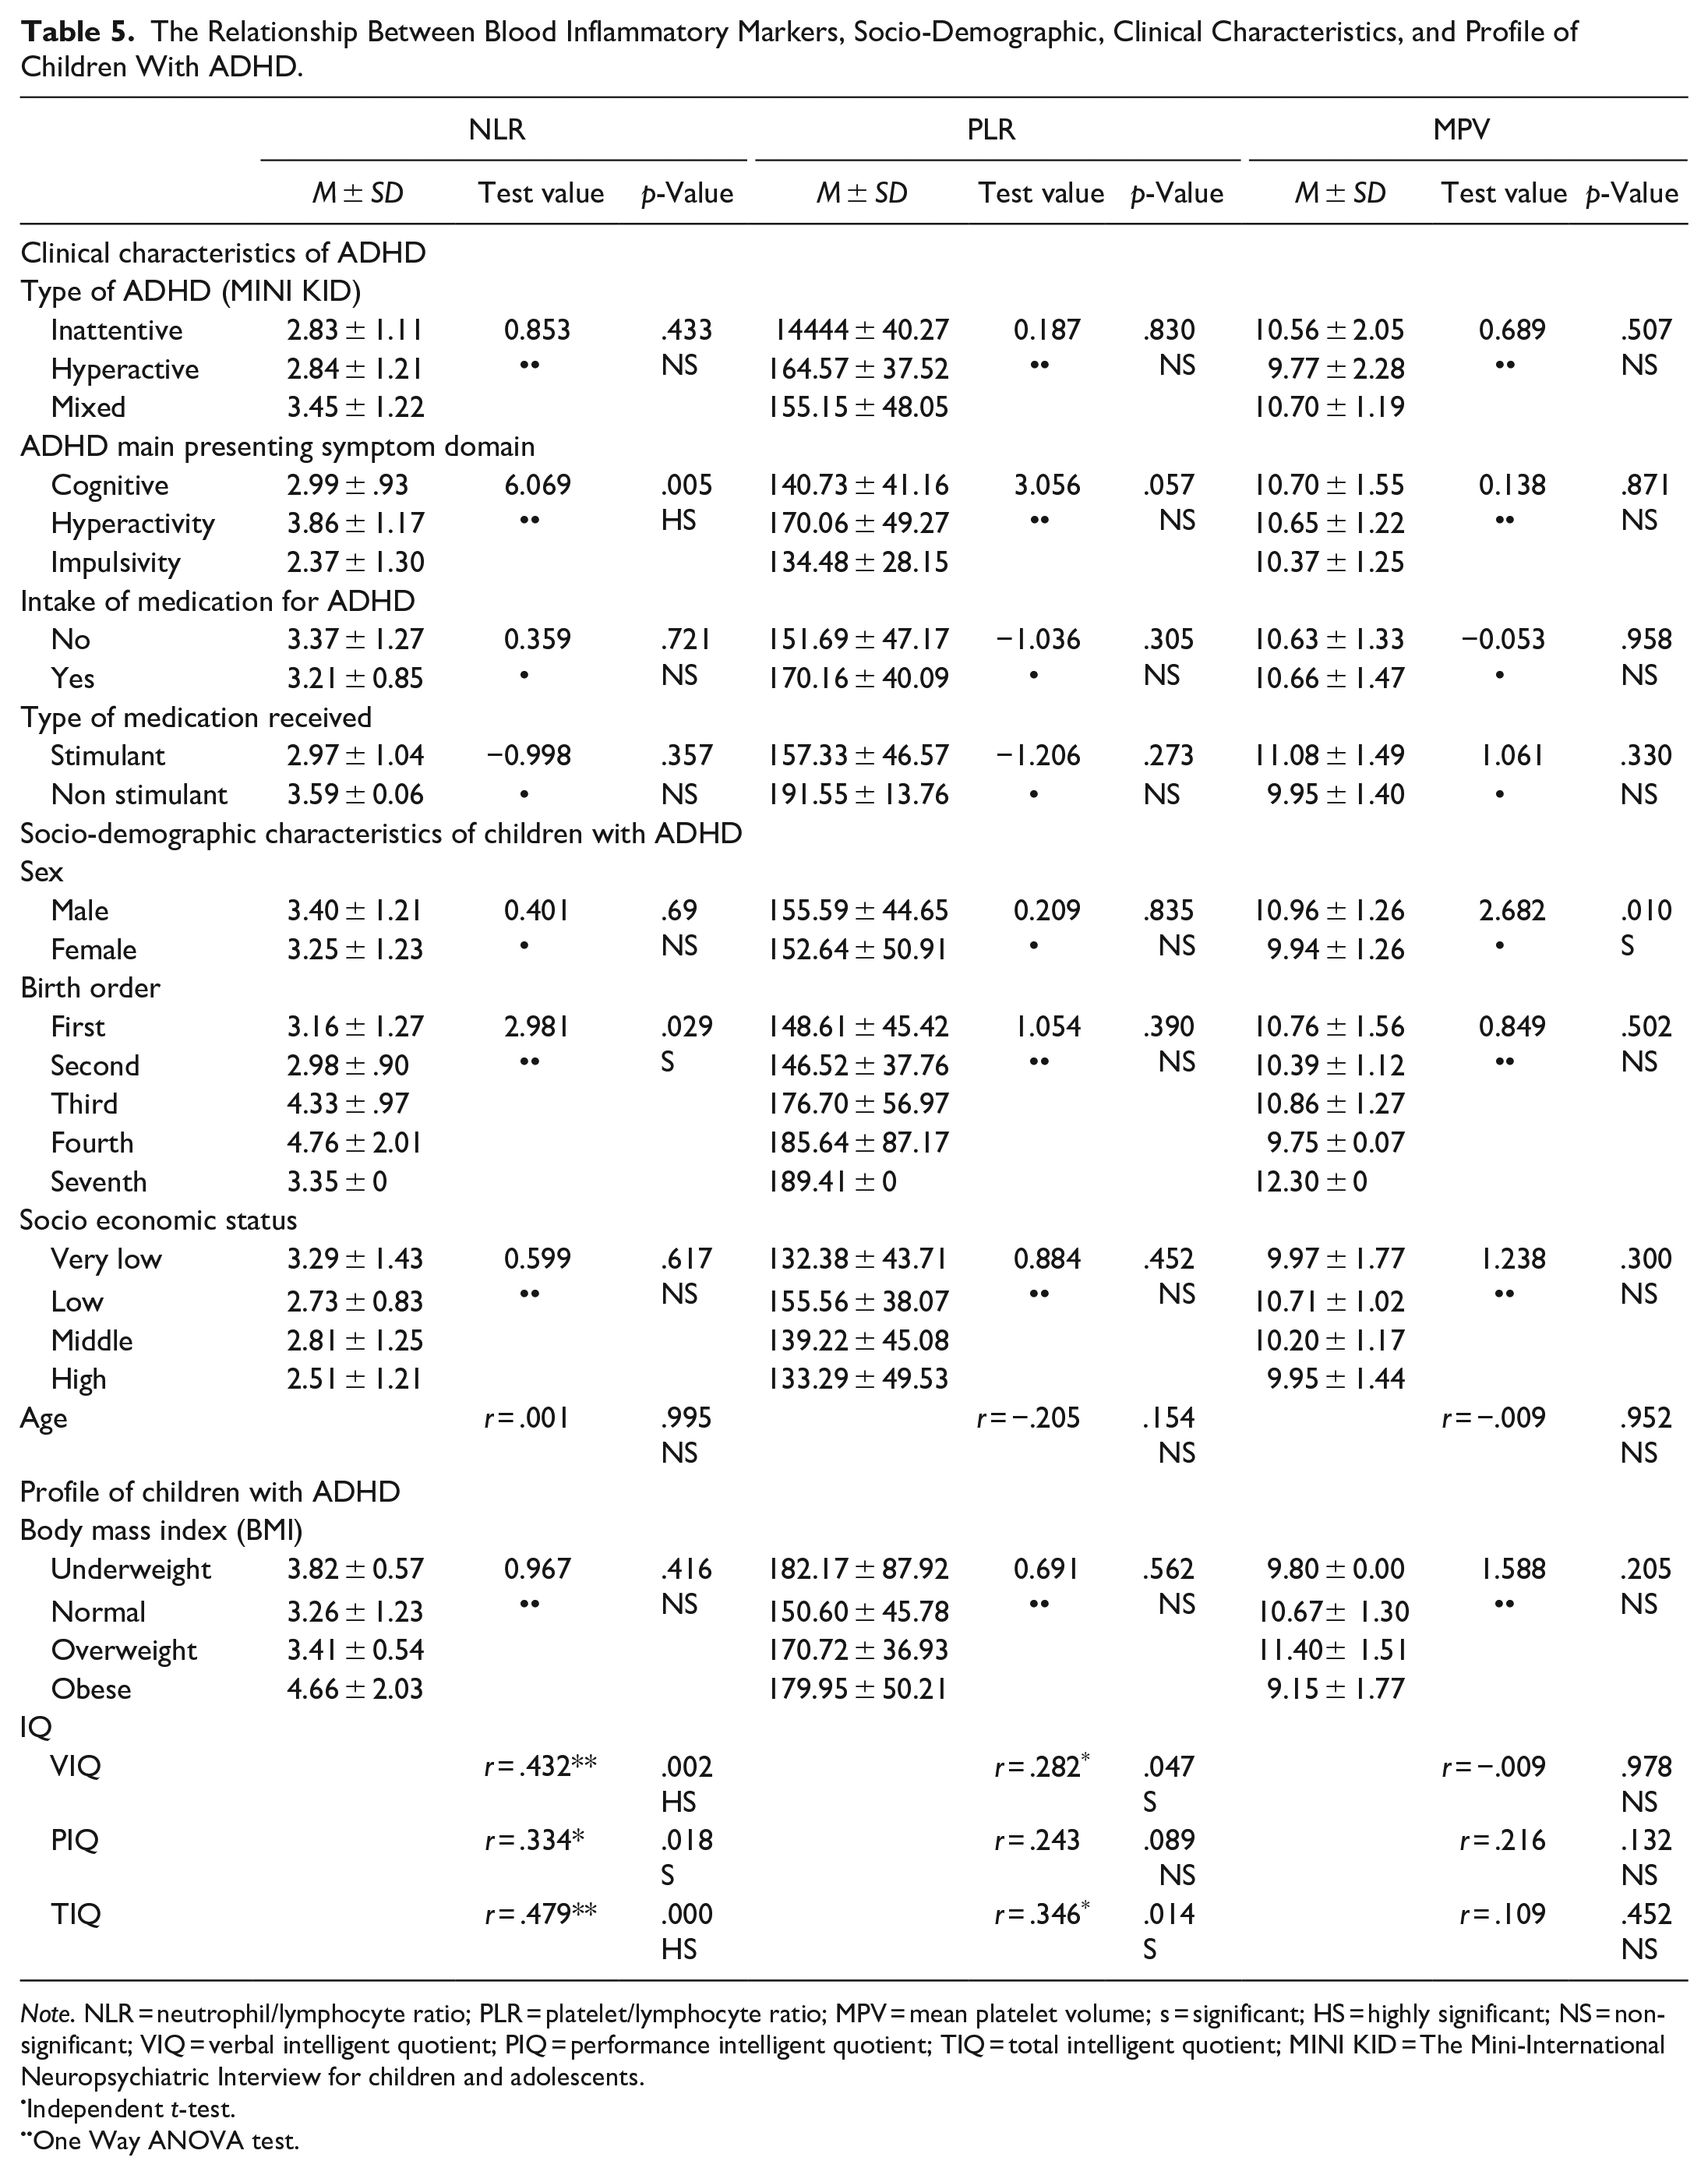
Note. NLR = neutrophil/lymphocyte ratio; PLR = platelet/lymphocyte ratio; MPV = mean platelet volume; s = significant; HS = highly significant; NS = non-significant; VIQ = verbal intelligent quotient; PIQ = performance intelligent quotient; TIQ = total intelligent quotient; MINI KID = The Mini-International Neuropsychiatric Interview for children and adolescents.
Independent t-test.
One Way ANOVA test.
The Relationship Between Blood Inflammatory Markers and Clinical Characteristics of Children With ADHD
There was statistically significant difference between NLR and ADHD main presenting symptom domain (p = .005). There was no statistically significant difference between NLR, PLR, MPV, and all the subtypes of ADHD (inattentive, hyperactive, and mixed subtype; p = .433, .830, and .507 respectively). There was no statistically significant difference between NLR, PLR, MPV, and both intake of medication and type of medication received (Table 5).
The Relationship Between Blood Inflammatory Markers and Profile of Children With ADHD
NLR showed a statistically significant positive correlation with verbal, performance, and total IQ (p = .002, .018, and .000 respectively). PLR showed a statistically significant positive correlation with Verbal and total IQ (p = .047 and .014 respectively). There was no statistically significant difference between NLR, PLR, MPV, and BMI (Table 5).
The Relationship Between Blood Inflammatory Markers and Severity of ADHD Among Children With ADHD
Indeed, there was a statistically significant difference between MPV and both perfectionism (p = .049) and oppositional (p = .015; Table 6).
The Relationship Between Blood Inflammatory Markers and Severity of ADHD.
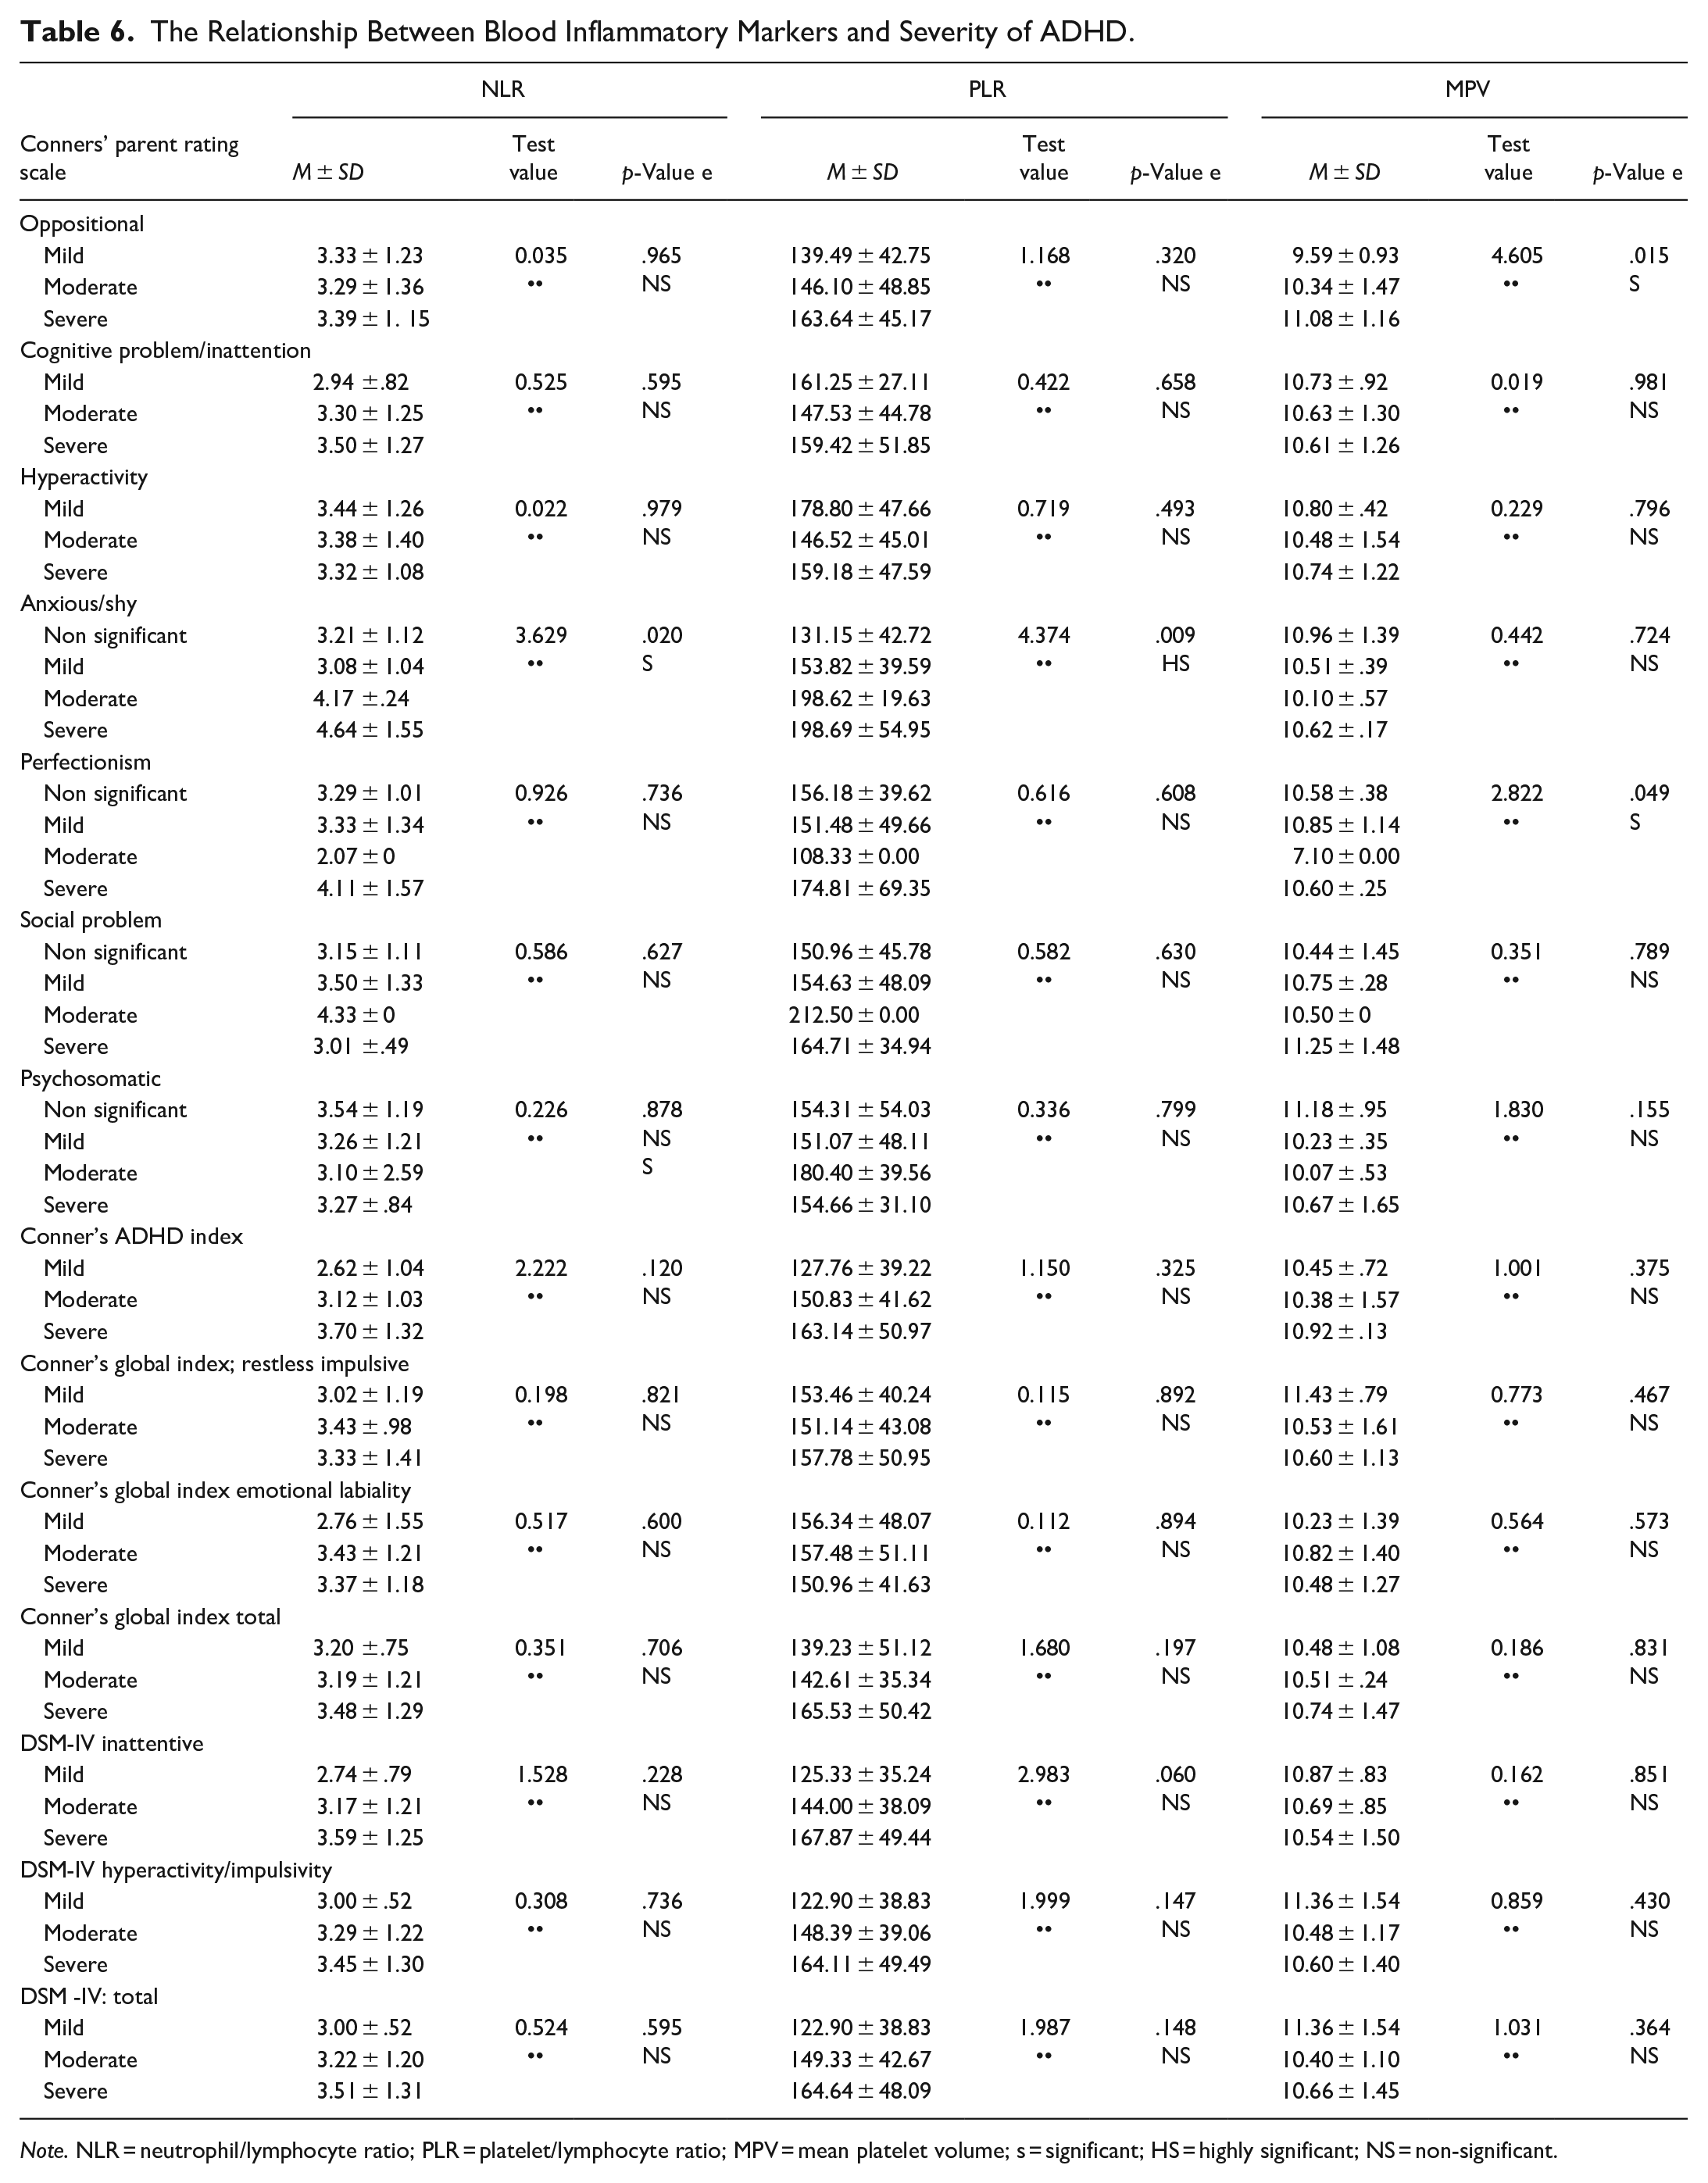
Note. NLR = neutrophil/lymphocyte ratio; PLR = platelet/lymphocyte ratio; MPV = mean platelet volume; s = significant; HS = highly significant; NS = non-significant.
By performing logistic univariate and multivariate linear regression analysis to determine the most statistically significant blood inflammatory marker in relation to ADHD, the results indicated that the NLR is the most statistically significant blood inflammatory marker in relation to ADHD in both univariate and multivariate regression analysis followed by MPV (Table 7).
Univariate and Multivariate Linear Regression Analysis.
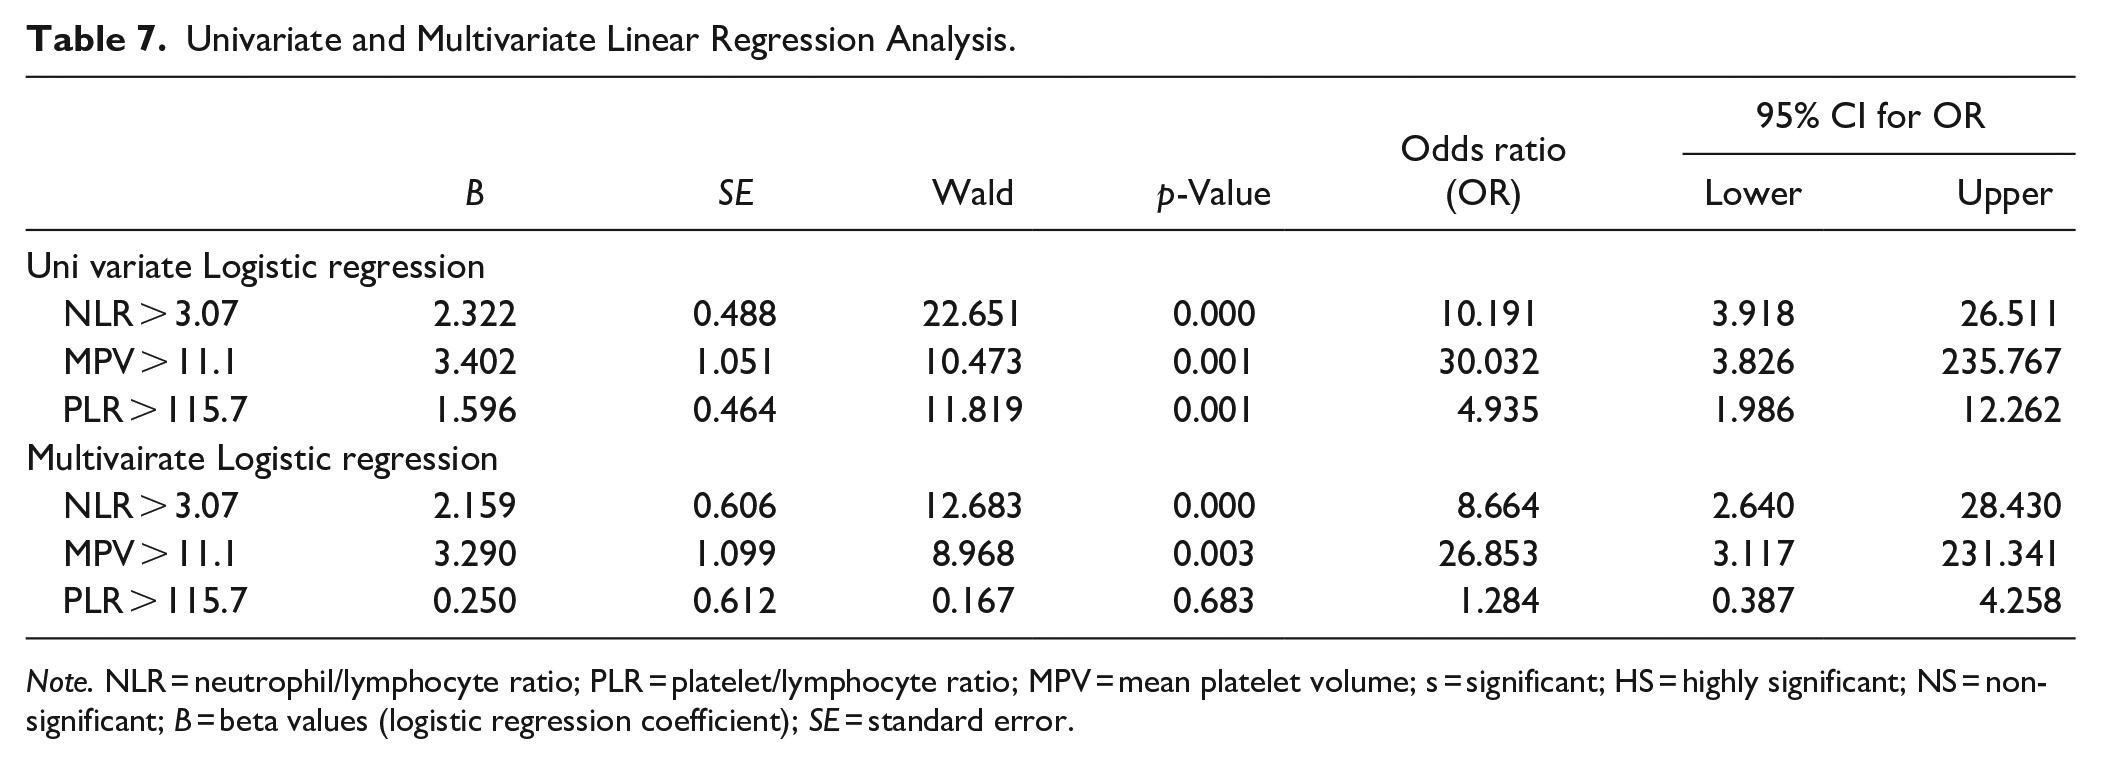
Note. NLR = neutrophil/lymphocyte ratio; PLR = platelet/lymphocyte ratio; MPV = mean platelet volume; s = significant; HS = highly significant; NS = non-significant; B = beta values (logistic regression coefficient); SE = standard error.
Discussion
The current research is one of the few studies that have examined the association between ADHD and inflammatory state in children and adolescents and even yielded conflicting results (Anand et al., 2017; Darwish et al., 2019; Donfrancesco et al., 2020; Mitchell & Goldstein, 2014; Oades et al., 2010; O’Shea et al., 2014). To the best of our knowledge there are few number of studies that shed the light on the role of blood inflammatory biomarkers (NLR, PLR, and MPV) in children and adolescents with ADHD (Avcil, 2018; Binici & Kutlu, 2019; Garipardic et al., 2017; Yorbik et al., 2014).
The primary goal of the study was to explore the relationship between blood inflammatory markers (NLR, PLR, and MPV) among children with ADHD compared to healthy controls.
Blood Inflammatory Markers Among Children With ADHD Compared to the Control Group
The results of the current study indicated a statistically significant difference between children with ADHD and the control group with regard to all blood inflammatory markers (except platelet count); NLR (p = .000), PLR (p = .002), MPV (p = .001), neutrophil count (p = .000), and lymphocyte count (p = .001).
These results were consistent with the research carried out by Avcil (2018); the author recruited 82 drug-naïve children with ADHD with age range 6 to 16 years and 70 healthy children. The author found a statistically significant difference between patients group and control group with regard to NLR, PLR, MPV neutrophil count, lymphocyte count, and platelet count (p < .001, p = .006, p = .018, p = .026, p = .041, and p = .961 respectively). Similarly, Yorbik et al. (2014) recruited 70 drug naive children with ADHD with age range 6 to 16 years and 41 healthy children. The authors found a statistically significant difference between patients group and control group with regard to MPV (0.006). There was no statistically significant difference with regard to platelet count (p = .389). Indeed, Fahiem and Mekkawy (2022) studied 70 children with ADHD, with a mean age (8.7 ± 1.9 years) and 44 healthy children, with mean age (8.3 ± 1.7 years). The authors found highly statistically significant difference children with ADHD and control group as regard all the blood inflammatory mediators (NLR, PLR, MLR {monocyte/lymphocyte ratio}; p < .001 for all mediators)
On the contrary, Binici and Kutlu (2019) recruited 65 newly diagnosed children with ADHD with age range 6 to 11 years and 65 healthy children. The authors found a statistically significant difference between patients group and control group with regard to MPV (p = .001). Yet, there was no significant difference as regard NLR, PLR, neutrophil count, lymphocyte count, and platelet count (p = .743, .452, .807, .958, and .323 respectively). These findings could be explained by the fact that the authors did not exclude patients with other co-morbid psychiatric disorders. In contrast to our finding, Garipardic et al. (2017) recruited 36 children with ADHD, 18 children with autism spectrum disorder (ASD), and 25 healthy controls with age range 3–18 years. The authors found no significant difference between the patient group and the control group as regard MPV and platelet count (p > .05). These findings could be explained by the limited number of patients studied.
The secondary goal of the study was to explore the relationship between blood inflammatory markers (NLR, PLR, and MPV), symptom domains, and severity of ADHD among children with ADHD.
The Relationship Between Blood Inflammatory Markers and Symptom Domains of ADHD
The findings of the current study indicated that there was no statistically significant difference between NLR, PLR, MPV, and all the subtypes of ADHD (inattentive, hyperactive, and mixed subtype; p = .433, .830, and .507 respectively). Similarly, Avcil (2018) found no statistically significant difference between NLR, PLR, MLR (Monocyte/Lymphocyte ratio), and all the subtypes of ADHD (inattentive, hyperactive, and combined subtype; p = .113, .897, and .146 respectively). Indeed, Fahiem and Mekkawy (2022) concluded that the NLR, PLR, and MLR levels in all the ADHD subtypes were non-significant. These findings altogether could explain that the inflammatory state may be attributed to the whole disease entity.
The Relationship Between Blood Inflammatory Markers and Severity of ADHD Symptoms
With regard to Conners’ parent rating scale, there was a statistically significant difference between NLR, PLR, and anxious/shy only (p = .020 and .009 respectively). Indeed, there was a statistically significant difference between MPV and both perfectionism (p = .049) and oppositional (p = .015). Thus, NLR, PLR, and MPV had no significant relation to the severity of ADHD symptoms specifically, inattention and hyperactivity. This is consistent with results Avcil (2018), the author concluded that the inflammatory markers at or over a certain level could be related to the diagnosis of ADHD and had no relation to the severity of ADHD. Indeed, Darwish et al. (2019) found no statistically significant relation between the inflammatory marker (serum IL-6) and any of the Conners’ parent rating scale items (p > .05).
On the contrary, Oades et al. (2010) found that increased IL-13 level was associated with inattention, high IL-16 level was associated with increased hyperactive-impulsive symptom domain while, the decrease in IL-2 level was associated with more oppositional symptom domain.
Possible limitations in the current study include; first, the type of the study being cross sectional could not allow the causal relation between blood inflammatory markers and ADHD nor follow up the effect of ADHD treatment on the values of blood inflammatory markers. Second, the study did not include other peripheral inflammatory markers such as cytokines to confirm the association between ADHD and inflammation.
Conclusions
In conclusion, the current study found that children with ADHD had a statistically significant high levels of all blood inflammatory markers (except platelet count) compared to healthy controls. Indeed, in children with ADHD the blood inflammatory markers did not show any statistically significant relation with different ADHD subtypes or severity.
Future studies recruiting larger number of children with ADHD are needed to investigate the role of NLR, PLR, and MPV as inflammatory markers in ADHD. Indeed, studies performing NLR, PLR, and MPV as initial laboratory test for children with ADHD before start of medications especially stimulants.
Footnotes
Acknowledgements
The authors are thankful to the participants for their participation in the current research.
Author Contributions
Conception and design of the study were done by AM and DA, acquisition of data was done by BS and MH, analysis and/or interpretation of data was done by AM and DA, drafting the manuscript was done by MH, revising the manuscript critically for important intellectual content was done by AM and DA, and approval of the version of the manuscript to be published was done by AM. The authors read and approved the final manuscript.
Declaration of Conflicting Interests
The author(s) declared no potential conflicts of interest with respect to the research, authorship, and/or publication of this article.
Funding
The author(s) received no financial support for the research, authorship, and/or publication of this article.
Availability of Data and Materials
The datasets used during the current study are available from the corresponding author upon request.