
Abstract
Objective:
This study examined the contribution of the temporal dynamics of two cognitive control mechanisms—inhibitory control (IC) and working memory (WM)—to emotion dysregulation (ED) in attention-deficit/hyperactivity disorder (ADHD) in ecological settings.
Method:
One hundred twenty-two participants (age 18–33 years; 60 with ADHD) reported their ED at baseline, followed by a 5-day ecological momentary assessment (EMA) study, with short behavioral IC and WM tasks performed five times/day.
Results:
For IC, mean and lability of performance over EMA significantly accounted for differences in ED but not baseline performance. For WM, both baseline and mean of EMA, but not EMA lability, accounted for ED variance. ADHD status further contributed to the explained variance of ED.
Conclusions:
Our results support the contribution of dynamic IC processes to ED in ADHD, in addition to WM performance level, and highlight the importance of dynamic and ecological investigation of different cognitive control components.
Keywords
Introduction
ADHD is a neurodevelopmental disorder affecting 2.8% to 3.6% of adults (Kooij et al., 2019). Two traditional symptom dimensions, corresponding to inattention and hyperactivity with impulsivity, are included in the ADHD definition. Although not part of the “textbook” criteria of the disorder, emotion dysregulation (ED), that is, an individual’s inability to modify one’s emotional state to promote adaptive, goal-oriented behaviors, is highly prevalent among adults with ADHD (Shaw et al., 2014), with an estimated prevalence of 30% to 70% (Beheshti et al., 2020; Corbisiero et al., 2017). Importantly, higher levels of ED in adults with ADHD were shown to negatively impact major life activities and quality of life, beyond the effects attributed to the traditional core symptoms (Barkley & Fischer, 2010; Ben-Dor Cohen et al., 2021; Biederman et al., 2020; Surman et al., 2013).
The mechanisms underlying ED in ADHD are not yet understood. Top-down cognitive control (CC) processes, which are the cognitive processes underlying our goal-directed behaviors (Miyake et al., 2000), have been suggested (Zelazo & Cunningham, 2007); both share common neurobiological substrates (Macdonald et al., 2016). In the same vein, successful regulation of emotions requires the operation of different components of CC, including inhibitory control (IC) and working memory (WM) (Karalunas et al., 2020; Ochsner & Gross, 2005, 2008). Indeed, in daily life, both the inhibition of initial responses and the use of WM to integrate information from current and past experiences are utilized to construct an adaptive emotional response (Barkley, 2015; Pe et al., 2015). However, the literature regarding the potential contribution of CC mechanisms to ED in both neurotypical and clinical populations is currently mixed (Falquez et al., 2015; Gyurak et al., 2009, 2012; Joormann & Tanovic, 2015; Marceau et al., 2018; McRae et al., 2012; Pe et al., 2015; Schmeichel & Demaree, 2010; Schmeichel et al., 2008; Sperduti et al., 2017; Tang & Schmeichel, 2014; von Hippel & Gonsalkorale, 2005).
In relation to ADHD, many studies reported deficits in both CC components of WM and IC (Karalunas et al., 2020, 2021; Mostert et al., 2015). Although these CC deficits are hypothesized to contribute to ED in ADHD (Barkley, 2015; Hirsch et al., 2018; Petrovic & Castellanos, 2016), only a few studies to date have examined their potential association with ED in adults with ADHD, and the results are thus far mixed (Anker et al., 2022; Gisbert et al., 2019; Surman et al., 2013). Importantly, most studies have used a single-time CC measurement, performed in controlled laboratory settings. However, such measurement may not accurately capture the dynamic aspects of CC as reflected in real life, in constantly changing environments and varying occupational demands (Kallweit et al., 2021; Moore et al., 2017; Sliwinski et al., 2018). Ecological Momentary Assessment (EMA; Shiffman et al., 2008) of CC over time in everyday settings may therefore increase the ecological validity of CC measurement (McKinney et al., 2020). Aggregation of repeated assessments allows for a more precise and reliable estimation of one’s performance (Shiffman et al., 2008; Sliwinski et al., 2018). Furthermore, EMA of CC can help identify patterns of variability and temporal variations in cognitive functions over time. Indeed, EMA studies assessing CC in neurotypical and in clinical populations found significant variability in CC abilities over time within participants (Cormack et al., 2019; Sliwinski et al., 2018; Smith et al., 2020). Yet to our knowledge, no study to date has used EMA to examine CC dynamics in daily life in adults with ADHD.
ADHD is known by its intra-individual as well as contextual variability, which fuels the need for ecological measurements in this population (Delisle & Braun, 2011; Hwang-Gu et al., 2021; Kallweit et al., 2021; Kofler et al., 2014, 2016; Miguelez-Fernandez et al., 2018; Murray et al., 2021; Rommelse et al., 2015). The fact that traditional CC tasks demonstrate poor ecological validity in relation to self-reported CC impairments in daily life further strengthens this need (Barkley & Murphy, 2011). It is therefore possible that reduced CC performance in daily life along with large within-person variability reflect decreased capacity for goal-directed behavior, and in turn increased likelihood of ED. However, variability and aggregated impaired performance in CC and potential interactions with ADHD status have yet to be studied in relation to ED.
To fill this gap in the literature, the aim of the current study is to examine the contribution of CC mechanisms—measured ecologically, over time and context—to ED variance in young adults with and without ADHD. Self-reported ED and CC performance were collected in the lab, as well as ecologically, during a 5-day EMA study. This design allowed us to examine the contribution to ED of 2 CC abilities—IC and WM performance—in a one-time lab measurement as well as over time and varying ecological contexts. We further examined the contribution of CC to various components of ED (DERS subscales). Considering the dynamic nature of CC in everyday life, we hypothesized that a single measurement in the lab may not accurately reflect the contribution of CC to ED. Findings from the study should therefore contribute to the understanding of differences in CC over time and context as a possible mechanism underlying ED in young adults with ADHD.
Methods
Participants
We recruited 122 young adults (ages 18–33) for the study: N = 60 adults with ADHD and N = 62 controls. Inclusion criteria for the ADHD group were a valid medical diagnosis of ADHD and a score above the clinical cutoff (≥51) on the Adult ADHD Self-Report Scale (ASRS) (Kessler et al., 2005; Zohar & Konfortes, 2010). Inclusion criterion for the healthy control group was an ASRS score below the clinical cutoff. Exclusion criteria for both groups were a diagnosis of a psychiatric or neurological disorder or other major health condition as determined by self-report. The sample was balanced across the two groups with respect to sex, and there were no age differences between the groups. Medication status for ADHD group participants was recorded and controlled for in data analyses (see Supplemental Material 2).
Study Design
Data collection took place between March and December of 2018. Participants were recruited for the study via online advertisements in student organization communications and posts in social media. Participants were invited to the Computerized Neurotherapy Laboratory at the Hebrew University, where they first signed an informed consent and were screened for eligibility. Then eligible participants completed baseline assessments of ED (self-report questionnaire) and performed CC tasks (IC and WM) in the lab, followed by a 5-day EMA study to assess CC performance over time in ecological settings. Participants completed the EMA study using the Moodify app (Nahum et al., 2017), which was installed on their mobile phones. They were asked to use the app five times/day for 5 days (a full work week), completing a visual WM task and an IC each time. All participants were compensated 300 NIS for their cooperation. The study was approved by the Institutional Review Board Ethics Committee of the Hebrew University of Jerusalem (reference ID: 08112017).
Measures
Baseline Measures
ADHD Symptoms: We used the ASRS (version 1.1) Symptom Checklist (Kessler et al., 2005), which consists of 18 items based on the DSM-IV (American Psychiatric Association, 2013) criteria for ADHD that are measured on a 5-point scale (0 = never, 4 = very often). The scale yields a total score ranging from 0 to 72, composed of the sum of all items. A screener score of 51 and over was found to be the most predictive of symptoms consistent with ADHD (Zohar & Konfortes, 2010). We used the Hebrew version of the ASRS, which has high test-retest reliability (r = .60–.90), a significant discriminant validity, and good internal consistency (α = .82–.89) (Zohar & Konfortes, 2010). Internal consistency in the current sample was high (α = .89).
Emotional Dysregulation (ED): The Difficulties in Emotion Regulation Scale (DERS; Gratz & Roemer, 2004) is a 36-item scale that collectively assesses difficulties within six different dimensions, corresponding to the following subscales: (a) goals: difficulties engaging in goal-directed behaviors when experiencing negative emotions; (b) impulse: difficulties controlling impulses when experiencing negative emotions; (c) strategies: limited access to emotion-regulation strategies that are perceived as effective; (d) clarity: lack of clarity of emotional responses; (e) awareness: lack of awareness of emotional responses; and (f) non-acceptance: non-acceptance of emotional responses. Each item is measured on a 5-point scale (1 = almost never, 5 = almost always), yielding total scores ranging between 36 and 180, with higher scores indicating greater difficulties in emotion regulation (i.e., greater ED). In the current study we used the validated Hebrew version (Segal, 2016). The DERS has high internal consistency (α = .93) (Gratz & Roemer, 2004). Internal consistency of the DERS in our sample ranged between 0.70 and 0.89 for the various subscales and was 0.95 for the total score.
Inhibitory Control (IC): IC was assessed using a computerized Go/No-Go task (GNG) (Wright et al., 2014), which measures prepotent response inhibition. The task includes 300 trials, with 80% being non-targets (“Go” trials) and 20% being targets (“No-Go” trials). On a given trial, a stimulus appears on the screen for 500 ms, and users are instructed to respond as quickly as possible to “Go” trials (within a 1,000-ms response window) but to withhold responding to “No-Go” trials, of a pre-specified image that appeared at the beginning of each block. The Inter-Trial-Interval for each trial is randomly selected between 1,000 and 2000 ms. IC was quantified as prepotent inhibition, that is, correct withholding of No-Go trials (range: 0–1). This metric is an acceptable measure for prepotent inhibition, as it is the complement of commission errors (Wright et al., 2014).
Working Memory (WM): We used a multiple object tracking (MOT) task (Lapierre et al., 2017) that measures visual WM. In this task, participants track moving dots on the screen and correctly choose the target dots while ignoring distractors. On each trial, a few dots appear on the screen and then move across it for 6 s. Once the movement stops, the participant should correctly select the target dots. The number of the moving dots changes from trial to trial according to the participant’s performance: it increases following a correct response and decreases following an incorrect response. The task implements a staircase procedure that reports the user’s threshold at asymptotic performance. If performance is at floor (1 object) or at ceiling (10 objects) for three consecutive trials, the task ends, and the threshold is then set to be this value (floor or ceiling).
Ecological Momentary Assessment (EMA) of CC
EMA data were collected during a 5-day period following baseline assessment using the Moodify app (Nahum et al., 2017). The app was installed on participants’ mobile phones, and they were asked to complete two short CC tasks five times/day during weekdays (i.e., Sunday–Thursday in Israel for a total of 5–6 min each time). The time intervals during the day were set pseudo-randomly at 65 to 195 min, starting and ending according to each participant’s personal schedule. The users received a notification from the app, after which they had a 15-min window to start and complete the session; an entry that was not completed within 15 min was considered as missing data. This was done to avoid self-selection of monitoring instances, similar to the methodology used in other studies (Skirrow et al., 2014).
Momentary IC was assessed using an abbreviated version of the GNG task used at baseline. The momentary version included 90 trials, taking ∼2.5 min to complete. Trials were composed of three epochs of 30 trials. Target (“No-Go”) trials included a pre-defined stimulus presented at the beginning of the block. The frequency of the target stimuli was set to 60% in the first epoch but changed in the next two epochs by 5% according to performance. IC threshold was calculated similarly to the baseline task, as accuracy of target withholding.
Momentary WM was assessed using a similar version of the MOT task, which assessed the asymptotic performance using an adaptive algorithm. The trial structure in the EMA version was like that of the baseline version, but here the users were asked to tap on the target dots on their mobile phone to select them.
Pre-processing of EMA Data
Compliance with the EMA procedure was calculated as the percentage of all signaled reports completed by each participant (out of the 25 reports requested). In addition, successive responses were defined as consecutive reports, with inter-response intervals not exceeding 6 hr. Participants with less than 30% successive response rates were excluded from further analyses. For each participant, we derived the mean and lability metrics of their EMA task data. Lability was derived using the root mean squared successive difference (RMSSD), based on the squared differences between successive responses for each CC task.
Statistical Analysis
Analyses were conducted using the Statistical Package for Social Science (SPSS Inc.), Version 25.0, except for the RMSSD values, which were obtained using the Varian R package (Wiley, 2016). Outlier data of 3 SD above or below mean scores on CC performance tests were removed from further analysis. GNG data were further screened to make sure that all blocks had at least 30% Go success rates.
Group differences in demographic and outcome variables were examined using the χ2 test, Fisher’s exact tests, or independent samples t tests. Pearson correlations were performed to investigate the association between ED (DERS total and subscale scores) and CC task performance. Next, to examine the contribution of CC to ED, and the role of ADHD in explaining this relationship, we conducted a linear regression, predicting ED (DERS total score) using the CC metrics, which were significantly correlated with ED as the predictors. To avoid multi-collinearity between predictors, a series of four separate hierarchical linear regressions was conducted. Variables for all four analyses were entered into the regression in the same steps and order: CC task performance was entered at the first step, followed by group (ADHD vs. control) at the second step, and the group × CC performance interaction in the third step. Finally, to compare the unique explanation of WM versus IC to ED variance beyond group, we conducted hierarchical linear regressions with ED as the dependent variable, EMA mean performance of WM and IC as predictors in step one, and group as a predictor variable in step 2.
To more closely examine the contribution of CC to sub-components of ED, we repeated these analyses for each of the DERS subscales, which were correlated with the CC metrics. Bonferroni correction adjusted alpha levels of .008 per test (0.05/6). The additional analyses for the DERS subscales are detailed in Supplemental Material 1.
Finally, we conducted multiple analyses to rule out the potential impact of medications on the results, considering both past and current medication use at baseline, as well as the percentage of medication impact during the EMA. These additional analyses are detailed in Supplemental Material 2.
Results
Sample Characteristics
A total of 155 participants were assessed for eligibility, and the final study sample analyzed included N = 122 participants. N = 17 participants were excluded from the ADHD group: 13 were excluded at screening due to ASRS scores below the clinical cutoff, and 4 were excluded from analyses due to minimal EMA compliance (l < 30% successive EMA responses). In addition, 15 participants were excluded from the control group: 10 at screening (2 due to a psychiatric diagnosis and 8 with an ASRS score above the cutoff), and 5 were excluded from analyses due to minimal EMA compliance. The final sample of 122 included 60 and 62 participants from the ADHD and control groups, respectively. In addition, due to a technical error in data registration, baseline data for the CC tasks were missing for some participants, leaving baseline GNG data for 49 participants in the ADHD group and 45 controls, and baseline MOT data for 55 and 52 participants from the ADHD and control groups, respectively.
The demographic and clinical characteristics of the study sample are given in Table 1. Age, sex, current productive role, and family status did not significantly differ between the groups. However, participants in the ADHD group had a lower number of years of education (5.700, p = .017). As expected, the ASRS scores were significantly worse for the ADHD group (t[116] = 18.028, p < .000). Similarly, ED scores, measured using the DERS total score and DERS subscale scores, were worse for the ADHD group (except for the awareness subscale; see Supplemental Material 1, Table 1). Age and sex had no significant effect on any of the ED scores (DERS total score and subscales: p > .1).
Demographic, Clinical, and CC Characteristics of the Study Sample.
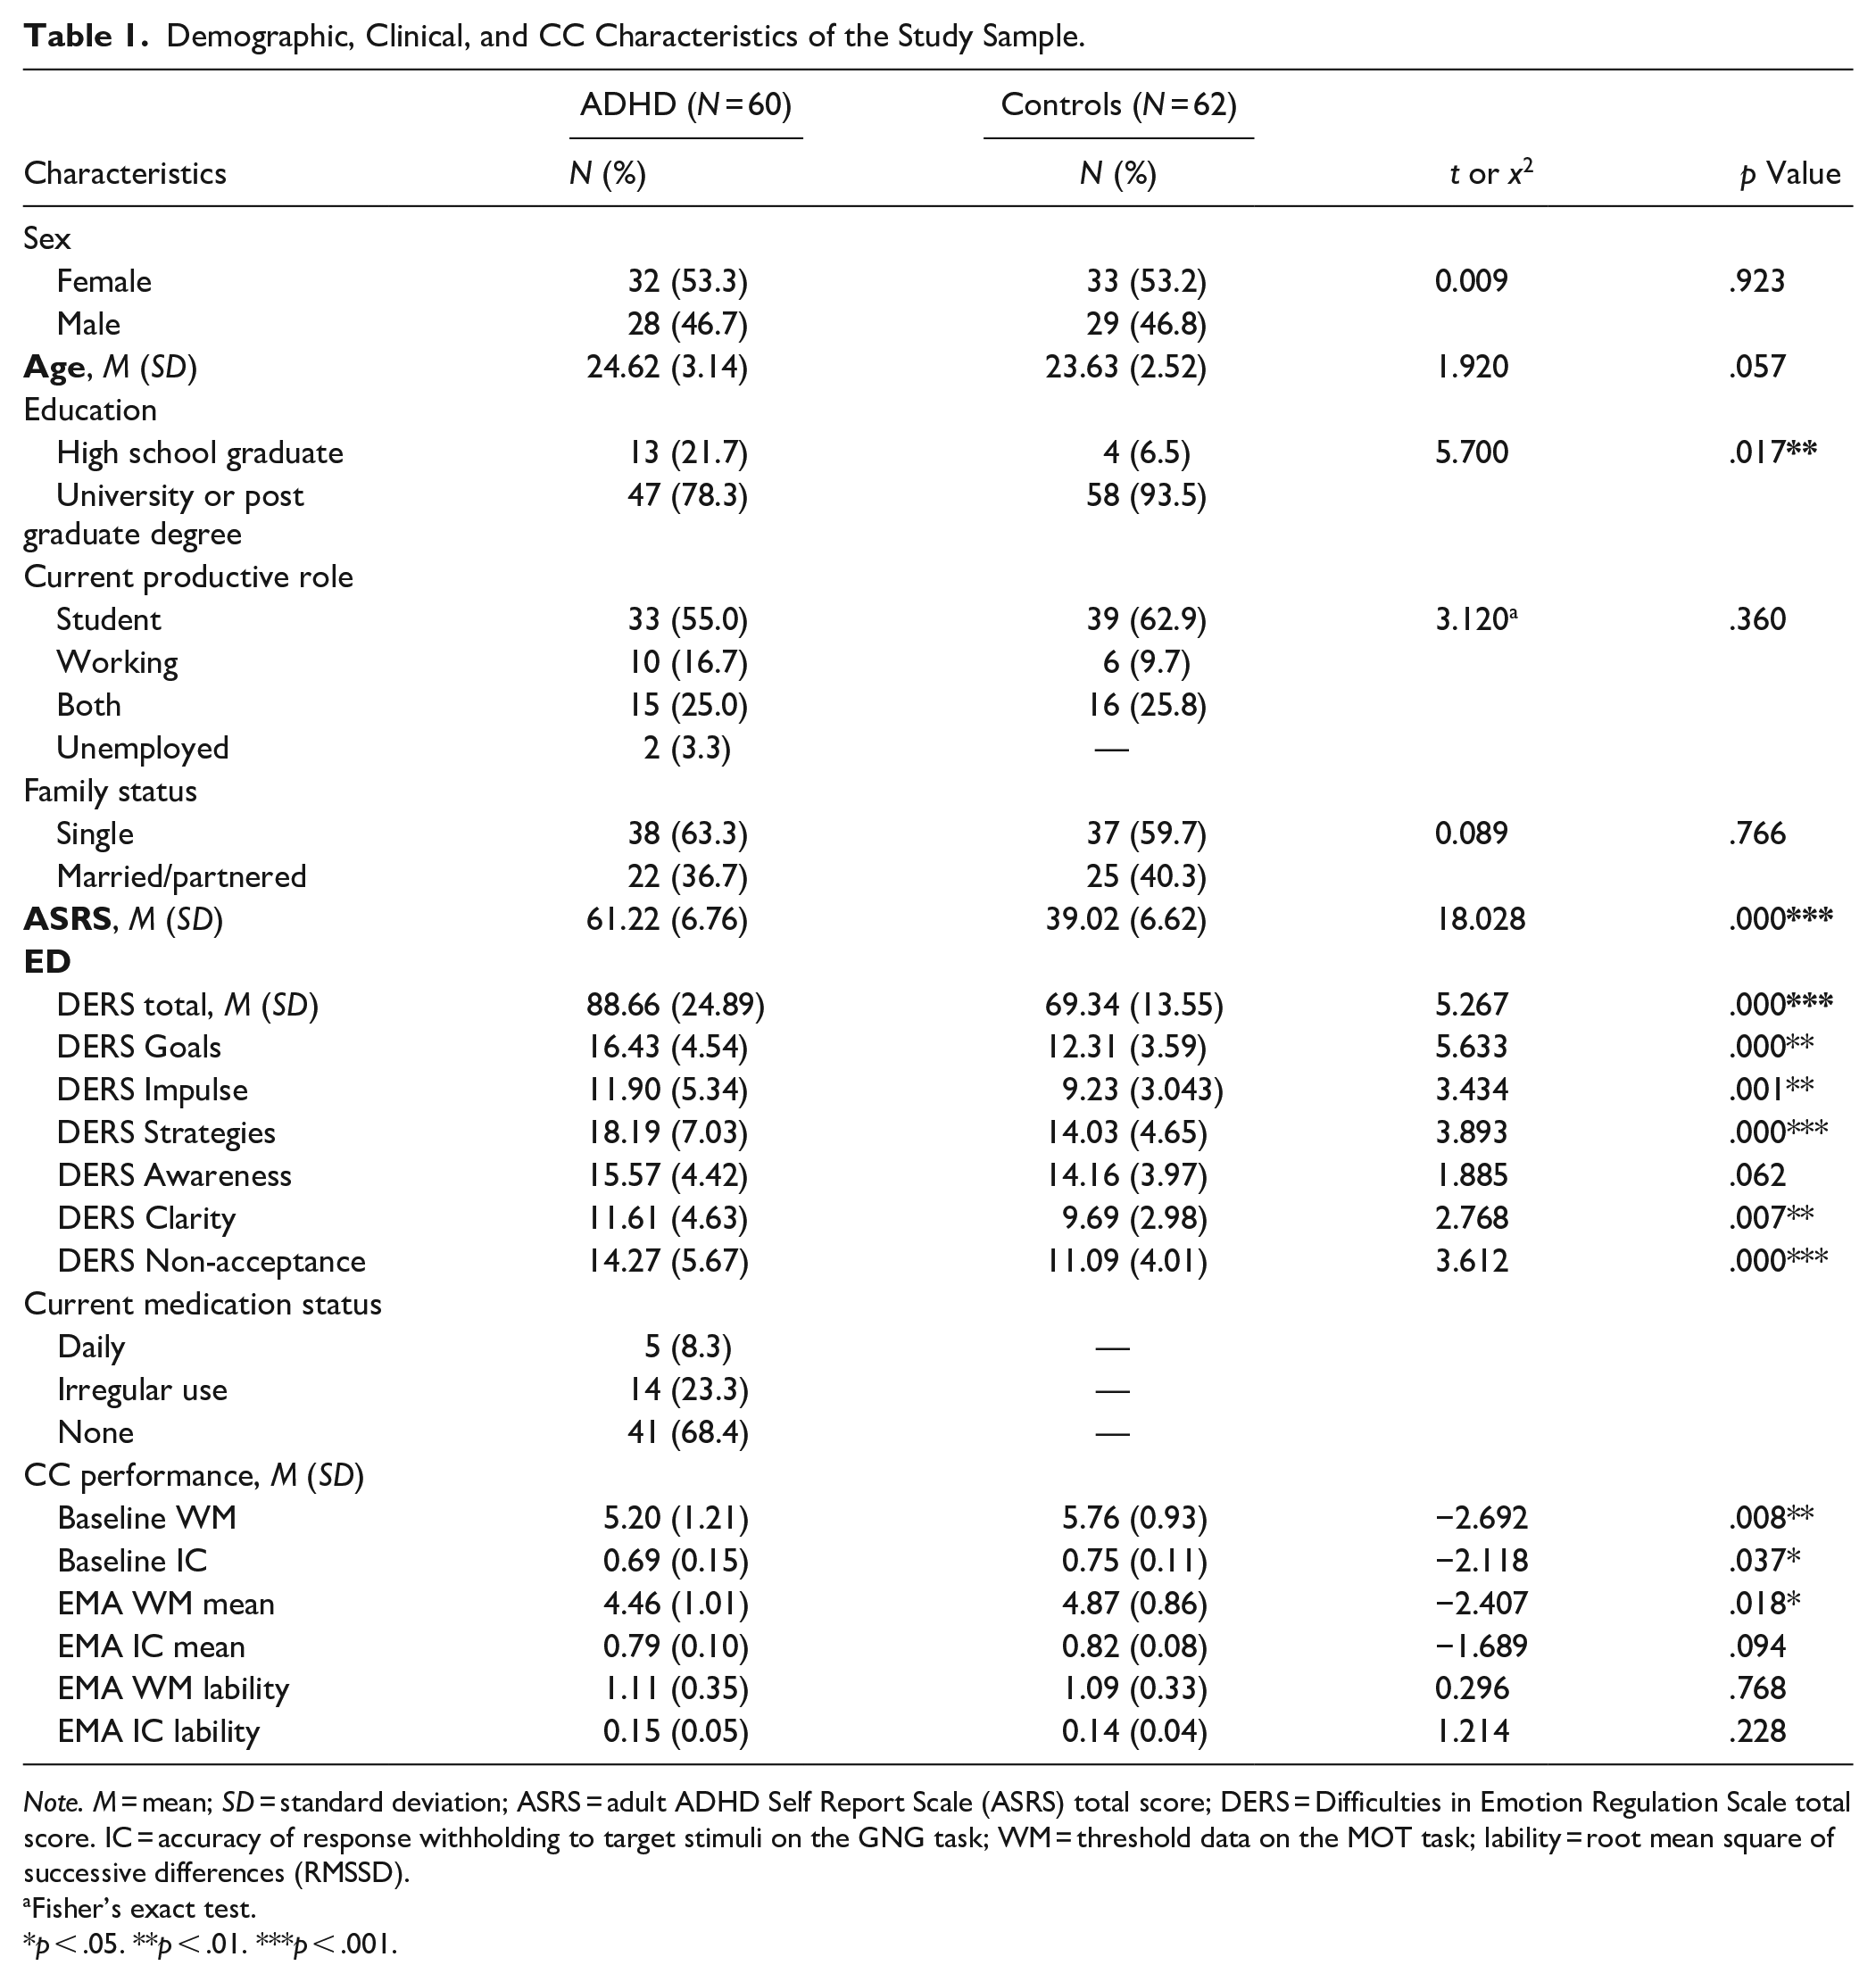
Note. M = mean; SD = standard deviation; ASRS = adult ADHD Self Report Scale (ASRS) total score; DERS = Difficulties in Emotion Regulation Scale total score. IC = accuracy of response withholding to target stimuli on the GNG task; WM = threshold data on the MOT task; lability = root mean square of successive differences (RMSSD).
Fisher’s exact test.
p < .05. **p < .01. ***p < .001.
Baseline performance on both CC tasks was significantly worse in the ADHD group compared to the matched control group (WM: t[105] = −2.692, p = .008; IC: t[92] = −2.118, p = .037). In addition, mean EMA WM, but not IC, performance was significantly worse in the ADHD group compared with the control group (t[119] = −1.689, p = .018). There were no significant differences between the groups in EMA lability (RMSSD) for both WM and IC.
Contribution of Baseline CC and ADHD Status to ED Variance
The Pearson correlations between ED (DERS total score) and the baseline CC metrics are summarized in Table 2 (see also Supplemental Table 1 for correlations between DERS subscales). Across the entire sample, ED was significantly inversely correlated with baseline WM performance (r = −.381, p < .001), such that increased ED was associated with worse WM. No such correlations were found between ED and baseline IC (r = −.178, p = .098).
Correlation Coefficients between Variables.
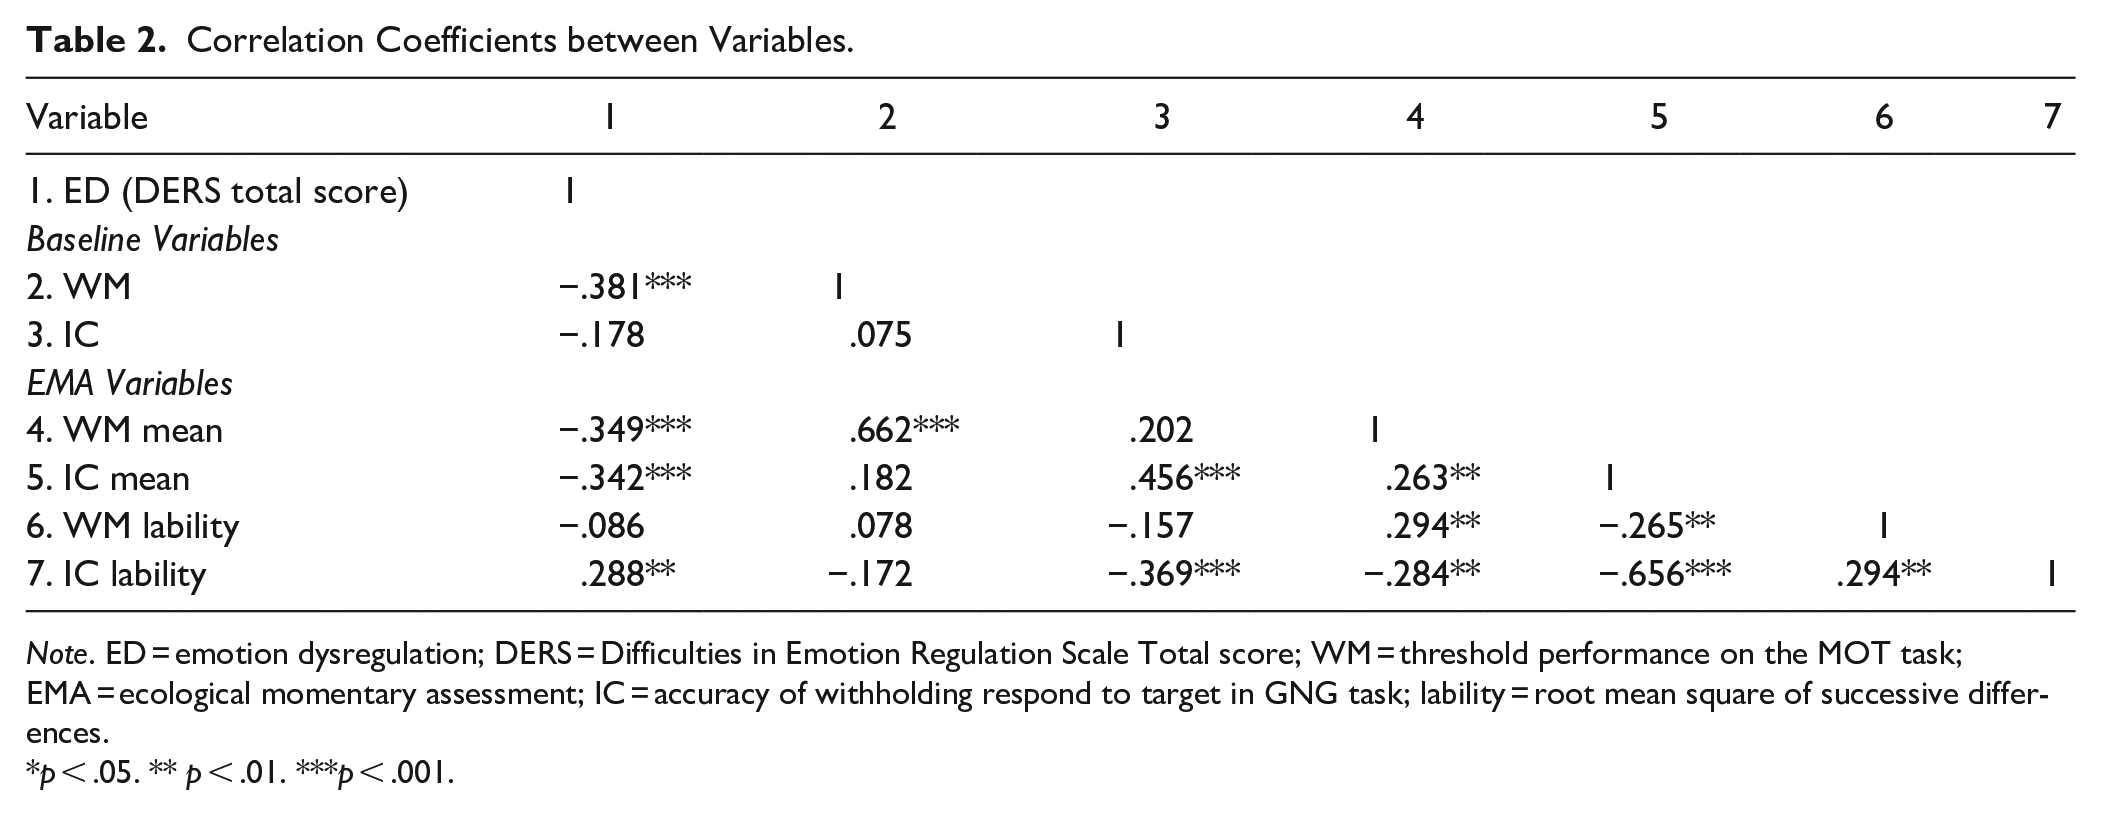
Note. ED = emotion dysregulation; DERS = Difficulties in Emotion Regulation Scale Total score; WM = threshold performance on the MOT task; EMA = ecological momentary assessment; IC = accuracy of withholding respond to target in GNG task; lability = root mean square of successive differences.
p < .05. ** p < .01. ***p < .001.
We similarly examined the correlations between baseline CC performance and all DERS subscales (see Supplemental Table 2). Baseline WM was associated with the DERS subscales of goals, strategies, impulse, and clarity (like the DERS total score). The other subscales—of awareness and non-acceptance—were not associated with baseline WM. Finally, baseline IC was not associated with any of the six DERS subscales.
Given this, we next investigated the relations between baseline WM and ED (DERS total score) while accounting for the role of ADHD. For this, we used hierarchical linear regressions with DERS total score as the dependent variable, baseline WM as a predictor in step 1, group as a predictor in step 2, with their interaction added in step 3. The results of this model are summarized in Table 3. Baseline WM significantly accounted for 14% of the variance of the DERS total score (β = −.378, p = .000), with ADHD status accounting for an additional 11% of the variance (β = .348, p = .000). However, adding the baseline WM × group interaction in the final step was not significant (ΔF[1, 105] = 2.041, p = .156, ΔR2 = .015), indicating that the relationship between baseline WM and DERS total score does not significantly differ between groups.
A Hierarchical Linear Regression Estimating ED (DERS) from Baseline WM and Group.
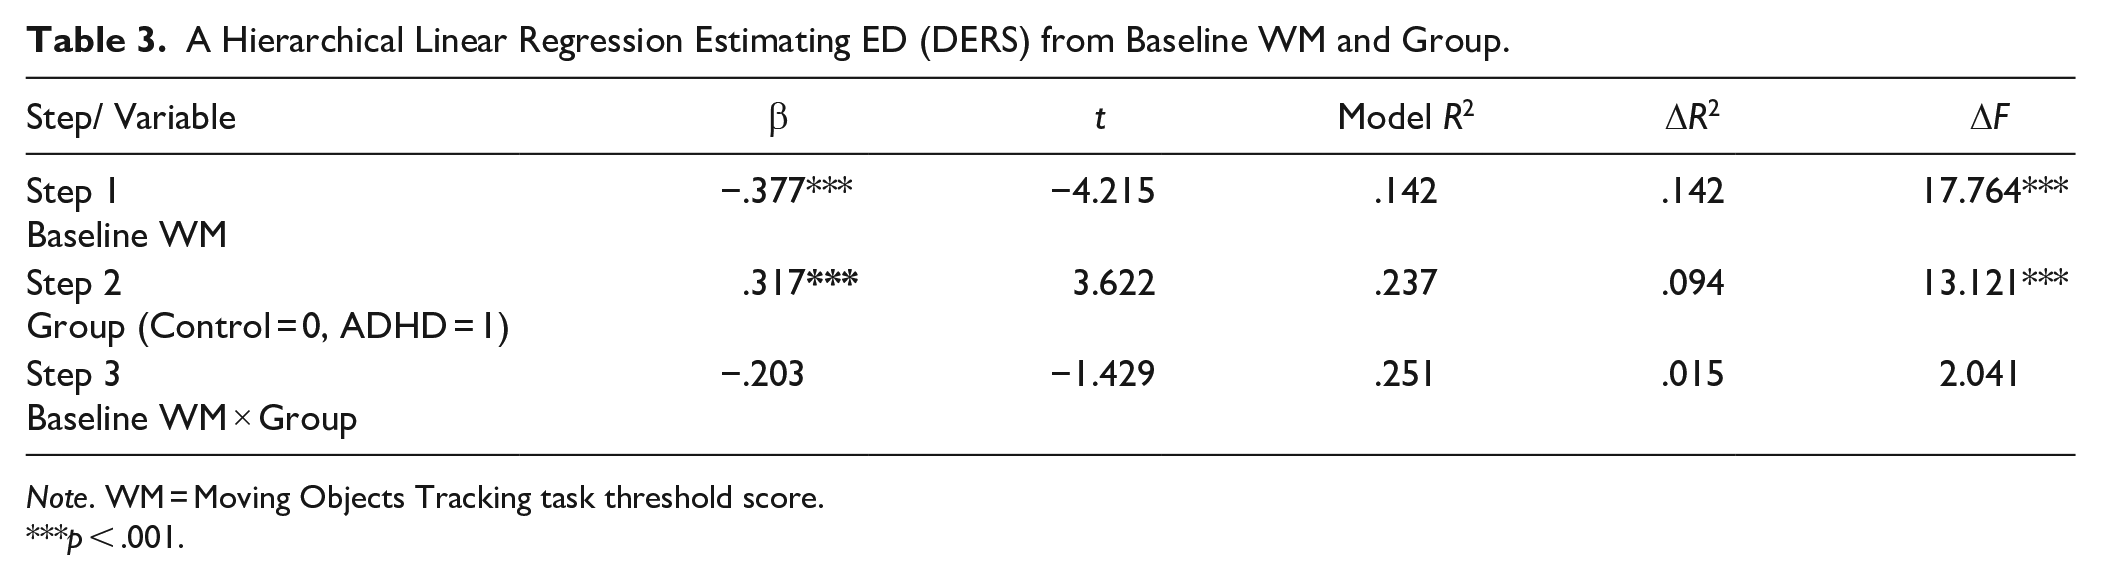
Note. WM = Moving Objects Tracking task threshold score.
p < .001.
We repeated the regression analysis for the DERS subscales that were associated with baseline WM performance (goals, impulse, clarity, and strategies). The results are summarized in Supplemental Tables 3 to 6. The subscales of goals, impulse, and strategies showed a similar pattern to that of the DERS total score, with significant contributions of baseline WM and group to the prediction of ED, and no significant WM × group interaction. For the clarity subscale, baseline WM significantly contributed to its prediction, but neither the group nor the interaction were significant (see Supplemental Table 6).
CC Measures: Association Between Baseline and EMA Performance
EMA data of IC and WM tasks were collected from participants during five workdays, 5 times/day. Compliance rates were high in the final sample and did not differ significantly between groups (92% and 93% in the ADHD and control groups, respectively; t[119] = −0.205, p = .838). Examining the correlations between baseline and EMA-based CC (see Table 2), we found that mean WM performance over EMA was strongly correlated with baseline WM performance (r = .662, p < .001). However, the lability of WM performance over EMA was not significantly associated with either its mean EMA or baseline WM performance. As for IC, mean IC performance over EMA was moderately associated with baseline IC performance (r = .456, p < .001). Finally, the lability of EMA IC was strongly associated with its mean EMA performance (r = −.656, p < .001) and moderately associated with baseline IC performance (r = −.369, p < .001).
Accounting for ED by EMA CC Performance and ADHD Status
The Pearson correlations between the EMA CC metrics and ED (DERS total score) are summarized in Table 2. Across the entire sample, ED was significantly inversely correlated with mean EMA WM performance (r = −.349, p < .001) and with IC performance (r = −.342, p < .001), such that increased ED was associated with worse performance on WM and IC tasks. In addition, ED was correlated with IC lability (r = .288, p = .002), such that increased ED was associated with more IC lability over time, but not with WM lability (r = −.086, p = .345).
To test the unique contribution of each of the mean EMA CC components—WM and IC—to the prediction of ED (DERS total score) beyond ADHD status, we performed a hierarchical linear regression with DERS total score as the dependent variable, and EMA mean of WM and IC as step-1 predictors, adding group as a predictor in step 2. The results of this regression analysis are given in Table 4. Mean EMA performance of both IC and WM significantly contributed to the prediction of the DERS total score (β = −.330, p = .002; β = −.229, p = .009, respectively), together accounting for 20% of the variance. The inclusion of ADHD status in step 2 accounted for an additional 13% (β = .368, p = .000), for a total of 33% of the variance in the DERS total score. Finally, adding the EMA mean CC × group interactions in the final step was not significant (ΔF[2, 113] = 0.669, p = .514, ΔR2 = .008), indicating that the relationship between EMA CC mean performance and ED (DERS total score) does not significantly differ between young adults with and without ADHD.
A Hierarchical Linear Regression Estimating ED (DERS) by EMA Mean Performance of WM and IC.
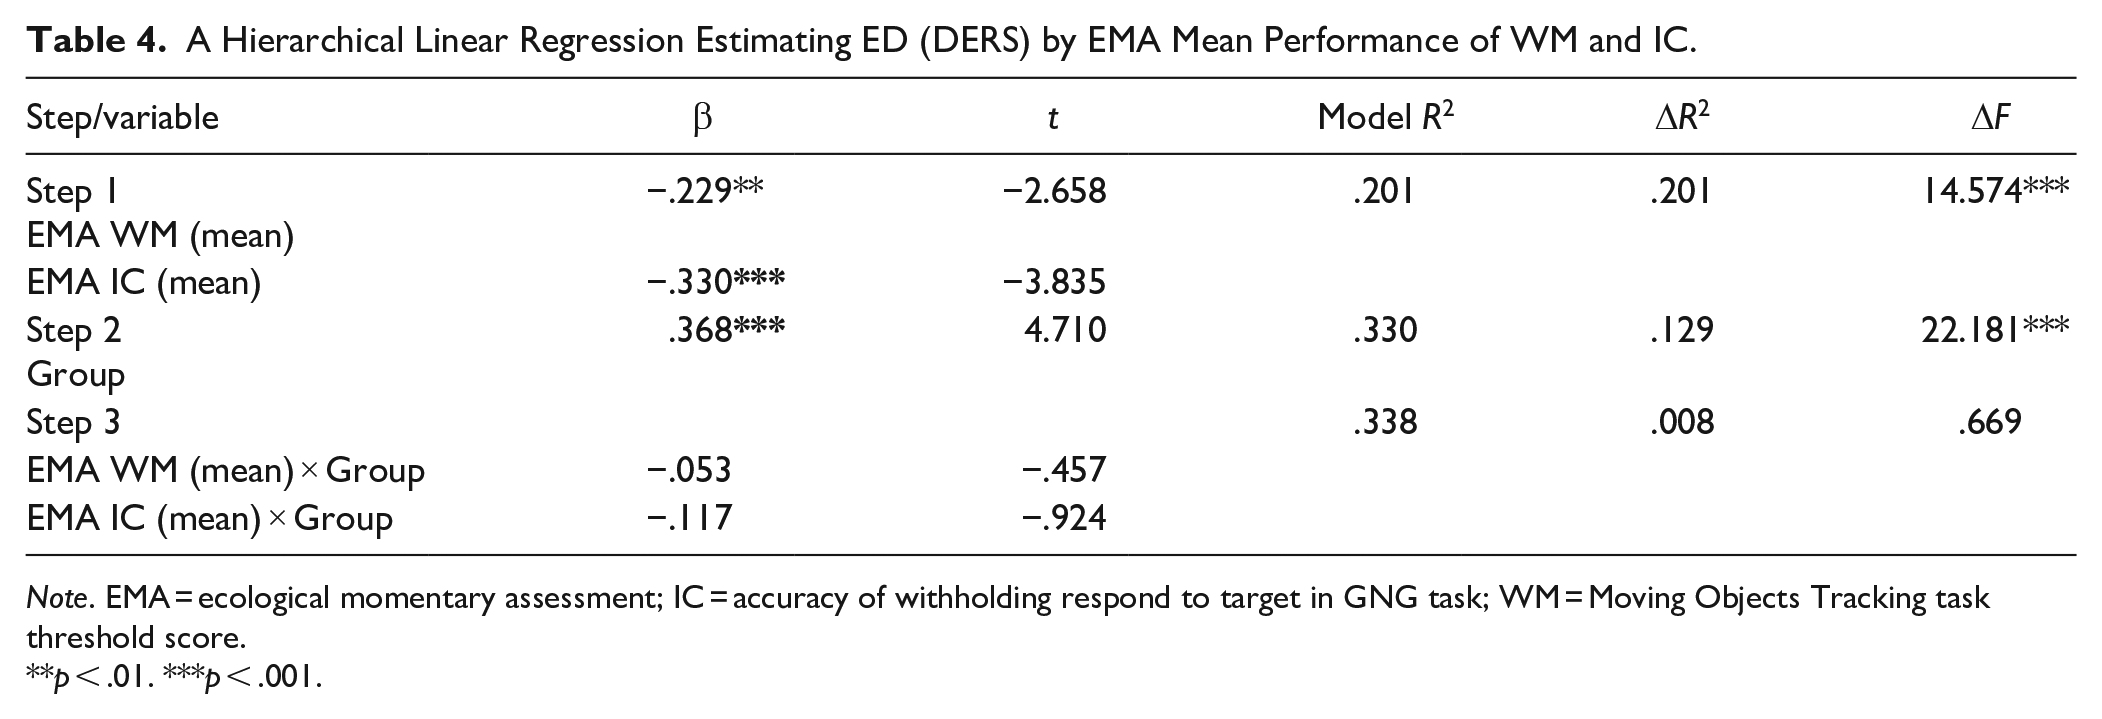
Note. EMA = ecological momentary assessment; IC = accuracy of withholding respond to target in GNG task; WM = Moving Objects Tracking task threshold score.
p < .01. ***p < .001.
We repeated these regression analyses for the DERS subscales that were associated with EMA IC and WM mean performance (goals, impulse, strategies, and clarity; see Supplemental Table 2 for correlations). These analyses are summarized in Supplemental Tables 7–10. The analyses for the subscales of goals, impulse, and strategies showed a similar pattern to that of the DERS total scores, with significant contribution of mean EMA of WM and IC and of group, but no significant interaction between them. For the DERS clarity subscale, which was associated with WM mean EMA only, we found similar results, namely the significant contribution of mean WM EMA but not of group to the prediction (see Supplemental Table 10).
We next examined the contribution of IC EMA lability to ED (DERS total score). We applied a separate hierarchical linear regression for the lability, due to the high correlation between the mean and lability in IC EMA data (r = −.656, p < .001; see Table 2), and to avoid multi-collinearity between predictors. The results are summarized in Table 5. IC EMA lability significantly accounted for 8% of the variance of ED, with ADHD accounting for an additional 17% of the variance (β = .415, p = .000). However, adding the IC lability × group interactions in the final step was not significant (ΔF[1, 116] = 2.590, p = .110, ΔR2 = .017), indicating that the relationship between IC lability and ED does not significantly differ between young adults with and without ADHD.
A Hierarchical Linear Regressions Estimating ED (DERS) From EMA IC Lability and ADHD Group.
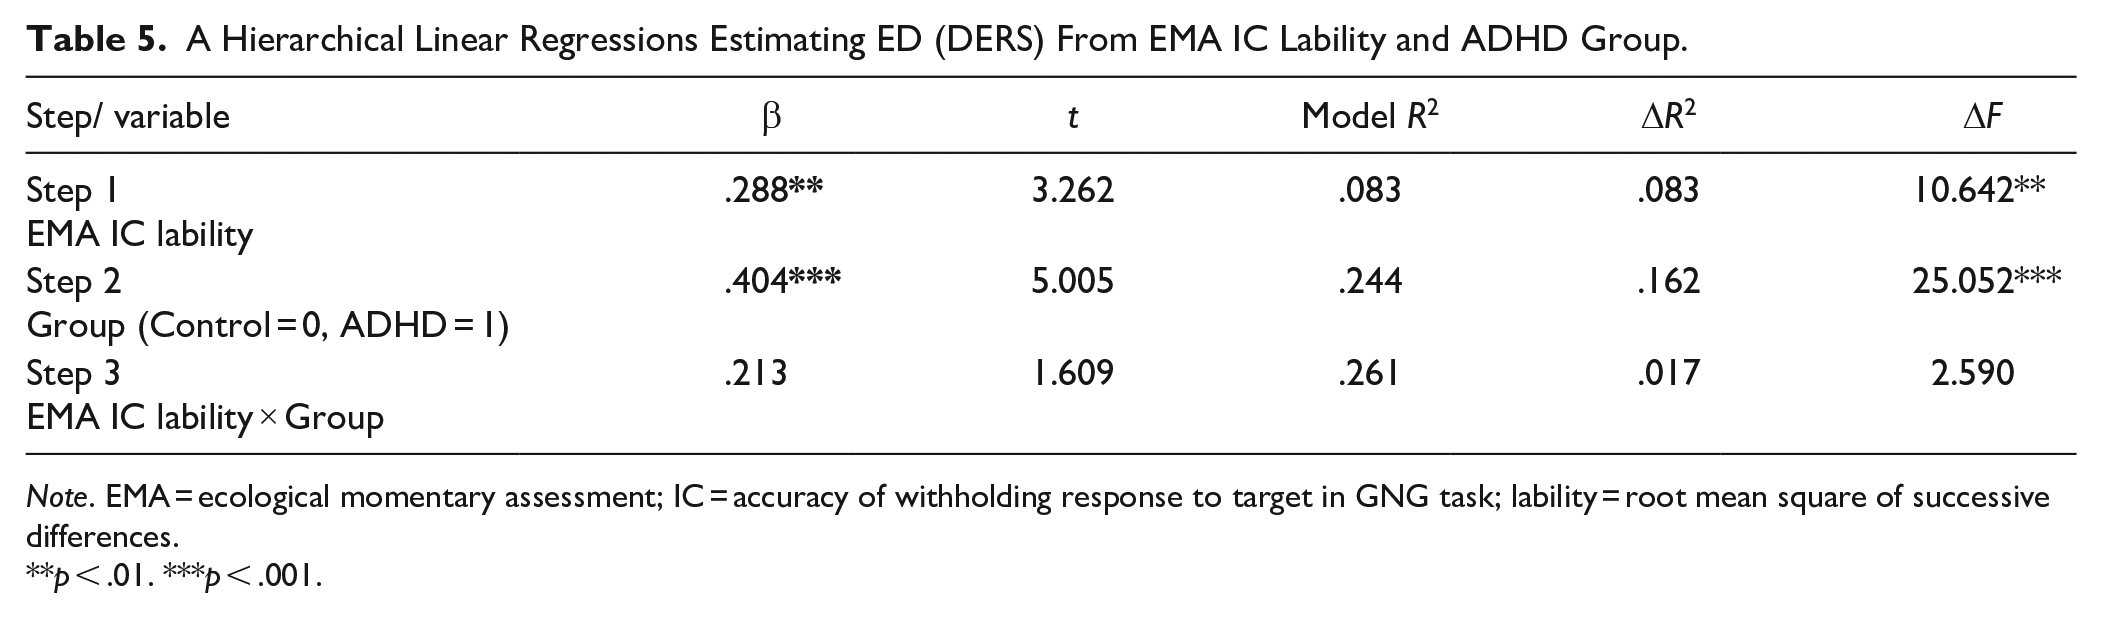
Note. EMA = ecological momentary assessment; IC = accuracy of withholding response to target in GNG task; lability = root mean square of successive differences.
p < .01. ***p < .001.
Similar regression analyses were performed for the DERS subscales of goals, impulse, and strategies, which were correlated with IC EMA lability. The results showed a similar pattern to that of the DERS total score, with significant contribution of IC lability and group but no significant interaction between them (see Supplemental Tables 11 to 13).
Discussion
In this study we examined the contribution of two cognitive control components—IC and WM—to ED (DERS total score) in young adults with and without ADHD using both a one-time lab-based measurement and repeatedly, using EMA. Both WM and IC uniquely accounted for the variance in ED. However, this relationship was different for IC and WM over time and context. Specifically, for IC, only the mean and lability of EMA over time accounted for ED variance, whereas baseline IC did not. In contrast, baseline WM performance and mean EMA performance both accounted for ED variance, but not EMA lability of WM. Although ADHD status also contributed to the explanation of ED variance, there was no interaction between ADHD status and CC, suggesting similar contribution of CC to ED across both groups. These results were similar for the DERS subscales of goals, impulse, and strategies. However, the DERS clarity subscale was only accounted for by WM, and the DERS awareness and non-acceptance subscales were not associated with any of the CC measures.
To our knowledge, this study is the first to examine the ecological manifestation of CC in daily life in young adults with ADHD. Studies in adults with ADHD to date evaluated CC using a one-time lab measurement; or they used EMA methodologies to evaluate emotional states and ADHD symptoms over time and their impact on behaviors, but they did not evaluate CC performance (Koch et al., 2021; Miguelez-Fernandez et al., 2018; Mitchell et al., 2014; Murray et al., 2021). Due to the dynamic and contextual dependency of function and performance in ADHD—and importantly, due to the dynamic nature of the CC functions themselves—capturing CC performance as it occurs in the context of daily life is critical. Here, we used EMA to examine the hypothesis that CC impairments and their lability in daily life can account for ADHD-related ED variation when the temporal dependency of the data is considered (Costa et al., 2019; McKinney et al., 2020; Trull & Ebner-Priemer, 2014).
Interestingly, we found that IC and WM differed in their contribution to ED given the context by which they were measured. Specifically, whereas the inhibitory control (IC) component mean and lability of EMA performance—but not a single-time lab measurement—contributed significantly to ED, WM performance significantly accounted for ED variation in “constant” (i.e., at baseline and in mean EMA performance) but not in “variable” (i.e., EMA performance lability) contexts. These differences between IC and WM require further discussion, as they may reveal the different nature of these 2 CC mechanisms.
Considering IC performance first, we find that reduced and more labile IC is related to higher ED, and that a single IC measurement is not associated with ED. It has been suggested that IC—measured here using a GNG task—supports withholding of initial prepotent or dominant responses and may thus be related to several key components of emotion regulation, such as reduction in negative emotional reactivity, restraint of behavioral response, or stopping rigid application of maladaptive emotion-regulation strategies in face of regulatory failures or changes in situational demands (Falquez et al., 2015; Joormann & Tanovic, 2015; Pruessner et al., 2020; Tang & Schmeichel, 2014; von Hippel & Gonsalkorale, 2005). In ADHD, IC deficits have been suggested to lead to the stronger emotional reactions to events and the socially inappropriate impulsive behavior, and to contribute to the difficulty of engaging in self-regulatory actions (Adler & Silverstein, 2018; Barkley, 2015; Barkley & Murphy, 2010; Faraone et al., 2019).
Of note, here we find that IC performance accounted for differences in ED only when measured ecologically, over time and context, but not at baseline. This dynamic manifestation of IC in relation to ED may help explain some of the inconsistency of the findings in the literature regarding IC and ED to date (Falquez et al., 2015; Joormann & Tanovic, 2015; Marceau et al., 2018; McRae et al., 2012; Sperduti et al., 2017; Tang & Schmeichel, 2014; von Hippel & Gonsalkorale, 2005). Specifically, the two studies that examined the association between IC and ED in ADHD both used a one-time lab measurement of a Continuous Performance Test (CPT) but obtained inconsistent results (Gisbert et al., 2019; Surman et al., 2015). Surman et al. (2015) reported that performance on an auditory CPT did not differ between higher and lower levels of ED in adults with ADHD. In contrast, Gisbert and colleagues (2019) found that IC performance measured using a visual CPT differed among adults with ADHD according to their ED levels. Our results, showing labile manifestation of IC and possibly higher contextual variability of IC performance, may help reconcile some of these discrepancies by suggesting that one-time in-lab measurements may not accurately capture IC performance in relation to ED.
Our results further show a strong association between IC performance—both baseline and mean EMA—and its’ lability. This association suggests that IC over time is not only associated with the levels of this trait but also negatively correlated with variability in IC states (Tomko et al., 2014). Related to that, IC performance in ADHD was shown to be impacted by contextual factors such as reward or following physical exercise (Fuermaier et al., 2014; Gapin et al., 2015; Marx et al., 2013). These results are in line with those of recent EMA studies, showing that variability in impulsive states is associated with ADHD symptoms and aggregated reported impulsive states predicted emotional problems and ADHD symptoms (Halvorson et al., 2021; Pedersen et al., 2019). The results further suggest that people with worse IC have more variability in the manifestation of their IC ability across temporal and physical context. It is therefore possible that EMA mean performance allows a more precise and reliable estimation of one’s IC abilities, especially in clinical populations characterized by deficits in IC (McKinney et al., 2020; Pedersen et al., 2019; Shiffman et al., 2008; Smith et al., 2020).
The contribution of WM to ED variability had a different pattern, with both baseline WM performance and its mean EMA—but not the lability of WM over time—contributing to the explained variance of ED. These results support our initial hypothesis and are in line with the theoretical framework of the involvement of CC mechanisms in ED. Specifically, WM is a complex interactive system capable of handling information in different stages of processing. It has been suggested that WM contributes to ED via its support of maintenance, monitoring, and manipulation of the contents of prior and current experiences to guide an eventual response that is more consistent with one’s longer-term goals (Barkley, 2015; Joormann & Tanovic, 2015).
Findings related to WM and ED in non-clinical samples are consistent with this view. Specifically, ED was found to be related to WM performance when measured using complex, demanding, executive WM tasks (e.g., OSPAN, n-back) (Pe et al., 2015; Schmeichel & Demaree, 2010; Schmeichel et al., 2008; Sperduti et al., 2017) but not when using simple WM tasks (e.g., digit span and spatial span) (Gyurak et al., 2009, 2012; Sperduti et al., 2017). However, in the ADHD literature, the few studies that examined the links between WM and ED found no such associations (Anker et al., 2022; Gisbert et al., 2019; Surman et al., 2015). A potential explanation for this discrepancy could be the nature of the WM tasks used in these studies, mainly involving simple tasks such as digit span and Letter-Number Sequencing (LNS) tasks. Here, we used the MOT task, which taps into basic visuospatial maintenance WM processes but also requires executive attention (Drew & Vogel, 2008; Nigg, 2017; Pylyshyn & Annan, 2006). These differences in WM task requirements may help reconcile the discrepancy between our findings and previous results in adults with ADHD. Future studies should explore the impact of WM and of executive demands level on the relationship between WM performance measures and ED.
The fact that only baseline WM and mean EMA performance—but not WM EMA lability—were related to ED requires further explanation. To our knowledge, this is the first study to examine the relationship between WM performance lability over time and ED. The few EMA studies conducted with WM tasks show inconsistent results regarding the potential impact of context on WM performance (Blasiman & Was, 2018; Cormack et al., 2019; Robertson et al., 2006; Sliwinski et al., 2018; von Stumm, 2018; Weizenbaum et al., 2020). In ADHD, only one study examined variability in WM performance accuracy, using phonological WM tasks in children. WM performance was more variable in the ADHD group compared to the control group when engaged in tasks within their cognitive capacity, whereas all children exhibited similar and high variability on tasks that exceeded their cognitive capacity (Friedman et al., 2022). Future EMA studies should extend the current findings regarding WM consistency and ED, addressing the potential effects of different factors such as cogniitve load and task difficulty.
In addition to the contribution of CC components to ED, we found that ADHD status significantly accounted for the variance in ED. Interestingly, however, no interaction between ADHD status and CC components was found. This result may lend support to the hypothesis that CC processes serve as a transdiagnostic mechanism involved in ED (Macdonald et al., 2016; Zelazo, 2020). From a clinical perspective, impaired CC processes are associated with psychopathological vulnerability (Fernandez et al., 2016; Macdonald et al., 2016; Zelazo, 2020) and are reflected in various symptoms defining DSM disorders (Grisanzio et al., 2018; Joormann & Tanovic, 2015; Macdonald et al., 2016; Moran, 2016; Smith et al., 2020; Zelazo, 2020). Still, the unique contribution of ADHD status to the explained variance of ED found here suggests that alongside the transdiagnostic mechanism of non-emotional CC processes, there are additional ADHD-related factors accounting for ED. The involvement of emotion-related processes that influence motivation and activation (Sergeant, 2005; Sonuga-Barke, 2005) is strongly related to the neurobiology of ADHD and is assumed to contribute to ED in ADHD (Barkley, 2015; Petrovic & Castellanos, 2016; Shaw et al., 2014). For example, disrupted motivational processing and reduced sensitivity to reward or to delayed consequences could lead to negative emotional over-reactivity in situations involving delayed anticipated rewards (Bitsakou et al., 2009; Dovis et al., 2012; Marco et al., 2009; Sonuga-Barke & Halperin, 2010). Future research should further investigate the relationship between CC performance, ED, and the influence of contextual factors in adults with ADHD.
Although the DERS total score was used here throughout to assess ED, the construct of ED is multi-dimensional, and this transdiagnostic multi-dimensionality is reflected in the DERS subscales (Gratz & Roemer, 2004). We found the same pattern of results for the three DERS subscales of goals, impulse, and strategies. These subscales may reflect behavioral aspects of emotion regulation which may be more strongly related to CC abilities. Specifically, a previous study that evaluated the psychometrics of the DERS among adolescents with ADHD found that the impulse and strategies subscales loaded onto the same factor, including items related to the ability to inhibit behavioral expression while experiencing emotions in high intensity or to implement strategies to decrease the intensity of negative emotions (Bunford et al., 2020). Similarly, the goals subscale is indicative of difficulty with goal-directed behavior while experiencing negative emotions.
For the DERS clarity subscale, only WM (baseline and mean EMA) and not IC accounted for the variance in this subscale, whereas the variance of the awareness and non-acceptance subscales was not accounted for by any of the CC metrics. These subscales may be more strongly associated with metacognitive abilities and less with the CC processes of WM and inhibition. Of them three, the clarity subscale may be related to monitoring of emotional states, an ability that is hypothesized to be associated with WM. The DERS non-acceptance subscale is indicative of a tendency to experience secondary negative emotions (Gratz & Roemer, 2004) and represents the appraisals of the individual’s attitude to his or her own experience of negative emotions. The lack of association between this subscale and CC performance in our study may be attributed to the reliance of non-acceptance on additional cognitive abilities of semantic processing, which are required for appraisal abilities (Sheppes, 2020).
Finally, the awareness subscale addresses an intermediate level between the awareness of one’s emotional state and the significance one attributes to monitoring their emotions. Here, the awareness subscale was not associated with other DERS subscales except for clarity and was only moderately correlated with the mean EMA performance of IC. This difference is consistent with previous findings (Osborne et al., 2017). It has also been suggested that this effect is due to technical reasons of reverse-coded items that comprise this subscale (Bardeen et al., 2016; Benfer et al., 2019; Lee et al., 2016). Future studies should be conducted to confirm and validate these results.
Our study had a few limitations that should be noted. First, the ADHD diagnosis was based on a self-reported medical diagnosis of ADHD that was confirmed by ASRS scores above the clinical cutoff, rather than on a clinical interview based on DSM-5 criteria. This could blur the distinction between the two groups, limiting the clinical utility of the results. In addition, our study included only retrospective self-report measures of ED, whereas EMA of ED or a performance-based paradigm might have yielded different outcomes and should be considered in future studies. Finally, our sample was quite homogeneous in terms of age and academic status, which may limit the generalizability of the results.
Taken together, our findings suggest that two main components of CC abilities—IC and WM—both account for the presence of ED in young adults with and without ADHD, but their contribution is different and context-dependent. In addition, ADHD-related factors further account for variance in ED beyond CC in young adults with ADHD. Finally, the roles of the CC components WM and IC seem to present different temporal dynamics, emphasizing the importance of EMA in studying CC. Due to the novelty of our findings regarding the manifestation of CC in ecological settings, future research should focus on assessing momentary variability and contextual dependency of CC processes underlying ADHD and ED in daily life. These findings may also have implications for the use of ecological momentary interventions (EMIs) to assess CC abilities in ADHD, as a means to improve emotion-regulation abilities in this population (Nahum-Shani et al., 2015).
Supplemental Material
sj-docx-1-jad-10.1177_10870547231153934 – Supplemental material for Everyday Cognitive Control and Emotion Dysregulation in Young Adults With and Without ADHD: An Ecological Momentary Assessment Study
Supplemental material, sj-docx-1-jad-10.1177_10870547231153934 for Everyday Cognitive Control and Emotion Dysregulation in Young Adults With and Without ADHD: An Ecological Momentary Assessment Study by Maayan Ben-Dor Cohen, Adina Maeir, Eran Eldar and Mor Nahum in Journal of Attention Disorders
Supplemental Material
sj-docx-2-jad-10.1177_10870547231153934 – Supplemental material for Everyday Cognitive Control and Emotion Dysregulation in Young Adults With and Without ADHD: An Ecological Momentary Assessment Study
Supplemental material, sj-docx-2-jad-10.1177_10870547231153934 for Everyday Cognitive Control and Emotion Dysregulation in Young Adults With and Without ADHD: An Ecological Momentary Assessment Study by Maayan Ben-Dor Cohen, Adina Maeir, Eran Eldar and Mor Nahum in Journal of Attention Disorders
Footnotes
Declaration of Conflicting Interests
The author(s) declared no potential conflicts of interest with respect to the research, authorship, and/or publication of this article.
Funding
The author(s) disclosed receipt of the following financial support for the research, authorship, and/or publication of this article: This study was partially funded by a grant from the National Institute of Psychobiology Israel (NIPI)
Supplemental Material
Supplemental material for this article is available online.
Data Availability Statement
All data will be made available upon request by email from the corresponding author.
Author Biographies
References
Supplementary Material
Please find the following supplemental material available below.
For Open Access articles published under a Creative Commons License, all supplemental material carries the same license as the article it is associated with.
For non-Open Access articles published, all supplemental material carries a non-exclusive license, and permission requests for re-use of supplemental material or any part of supplemental material shall be sent directly to the copyright owner as specified in the copyright notice associated with the article.