
Abstract
Objectives:
Depression and ADHD often co-occur and are both characterized by altered attentional processing. Differences and overlap in the profile of attention to emotional information may help explain the co-occurence. We examined negative attention bias in ADHD as neurocognitive marker for comorbid depression.
Methods:
Patients with depression (n = 63), ADHD (n = 43), ADHD and depression (n = 25), and non-psychiatric controls (n = 68) were compared on attention allocation toward emotional faces. The following eye-tracking indices were used: gaze duration, number of revisits, and location and duration of first fixation.
Results:
Controls revisited the happy faces more than the other facial expressions. Both the depression and the comorbid group showed significantly less revisits of the happy faces compared to the ADHD and the control group. Interestingly, after controlling for depressive symptoms, the groups no longer differed on the number of revisits.
Conclusion:
ADHD patients show a relative positive attention bias, while negative attention bias in ADHD likely indicates (sub)clinical comorbid depression.
Introduction
Depression is a highly prevalent and impeding disorder (World Health Organization, 2017). One of the challenges in diagnosing and treating patients with depression is the frequent co-occurrence of other psychiatric disorders. This in fact suggests that different mental disorders might have common causes (Hankin et al., 2016). Understanding psychiatric comorbidity in terms of shared underlying neurocognitive mechanisms could lead to more advanced and targeted treatment options. In this light, it is striking that adults with ADHD are at more than four times greater risk of developing a depressive disorder compared to adults without ADHD (Tuithof et al., 2010). These disorders show an overlap in symptoms, such as attention deficits and emotion dysregulation, making the distinction difficult. Another consequence of this overlap is that patients with ADHD need to fulfill relatively few additional criteria of depression in order to meet the diagnostic threshold for depression. Taken together, the overlap in symptoms leads to misdiagnosis when both co-occur (Katzman et al., 2017), in turn leading to under- or overtreatment. It also raises the question as to whether ADHD and depression share underlying vulnerability or whether they should be regarded as distinct entities. The starting point of the present study is therefore to investigate potential shared mechanisms in selective attention processes, as both ADHD and depression are characterized by altered attentional processing.
Negative attention bias is one of the cognitive biases that is characteristic of depression and it is proposed to play a causal role in the onset, maintenance, and recurrence of depressive episodes and symptoms (LeMoult & Gotlib, 2019). Negative attention bias in depression can be described as longer (i.e., problems with disengagement) and more frequent attention allocation toward negative opposed to positive or neutral information (Armstrong & Olatunji, 2012). Despite the evident alterations in attentional processing in ADHD, initial evidence for cognitive biases in ADHD is limited and presents a mixed picture. In children, both evidence for a positive attention bias and attentional avoidance of sad faces in ADHD was found on a reaction time Dot Probe Task (Cremone et al., 2018; Shapero et al., 2021). Studies using an eye-tracking paradigm found evidence for a relative more pronounced negative attention bias on the duration (Ahmadi et al., 2011) but not the location of the first fixation in children with ADHD (Pishyareh et al., 2012). Research on cognitive bias in adult ADHD is even more scarce. One study by Vrijsen et al. (2018) found that stronger negative memory bias was related to more ADHD symptoms in a nonclinical sample (Vrijsen et al., 2018). In sum, in children the evidence for negative or lack of positive attention bias in relation to ADHD is mixed and in adults research seems to be lacking.
Because of the high prevalence of comorbid depression (symptoms) in adult ADHD—since the onset of depression is generally later in life than ADHD—negative attention bias and the lack of positive bias might be a shared neurocognitive mechanism. Alternatively, comorbid depressive symptoms might hypothetically be driving a possible negative attention bias in ADHD, with ADHD perhaps being characterized by a relatively more positive processing style. This needs to be studied. Of relevance is a recent study examining the effect of comorbid anxiety symptoms on attentional processing in individuals with elevated ADHD symptoms that showed that comorbid anxiety symptoms drove the attention bias pattern in ADHD (Manoli et al., 2021). This is especially interesting because anxiety, like depression, is characterized by a negative attentional processing style (Richards et al., 2014). Based on this study in non-patients, one might expect similar results: Comorbid depression and symptoms driving a negative attention bias in ADHD patients. At this point the current research cannot address this issue. For example, although the study of Vrijsen et al. (2018) excluded subjects with a clinical psychiatric diagnosis, subclinical depressive symptoms were not controlled for.
Attention bias is classically operationalized by differences in reaction times to positive and negative stimuli, for example using the Dot Probe Task (Peckham et al., 2010), with a relative longer reaction time toward negative stimuli indicating negative attention bias. However, these reaction time measures cannot fully delineate time course and components of attention bias (Armstrong & Olatunji, 2012; Waechter et al., 2014). Eye tracking technology, which allows relatively direct and continuous measurement of overt visual attention, has proven to be useful to examine attentional processing for social stimuli in emotional (e.g., depression; see e.g., Isaac et al., 2014; Kellough et al., 2008) and neurodevelopmental disorders including ADHD (e.g., Pishyareh et al., 2012). The advantage over reaction time tasks lies in the more thorough processing options of visual attention by objectively measuring attentional indices such as gaze fixation and duration, and the number of revisits to a certain stimulus type (Armstrong & Olatunji, 2012).
Based on the previously reported association between ADHD symptoms and negative memory bias in adults (Vrijsen et al., 2018) and the evidence in children with ADHD (e.g., Ahmadi et al., 2011), we expected a slight negative attention bias in ADHD patients, compared to the control participants. The patients with depression (both depression with and without ADHD) were expected to show a stronger negative processing style compared to control participants, with no hypothesis about the comparison between the depressed and depression comorbid to ADHD groups. Disorders are often characterized by a disorder-specific bias pattern; therefore, we expected a stronger attention bias for sad than for angry faces in patients with depression (see Peckham et al., 2010). Furthermore, and in line with the findings on comorbid anxiety symptoms (Manoli et al., 2021), we expected comorbid depressive symptoms to partly explain any negative attention bias found in patients with ADHD. Depression is characterized by problems with attention disengagement and ADHD with attention switching, hence we expected to find group differences on gaze duration and number of revisions. We explored group differences on more anxiety-related eye tracking parameters, for example, location and duration of first fixation.
Due to the scarceness of bias research in ADHD, we studied whether faces with different emotional expressions are valence-dependently selectively (i.e., biased) processed by ADHD patients and how such a potential attention bias can be explained by comorbid depression (both operationalized though clinical classification as well as symptom severity). If comorbid (subclinical) depression influences the attention allocation of patients with ADHD, this may help explain the mixed attention bias findings in ADHD so far. Moreover, if negative attention bias (or: lack of positive attention bias) in ADHD is explained by comorbid depression, relative negative attention bias may be a marker for (difficult to diagnose) comorbid (subclinical) depression. Alternatively, if ADHD patients show a negatively biased processing style independent of depressive symptoms, this might indicate a shared trajectory between ADHD and depression.
Method
Participants
This study is part of the MIND-Set cohort study (Measuring Integrated Novel Dimensions in Neurodevelopmental and Stress-related Mental Disorders) which aims to gain insight in the overlap and differences on biological, neurocognitive, and behavioral levels of stress-related and neurodevelopmental disorders (for a more detailed description see e.g., Duyser et al., 2020; Van Oort et al., 2020). For the current study, we used the clinical and eye tracking data from adult patients classified with ADHD and/or depression at the outpatient clinic of the Psychiatry Department of the Radboud University Medical Center (Radboudumc) in Nijmegen between 2016 until 2019. Non-psychiatric control participants were recruited via advertisement in the community. The study was approved by the local ethical committee of the Radboud University Medical Center and all participants gave written informed consent prior to participation. A total of 199 1 eligible subjects completed the attention bias task and could be further subdivided as follows: 63 currently depressed (Depression), 43 diagnosed with ADHD (ADHD), 25 currently depressed with ADHD (Comorbid), and 68 non-psychiatric participants (Control). Participant characteristics and group comparisons are presented in Table 1.
Clinical and Demographic Characteristics of the Participants Including Group Comparisons (N = 199).
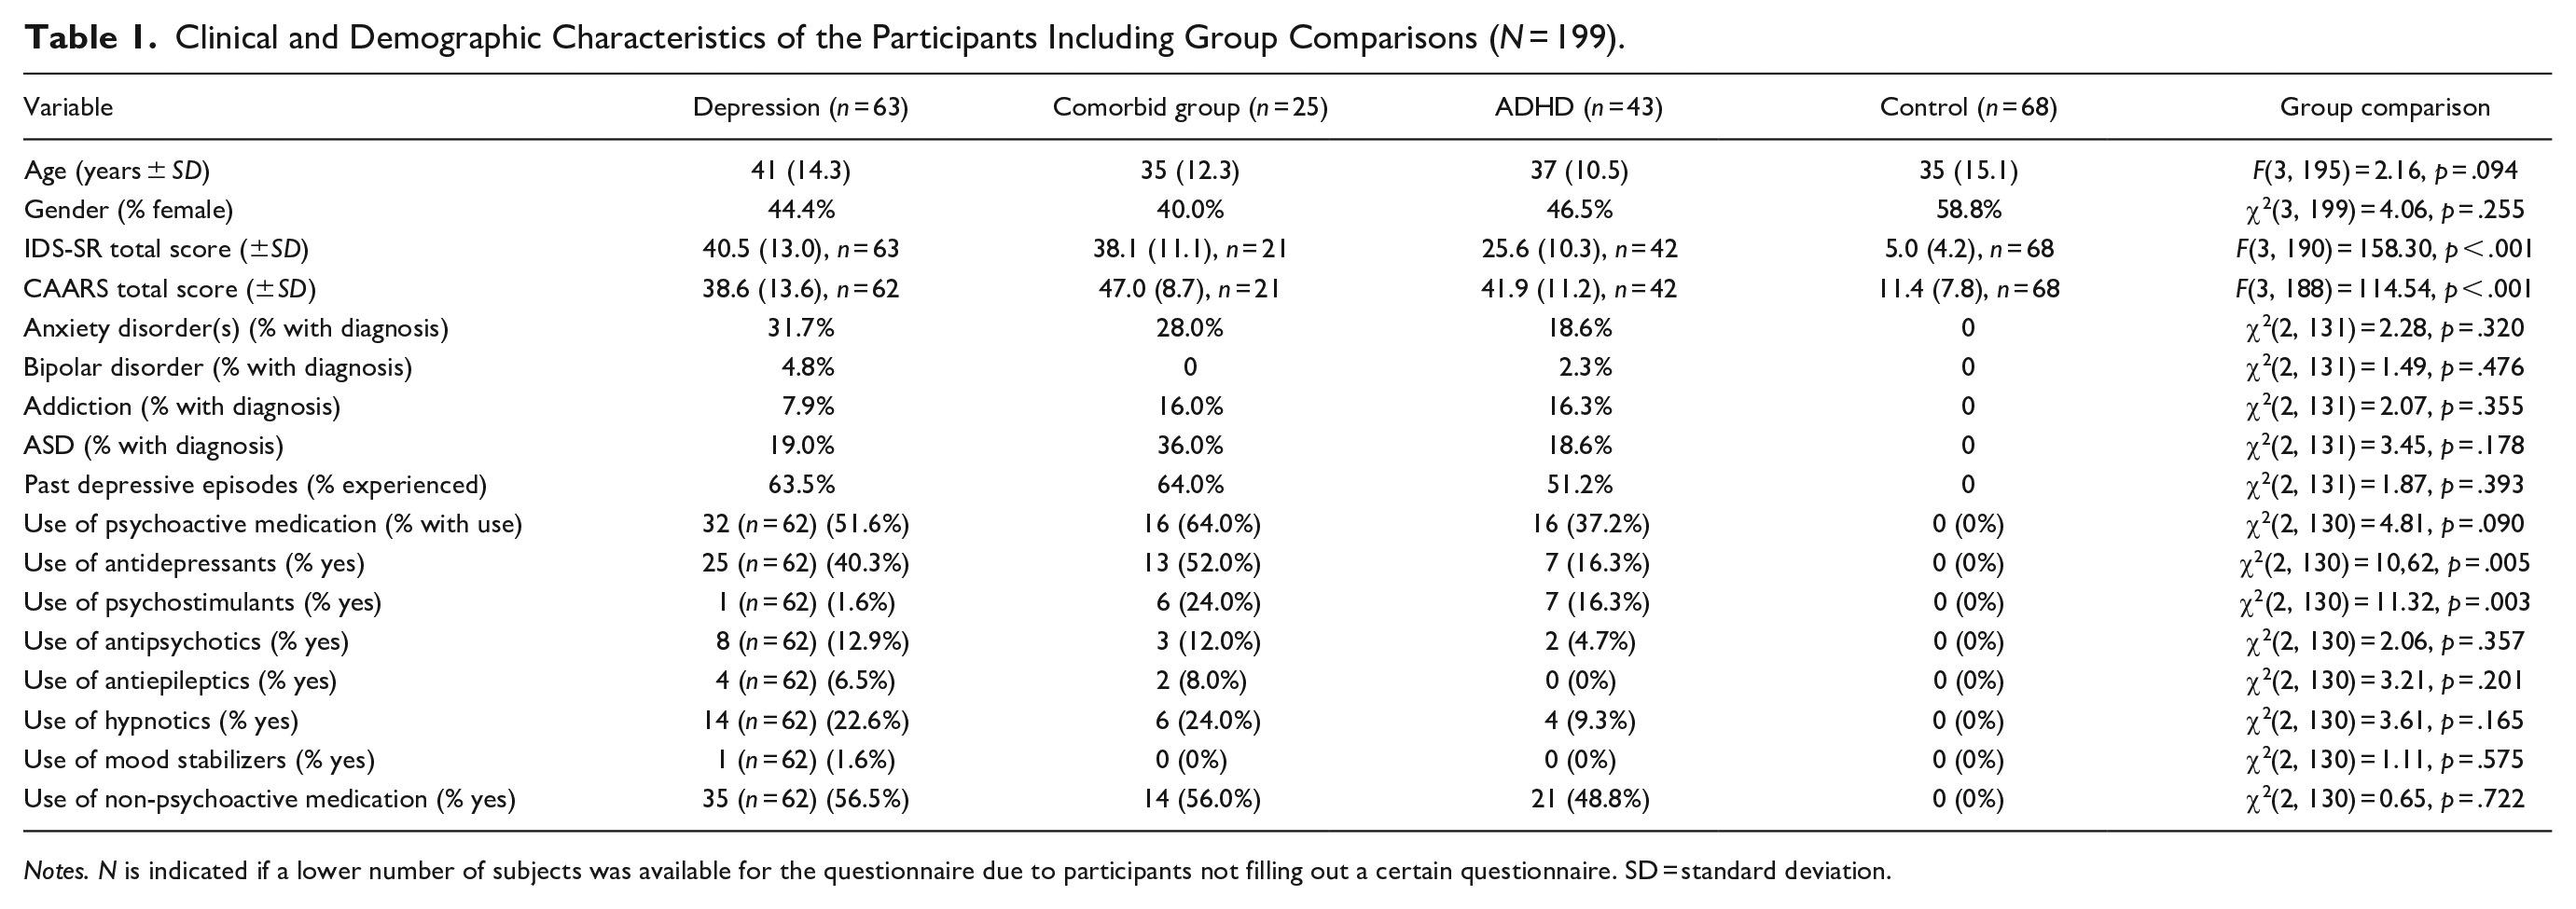
Notes. N is indicated if a lower number of subjects was available for the questionnaire due to participants not filling out a certain questionnaire. SD = standard deviation.
Exclusion criteria were: A full-scale IQ estimate below 70, sensorimotor handicaps, current psychosis, inadequate command of the Dutch language, or mental incompetence to sign informed consent. Additional exclusion criteria for the controls were: Current or history of psychiatric disorder(s), neurological disorders of the central nervous system, malignancies, rare, chronic somatic disorders, consumption of 15 or more units of alcohol per week, recreational drug use or benzodiazepine use of once or more per week, or first-degree relatives with severe psychiatric disorders.
Patients were diagnosed by trained clinicians. Sections A, B, C, D, and F of the Structured Clinical Interview for DSM-IV (First et al., 1995), were used to classify mood and anxiety disorders, and to exclude psychotic disorders. Substance use disorder was diagnosed according to the DSM-IV with the Measurements in the Additions for Triage and Evaluation and Criminality (MATECrimi, subsections 1, 3, 4, 9, and Q1) (Schippers et al., 2011). ADHD and autism spectrum disorders (ASD) were diagnosed using a two-step procedure: Patients were first screened, and in case of a positive screening, they were further assessed using semi-structured interviews (Dutch Diagnostic Interview for Adult Autism Spectrum Disorders [NIDA] for ASD, and the Diagnostic Interview for Adult ADHD, second edition [DIVA] for ADHD). The NIDA and DIVA were administered in the presence of a relative and/or partner to assess the DSM-5 symptoms in childhood as well as in adulthood.
Materials
Questionnaires
The 30-item self-report version of the Inventory of Depressive Symptomatology (IDS-SR) (Rush et al., 1996) was used to assess depressive symptoms severity. The 26-item self-report short version of the Connors’ Adult ADHD Rating Scale (CAARS) (Conners et al., 1999) was used as it assesses ADHD-symptoms across different dimensions such as inattention/memory problems and hyperactivity/restlessness for instance.
Free-viewing task with facial stimuli
The free-viewing task consisted of 12 trials in which all 4 facial expressions were presented per slide: angry, sad, happy, and neutral (see Figure 1). At the start of each trial a fixation cross was shown in the center of the screen for 1,000 ms after which the four images (of facial expressions) were shown simultaneously for 30 seconds at the four different corners of the screen. Per slide, four pictures of the same individual displaying the four different facial expressions were presented. The same sized images depicted colored photographs of an equal amount of Caucasian adult males and females and were selected from the validated Radboud Faces database 14 (Langner et al., 2010). The spatial order in which the different facial expressions were shown was counterbalanced across trials so that each facial expression was presented in the left top corner a total of three times.
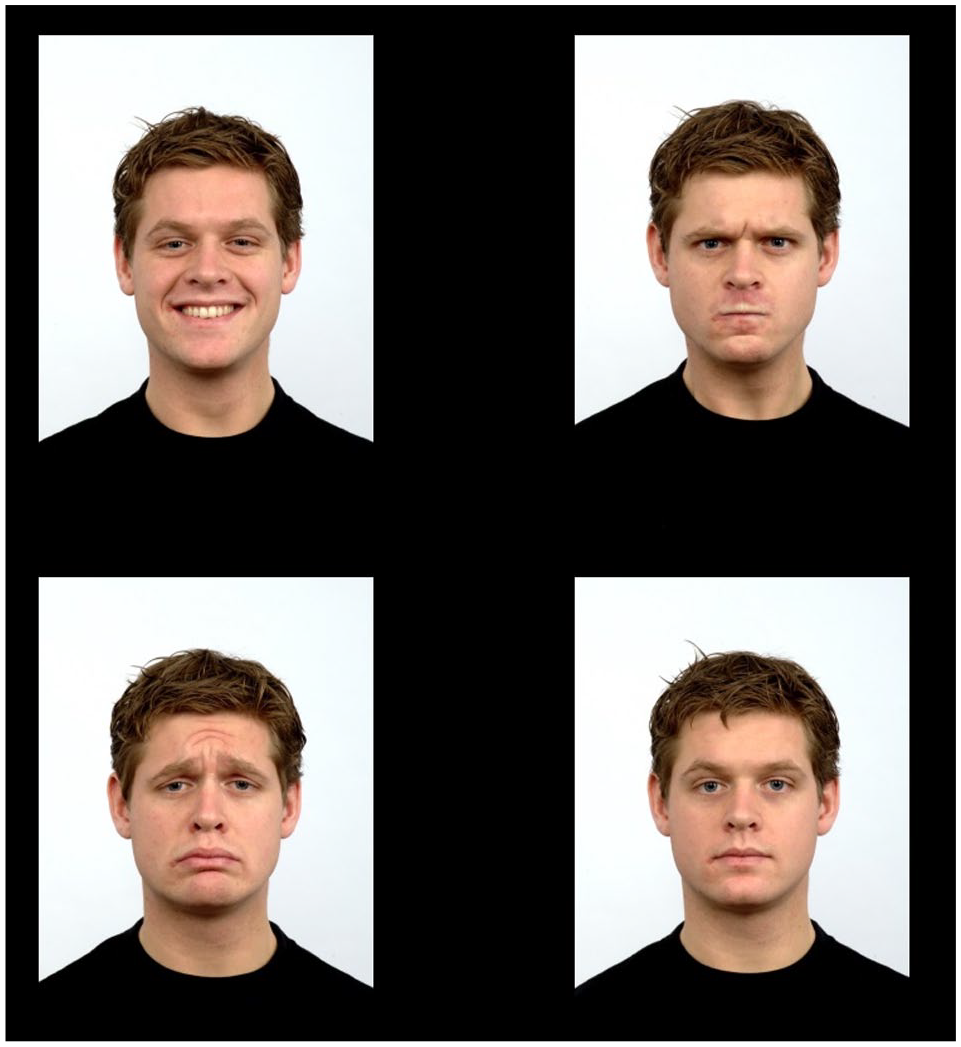
Example of a study trial. Four pictures of the same person with different facial expressions (specifically: Happy, angry, sad, and neutral; each represented an area of interest) were presented per trial. Attention allocation is tracked during presentation.
Eye tracking apparatus
The contact-free screen-based binocular eye-tracking system SMI RED500 was used to register the line of visual gaze (SensoMotoric Instruments of Germany). The accuracy of the eye tracker is 0.4°, with a processing rate of 500 Hz. The direction of gaze was measured in x and y coordinates. The areas of interest (AOIs) were identified and labeled for each trial and corresponded with the outlines of each of the four images. During the 30-seconds trials the participants’ eye fixations were continuously tracked and recorded. The minimum fixation duration threshold was 100 ms and the peak velocity threshold was 40°/s.
Eye tracking data preparation
SMI BeGaze Version 3.7 (SensoMotoric Instruments, Inc.) was used to preprocess the eye tracking data. The data was inspected for abnormalities in addition to checking whether the average of the x and y coordinate calibration scores combined did not exceed the 1.5°, neither was the case. In line with other eye tracking studies (García-Blanco et al., 2013; Isaac et al., 2014) and to gain in depth-analysis, four dependent variables were determined: (a) gaze duration, that is the total duration (in milliseconds) a participant has fixated on a particular facial expression over the 12 trials, independent of any attentional shifts, (b) revisits, that is the number of fixations returned to a facial expression, (c) location of first fixation, that is the first facial expression that a participant fixated on, (d) duration of first fixation: the duration (in milliseconds) of the first fixation.
Procedure
After the initial diagnostic procedure was completed, a separate appointment was made for participation in the eye tracking task (among other neuropsychological tasks). During the task, the participant was positioned approximately 60 cm from the system on a height-adjustable chair to best capture their eyes. In line with other studies (García-Blanco et al., 2013), this was followed by a nine-point calibration to confirm that the eye tracker was recording line of visual gaze within 1.5° of visual angle per calibration point. Then the participant was instructed to view each image at least once and that a memory task would follow this viewing task. During the memory task, adapted slides were presented on which two pictures switched location. The participant had to indicate one of the relocated pictures by clicking on it using a mouse. Attention focus is measured throughout. The memory task was added to mask the aim of the viewing task and motivate participants to keep their attention on the stimuli. The control participants were financially compensated after completing their participation in the study.
Statistical Analyses
Univariate ANOVAs and Chi-squared tests were used to examine potential group differences on demographic and questionnaire data (Table 1). In order to determine whether there were significant differences between the four groups in terms of attention given to each of the four facial expressions (cf. other eye tracking studies e.g., Isaac et al., 2014), the dependent variables (gaze duration, revisits, location of first fixation, duration of first fixation) were analyzed separately by using 4 × 4 ANCOVAs (repeated measures approach), with group (Depression, ADHD, Comorbid, Controls) as the between-subjects factor and facial expression (angry, sad, happy, neutral) as the within-subjects factor, and gender and age as covariates. When significant interaction effects with the group factor were found, post hoc analyses were used to compare groups and facial expressions. Additionally, psycho-active medication use and total IDS-SR score were included as covariates in separate analyses to explore the impact of medication use and (comorbid) depressive symptoms, and the relation between IDS-SR score and the relevant eye-tracking parameters was examined.
Results
Group Comparisons on Demographic and Clinical Aspects
See Table 1 for the group comparisons. The groups did not differ on age or gender identification. We did include these variables as covariates in all main analyses, because the chance of developing a depressive episode increases with age and there are clear gender differences on both depression and ADHD (and their comorbidity) prevalence (De Graaf et al., 2012). The depressed and comorbid groups showed the highest level of depressive symptoms (IDS-SR), while the two ADHD groups (comorbid depression and no comorbid depression) showed the highest level of ADHD symptoms. Interestingly, the mean IDS-SR score in the ADHD group indicates a moderate to severe level of depression (cf. Rush et al., 1996). The prevalence of comorbid disorders or the experience of one (or more) past depressive episode(s) did not differ between the patient groups. Again strikingly, almost half of the ADHD patients without current depression experienced at least one depressive episode in the past.
Group Comparisons on Eye-Tracking Indices
Gaze duration
There was a significant main effect of group, (F[3, 193] = 3.10, p = .028, η2 = .05), whereby the comorbid group spent significantly less time looking at facial expressions both compared to the depression (F[1, 84] = 4.94, p = .029, η2 = .06) and the ADHD group (F[1, 64] = 8.21, p = .006, η2 = .11). Comparisons between the remaining groups all failed to reach significance, with all p-values >.054. We did not find a significant interaction between group and the factor facial expression (F[4.70, 302.52] = 1.07, p = .378, η2 = .02)2 nor a main effect of facial expression (F[1.57, 302.52] = 2.52, p = .096, η2 = .01). See Table 2 for the group comparisons on the eyetracking parameters.
Overview of the Eye Tracking Results. The Mean Gaze Duration, Number of Revisits, Times a Certain Location (Facial Expression) Was the First Focus of Attention and the Mean Duration of First Fixation (All With Standard Deviations) Are Presented Per Participants Group Per Facial Expression.
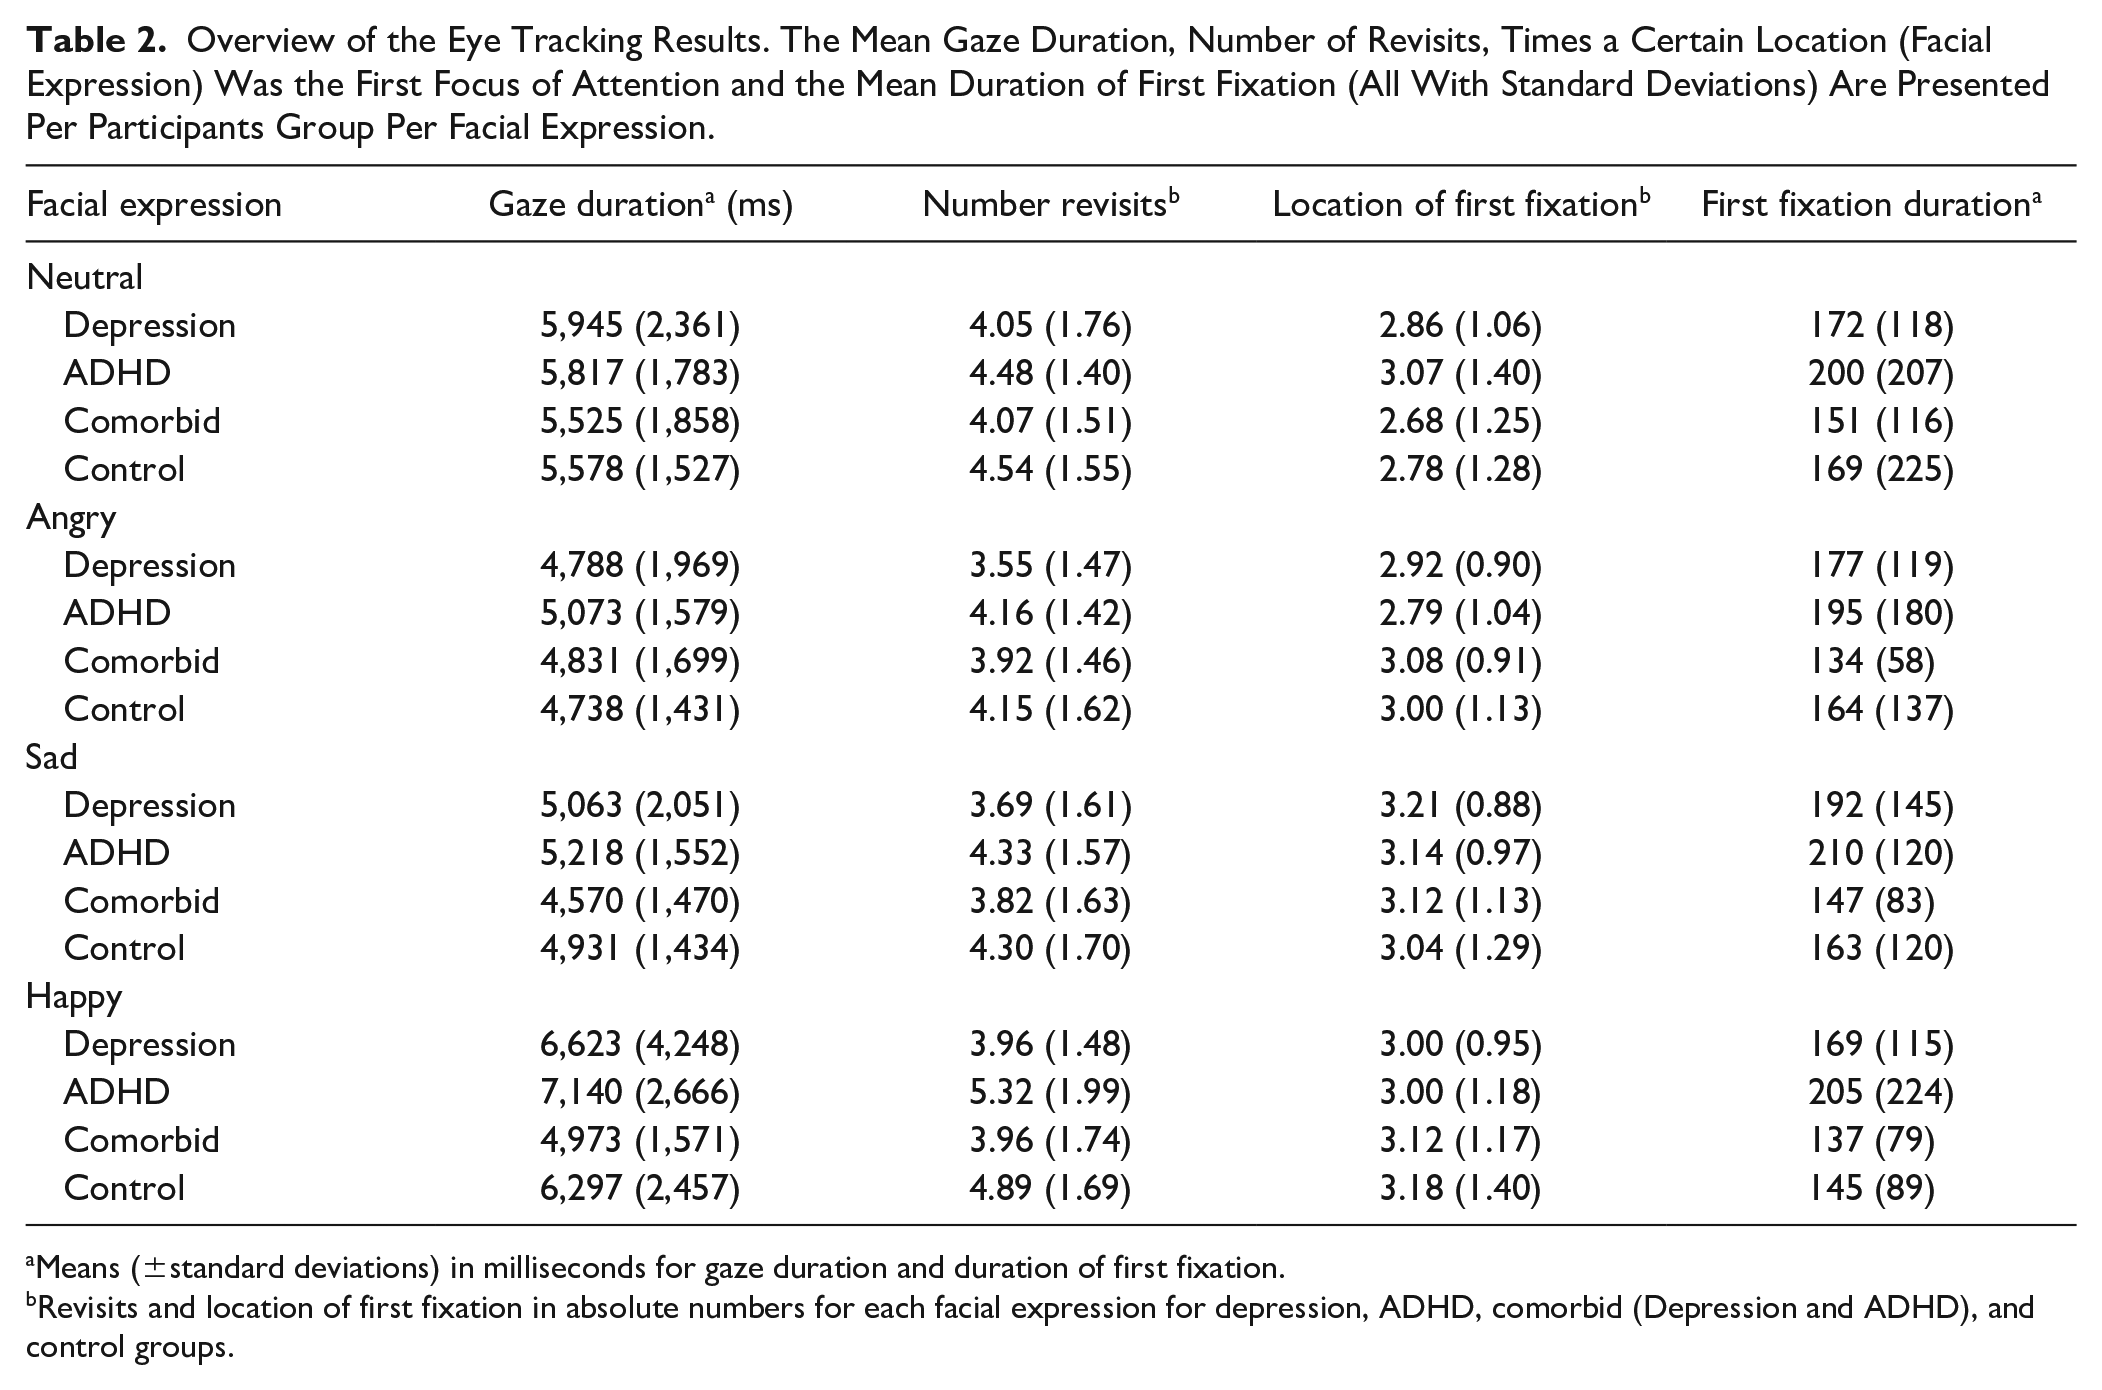
Means (±standard deviations) in milliseconds for gaze duration and duration of first fixation.
Revisits and location of first fixation in absolute numbers for each facial expression for depression, ADHD, comorbid (Depression and ADHD), and control groups.
Revisits
There was a significant interaction between the factors of group and facial expression, (F[6.03, 387.72] = 2.28, p = .035, η2 = .03; Greenhouse-Geisser correction) 2 on the number of revisits. Post hoc analyses comparing the four groups on the different facial expressions revealed that the groups differed on the mean number of revisits toward the happy expressions only, (F[3, 193] = 7.15, p < .001, η2 = .10). The groups did not differ on the number of revisits to angry, (F[3, 193] = 2.50, p = .061, η2 = .04); sad, (F[3, 193] = 2.47, p = .063, η2 = .04); or neutral faces, (F[3, 193] = 1.46, p = .226, η2 = .02). Depressed individuals revisited the happy facial expression significantly less both compared to the ADHD, (F[1, 102] = 16.01, p < .001, η2 = .14), and the control group, (F[1, 127] = 9.54, p = .002, η2 = .07). The comorbid group revisited the happy facial expressions significantly less compared to the ADHD, (F[1, 64] = 7.48, p = .008, η2 = .11), and the control group, (F[1, 89] = 4.70, p = .033, η2 = .05). There were no significant differences between the comorbid and depression group, nor between the ADHD and control group on the mean number of revisits toward happy faces, with all p-values >.243. The mean revisits for each facial expression per group are shown in Figure 2.
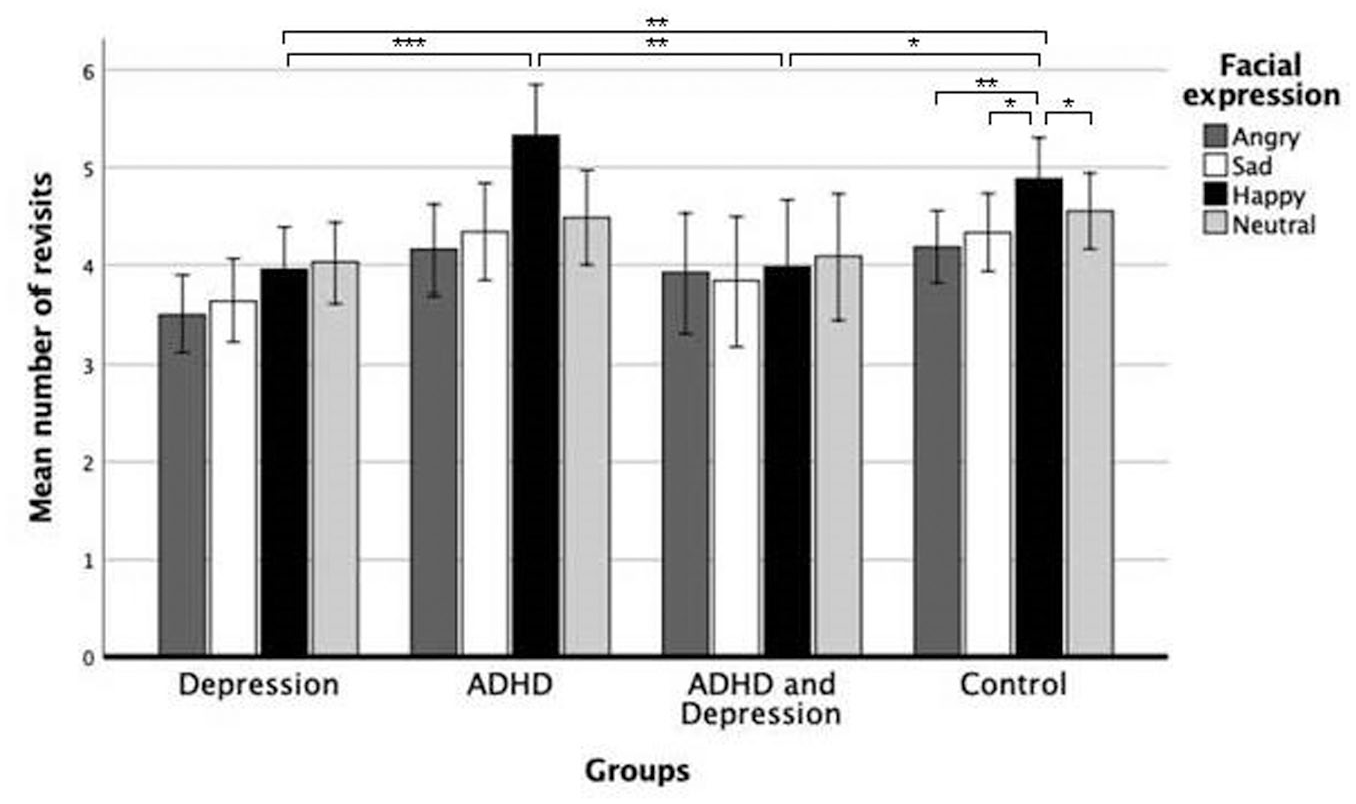
Mean number of revisits in absolute numbers with error bars per facial expression for the depression, ADHD, comorbid (Depression and ADHD), and control groups. The error bars reflect the standard error. Significant differences are indicated using *p < .05, **p < .01, and ***p < .005.
The analyses also revealed significant differences within the control group between the revisits to different expressions, (F[1.73, 112.54] = 5.04, p = .011, η2 = .07). There were no significant differences found between facial expressions within the other groups, with p-values >.429. The controls revisited the happy expression significantly more as compared to the angry expression, (F[1.00, 65.00] = 7.99, p = .006, η2 = .11), the sad expression, (F[1.00, 65.00] = 5.47, p = .022, η2 = .08), and the neutral expression, (F[1.00, 65.00] = 5.08, p = .028, η2 = .07). The other comparisons between facial expressions within the control group failed to reach significance with p-values >.210.
There was a significant main effect of group, (F[3, 193] = 3.95, p = .009, η2 = .06). The depression group showed significantly less overall revisiting both compared to the ADHD group, (F[1, 102] = 7.625, p = .007, η2 = .07), and the control group, (F[1, 127] = 7.437, p = .007, η2 = .06). The other group comparisons failed to reach significance on overall revisiting with all p-values >.094. This difference is nonsignificant when including psychoactive medication use as covariate.2 Finally, there was no significant main effect of facial expression, (F[2.01, 387.72] = 2.63, p = .073, η2 = .01).2 When controlling for the effect of depressive symptoms on attentional revisits by adding the total IDS-SR score as a covariate, the interaction between the factors of group and facial expression was no longer significant, (F[6.05, 376.95] = 1.95, p = .071, η2 = .03) indicating that this effect was driven by the acute depressive state independent of group allocation. Relatedly, we found an interaction effect between facial expression and IDS-SR total score independent of diagnosis, F[1.99, 378.47] = 3.64, p = .027, η2 = .02. When examining the correlation between IDS-SR total score and number of revisits per facial expression, we found that a higher IDS-SR score was related to less revisits to the happy facial expression, r = .258, p < .001. The other correlations were not significant, with all p-values >.063.
Location of first fixation
Neither the main effect of group, (F[3, 193] = 0.82, p = .487, η2 = .01), the main effect of facial expression, (F[2.78, 535.57] = 0.90, p = .435, η2 = .01), nor the interaction of group and facial expression were significant, (F[8.33, 535.57] = 0.53, p = .838, η2 = 0.01)2.
Duration of First Fixation
Neither the main effect of group, (F[3, 193] = 2.02, p = .113, η2 = .03), the main effect of facial expression, (F[2.61, 504.16] = 0.20, p = .873, η2 = .001), nor the interaction between these two factors were significant, (F[7.84, 504.16] = 0.32, p = .958, η2 = .01).2
Discussion
To unravel potential shared neurocognitive processing deficits in depression and ADHD, we employed a direct and continuous measurement of valence-specific attentional processing for emotional stimuli (or: attention bias) by tracking eye movements in patients with depression, ADHD, and comorbid depression/ADHD, as well as in non-psychiatric controls. The ultimate aim was to gain insight in mechanisms contributing to the high level of comorbidity between these two common psychiatric disorders. Significant group differences were found for the number of times individuals revisited certain facial expressions. In line with previous research (Peckham et al., 2010), controls showed a higher tendency to positive revisits that can be interpreted in the line of an enhanced positive attention bias. Contrary, participants in both the depression and the comorbid ADHD and depression group showed significantly less recurring attendance to the happy facial expression when compared to the non-depressed participants in the ADHD and the control groups. Importantly, when controlling for depression symptom severity, the groups did not differ anymore and depressive symptoms were related to less revisits to happy faces across groups. Together these results suggest that adult ADHD patients might show a relatively positive processing style and that (sub)clinical depression leads to less frequent processing of positive faces, so less positive attention bias. This is largely in line with recent findings on negative memory bias as a transdiagnostic marker for (sub)clinical depression in a broader group of psychiatric patients with different diagnoses and high levels of comorbidity (Duyser et al., 2020). Moreover, it underscores the importance of inclusively characterizing research samples on clinical variables: Comorbid symptoms and disorders influence the processing of emotional information and perhaps neurocognitive functioning more broadly.
Emotion regulation problems in patients with ADHD are highly relevant also with respect to understanding its high comorbidity with stress-related disorders including anxiety, depression, and addiction (Barkley & Murphy, 2010; Bunford et al., 2018). In a recent meta-analysis, the efficacy of pharmacological ADHD treatments was investigated with respect to effects on emotion regulation problems and showed only small to moderate effect sizes (Lenzi et al., 2018). In contrast to previous eye tracking studies, we neither found a negative attention bias on initial attention fixations in ADHD (e.g., Pishyareh et al., 2012), nor a longer gaze duration for negative information in depression (Isaac et al., 2014). In a recent study (Shushakova et al., 2018), Shushakova et al. (2018) measured event-related potentials (ERPSs) and behavioral attention bias in 39 adult patients with ADHD and 41 healthy controls during a verbal dot-probe task with positive-neutral, negative-neutral, and neutral-neutral word pairs. Behavioral results revealed only a trend-significant slower reactions to positive words than in patients with ADHD. Notably, those patients exhibited light depressive symptoms as revealed by the Beck Depression Inventory supporting the impact of the depressive state on attentional bias changes in ADHD, which is in line with findings from our study.
The results indicate that ADHD might be characterized by a relative positive attention bias in repeated engagement of attention but not a bias in prolonged engagement of attention as would have been expressed by a longer fixation period. Furthermore, it is informative that we found evidence for a differential bias on the number of revisits but not on the total gaze duration per facial expression. A lack of repeated engagement with positive stimuli in depression is conform previous findings (Lazarov et al., 2018; LeMoult & Gotlib, 2019; Peckham et al., 2010). However, we would have also expected more revisits or longer gaze duration for negative stimuli in depression exemplifying also the selective enhancement toward negative information (Peckham et al., 2010). One explanation for the lack of negative attention bias in depression may be the relatively high level of comorbidity in this group with for example ASD, anxiety, and/or addiction; disorders with their distinct attention bias characteristics (see e.g., Bar-Haim et al., 2007) which may have interacted with the depression obscuring a depressotypic processing style. Another explanation may be that we did not assess or model the effect of cognitive control on the viewing pattern. Cognitive control and the role of flexibility in cognitive bias is gaining attention (see e.g., Derakhshan, 2020; LeMoult & Gotlib, 2019). Especially within the 30 seconds viewing phase, a negative bias could have been inhibited at some point. A dynamic approach to measuring and analyzing attention bias might hold promise for future research.
Our lack in differences in gaze duration might be explained by the difficulty of sustained attention since the viewing time per trial was 30 seconds in our study, which is relatively long as compared to other eye tracking studies (Armstrong & Olatunji, 2012). Relatedly, because participants knew a memory test would follow, they might have engaged in a rather structured viewing pattern, making sure to see every picture on the screen and likely initially following the Western reading pattern (left to right, top to bottom). Relatedly, we did not find group differences on the indices of location or duration of first fixation. This might be explained by the fact that both the location of first fixation and the duration of first fixation outcome measures are vigilance-based outcome measures, which are primarily associated with anxiety disorders (Gamble & Rapee, 2010; Mogg et al., 2000).
In general, this opens up the question which variables may be useful when investigating attention bias in patient groups with neurodevelopmental and stress-related disorders. With respect to the variables used in eye tracking tasks, it may be important to consider that in ADHD, inattention may contribute to biased emotional processing by impeding maintaining attention as is measured with the gaze duration index. Therefore, number of revisits may be more suitable to measure attention bias in ADHD. Moreover, over half of the ADHD patients had a history of past depression and IDS-SR scores indicative of moderate to severe depression, and the depression group displayed relatively high ADHD symptom scores. Additionally, all patient groups showed high levels of comorbid disorders, which is congruent with the naturalistic sampling at a university medical center. While this supports comorbid symptom dimensions in our naturalistic cohort, our ADHD and depression group tend to have more similarities, which could have caused the absence of the expected differences in gaze duration. On the other hand, by naturalistically sampling the patients, the results can be generalized to the psychiatric population more accurately.
In summary, we conclude that the presence of a positive attention bias in the revisits outcome measure as found in the non-psychiatric control group, as well as the absence of this positive attention bias in the depression and comorbid (depression and ADHD) group can be explained by the depression symptom severity scores as measured with the IDS-SR. Measuring negative or a lack of positive bias remains indicative for depression also from a dimensional perspective (see e.g., the RDoC perspective of the NIMH) (Cuthbert & Insel, 2013). Techniques such as used in an eye-tracking system provide means to become a diagnostic marker for acute depressive symptoms, while using it as indication of treatment effect is less clear but obviously also a promising avenue to take. With respect to the clinical impact of these findings one should take new treatment options promoting positive attentional bias into account such as Cognitive Bias Modification (CBM) (Jones & Sharpe, 2017). CBM is a relatively new intervention field with so far some mixed but overall promising findings (Jones & Sharpe, 2017). CBM may be useful as treatment augmentation strategy for ADHD patients suffering from comorbid depression, which can be difficult to treat.
Footnotes
Declaration of Conflicting Interests
The author(s) declared no potential conflicts of interest with respect to the research, authorship, and/or publication of this article.
Funding
The author(s) disclosed receipt of the following financial support for the research, authorship, and/or publication of this article: Funding for the MIND-Set Study was provided by the Radboud University Medical Centre and the Psychiatry Foundation as well as from a European Union’s Horizon 2020 research and innovation programme grant (grant agreement number 728018). These funding sources had no role in the study design, collection, analysis or interpretation of the data, writing the manuscript, or the decision to submit the paper for publication.