
Abstract
Keywords
Introduction
Deficits in the self-regulation of emotions, or emotional dysregulation (EDr), have recently become a major focus of academic interest, but have been long identified and studied within the literature as many closely related or overlapping concepts, including negative emotionality, neuroticism, choleric or fiery temperament, and emotional or mood lability (Cole, Martin, & Dennis, 2004; Miller & Pilkonis, 2006; Widiger, 1998). Emotional dysregulation is the propensity for excessively and rapidly shifting emotions that is inappropriate to the situational context, age, and developmental stage (Cole, Michel, & Teti, 1994; Conklin, Bradley, & Westen, 2006; Glenn & Klonsky, 2009). It also encompasses irritability, which is described as the excessive physiological and negative affective reactivity to stimuli (Caprara et al., 1985; Rich et al., 2007) and is characterized by subjective feelings of anger, short/bad temper, crankiness, resentment, or annoyance—sometimes resulting in aggressive behavior (Russell A. Barkley & Benton, 1998; Barry, Marcus, Barry, & Coccaro, 2013; Caprara et al., 1985; Stringaris, 2011). Irritable children are more likely to drop out of school, be unemployed, and have strained adult relationships (Caspi, Wright, Moffitt, & Silva, 1998; Fergusson, John Horwood, & Ridder, 2005; Kokko, Bergman, & Pulkkinen, 2003; Roberts, Kuncel, Shiner, Caspi, & Goldberg, 2007; Sahl, Cohen, & Dasch, 2009). Emotionally impulsive children are also more likely to experience legal and financial problems in adulthood (R. A. Barkley & Fischer, 2010). Two prospective follow-up studies showed that adolescent irritability predicts future mood and anxiety disorders and suicidal behavior (Pickles et al., 2010; Stringaris, Cohen, Pine, & Leibenluft, 2009).
Poor emotional control is common, prevalent across the life span, and linked with many psychiatric and medical disorders. Although EDr is present in 3% to 20% of children and youth in general (Brotman et al., 2006), up to one third of psychiatric samples have irritability (Stringaris, 2011). Rates of EDr in ADHD vary from 8% to 80%, depending on the presence of comorbid disorders (Galanter et al., 2003; Geller et al., 2001; Mick, Spencer, Wozniak, & Biederman, 2005). EDr is probably a core feature of oppositional defiant disorder (ODD; R. A. Barkley & Fischer, 2010; Martel, Gremillion, Roberts, von Eye, & Nigg, 2010; Pelham, Gnagy, Greenslade, & Milich, 1992; van Stralen, 2016). This is supported by the finding that emotionality as a toddler predicted ODD in childhood (Stringaris, Maughan, & Goodman, 2010). Children with ODD who display anger–irritability symptoms also tend to have more severe symptoms of anxiety and depression than ODD counterparts with behavioral symptoms (Drabick & Gadow, 2012). This implies that the affective symptoms of ODD may be of greater prognostic value for future mental disorders. EDr is also associated with many other childhood psychiatric disorders including bipolar disorder, depression, dysthymia, separation anxiety, and conduct disorder (Diagnostic and Statistical Manual of Mental Disorders [5th ed.; DSM-5; American Psychiatric Association [APA], 2013]; Birmaher, 2016; D. S. Shaw, Owens, Giovannelli, & Winslow, 2001). EDr is also associated with many adult psychiatric disorders including generalized anxiety disorder, premenstrual dysphoric disorder, posttraumatic stress disorder, substance-related and addictive disorders, and borderline personality disorder (APA, 2013; Winsper, Hall, Strauss, & Wolke, 2017). EDr is also common in many neuropsychiatric conditions including Huntington’s disease (Demark & Gemeinhardt, 2002; Rosenblatt & Leroi, 2000), acquired brain injury (Demark & Gemeinhardt, 2002; Kim, Moles, & Hawley, 2001), and dementias (Cipriani, Vedovello, Nuti, & Di Fiorino, 2011; Kim et al., 2001). As such, it contributes to the overlap in diagnostic criteria and lack of specificity between psychiatric disorders (Caron & Rutter, 1991). For instance, disruptive mood dysregulation disorder (DMDD) was created, in part, because of the implausibly high rates of nonepisodic irritable children and youth misdiagnosed with bipolar disorder (Moreno et al., 2007; Roy, Lopes, & Klein, 2014). However, ODD and DMDD cannot be differentiated based on symptoms, thereby complicating the diagnostic process (Meyers, DeSerisy, & Roy, 2017). Clearly, the effective measurement of EDr in psychiatric disorders as well as medical disorders is important.
Distinguishing normal and pathological expressions of emotion depends critically on having valid and reliable instruments. The conceptual understanding and management of EDr can only be advanced with good measurement (Stringaris, 2011; van Stralen, 2016). Unfortunately, too many mental health rating scales take the validity of sum scores for granted (da Rocha, Chachamovich, de Almeida Fleck, & Tennant, 2013). Raw scores in many instruments are ordinal-level measures whose adjacent categories do not represent equal intervals (Hobart, Cano, Zajicek, & Thompson, 2007). Furthermore, the constructs underlying candidate items are often not well developed theoretically prior to scale development (Hobart et al., 2007). Within the paradigm of classical test theory, the focus is on total scores (or average scores) in a scale, with the assumption that each question is weighted equally (Fayers & Machin, 2016). In effect, each item in the test is considered a “parallel test” and is assumed to be endorsed with the same frequency as the others (van Schuur, 2003). This is unlikely to hold in clinical settings. For example, among patients with neck pain, having headaches was more frequently endorsed than being able to work (van der Velde, Beaton, Hogg-Johnston, Hurwitz, & Tennant, 2009). Thus, a score of 10 might not reflect the same level of disability in people endorsing different sets of items. Newer psychometric techniques, such as Rasch modeling, a form of item response theory (IRT), can help answer the question whether the use of sum scores for a given test is justified or not. Sum scores are valid measures only when questionnaire responses conform to a probabilistic Guttman (staircase-like) pattern (Andrich, 1988). Otherwise, sum scores are misleading.
Many scales have been developed for the assessment of emotional regulation and related constructs. None has yet been developed for children and youth with the benefit of IRT, with a single exception. This is the Patient-Reported Outcomes Measurement Information System (PROMIS) Pediatric Anger Scale (Irwin et al., 2012). With six questions rated on a five-point scale, the instrument translates a participant’s sum score into T scores (Irwin et al., 2012). The Difficulties in Emotion Regulation Scale (DERS) is based on a well-developed theory of emotion regulation that is contrasted with the constriction or control of emotions, leading to a six-factor instrument with satisfactory reliability and validity (Gratz & Roemer, 2004; Weinberg & Klonsky, 2009). Stringaris and colleagues designed a parent- and self-report scale to assess childhood and adolescent irritability, the affective reactivity index (ARI; Stringaris et al., 2012). While these scales each have their niche, a scale that is based on affective and behavioral traits such as those seen in ODD seems warranted. In this study, our objective was to develop a reliable and valid instrument to measure emotional regulation in children and youth using IRT—the current standard of test construction.
Method
Data and Measures
Our data came from a web-administered SNAP-IV 90-item rating scale site (www.adhdratingscales.com) managed by one of the authors (DD; Swanson, unpublished). Parents and teachers rated these scales after being referred to the site by 64 clinicians, 75% of whom were pediatricians. SNAP data from 3,374 children and youth were available for analysis. Previously, we factor analyzed the SNAP and found nine factors (Cavanagh, Quinn, Duncan, Graham, & Balbuena, 2014). The present study started with the factor representing emotional dysregulation. The 18 SNAP items loading on emotional dysregulation were loses temper; argues with adults; actively defies or refuses adult requests or rules; does things that annoy others; blames others for mistakes or misbehavior; touchy or easily annoyed; angry and resentful; spiteful or vindictive; quarrelsome; negative, defiant, disobedient, or hostile toward authority figures; uncooperative; acts smart; changes mood quickly and drastically; irritable; has excessive emotionality and attention-seeking behavior; unstable relationships with others; reactive mood; and impulsive. These items were originally rated on a 0 to 3 Likert-type scale anchored on the extremes: not at all and very much. The item responses were dichotomized, with 0/1 recoded as 0, and 2/3 recoded as 1, to be amenable to Rasch analysis.
Overview of Rasch Analysis
In contrast to classical psychometric techniques, Rasch analysis calibrates a scale by matching item difficulties with test-taker abilities. By analogy to educational testing, a difficult question is one that is correctly answered by few test-takers compared with an easy question, which is correctly answered by many. Conversely, a test-taker who answers more items correctly is of higher ability than another who gets fewer correct items. Without loss of generality, one can interpret “higher ability” in the context of personality as somebody who has “more” of the trait in question. This way, both item “difficulties” and respondent “abilities” (trait levels) are calibrated with respect to each other. More formally, Rasch analysis models a test-taker’s probability of endorsing a symptom as a logistic function of the difference in that person’s trait level and the item’s difficulty (Fayers & Machin, 2016). If the pattern of test-taker responses is then found to conform, within tolerance, to a staircase-like pattern (called a Guttman scale), then the count of symptoms in the scale suffices as a measure of the latent trait. In practice, this means that two children, each having a count of three symptoms, have the same level of emotional dysregulation regardless, of the particular symptoms endorsed.
Analytic Strategy
Our Rasch analysis consisted of six steps as depicted in Figure 1. First, we drew two random samples of 360 people who were matched for age, gender, reporter (parent or teacher) type, and raw score distribution. This was done because, in an overly large sample, small deviations can lead to an incorrect rejection of the hypothesis that the items fit a Guttman pattern—a Type 1 error (Martin-Lof, 1974). This situation is comparable with a t test in which a trivial difference becomes significant solely because of sample size (Friston, 2012). We followed the recommendation to have approximately 20 people per item (Linacre, 1994). Second, we fit a Rasch model in each subgroup and examined the mean-square infit statistic of each item. When the response pattern for a symptom fits the Rasch model, this statistic is close to 1 (Wright & Linacre, 1994). Each item’s mean-square infit value should be within the interval 0.89 to 1.11 given our sample size (Smith, Schumacker, & Bush, 1998). Items with infit mean squares outside this range were dropped. Third, we examined local independence. The Rasch model postulates that responses to the items should be uncorrelated after accounting for the latent trait. In practice, this meant that residual correlations be smaller than .2 and p values (adjusted for multiple comparisons using Holm’s method) be larger than .05. Fourth, differential item functioning (DIF) analysis was performed. The rationale for DIF analysis is to develop a measure that is invariant with respect to irrelevant characteristics such as gender or age. We tested for both uniform DIF (in which one group is more likely to endorse symptoms at all levels of emotion dysregulation) and nonuniform DIF (in which the difference in endorsement rates varies by level of emotional dysregulation). We used the Mantel–Haenszel and Breslow–Day tests to detect uniform and nonuniform DIF, respectively. An item with DIF is indicated by a significant p value of either test, following Penfield and Algina’s combined decision rule (Penfield & Algina, 2003). We set each individual item’s p value at .002 to account for multiple comparisons. Fifth, we verified that our final set of items had satisfactory reliability using person separation index (PSI) and Cronbach’s alpha as criteria. A PSI of .7 or greater indicates that the scale reliably distinguishes two groups of participants—that is, children with and without emotional regulation.
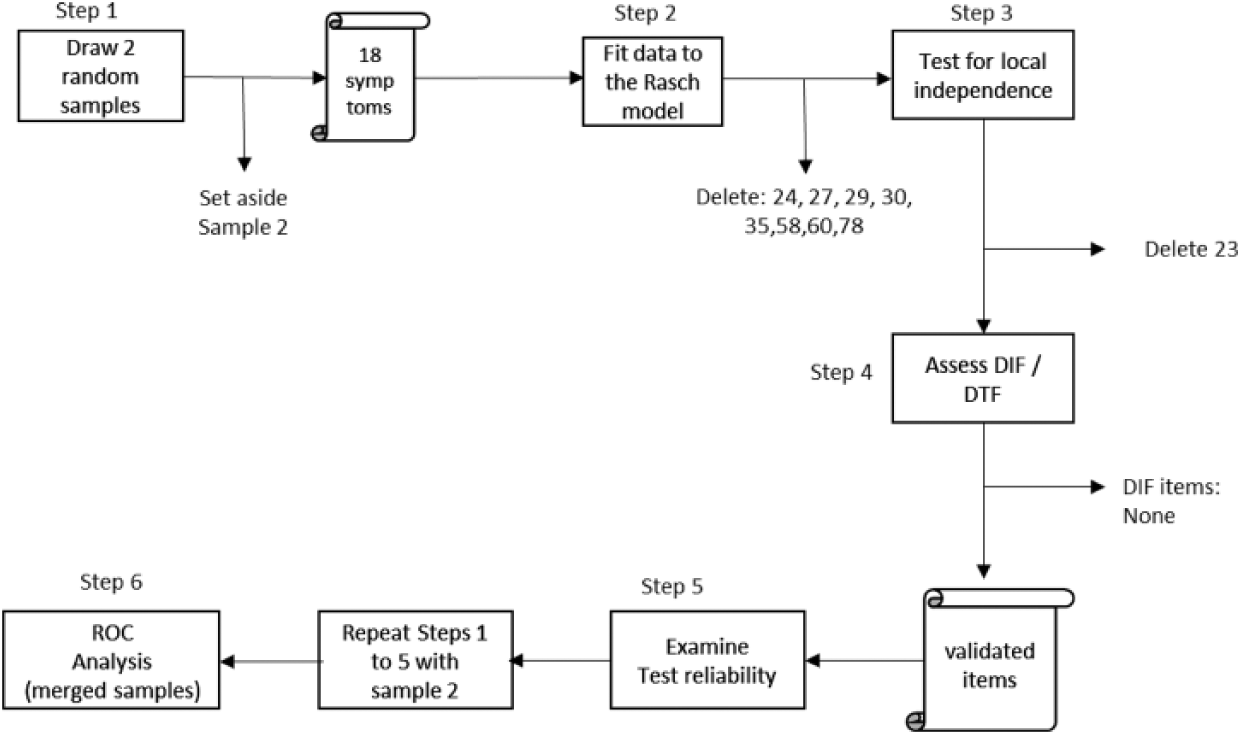
Schematic of analysis steps.
External Validation and Optimal Threshold
We compared the resulting scale with a validated psychometric instrument, the Conners’ Global Index for Emotional Lability (EL; Conners, 2014). Conners’ EL was our chosen criterion for two reasons. First, it provides normative data for emotional lability that takes into account the participant’s age, sex, and rater. Second, our emotional dysregulation scale shares common items with EL: easily frustrated, mood changes quickly, and temper outbursts. We used area under the receiver operating characteristic (ROC) curve analysis as a concordance measure, with EL as the criterion. For this purpose, we dichotomized EL into severe emotional lability (EL percentiles at 80 and above) and nonsevere emotional lability (EL percentiles < 80), as suggested in the Conners’ testing manual (Conners, 2014). We were interested in both the global performance of our scale and the particular score that maximizes accuracy. Global performance can be interpreted as the probability that a random participant with severe EL will have a higher score in our emotional dysregulation scale than a random participant without severe EL (Hanley & Mcneil, 1982). We selected the optimal threshold according to Liu’s criterion—the score that maximizes the product of sensitivity and specificity (Liu, 2012). In this last step, we pooled together our calibration and validation samples (n = 665). Fifty-five observations were dropped because they were outside the age range of EL norms.
Our study received ethics approval from the university’s behavioral ethics committee. All statistical analyses were performed in R using the TAM, sirt, and difR packages (Kiefer, Robitzsch, & Wu, 2016; Magis, Beland, Tuerlinckx, & De Boeck, 2010; R Core Team, 2015; Robitzsch, 2016). Area under the ROC curve analysis was calculated using Stata.
Results
The children and youth in our study were about 9 years of age, had about a 3 to 1 male-to-female and parent-to-teacher ratios. Children outnumbered youth by more than 4 to 1. The mean number of items endorsed was about eight out of 18. Our calibration and validation samples did not differ materially in these variables. See Table 1 for the breakdown of these characteristics by sample.
Comparison of Child and Youth Samples Used for Calibration and Validation.
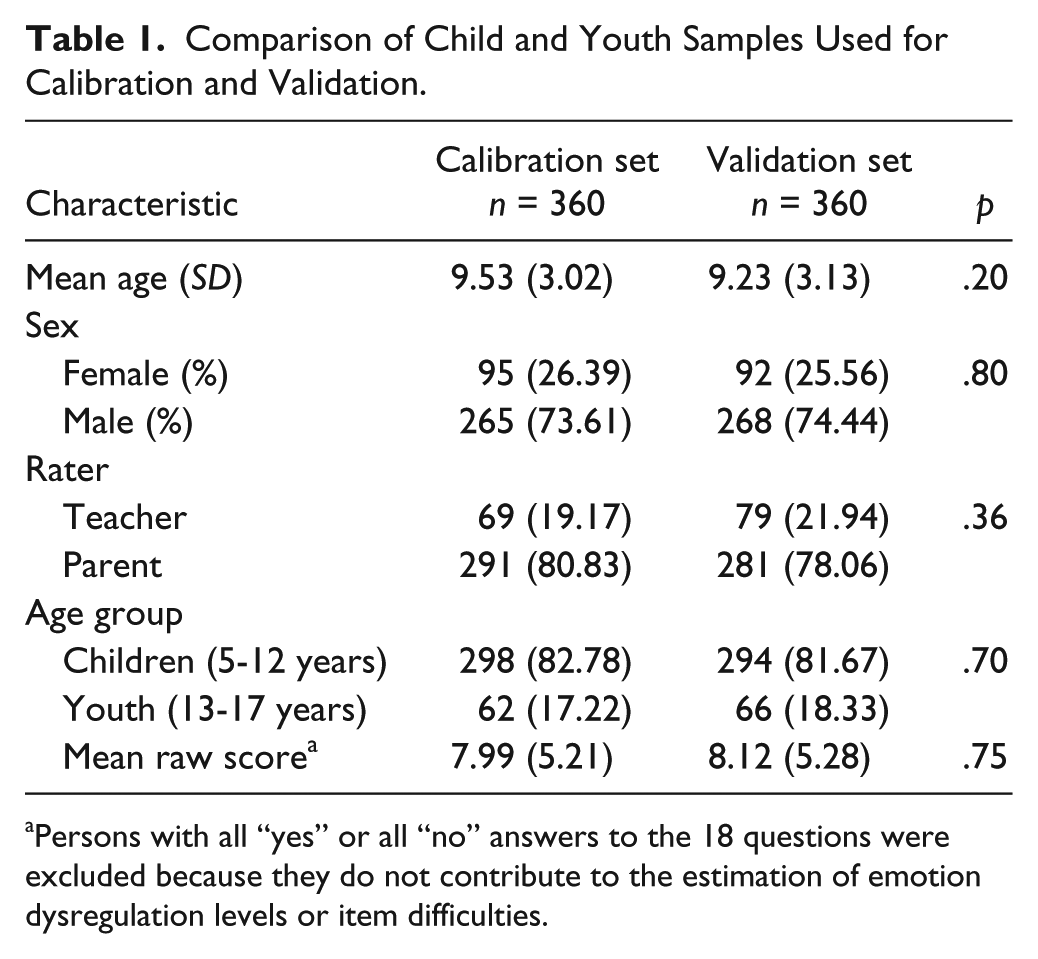
Persons with all “yes” or all “no” answers to the 18 questions were excluded because they do not contribute to the estimation of emotion dysregulation levels or item difficulties.
Our analysis showed that eight of the 18 items deviated significantly from a probabilistic Guttman pattern in the calibration sample. These items were “deliberately annoys others”; “angry and resentful”; “quarrelsome”; “negative, defiant, disobedient, or hostile to authority”; “acts smart”; “excessive emotionality and attention seeking”; “instability in relationships, reactive mood, impulsivity”; and “irritable, angry outbursts, difficulty concentrating.” When the analysis was repeated in the validation sample, the results were generally consistent, except for “blames others” and “quarrelsome,” which did not misfit. See Table 2. The eight misfitting items were eliminated.
Item Difficulties (in Logits) and Infit Mean Squares in the Calibration and Validation Data Sets From a Set of 18 Indicators of Emotional Dysregulation.
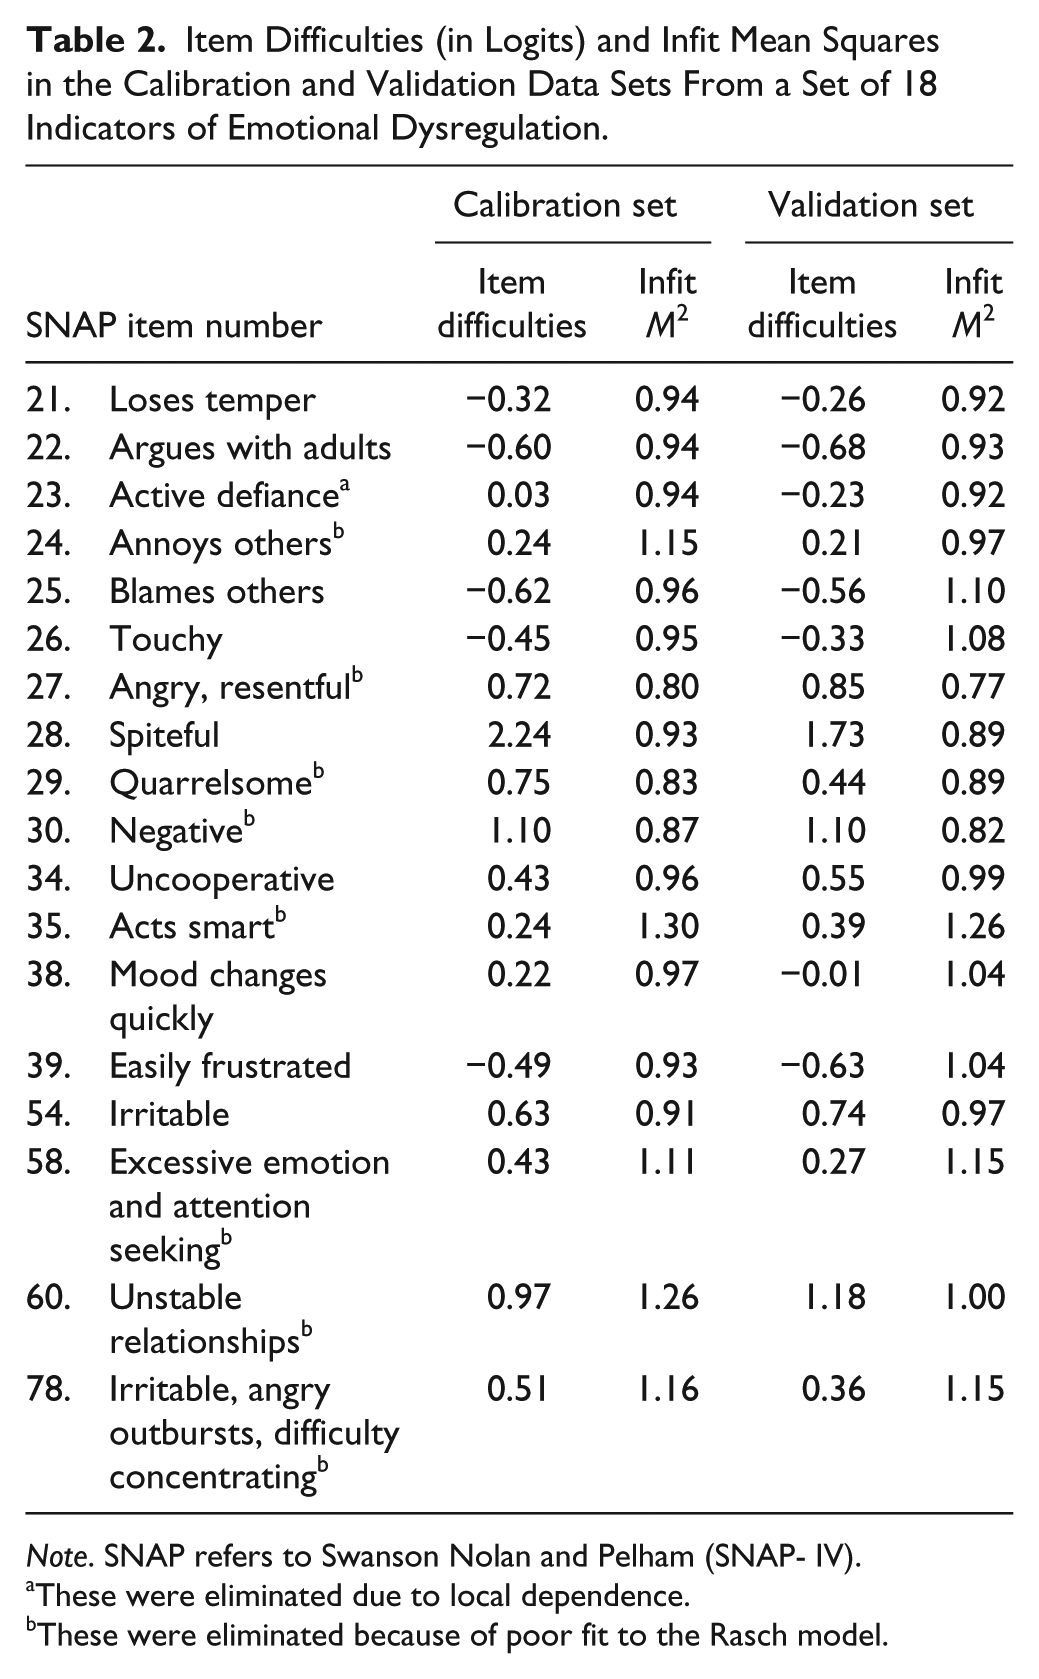
Note. SNAP refers to Swanson Nolan and Pelham (SNAP- IV).
These were eliminated due to local dependence.
These were eliminated because of poor fit to the Rasch model.
The remaining 10 items that satisfied a probabilistic Guttman pattern were then tested for local dependency. “Actively defies adult requests” had a greater than expected correlation with “argues with adults,” χ2 = 10.76, and with “uncooperative,” χ2 = 9.49, and was, therefore, eliminated. None of the remaining items violated local independence. When the analysis was repeated in the validation set, the largest residual correlation also involved “argues with adults” and “actively defies,” χ2 = 18.06. After eliminating “actively defies,” all residual correlations were less than .1 in magnitude. No item was identified as having uniform or nonuniform differentially functioning across respondent sex, rater type, or age category in the calibration sample. The same result was found in the validation sample. See Tables 3 to 5.
Uniform and Nonuniform DIF by Age Group: Children vs. Youth.
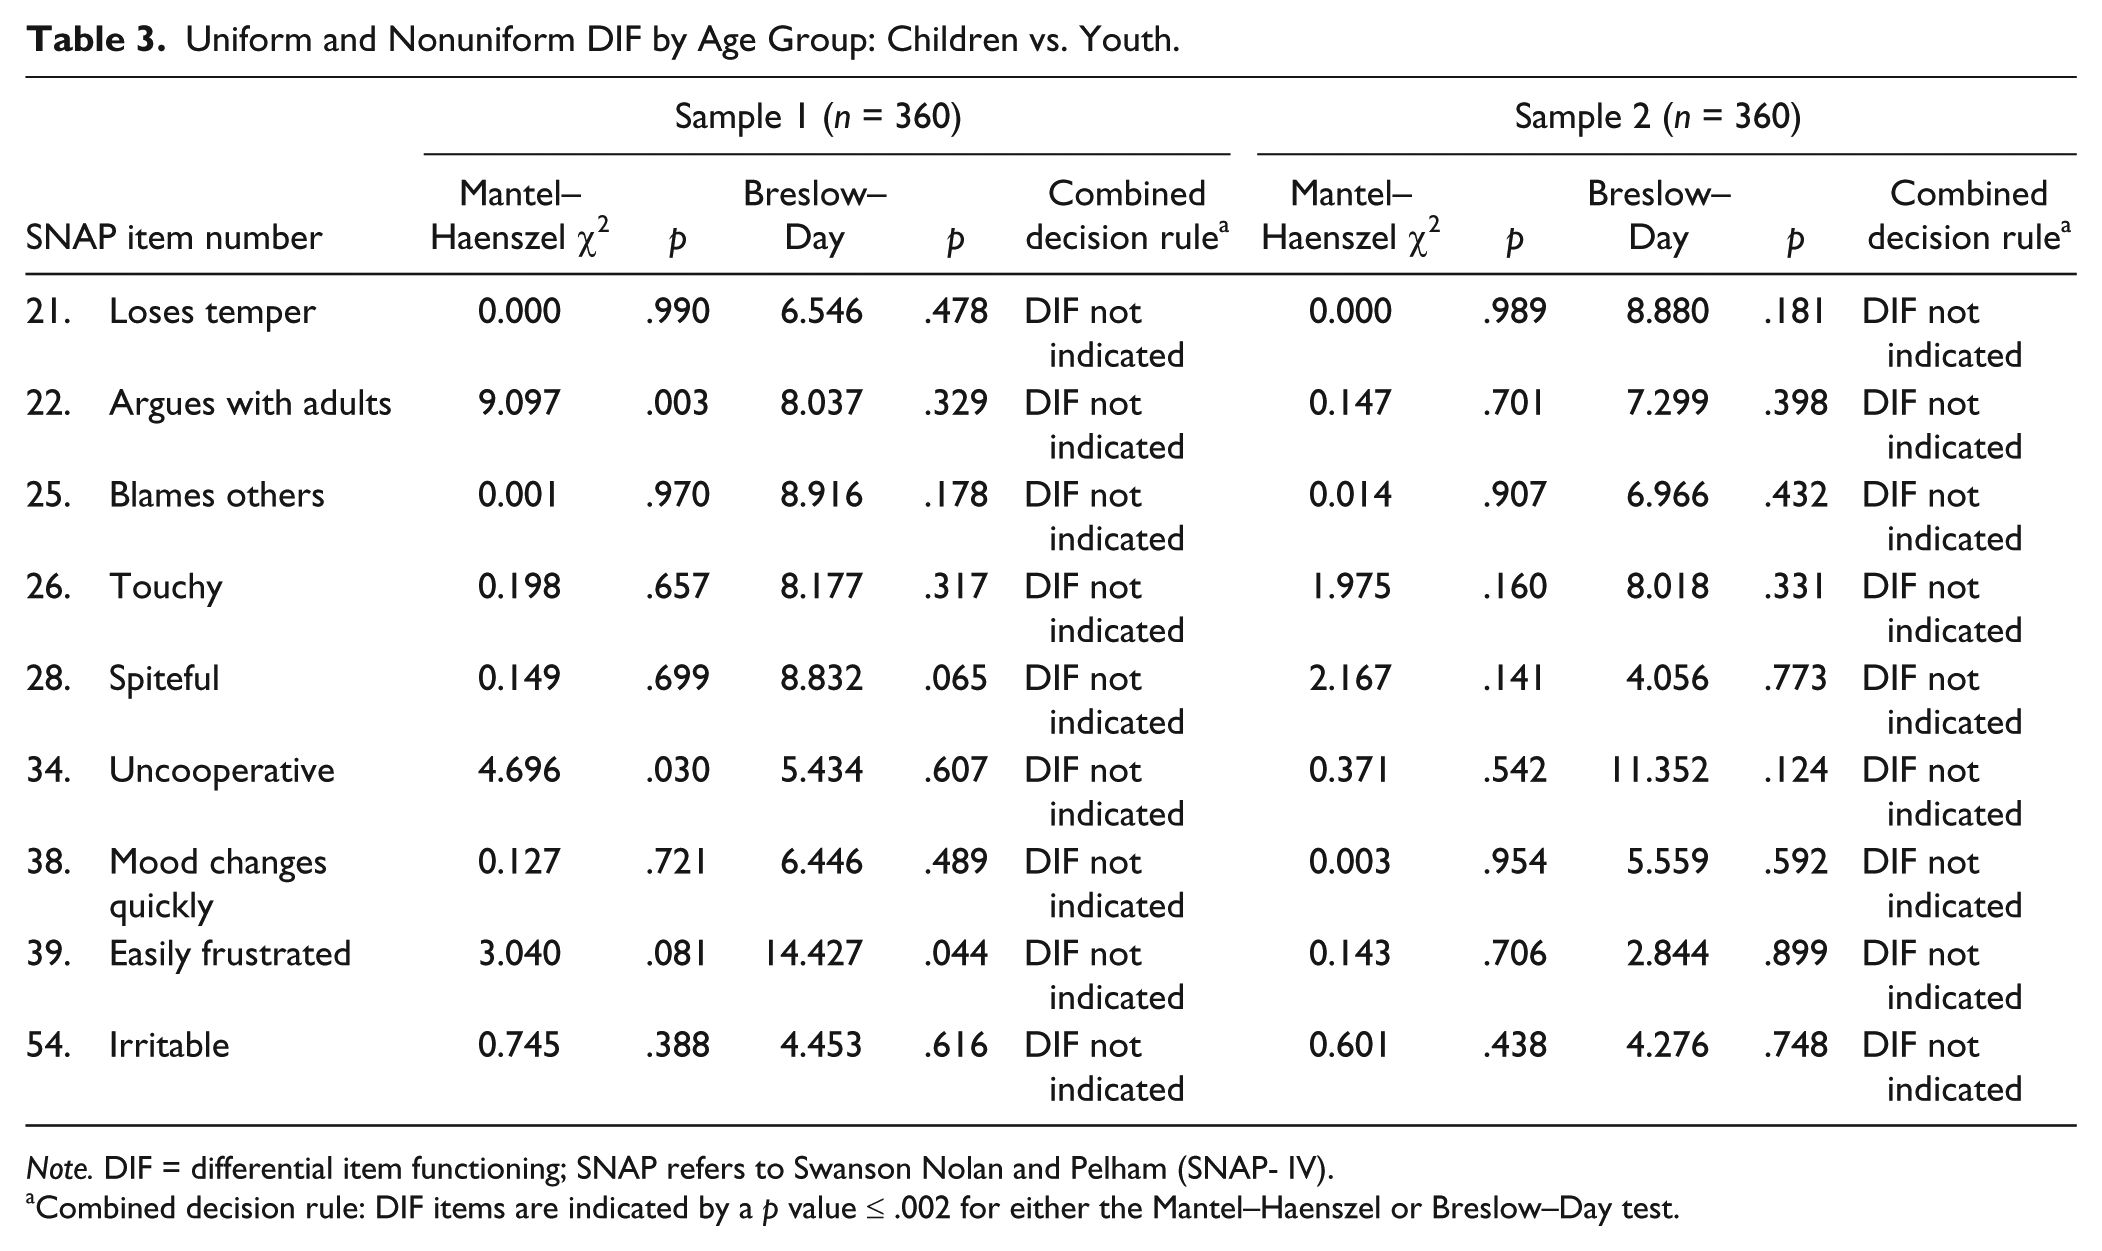
Note. DIF = differential item functioning; SNAP refers to Swanson Nolan and Pelham (SNAP- IV).
Combined decision rule: DIF items are indicated by a p value ≤ .002 for either the Mantel–Haenszel or Breslow–Day test.
DIF by Child Gender.
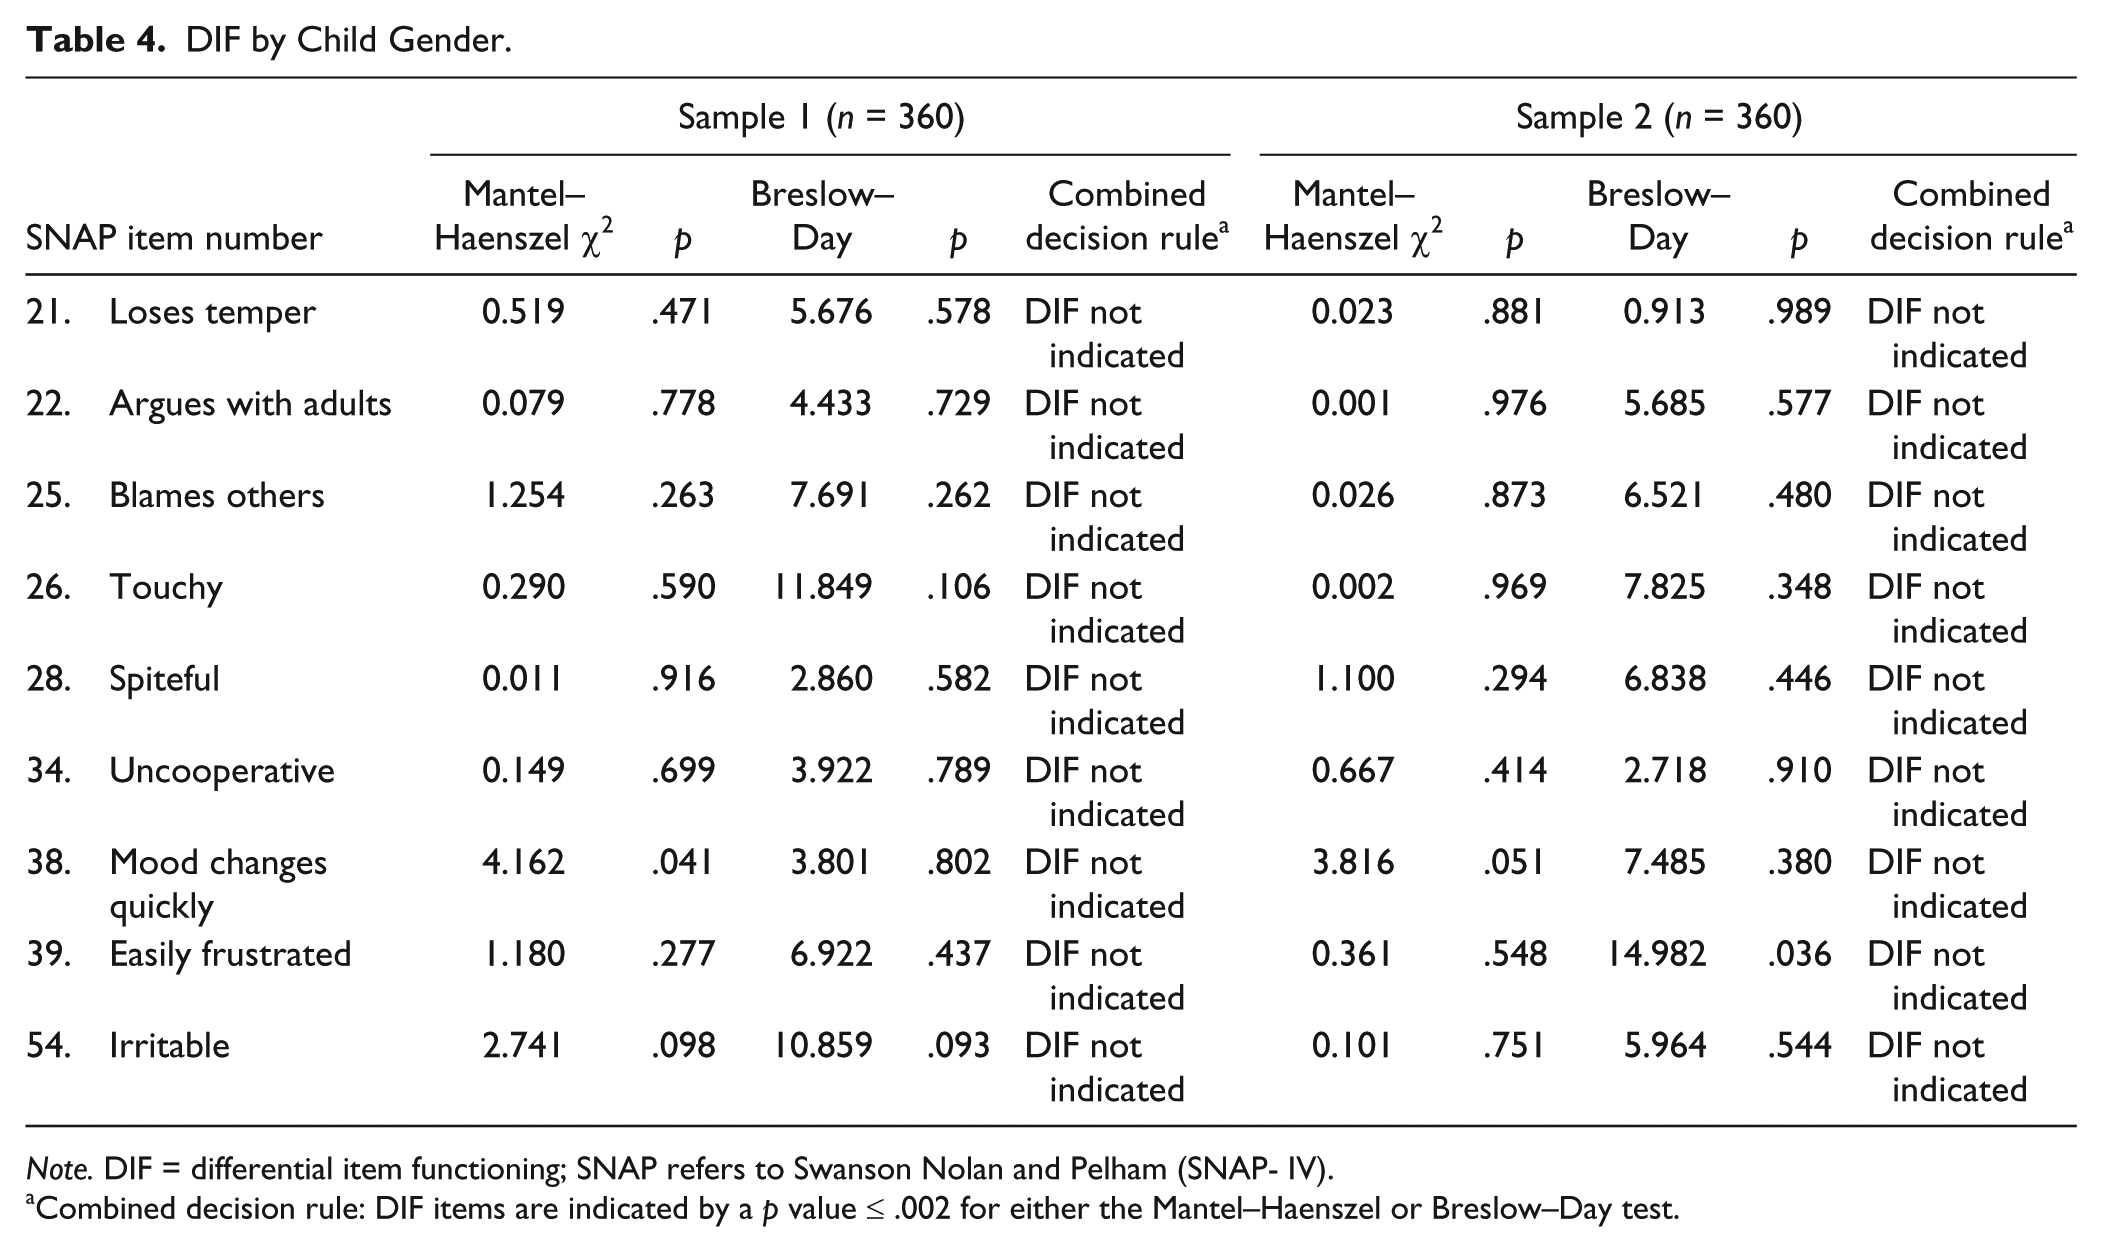
Note. DIF = differential item functioning; SNAP refers to Swanson Nolan and Pelham (SNAP- IV).
Combined decision rule: DIF items are indicated by a p value ≤ .002 for either the Mantel–Haenszel or Breslow–Day test.
DIF by Reporter: Parent vs. Teacher.
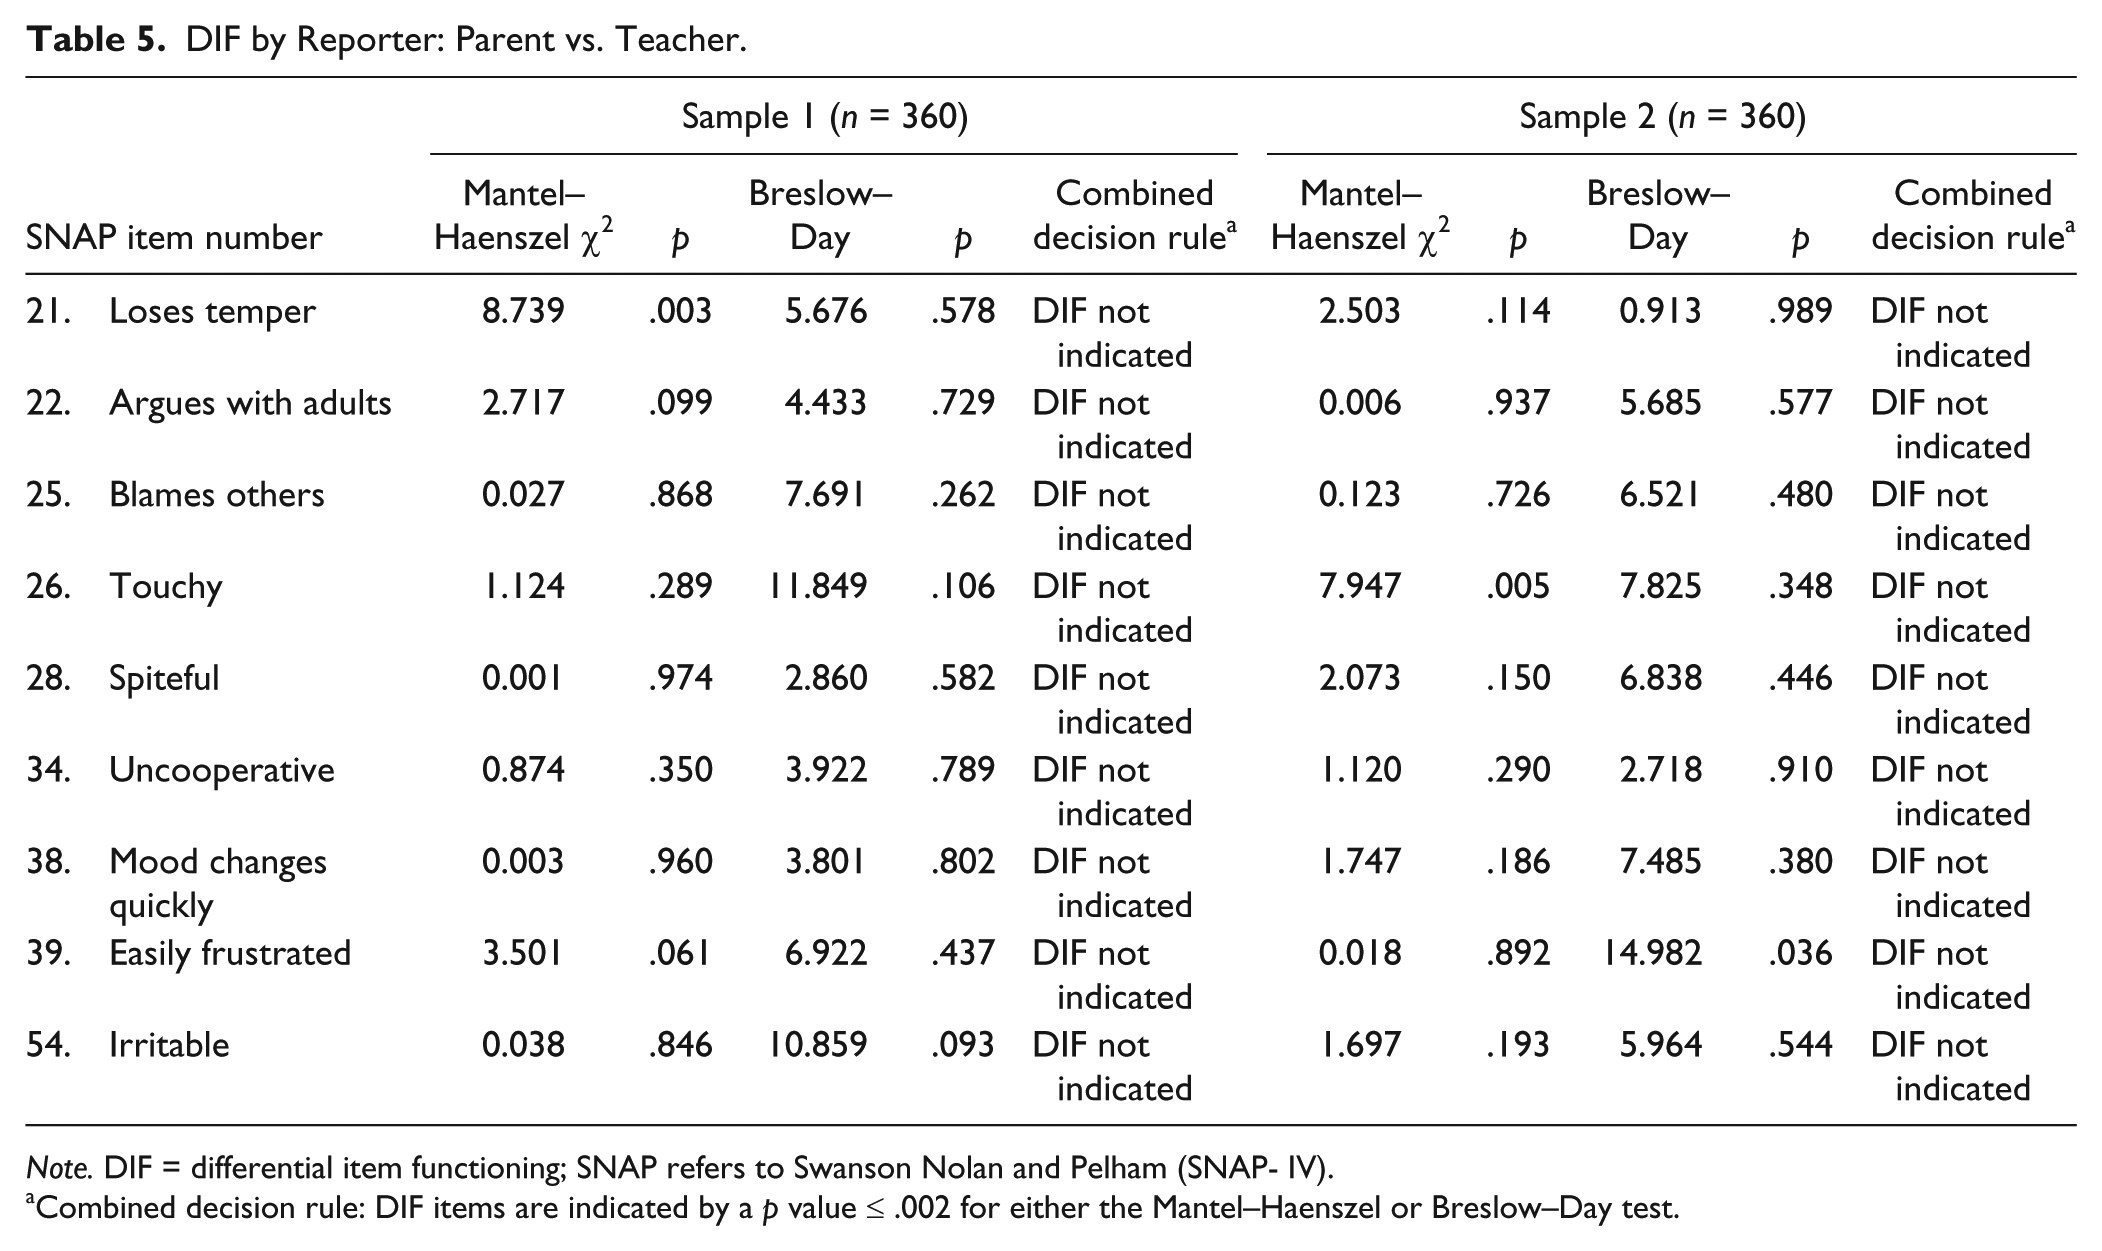
Note. DIF = differential item functioning; SNAP refers to Swanson Nolan and Pelham (SNAP- IV).
Combined decision rule: DIF items are indicated by a p value ≤ .002 for either the Mantel–Haenszel or Breslow–Day test.
Questions that combined multiple concepts (i.e., “negative, defiant, disobedient, or hostile toward authority figures”; “emotional, seeks attention”; “instability in relationships, reactive mood, and impulsivity”; and “irritable, angry, or difficulty concentrating”) were detected by Rasch analysis as problematic items. By contrast, statements with simple concepts (e.g., “uncooperative”) were less problematic. It is possible that multiple concept items are confusing to raters, leading to Rasch model violations.
The nine remaining items, which constitute the Clinical Evaluation of Emotional Regulation–9 (CEER-9), had satisfactory PSIs of 0.72 in the calibration sample and 0.70 in the validation sample, indicating that the scale adequately distinguishes a group of children with and without emotional dysregulation. The Cronbach’s alphas of the nine retained items were .83 and .80 in the calibration and validation samples, respectively. Using the Conners’ EL as the criterion, the area under the ROC curve for our nine-item scale was 0.87. The threshold score that maximized accuracy was 4. The area under the ROC curve for a score of 4 is 0.81. See Table 6 for the sensitivity and specificity at each of the 10 cut points.
Classification Accuracy of the Emotional Dysregulation Scale at Various Cut Points With Conners’ EL 80th Percentile as the Criterion.
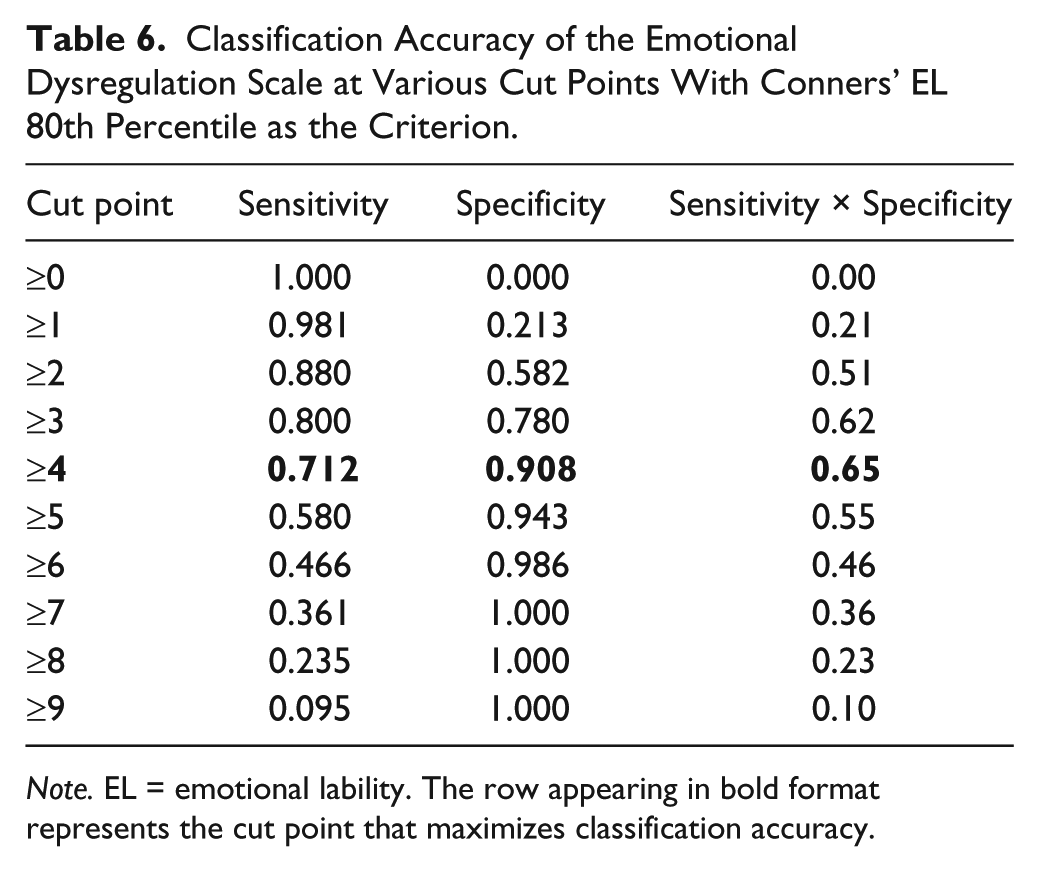
Note. EL = emotional lability. The row appearing in bold format represents the cut point that maximizes classification accuracy.
To further compare the performance of the Conners’ EL and CEER-9, we calculated the rates of emotional dysregulation in children and youth with ADHD. Rates of emotional dysregulation in ADHD inattentive, hyperactive, and combined types were 63%, 79%, and 88%, using the Conners’ EL as compared with 42%, 56%, and 71% using CEER-9.
Discussion
Using a calibration and validation sample from a large data set of clinically referred children and youth, nine items satisfied Rasch model requirements, had adequate reliability, and was concordant with an external criterion. This subset of items total score reflects the level of emotional regulation. Having satisfied the Rasch model, there is no need for weighting the symptoms. As such, unlike previous scales, such as the Conners’, it is simple to score, and it does not require the use of a table that is separated by age, rater, and gender. The present study showed that emotional regulation in children and youth can be measured using nine items derived from the SNAP-90 scale, called the CEER-9.
It is striking that the CEER-9 retains five items from ODD, the two core symptoms of DMDD, and two symptoms from the Conners’ emotional lability index. Please refer to Table 7. Uncooperative and easily frustrated do not appear in the other three measures. Although DSM-5 (APA, 2013) recommends that children who meet both the criteria for ODD and DMDD be given the single DMDD diagnosis, the present work seems to provide support for previous experts who questioned whether ODD and DMDD require separate categories (Lochman et al., 2015; Meyers et al., 2017). The CEER-9 would allow diagnosis to move toward a more empirically based grouping of symptoms that possibly stems from the same underlying process (Lochman et al., 2015).
List of CEER-9 Symptoms Shared With ODD, DMDD, and Conners’ EL.
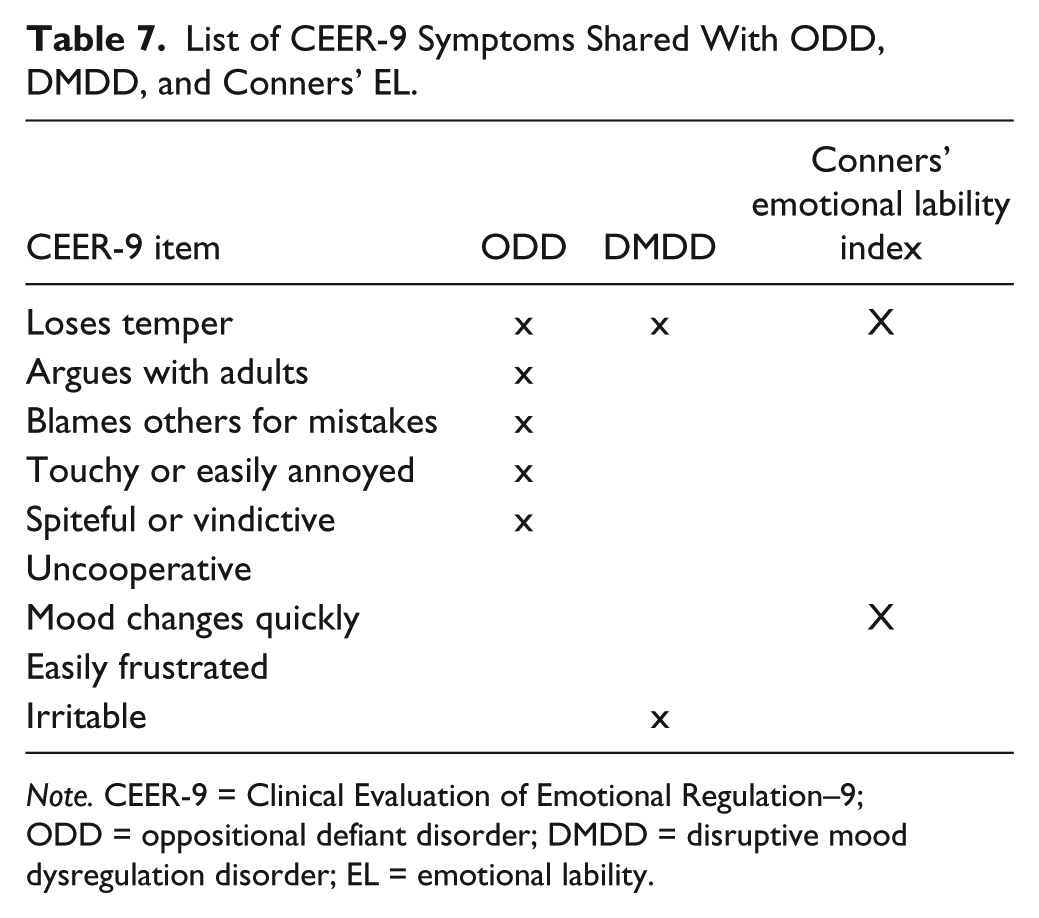
Note. CEER-9 = Clinical Evaluation of Emotional Regulation–9; ODD = oppositional defiant disorder; DMDD = disruptive mood dysregulation disorder; EL = emotional lability.
The grouping of items in the CEER-9 suggests that externalized emotions, mood swings, being susceptible to perceived annoyances, and subtle noncooperation are all facets of emotional dysregulation. In this regard, the CEER list of items is different from the PROMIS Pediatric Anger Scale, which is made up exclusively of externalized anger. That mood swings is also part of the final scale suggests that the boundaries between ADHD, ODD, DMDD, and child/youth bipolar disorder categories are porous. The overlap in symptoms possibly reflects the shared underlying neural circuitry across disorders (Brotman et al., 2010; P. Shaw, Stringaris, Nigg, & Leibenluft, 2014). Accordingly, more severe emotional lability is associated with more severe presentations of ADHD and ODD (Sobanski et al., 2010).
As with all studies, the present one has several limitations. Parent- and teacher-rated scales assume that they are accurate judges of child dispositions and behaviors. Outward displays such as “losing temper” are more easily observable but “quick changes in mood” and “being spiteful” are subjective. The SNAP-IV 90-item rating scale has parent-, teacher-, and youth-rated versions. Due to a low number of youth respondents, we were unable to include youth-rated SNAPs in our study. It would be important to examine whether the same SNAP items composing the CEER are a valid measure of emotional regulation in youth. Finally, our list of symptoms and their wording were taken from the SNAP-90. It is likely that there are other symptoms or alternate wordings that serve the same purpose.
The development of a reliable, valid, evidence-based scale dedicated to measuring emotional dysregulation, unaffected by characteristics such as age and gender, and rater, is needed for clinical work and research. CEER-9 serves as a tool for quantifying the prevalence of emotional dysregulation in children and youth. Recently, irritability scales have been developed and validated for women (Born, Koren, Lin, & Steiner, 2008) and adults (Craig, Hietanen, Markova, & Berrios, 2008), including one using IRT (Holtzman, O’Connor, Barata, & Stewart, 2015). CEER-9 will allow researchers to better understand the developmental course of emotional regulation. Because the experience and expression of emotions vary across the life span, it would be fruitful for future work to examine whether the questions in CEER might apply to older adults as well, including those with neurocognitive disorders. Used in the context of prospective follow-up studies, the CEER-9 could be used to analyze whether adult psychiatric conditions such as, but not limited to, mood and anxiety disorders might have their origins in childhood irritability. The CEER-9 could also be used as a developmental milestone, enabling the study of genetic and environmental precursors of childhood emotional dysregulation. When used together with neuroimaging data, CEER-9 could help establish the structural and functional bases of emotional dysregulation. Finally, having a reliable and valid instrument enables the study of pre- and post- measurements of patient response to pharmacological and nonpharmacological treatments.
Conclusion
This study reports a nine-item rating scale, the CEER-9, which can be used as an observer-reported rating scale developed in children and youth, whose sum total is a measure of emotional regulation, with a score of 4 or more out of 9 indicating current emotional dysregulation. This scale has good psychometric properties, performing similarly by child sex, age group, and parent or teacher reporter, and has satisfactory PSI and good internal and external validity. As emotional dysregulation is common, present across the life span, associated with many psychiatric and medical disorders, and independently contributes to significant morbidity and mortality, the CEER-9 would be valuable in clinical practice and research applications in many areas of psychiatry and health care.
Footnotes
Acknowledgements
Special thanks to Dr. Rudy Bowen for his thoughtful comments on an earlier version of this work, Professor Alan Tennant for providing guidance in Rasch Analysis, and the children and adolescents, their parents, and teachers for completing the rating scales.
Declaration of Conflicting Interests
The author(s) declared the following potential conflicts of interest with respect to the research, authorship, and/or publication of this article: Dr. Quinn is a consultant for Eli-Lilly, Shire, Janssen, Purdue, and Highland Therapeutics. Dr. Duncan is on the advisory boards and speaker bureaus of Shire, Janssen, and Purdue.
Funding
The author(s) received no financial support for the research, authorship, and/or publication of this article.
Author Biographies
![]() .
.