
Abstract
The Common Core State Standards for English Language Arts (CCSS/ELA) focus on building student capacity to read complex texts. The Standards provide an explicit text complexity staircase that maps text levels to grade levels. Furthermore, the Standards articulate a rationale to accelerate text levels across grades to ensure students are able to read texts in college and the workplace on high school graduation. This study empirically examined how third graders at two reading proficiency levels performed with texts of differing degrees of complexity identified as the Grades 2 to 3 band within the CCSS. The study also investigated the influence on comprehension of two text lengths. Results suggest that the compounding effects of text complexity and length uniformly affected reading proficiency of third graders. Typically, when presented with two texts of the same complexity level, readers had lower comprehension in the lengthier version of the text than the shorter version. Features of the single level where performances on texts of different lengths were not statistically significant are described, as are implications for educational practice and future research.
The focus of this study is on how text complexity and length interact to impact the comprehension of third graders, both those at- or above-grade level and those below-grade level on their state assessment. The texts in the study represented three levels of complexity—the low, middle, and high ends—of the Grades 2 to 3 band identified within the Common Core State Standards’ (National Governors Association (NGA) Center for Best Practices & Council of Chief State School Officers [CCSSO], 2010b) staircase of text complexity (see Figure 1). The text lengths represented those of norm-referenced tests and those on the new generation of Common Core assessments (Wixson, 2013).
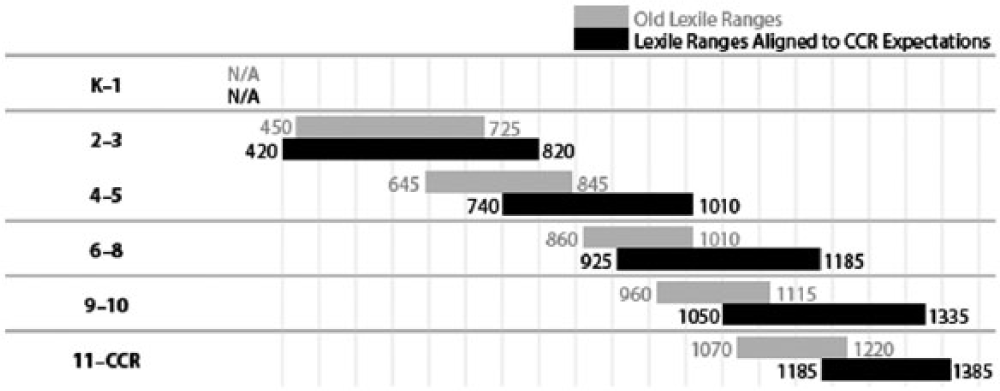
CCSS text complexity staircase.
The impetus for this study lies with both the recommendations of CCSS on text complexity and length specifications of two CCSS testing consortia (i.e., Smarter Balanced Assessment Consortium (SBAC) and Partnership for Readiness for College and Careers (PARCC). CCSS writers, believing that complexity of texts in schools has decreased over the past 50 years, identified a staircase of text complexity in which text levels are accelerated, beginning at the Grades 2 to 3 band and continuing through Grades 11 to College and Career Ready (CCR). The text levels recommended for different grades have been accelerated considerably and, as Figure 1 shows, the two to three band reaches up to levels of fifth grade or higher. Further evidence of the foregrounding of quantitative measurement by CCSS developers is their commission and participation in a study (Nelson, Perfetti, Liben, & Liben, 2012) that has become the basis for the only supplement to the CCSS to date (NGA Center for Best Practices & CCSSO, 2012a). This supplement, titled New Research on Text Complexity, translates the staircase of text complexity into five readability systems as well as Lexile levels. Although text length is not mentioned in the CCSS document, it is addressed in tests currently being developed by SBAC and PARCC (Wixson, 2013). Perhaps to better match National Assessment of Educational Progress (NAEP) passage lengths, both SBAC and PARCC specified text lengths ranging well above 100 to 300 word lengths typical of popular reading assessments and state tests (National Assessment Governing Board, 2010). As an almost hidden feature of the new CCSS-aligned assessments, text length surreptitiously enters the pictures. In the face of massive policy decisions based on the CCSS’s perspective on text complexity and length, there is an urgent need for research on how students respond to text levels and lengths designated in the staircase and specified in the PARCC and SBAC assessments.
Text is inarguably a key component of a reading interaction, as recognized in models of reading (e.g., Snow, 2002). Recognition of the importance of this variable is evident in numerous lines of research on text, such as texts in disciplinary learning (Alexander & Jetton, 2000; Moje, Stockdill, Kim, & Kim, 2011), text structure (Goldman & Rakestraw, 2000; Meyer & Rice, 1984), and genres and styles of children’s literature (Galda, Ash, & Cullinan, 2000). Nonetheless, theory and research on elements that contribute to text complexity suggest that addressing readers’ developmental and proficiency levels is also important even though frequently under researched (see Mesmer, Cunningham, & Hiebert, 2012). Information is needed to understand the degree to which third-grade readers respond to various text features because they are transitioning developmentally beyond learning-to-read years and because U.S. policy has established third grade as a benchmark year. Furthermore, information is needed to understand how students not at expected levels of proficiency might respond to these features.
The current study is a response to the need for an evidence base for practices and policies on appropriate text levels and lengths for students of different proficiencies across grades. In particular, this study examines the manner in which students at a critical point in reading development perform on texts of different complexity levels and lengths. The review of research that follows provides background for the choices in the design of this study, specifically (a) text complexity levels, (b) text length, and (c) developmental level.
Text Complexity
A study of how varying levels of text complexity affect students’ comprehension requires a choice about how to assess text complexity. As mentioned, CCSS writers identified a tripartite model for capturing text complexity—quantitative, qualitative, and reader-task. Furthermore, as discussed previously, quantitative measurement has been in the foreground within both the CCSS development process and dissemination and implementation phases. What may not be immediately apparent without directly analyzing language of Standard 1—the standard that targets increasing capacity with complex text—is how much the CCSS quantitative levels are emphasized and how much they prescribe rather than suggest text levels at different grades. Consider the descriptions for the reading of both literature and informational texts in Standard 10 at the end of Grades 2 and 3. For Grade 2, the Standard states: “By the end of the year, read and comprehend [literature/informational text] in the grades 2–3 text complexity band proficiently, with scaffolding as needed at the high end of the range.” At Grade 3, full competence with the top of the grade band is specified: “By the end of year, read and comprehend . . . at the high end of the grades 2-3 complexity band independently and proficiently” (NGA Center for Best Practices & CCSSO, 2010a, pp. 13-14). The quantitative levels are clearly foundational; at no point in the Standards are qualitative features of texts at different points within grade bands identified.
Because of the role of the Lexile Framework in the original specification of the grade bands and its use in the NAEP and numerous state assessments, the Lexile Framework was used to establish text complexity in this study. This choice is not an endorsement of the Lexile Framework; in Appendix A of the CCSS, six different text difficulty tools are used (National Governor’s Association Center for Best Practices & Council of Child State School Officers, 2010b). However, in that many educators will be choosing texts on the basis of this framework and assessments will be framed in terms of it, educators need information on how students perform on the newly accelerated levels for a grade band using the Lexile Framework. Thus, using the Lexile Framework for this study addresses both practical and methodological considerations within a specific policy environment.
Description of the Lexile Framework
Similar to many previous readability systems (Klare, 1984), the Lexile Framework establishes the level of a text using an algorithm of syntactic and semantic measures. The syntactic measure is straightforward, the mean sentence length (MSL) of a sample of sentences from a text. The semantic component—the Mean Log Word Frequency (MLWF)—is based on the frequencies of individual words in text samples using their rankings within the MetaMetrics database. The MLWF was first calculated with the five million words identified by Carroll, Davies, and Richman (1971) in their analysis of Grade 3 through 9 schoolbooks and has since grown to more than a billion total words (A. J. Stenner, personal communication, April 15, 2010). Word frequency estimates the degree to which readers might have been previously exposed to a word’s orthography and meaning.
The framework uses Lexiles rather than grade levels as a unit of expressing the difficulty of a text (i.e., 420L, 440L), what the CCSS writers call text complexity. Specifically, one Lexile is “1000th of the difference between the comprehensibility of the primers and the comprehensibility of the encyclopedia” (Stenner, Burdick, Sanford, & Burdick, 2007, p. 6). Stenner et al. liken the Lexile Scale to a Temperature or Shoe Scale where every point represents equivalent increase in temperature and/or foot length. That is, each point on the scale is seen as equivalent in describing and/or measuring comprehension. This perspective, at least our review of Alvermann, Unrau, & Ruddell (2013) does not jibe with any current models of reading comprehension. Despite an apparent misalignment between the Lexile Framework and current models of comprehension, research based on Lexiles was prominent within the Standards and provided the following: (a) levels of acceleration for the staircase of text complexity shown in Figure 1 (Williamson, 2006, 2008); (b) evidence for the gap between high school and college texts (Stenner, Koons, & Swartz, 2010); (c) the sole parameters of the original staircase of text complexity; and (d) one of the six sets of parameters for the revised staircase of text complexity.
Text Length
Text complexity is not the only aspect of text where demands have increased within the CCSS. A feature of the assessment task, the length of texts, also increased in the CCSS-era, at least on tasks being developed by the two consortia, SBAC and PARCC. The specifications of the SBAC assessment call for third graders to read texts that average 650 words in length, whereas those for the PARCC assessment call for texts that range from 200 to 800 words (Wixson, 2013). Contrast this with a long-standing norm-referenced assessment, the Gates-MacGinitie (MacGinitie, MacGinitie, Maria, Dreyer, & Hughes, 2007), where average passage lengths for third graders are 95 words.
The effects of text length received very little attention in theoretical frameworks of reading comprehension, but several explanations can be offered as to why text length should be considered as a critical variable in understanding students’ performances with complex texts. First, as the length of a text increases, demands on memory may increase. New information as well as connections to prior knowledge needs to be negotiated and kept in mind. The longer a text, the more potential information readers need to monitor and integrate. Second, the length of texts in tasks may also be a factor for readers of different proficiency levels. For highly proficient readers, length of text may not be a factor but less proficient readers may find it increasingly more challenging to sustain attention and comprehension as texts become longer (Pekrun, Goetz, Titz, & Perry, 2002).
Research on the relationship of text length, task length, and reading performance is scant but findings from several studies suggest that text length merits additional consideration in efforts to gauge students’ performances with complex texts. First, descriptive data related to texts used in guided reading systems such as Reading Recovery (RR) suggest that, from the perspective of experienced clinicians, text length is a factor with beginning and struggling readers. Cunningham et al. (2005) found that the number of words in texts was the only variable that predicted level of text on the RR text gradient, a finding corroborated by Hatcher (2000).
Several exploratory studies suggest text length can be a factor that influences readers’ comprehension in elementary grades. For example, in an examination of possible explanations for substantial discrepancies between fourth graders’ performances on a state assessment and the NAEP, analyses showed that the two assessments were similar on measures of text complexity such as Lexiles and word-frequency profiles but they differed substantially in text lengths (Calfee & Hiebert, 2012). The NAEP passages on which students in the state did poorly ranged from 800 to 1,000 words, whereas passages on the state assessment where student performances were higher ranged from 350 to 400 words.
In a study of fourth graders’ performances at different points in a reading assessment, Hiebert, Wilson, and Trainin (2010) found that students in the two lower quartiles performed with reasonable rates (and satisfactory comprehension) on the beginning portions of the assessment. However, on subsequent parts, students in the two lower quartiles showed increased rates of reading but lower comprehension scores.
In sum, research on text length, although limited in scope, is sufficiently suggestive to warrant further attention to this variable. In this study, we used texts similar to those used in norm-referenced assessments and those with parameters of the new assessments.
Developmental and Proficiency Levels
The developmental and proficiency levels of readers are another consideration in understanding the effects of text complexity and text length. Chall’s (1983) stages of reading represent one of the few attempts to generate a framework of developmental stages from beginning reading through CCR. Chall identified six stages covering the period from beginning reading to post-graduate reading. The six stages began with Stage 0 (K), which Chall viewed to precede formal reading instruction. The next five stages were associated with school instruction and moved from a heavy emphasis on decoding (Stage 1), fluency (Stage 2), new text types (Stage 3), increasing viewpoints (Stage 4), and analytic, creative, and critical reading (Stage 5). Developmentally, third graders are transitioning into a stage dominated by comprehension of dense, content-rich texts and narrative texts that are organized into chapters and considerably longer than typical picture books. Failure to handle identified text complexities and lengths in Grade 3 will signal subsequent struggles into secondary school.
Important developmental transitions taking place in third grade are reflected in a variety of educational policies that mandate specific levels of reading proficiency. In fact, reading proficiency at third grade has taken on a gatekeeping function second only to high school graduation requirements in determining school progress. Beginning with Goals 2000 (U.S. Congress, 1994), reading levels at third grade have been a focus among policy makers. At present, 14 states have policies mandating or strongly recommending that schools hold back students who cannot read well as measured by state tests (Layton, 2013; National Conference of State Legislators, 2014; Robelen, 2012). Thus, proficiency level, measured by meeting a state’s third-grade reading test, is clearly a critical variable to consider in understanding how text complexity and length affect readers’ comprehension. In the current study, proficiency level was varied but developmental level was not.
There has been clinical work to establish how to address the text needs of readers at various levels of development and proficiency. Essentially, clinicians have theorized that readers should be able to recognize and understand a certain proportion of the words in text. Betts (1946) hypothesized that particular ratios of known to unknown vocabulary were needed depending on the level of support available to the reader (i.e., independent or instructional). Clay (1985), working with beginning readers, identified 90% as an appropriate level for recognizing words, within a one-on-one tutoring model. Indeed, the presence of unknown words in texts influences the proficiency with which beginning and struggling readers comprehend texts (Clifford, 1978; Hall, 1954), but the rate of new vocabulary relative to known vocabulary appropriate for readers at different developmental levels and, within those levels, for students with different proficiency levels has not been the focus of systematic research and theory (Halladay, 2012; Powell, 1970).
There is only a small group of studies on how students at particular grade levels and of different proficiency levels comprehend texts at varying levels of complexity and, within these studies the discrepancy between students’ reading levels and the difficulty levels of texts is often ill-defined. For example, the Morgan, Wilcox, and Eldredge (2000) study that has been cited as evidence that students’ achievement can be improved with more challenging texts (Shanahan, 2013) did not use a uniform measure for establishing text complexity. When we reanalyzed a representative sample of texts read by each of the three groups, the results showed that the average Lexile for the on-grade group (i.e., the group that was not receiving challenging text) was higher than that for the two-grades-above group: 443L for the former and 397L for the latter. Conclusions from Stahl and Heubach (2005) that all readers benefit from challenging texts (e.g., Snow, Burns, & Griffin, 2005) fail to take into account the context of reading and also the entry level of readers. In the Stahl and Heubach study, an accuracy level of 85% was appropriate for the first reading of a text for students who began second grade at a primer reading level and received considerable instructional support in subsequent readings of the text. But students who read texts with 85% accuracy after instruction did not attain grade-level status at the end of the year. Essentially, conclusions about text complexity are being drawn based on very limited evidence.
Despite questionable guidance from the literature, CCSS developers accelerated text complexity levels at the end of the third grade to account for a text gap identified between high school– and college-level texts (Stenner et al., 2010). Data in Figure 1 show that 60% of growth in reading is to have been attained by the end of the third grade, even though this level represents 31% of students’ school careers. Over the subsequent eight grades, the acceleration of text levels is less—an average of 63L per grade, rather than the 95L increase for each of the Grades K to 3. New standards for text complexity where reading levels are increased at third grade and new specifications for text length have potential consequences for students, especially for the most vulnerable readers.
Overview of the Study
The purpose of our study was twofold: (a) to examine ways in which text length and text complexity interacted; and (b) to explore how third graders with differing reading proficiency levels handled texts. As described in detail subsequently, the study used a repeated measures design with two within-subjects (i.e., text complexity, text length) and one between-subjects variable (i.e., reader proficiency level). The following specific questions guided the study:
What is the influence of text length (200 vs. 1,000 words) on the comprehension and reading rate of third graders of two different proficiency levels?
What is the influence of text complexity level (400L, 600L, and 800L) on the comprehension and reading rates of third graders of two different proficiency levels?
Do text length and text complexity interact to influence comprehension and reading rates of third graders with different proficiency levels?
Method
Sample
A convenience sample of 39 students enrolled in summer school participated in this study. All participants had completed third grade and were at a point at which their reading levels could be appropriately compared with levels of attainment expected at the higher ranges of the CCSS for English Language Arts (CCSS/ELA) text staircase (see Figure 1). That is, third-grade completers should be reading at the higher end of the two to three grade band. The sample of participants was selected from a summer school population for two reasons. First, the study design required that their status on the Grade 3 state test be identified and this information was not available until early June. Second, text difficulties on the CCSS/ELA grade band assumed completion of Grade 3 and thus we needed to ensure that participants had completed this grade so as not to bias results. Participants attended summer school with other students who had completed Grades K to 5 and each summer school student was placed in one of two summer school programs: (a) remedial, for students who had not attained state-standards goals and (b) enrichment, for students who had attained the state-standards goals. In keeping with the latest research regarding economically disadvantaged students and summer reading setbacks, the school division in which the students were enrolled did not use summer school as a purely remedial program (Allington et al., 2010). Thus, the sample did not contain an imbalance of students reading below level and the program feature permitted the type of comparisons required by this study.
This sample was selected from an elementary school within a city school system in a southern state consisting of more than 10,000 students. The school served 588 students in Grades K to 5, 84% of whom were eligible for free or reduced priced lunch. About 72% of students in the school were African American, 10% were Hispanic, 15% were White, and the remaining 3% Asian. Sixty-two percent of participants were male and 38% were female, with 83% being African American, and 17% Hispanic.
The between-subjects variable (i.e., reader proficiency, on/above- vs. below-level) was determined by third-grade performance on the state reading test (i.e., passing vs. not passing) the spring immediately before summer in which the data were collected. Forty-three percent of participants were functioning below level and had not passed the state test; 57% were functioning on/above-level. In this school 77% of students passed the state reading state test, a level of performance that matched the district pass rate of 78% of the 18 elementary schools. At the state level, 83% of students passed the state reading assessment. We chose proficiency level on the state test 1 as the reader variable to understand the degree to which the aspirational standards in the CCSS/ELA match the level of performance expected by states.
The Study Design
The study was designed as a repeated measures examination of text with three independent variables (i.e., text length, text difficulty, and reader proficiency level) and two dependent variables (i.e., comprehension and reading rate). Text variables were the within-subject variables and proficiency level was the between-subject variable. The design might be called a 2 (text lengths) × 3 (text difficulty levels) × 2 (reader proficiency levels) design. Repeated measures designs expose all participants to all conditions, which, in this case, were six texts of different lengths and difficulties. The repeated measures design has several advantages that make it particularly suited to text research. First, the design permits isolation and examination of text with between-subjects variables, controlled and selected as needed. Second, results are not distorted by individual differences, because each participant serves as his or her own control or baseline. Third, repeated measures designs require much smaller sample sizes. When individual differences are controlled, higher levels of power can be obtained with lower numbers of participants.
Variables
The first within-subjects variable, text complexity, had three levels selected to intersect with the CCSS/ELA-defined text difficulty range for the Grades 2-3 band (see Figure 1). At Grade 3, text difficulties listed in the 2012 Supplement to Appendix A were 450L–820L, and so, to represent this range, texts in this study were created at 400L, 600L, and 800L levels (NGA Center for Best Practices & CCSSO, 2012). The standard error of measurement with the Lexile Framework is a range of 100L below to 50L above the targeted level (Schnick & Knickelbine, 2000). Difficulty levels in the study represented levels exactly 200L apart, covering the Grades 2 to 3 band.
Two text lengths, 200 and 1,000 words, were identified in accordance with the 2011 NAEP Reading Framework (National Center for Educational Statistics, 2011), which identifies texts between 250 and 800 words for assessments in Grade 4. The between-subjects variable, reader proficiency, was determined using the spring’s state outcome test results. Although there are many reasons to debate state outcome measures, they are nonetheless, a reasonable approximation of a student’s basic competency in reading. We can assume that readers who pass their state’s reading tests in third grade will likely be considered “on-grade level.”
Materials
Texts
The intent was to have three sets of passages at three text complexity levels (Lexiles of 400, 600, and 800) and at two lengths (200 words and 1,000 words). The study passages came from the QuickReads (Hiebert, 2005) program. QuickReads consists of six levels of increasing text complexity, each of which has 18 passages evenly divided between social studies and science content. Two passages with content as comparable as possible were chosen from available social studies topics at appropriate QuickReads complexity levels (A & B for 400L; C & D for 600L; E & F for 800L). Each pair of the passages at a Lexile level was selected to cover a similar topic 400L—Jobs in Community and Jobs in School; 600L—Budgets and Money; 800L—Natural Resources and Oil.
The primary writer of the QuickReads texts was responsible for editing passages to meet the requirements of the study. The first type of editing involved condensing or elaborating on QuickReads texts to comply with the number of words in the “short” condition (200 words) or the “long” condition (1,000 words). The length of texts increases from Level A of QuickReads, where topics average 450 words in length, to Level F, where topics average 750 words. Content was either eliminated or expanded on to create texts of desired lengths.
The second type of editing involved adjustments to syntax and vocabulary to ensure that passages were at the appropriate Lexile levels. Passages selected from QuickReads levels were deemed comparable with the designated Lexile levels. This choice meant that the amount of editing of passages to comply with Lexile levels was minimized. Passages for short and long conditions of level 600L are provided in the Online Supplementary Archive, Appendix A.
Measures
Comprehension and reading rate outcomes were obtained through a digital platform called OASIS, developed by MetaMetrics (Hanlon, Swartz, Stenner, Burdick, & Burdick, 2010). The OASIS platform uses a standard modified cloze procedure—maze. In a cloze test, words are systematically deleted from a passage and replaced with blanks spaces (i.e., lines) of equal length. Readers are asked to provide the correct word during reading. Words are deleted from a passage in equal intervals (e.g., every seventh word) or randomly within a prescribed text block (e.g., one word deleted within a seven-word block but at different positions). A maze or modified cloze test provides the test-taker with four syntactically plausible word choices for each blank. The percentage of items correct on the modified cloze served as the dependent measure.
Arguments pro and con have been offered during the long history of the use of the cloze procedure in assessments of reading comprehension (Bormuth, 1967; E. B. Coleman & Miller, 1968; Greene, 2001). The most recent research shows that comprehension performances on a cloze measure correlated well (r = .84) with performances on a standard question–answer comprehension test (Gellert & Elbro, 2013). Furthermore, the claim that cloze assessments capture vocabulary and decoding rather than comprehension has been challenged by studies where only small part of variation in maze scores was accounted for by decoding and vocabulary abilities (Cain, Patson, & Andrews, 2005; Gellert & Elbro, 2013; Spear-Swerling, 2004).
The cloze procedure used in Oasis has been validated by MetaMetrics in a widely used assessment, the Scholastic Reading Inventory (SRI; Scholastic, 2007). Reliability coefficients, ranging from .83 to .9, were achieved in a test–retest procedure with more than 30,000 second through tenth graders. Construct validity was established in a series of studies comparing performance on the SRI to performance on state and standardized measures that also estimate reading level. Correlations ranged from .65 to .91. The SRI norming study was conducted with a sample of more than 19,000 fourth through ninth-grade students with attention given to gender, race, and ethnicity (Scholastic, 2007).
The typical OASIS procedure uses an automatic procedure for selecting words and word choices for maze items. This automatic procedure was disabled and replaced with selected focus words and answer options. Our rationale for this decision was to ensure comparable tasks and data across students. The procedure of comparable items, although not used in the instructional implementation of the OASIS program, does conform to procedures used in studies of psychometric properties of the maze (e.g., McCane-Bowling, Strait, Guess, Wiedo, & Muncie, 2014).
Procedures
All study participants read all six of the described passages using the computer-based platform, OASIS (Hanlon et al., 2010). The digital reading program allowed participants to read texts online and identify their answer choices for the modified cloze blanks. Prior to data collection, researchers organized a length-based counterbalanced order for presenting the six passages to participants. Each order was recorded on a notecard for each participant. The OASIS software was downloaded to computers in the school’s lab and codes were created for each participant to access an account on the OASIS system.
Data collection took place during two, hour-long time slots identified by the school. However, most participants completed readings of the six passages in the first hour. When participants entered the computer lab, they participated in a simple training session, lasting about 10 min. During this time the researcher demonstrated the OASIS program and demonstrated how to bring up digital passages in the program and how to complete a modified cloze test. First, the researcher demonstrated how each participant should use their code to login into the OASIS system. Then, they were shown how to pull up passages on the system. Completing the modified cloze items required reading the passage in the OASIS platform and selecting the most appropriate word choice to complete each “blank.” Using a simplified think aloud procedure, the researcher modeled how to read the passage and find the best answer choice from the four available options in the cloze passage. A guided practice in which the group of participants helped answer two additional items ensued. Participants were told that passages would become more difficult, and they should do their best to complete each item. After answering questions from participants, the researcher provided them login cards and each proceeded to a computer to commence reading.
As participants read passages, the researcher circulated supporting students who needed assistance finding the correct passages or facing technological challenges. Having used similar login systems and reading computer programs, the participants were comfortable with the study procedures. All participants read all six passages. The majority of participants completed passage reading during the first 1-hr time slot, but a few returned during the second time slot to complete their readings. After reading, each participant’s percentage of correct answers and silent reading rate (words per minute [wpm]) were recorded.
Results
Analysis
When using the repeated measures design, researchers have two analytic options, univariate statistics (i.e., ANOVA) or multivariate statistics (i.e., MANOVA). Both are automatically generated by statistical software when using the General Linear Model for a repeated measures design. The analyses test the between-subjects variable and within-subjects variables as well as interactions among variables.
In designing our study, we were aware that views differ in the literature as to the appropriateness of univariate or multivariate tests for repeated measures designs (Maxwell & Delaney, 2004; Stevens, 2012). Univariate tests have three assumptions: (a) independence of observations, (b) multivariate normality, and (c) sphericity, or degree to which variances between the differences of the levels of repeated measures are equal (i.e., three text difficulty levels, two lengths). We chose the multivariate approach for several reasons. First, with the exception of the independence assumption, multivariate tests are robust to normality and sphericity and second, given the exploratory nature of the study, the use of multivariate tests was warranted. Our use of multivariate statistics also was guided by additional information about requisite sample sizes. Both Stevens (2012) and Maxwell and Delaney (2004) recommended the multivariate test not be used if n is less than a + 10 (where a is the number of levels for repeated measures), but we met this criterion. 2
Comprehension
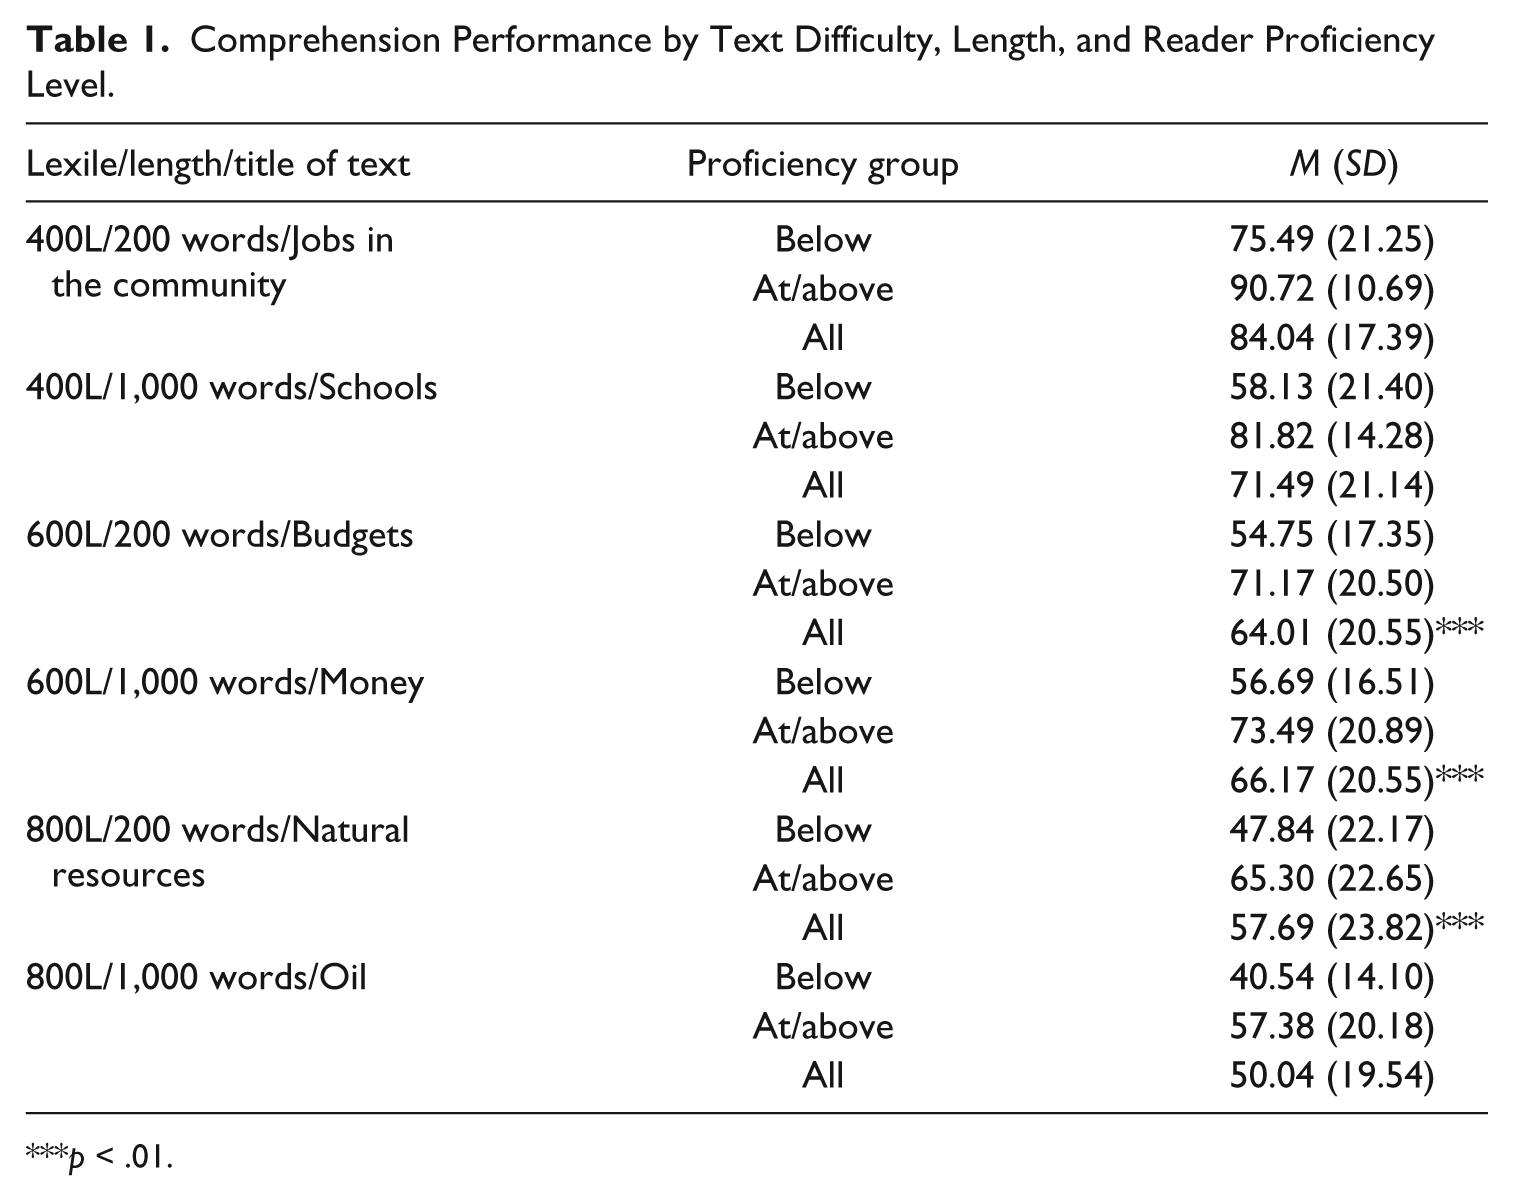
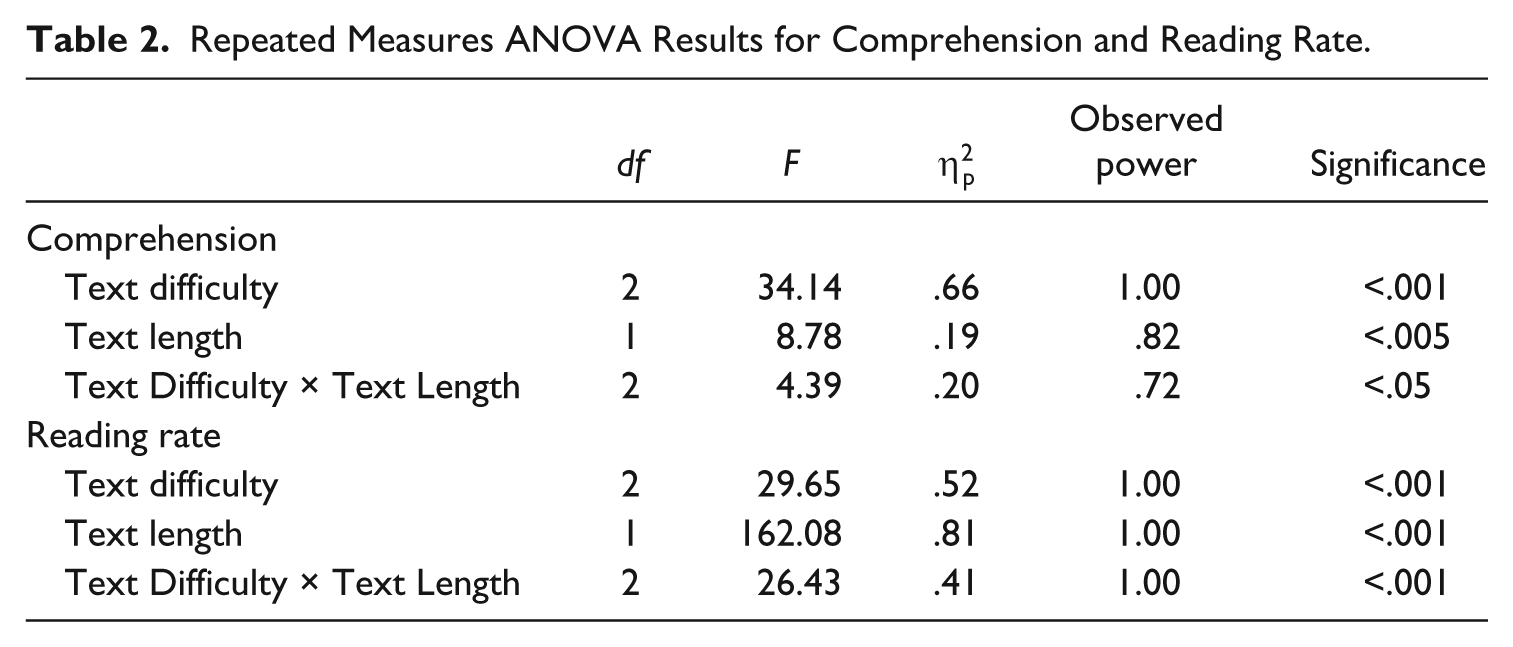
Table 1 provides means and standard deviations for comprehension performance by student proficiency level. Table 2 shows results of the repeated measures ANOVA. There were main effects for both text difficulty and length but there was a difficulty-by-length interaction. As texts got both more difficult and lengthier, comprehension deteriorated (see Table 2). On average, all participants comprehended the 400L passages adequately, with the lengthier passage comprehended at lower levels (M = 71.49%, SD = 21.14) than the shorter versions (M = 84.04%, SD = 17.39). Statistically insignificant, lower levels of comprehension were observed on the 600L passages with shorter passages comprehended at two percentage points lower (M = 64.01%, SD = 20.55) than longer passages (M = 66.17%, SD = 20.55). When reading 800L level passages, participants comprehended at a lower level than when reading 400L and 600L level passages, but comprehension was lowest in the longer version (M = 50.40%, SD = 19.45) as opposed to the shorter version (M = 57.69%, SD = 23.82).
Comprehension Performance by Text Difficulty, Length, and Reader Proficiency Level.
p < .01.
Repeated Measures ANOVA Results for Comprehension and Reading Rate.
The between-subjects status variable, reader proficiency level, also interacted with text difficulty (see Table 1). Below-level participants had even lower comprehension than on-level students as materials got harder (see Table 2). For example, below-level participants read 400L passages with 58.13% to 75.49% comprehension, whereas the range for the at/above level participants was 81.82% to 90.72%. For 600L and 800L passages, the pattern was the same; below-level participants on average comprehended about 17 percentage points lower than at/above level participants. The between-subjects status variable did not interact with text length, suggesting that length did not have a differential effect on participants’ comprehension. There were no three-way interactions.
The pattern of a somewhat higher performance on the long version of the 600L text than on the short 600L version was statistically insignificant but the pattern was in the opposite direction of the results for the other two Lexile levels. We conducted several follow-up analyses to determine if the 600L texts differed from one another in ways that 400L and 800L texts did not. The first follow-up analysis was to examine the constituent parts of the Lexile measure (i.e., MLWF, MSL). Data in Table 3 show that the MLWF of words in the shorter version of the 600L passage was the lowest of any of the passages, including the 800L passage. A low MLWF means the words in this passage were the rarest and least frequent of all passages. Unlike other pairs of texts, frequency discrepancy (MLWF) between the two 600L texts was substantial, .20, but the difference in sentence length was also the greatest of any pair of text, with the average sentence in the short text almost one word less than in the long version of 600L text.
Intra-Lexile Features of Texts.
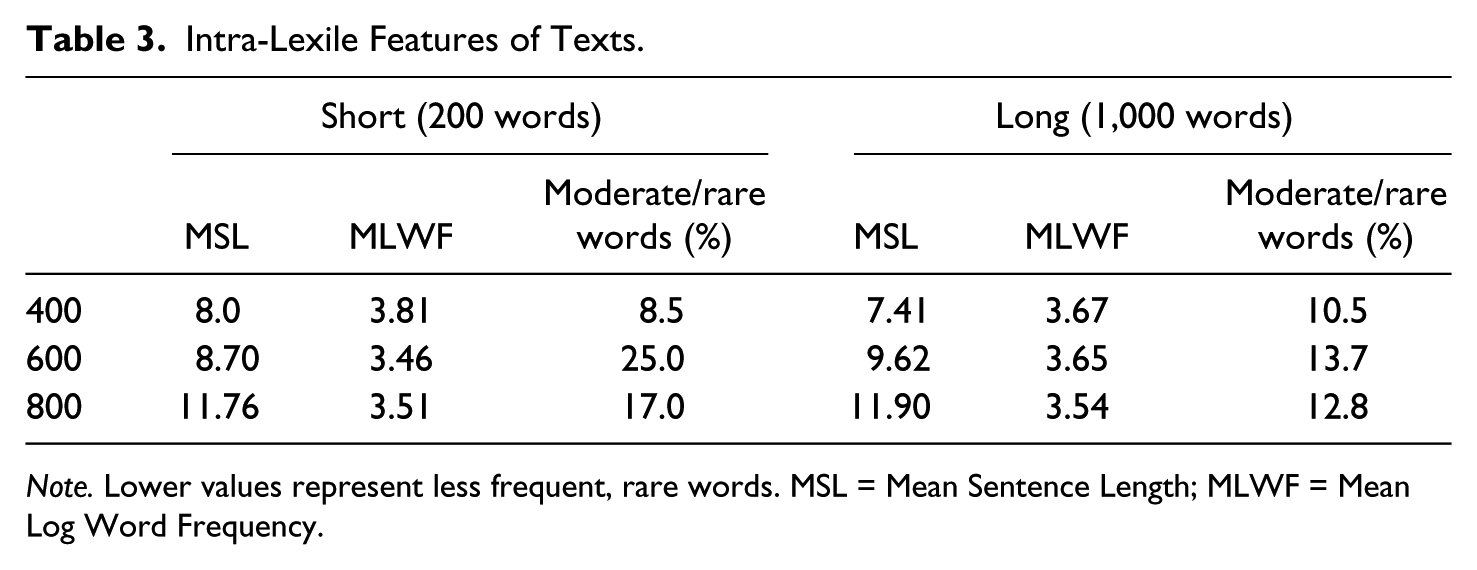
Note. Lower values represent less frequent, rare words. MSL = Mean Sentence Length; MLWF = Mean Log Word Frequency.
Developers of the Lexile Framework have not given guidelines on interpreting vocabulary demands associated with varying levels of MLWF. Consequently, a second follow-up analysis considered the number of rare words (Zeno, Ivens, Millard, & Duvvuri, 1995) in the texts and age of acquisition (Kuperman, Stadthagen-Gonzalez, & Brysbaert, 2012) of the words in texts. The short 600L text had approximately 4 times more rare words than the long 600L text. Furthermore, 12% of the words in the short text were predicted to be acquired after age nine (the typical age of students finishing third grade), whereas only 1.4% of words in the long text had a similar age of acquisition.
The final follow-up analysis considered the manner in which an alternative text complexity system evaluated the complexity of the texts. The text complexity chosen for this analysis was the one Nelson et al. (2012) identified as the strongest in predicting text levels and student achievement of six text complexity systems (including the Lexile Framework)—the Reading Maturity Metric (RMM; Landauer, Kireyev, & Panaccione, 2011), a measure that began as an assessment of vocabulary but was extended to include other features. The RMM analysis showed a discrepancy of 1.9 grades between the two texts at the 600L level with the short text evaluated to be the harder text.
What appeared to be occurring within the Lexile Framework was a trade-off between word frequency and sentence length that permitted two texts, both with the same difficulty level according to the Lexile Framework—600L—to be different in key text features. Although both passages were judged to be of similar text complexity, the long version with easier vocabulary but longer sentences was evaluated by the Lexile Framework to be of equivalent complexity to the short passage with shorter sentences but more challenging vocabulary.
Rate
Table 4 shows results of reading rate analyses. Third graders read passages of different lengths and difficulties at different rates, as indicated by main effects for difficulty and length on reading rate (see Table 2). On average, as texts got longer and harder, participants took less time to finish them. For example, participants read the 400L passages between 47.37 and 51.37 wpm but read the harder 600L passages faster at 57.29 to 70.96 wpm, and of the two 600L versions, the longer version was read the fastest. The pattern continued with the 800L passages. Between-subject reader proficiency levels were not significant with the rate analysis, suggesting that patterns were the same for both on/above-proficiency students and for below-level students. Once again, a difficulty-by-length interaction occurred (see Table 2 and Figure 2).
Reading Rate by Text Difficulty and Length.
Note. Reader proficiency levels were not statistically significant and thus, on-level and below-level distinctions are not reflected in this table. WPM = words per minute.
Reading rates by text difficulty and length.
Discussion
This study was conducted as a response to the accelerated text complexity levels recommended in the CCSS. The study’s focus was on a particular period in students’ reading development, the transition into Chall’s (1983) Stage 3 (reading to learn the new) that is now associated with the end of Grade 3. A passing score on a state assessment was used as an indicator of proficiency level to explore how one sample of students responded to three Lexile levels on the Grade 2 to 3 step of the CCSS staircase of text complexity. Furthermore, the study addressed whether text length interacted with text complexity level.
Choices in the design of any study mean that there are limits to the generalizability of findings. When a study is an initial investigation in a seminal area of policy and practice as this study was, the manner in which limitations might be addressed in future work is particularly critical. We integrate a presentation of our results with discussion of the study’s limitations and, in so doing, aim to identify future research in this critical area of policy and practice.
Effects of Context on Text Complexity
The features of a context within which the reader–text interaction occurs influence reading outcomes (Snow, 2002). The context of this study was intended to simulate the next-generation assessments, individuals reading texts in a digital context. As a group, even students at- or above-grade level on their state assessment did not attain a proficient level with texts at the middle or end of the grade band. Students below-grade level on their state assessment averaged 75.49% on a single task—the short version of the passage at the lowest end of the Grade 2 to 3 band on the staircase of text complexity.
These performances likely reflect instructional experiences prior to adjustments to comply with the CCSS staircase of text complexity, in that the study was conducted during the academic year when states were adopting the Standards. Furthermore, performances on texts of particular complexity levels in an individual, digital context do not indicate whether texts of similar complexity levels are appropriate for instruction. Prior research indicates aspects of reading performance improve when readers are provided supports (e.g., teacher/tutor, digital recordings) in repeatedly reading texts that may originally be difficult for them (O’Connor, Swanson, & Geraghty, 2010; Shany & Biemiller, 1995; Stahl & Heubach, 2005). Transfer of these scaffolded experiences to success with new texts of comparable complexity is less uncertain (see, for example, Morgan et al., 2000).
At the present time, theory and research that address questions about the amounts, kinds, and transfer of experiences with texts that vary in complexity level within different reading contexts is almost nonexistent. Conclusions about appropriate text levels in instructional contexts cannot be drawn from the current findings. Within an assessment context, however, even students who passed state assessments performed below expected levels of proficiency on texts at the middle and the high end of the Grade 2 to 3 step on the CCSS staircase of text complexity.
Effects of Content on Text Complexity
Readers’ prior knowledge is one of the most critical influences on reading outcomes (Britton & Graesser, 2014), and topics of texts in this study are likely to have influenced students’ performances on texts of different complexity levels and lengths. We did not establish how this critical aspect of reading influenced students’ comprehension and reading rate. Our aim in conducting this study was to establish students’ performances with texts of varying levels in their grade band, as specified by CCSS developers, in an assessment-like context.
In typical assessments, including those of the two CCSS-consortia, the degree to which readers’ background knowledge influences comprehension is not routinely part of assessments. Unlike typical assessments where topic choices are frequently made on the basis of their ability to create variation across readers, we chose topics we believed provided an even playing field for all students. For the 400L texts, we chose a topic that is likely to have been covered in the primary grades. That is, we chose a topic we believed most children would find accessible. The topics for the two higher levels were chosen because they are unlikely to have been covered in the primary curriculum and are topics students are unlikely to have had considerable exposure in their homes and communities. We did not examine students’ background knowledge, and we cannot know if our assumptions were correct. We do recognize students’ performances on the 400L texts may have benefitted from our choice of a likely familiar topic, whereas their performances on the 600L and 800L topics may have suffered because of their unfamiliarity with the topics of budgets and natural resources.
Future investigations of students’ performances with texts with different features, including complexity and length, need to address the breadth and depth of a variety of topics. Such investigations are especially critical in light of the CCSS inclusion of literacy in history/social studies, science, and technical subjects within ELA standards but without specification on the depth with which such topics are to be covered in the reading/language arts period.
Effects of Syntax and Vocabulary on Measures on Text Complexity
Results for comprehension performance on the 600L passages, although not significant, departed from trends with 400L and 800L texts. Post hoc analyses showed that, though the 600L texts differed in both syntactic and vocabulary demands, the Lexile Framework deemed the two texts to be equivalent in difficulty for readers.
Motivated by this finding, Hiebert (2012) conducted a follow-up study of the relationship between word frequency and sentence length in the assignment of Lexiles. In a stratified sample of 1,518 texts of narrative and informational texts from Grades K to 12 (CCR), sentence length predicted Lexiles to a greater degree than word frequency (Lexile and MSL: r = .94; Lexile and MLWF: r = −.53). Furthermore, analyses showed substantial changes in Lexiles could be affected by manipulating sentence length but comparable changes in vocabulary resulted in only minimal changes to the Lexile levels.
Trends in the Hiebert (2012) analysis match those found in this study and further underscore a potential drawback of second-generation text complexity systems such as the Lexile Framework that use large databases of words to establish word frequency: The greater weight of syntax over vocabulary in computing a text’s complexity. Skewed distribution of vocabulary in written English explains the weaker role of vocabulary relative to syntax. In the Zeno et al. (1995) analysis of more than 17 million words from 60,527 samples of text, the 925 most-frequent words accounted for approximately 50% of the total words in texts but accounted for less than 1% of the 154,941 unique words in the database. At the other end of the distribution, approximately 79% of unique words in the Zeno et al. database are predicted to appear less than once per million words of text. Even when a log algorithm is applied to the average to normalize the distribution as is done in the Lexile Framework, the range of the semantic measure is limited. In the Hiebert (2012) analysis, MSL ranged from 3.47 to 45.22 but the MLWF ranged from 2.67 to 4.14.
This study is one of the first to identify that the semantic/word variable (MLWF) used in Lexiles may be obscured by mean sentence length in estimation of text complexity. At the time the study was conducted, only one previous study had reported a lack of variation in the word-frequency measure of texts at the Lexile Framework (Deane, Sheehan, Sabatini, Futagi, & Kostin, 2006). Deane et al. (2006) showed that differences in sentence length in Grade 3 and Grade 6 texts were pronounced but differences in word frequency were not. They did not report, however, on the degree to which Lexiles are predicted by sentence length. All readability formulas have limitations (Anderson, Hiebert, Scott, & Wilkinson, 1985; Davison & Kantor, 1982), but the second-generation text complexity systems such as the Lexile Framework and ATOS (Milone, 2009) that use the average of rankings of words within large corpora may have a unique limitation.
Effects of Text Length on Reading Proficiency
All students performed more poorly on the long versions of the 400L and 800L passages. These findings suggest that, when passages are similar in complexity but are longer, student comprehension levels appear to decline. In that the long versions of texts within this study more closely model those of the texts of next-generation assessments than the short versions, the length of text and, simultaneously, the task need to be taken into account when designing instruction that will support students’ attainment of standards associated with text complexity.
Again, we need to underscore that these findings were obtained in an assessment context, not an instructional one. In an instructional context, students are likely to have support from their teacher or opportunity to review longer texts. But the findings do highlight the need for students to have opportunities to read texts of increasing length as part of reading/language arts periods in their classrooms. The long versions of the study texts were considerably longer than typical texts in the state’s reading assessment, almost 3 times as long in that the average length of 382 words on the texts in the state’s released assessment for 2010 (the year of the study). How students increase proficiency in reading texts of increasing length illustrates an area that would benefit greatly from collaborative study between teachers and researchers.
We also note that text length may be influenced by genre and, within genres, writers’ style and stance. On their state assessment where 57% of students had been designated as proficient, narrative texts dominated, at least in the released items from the assessment. One of the narratives on the state assessment followed a fairly conventional fairy tale structure and the other was a narrative about an interaction between siblings. The third text, while informational in character, had been excerpted from a magazine and dealt with a topic that would be expected to be familiar to students—going to the movies. By contrast, the content and style of informational texts in this study were more technical in character. The degree to which students’ proficiency in reading longer texts in assessment-like contexts is affected by genre, content, and style is a topic that would benefit greatly from additional research.
Text Complexity and Underrepresented Students
The findings are also limited by sample characteristics and size. The sample was composed primarily of African American and Hispanic-American students attending urban schools. Results do not generalize to the U.S. population at large but the sample is representative of students who have historically underperformed on state and national assessments. In 2007, the gap between Caucasian-American and African American students on the NAEP reading assessment was 27 points at fourth grade and 26 points at eighth grade (National Center for Education Statistics, 2009). For Hispanic-American students, the gap on NAEP reading achievement in 2009 was 25 points at Grade 4 and 24 points in Grade 8 (Hemphill, Vanneman, & Rahman, 2011).
As text complexity levels increase with implementation of the CCSS guidelines in assessments, all students will be required to perform at higher reading levels. For groups on the low end of the achievement gap, new levels may be particularly challenging. The average Lexile of the state assessment on which 57% of students in this sample performed proficiently was 660L, substantially below the end-point of 820L for Grade 3 on the CCSS staircase of text complexity.
The increase in text complexity levels on assessments is likely to have particular implications for third graders, especially with the trend for states to implement policies on retention for students not reading at grade level on assessments (National Conference of State Legislators, 2014). We believe educational researchers urgently need to examine how students, especially those in high-poverty urban communities, are responding to the increase in text complexity, especially at third grade where policies are increasingly calling for actions such as retention.
Conclusion
This study provides two findings particularly critical within conversations of standards and expectations for students. The first is the levels at which students are performing in relation to mandates of the staircase of text complexity and lengths of future texts. Even students at- or above-grade level on their state assessment did not attain a proficient level with texts at the middle or end of the band designated within the staircase of text complexity (D. Coleman & Pimentel, 2012). Furthermore, on longer texts closer to lengths of PARCC and Smarter Balanced specifications, readers had lower comprehension in longer texts than with shorter texts (those typical of norm-referenced tests).
This finding of the gap between performances and the designated levels of the staircase of text complexity is in tune with preliminary results from the CCSS-aligned assessments (Ujifusa, 2012) and also projections of those leading the development of new assessments (SBAC, 2014), namely, that the majority of students will not be performing at designated levels of proficiency.
The finding of a substantial gap between the aspirational text complexity levels and student performances, even those students previously designated as proficient, underscores the need for attention by literacy scholars to this critical shift in literacy policy. Literacy scholars, we believe, have a critical role to play in providing interpretation and leadership to policy makers and practitioners as communities grapple with the upcoming results from the CCSS-aligned assessments (see Hiebert & Mesmer, 2013). To date, we have found no evidence that the majority of students in even the most rigorous interventions have attained these aspirational levels or that designated levels for steps of the staircase are necessary for attaining CCR literacy levels.
The second finding has to do with patterns of performance with 600L texts. According to the Lexile Framework, these texts were of equivalent complexity but the features of the texts were not entirely comparable. The short version had shorter sentences, on average, but harder vocabulary than the long version. Within readability formulas, syntax may predict text complexity but vocabulary has consistently been found to account for greater variation in student performances than syntax (Pearson, 1974). So, too, in this study, text with harder vocabulary proved to create challenges for students more than the longer passage with longer sentences and less challenging vocabulary. CCSS writers identified limitations of readability formulas that have long been evident: (a) the tendency to underestimate complexity of narrative texts where average sentence length can be decreased because of dialogue and (b) the tendency to overestimate complexity of informational texts where content words that are often rare are repeated. This study, as well as the follow-up that it motivated (Hiebert, 2012), suggests the second-generation readability formulas such as the Lexile Framework and ATOS that use frequencies of words based on their rankings in large databases may suffer from an additional limitation. Further research is needed, as noted in the report of the panel convened by the National Center for Education Statistics to determine the usability of the Lexile Framework in national assessments (White & Clement, 2001). This panel recommended that developers of the Lexile Framework (MetaMetrics) experiment with other ways (either mathematical or semantic) of defining word frequency in the Lexile Framework to ensure greater discrimination, especially in the middle ranges of vocabulary. Such research is sorely needed, especially as the Lexile Framework becomes a standard for many publishers, test developers, and even libraries and booksellers.
In essence, the findings in this study suggest that some of the most vulnerable third graders in the country could be adversely affected by the new text complexity standards. Without a doubt, larger studies with larger and more diverse samples are needed to confirm the trends in this study, but the work indicates that the United States may be headed for the same aspirational collision that it saw with No Child Left Behind. Importantly, the study identifies a potential limitation of readability measures that rely on large, word frequency databases. Continued systematic research and large-scale text analyses are needed to indicate the degree to which patterns found in 600L texts in this study are occurring in other texts.
Footnotes
Appendix
Study Passages.
| Form | Passage |
|---|---|
| 400L (Short) | Many people do jobs that help you. You see and talk to some of these people. You see your teachers who help you learn. You talk to them too. You see your doctor who helps you stay well. You talk to her, too. There is another group of people who help you. You may see them. Usually, you do not talk with them. But they do jobs day and night that help you. Police officers work hard to keep your town safe. Firefighters put out fires in buildings and cars. People who pick up garbage also help keep your town clean. Another group of people helps you, too. You will probably never see these people. But they are working hard to make things you use. Somewhere, people made the shoes that you are wearing. On farms, people took care of cows. These cows made the milk you drink. Someone drove a truck to bring the milk to a store. People built the school in which you learn. People wrote the books that you read. Others made the paper and pens you use. You will probably never meet these people. But around the world, they are doing jobs that help you. |
| Many new houses have been built in a town. Soon families will move into the houses. The families will have children. They will need to go to school. |
|
| 400L (Long) | The schools of the town are full. They have no room for more children. People of the town meet to talk about what to do. There are many different ideas. One idea is to build a new school. Finally, everyone agrees. The town will build a new school. First they need to get money to pay for it. Then land has to be found. |
| Other workers come next to lay pipes in the ground. One set of pipes brings water to the school. Another set of pipes will bring in gas. Next come trucks with big machines on them. These machines make concrete. The concrete will be used to make the school’s foundation. These workers have an important job. They have to put the concrete in just right. If they do not, the foundation may crack many years from now. |
|
| At the same time, plumbers are putting in pipes. These pipes will bring water in and out of the school. Plumbers know how to pick the right pipes for different jobs. They know just where to put the right pipes. |
|
| The school is almost done! Trucks drop off tables, desks, and chairs. Many trucks leave many boxes of books. Other trucks bring boxes with new computers. Still other trucks bring boxes with balls for the playground. The principal has been at work for many months. She has found teachers for every class. |
|
| 600L (Short) | A budget is a record of money. Businesses, families, and individuals have budgets. The United States government has a budget. A store or company has a budget. Even children can have budgets. Whatever its size, a budget has the same two parts. A budget can be gigantic, like that of the United States government. It can be tiny, like that of fourth graders. Whether gigantic or tiny, budgets have the same two parts. |
| A surplus means that people have choices. They can spend, save, or give away the extra money. A debt leaves people with few choices. People with debts need to find ways to repay the money that they owe. Expenses can never be greater than income. | |
| 600L (Long) | Money is what people use to buy and sell things. If everyone said that a rock is worth a day of work, people would get paid in rocks. For a month of work, someone might get paid a bag of rocks. A new car might cost a truck full of rocks. |
| The word currency describes the money that is current in a country. Every country has its own money. In the United States, the basic unit of money is the dollar. In other countries, the basic unit is different. |
|
| Today, Americans use coins made of cheap metals, not gold and silver. Countries, especially European ones, use coins that are worth $5 or more. That is not the case in the U.S. There are American coins worth $1 and 50 cents. However, these coins are used frequently. The quarter is the highest valued coin that most Americans use daily. |
|
| 800L (Short) | Human beings would not be able to live without the natural resources found on Earth. These include plants, rocks, trees, minerals, water, and soil. We use some resources without many changes to their original form. That is the case with the water that we drink and the plants that we eat. Natural resources are also used in making new products. Some of these products do not look at all like the original natural resources. Cotton shirts and cotton plants look quite different from one another. You would probably not recognize the mineral that is used to make the core of a pencil. |
| 800L (Long) | In today’s world, oil is the main source of energy. Many things in our lives use oil in some way or are made from oil. A list of these things would be very long. When you ride your bike on the street, you are riding on something that has oil in it. Do you play a sport that uses a ball? If so, there’s a good chance that the material used to make the ball has oil in it. The heating or cooling system in your home or classroom may use oil for electricity. When you travel in your family’s car, oil is being used. Gasoline is one of the main things that are made from oil. Gasoline is used in cars, buses, trucks, trains, airplanes, and ships. Start making a list. You will be surprised at how many objects around you use oil or are made from oil. |
| The world’s people are using more oil than is being found to replace it. Once we cannot find more oil and use up what we have, there will be no more oil in the world. While world oil production is slowing down, the world population is growing. Some countries are now building more factories, roads, and houses. These countries are using more machines that need more oil. One of these countries is China, which has a very large population. Its businesses are growing quickly. From 2002 to 2004, China’s use of oil went up by 24 percent. The need for oil is growing and will keep growing. At some point, the need for oil will be greater than the world’s supply of oil. |
|
| A lower oil supply in the world is a problem that needs answers. There are two solutions right now that make sense. The first solution involves all of us. People must do what they can to save the world’s oil supply that is left. Until a renewable fuel that works as well as oil is found, it is a good idea to save the oil that is left. One way to save oil is to use less energy. There are many machines that people can use or buy that use less fuel or energy. Finding new ways of saving energy may not solve the problem, but saving small amounts of energy now will help. On a small scale, you can do your part. You can check that machines you turn on at home are turned off after you use them. You can turn off lights when you leave a room. People can also choose to use things that are more energy efficient. For example, people can choose to use light bulbs that are energy efficient. These light bulbs use less electricity and last longer than regular bulbs. Also, since the energy efficient light bulbs last longer, factories will not have to make as many light bulbs. The factory will use less electricity. Less electricity use means less oil use. |
|
| These are only a few changes that people can make. Making small changes or some changes now would be much easier than having to make big changes later. Having less oil will bring big world changes. Scientists may be finding solutions. But it is clear that it is not just up to scientists to find solutions. Everyone, including children, can do things to save energy today. Instead of leaving the future to chance, it is important for us to share the job of saving energy now. |
Declaration of Conflicting Interests
The author(s) declared no potential conflicts of interest with respect to the research, authorship, and/or publication of this article.
Funding
The author(s) received no financial support for the research, authorship, and/or publication of this article.