
Abstract
This was a descriptive study comparing 1,582 accredited and 10,008 nonaccredited home health agencies over a 3-year period using the Centers for Medicare and Medicaid Services Home Health Compare data set. Metrics included the star rating and 22 quality measures. A longitudinal model was used to determine differences between accredited and nonaccredited organizations on the quality measures. Categorical differences in star ratings and risk-adjusted outcome categories were analyzed using a chi-square test. Accredited agencies had statistically higher star ratings than nonaccredited organizations (3.4 vs. 3.2, p < .001), and they were more likely to be categorized 4, 4.5, and 5 star organizations (p < .001). Absolute differences between accredited and nonaccredited agencies on the OASIS quality measures were generally small but consistently favored accredited facilities over all 3 years studied (p < .05).
Introduction
A number of cross-sectional and descriptive studies have used the Centers for Medicare and Medicaid Services (CMS) Home Health Compare (HHC) data set to examine the relationship between various organizational characteristics and home health agency quality. These studies have explored ownership status, 1 hospital affiliation and Medicare tenure, 2 and work environments. 3 At least one recent study has demonstrated that improving performance on the home health measures in the HHC data set is associated with a decrease in 30-day hospital readmission rates. 4 We could find no published literature, however, evaluating the relationship of accreditation in the home health setting, despite the fact that accreditation has been repeatedly associated with higher quality in hospitals, nursing homes, and behavioral health care settings.5-9
Two studies of accredited and nonaccredited nursing homes demonstrated that The Joint Commission (TJC)–accredited nursing care centers outperformed non–TJC-accredited homes on a number of the measures in the Nursing Home Compare data set. Accreditation status was shown to be a predictor of quality across multiple dimensions, including numerous quality measures, regulatory fines, and payment denials independent of ownership type or facility size.5,6 A third study of nursing homes, using public data from the Minimum Data Set, found that accredited nursing homes had small but consistently better performance on process of care measures than nonaccredited facilities. 8 Within nursing homes, accreditation has also been associated with more appropriate medication utilization 10 and fewer medication-related adverse events. 11 A comparative analysis using the CMS Hospital Compare data revealed that TJC-accredited hospitals performed better than nonaccredited hospitals on nationally standardized publicly reported quality measures, and the performance gap between accredited and nonaccredited hospitals increased over the 5 years of the study. 7 We sought to determine whether similar results could be shown for TJC-accredited versus non–TJC-accredited home health care agencies.
To better understand the relationship between accreditation and home health agency quality, we used three consecutive years of HHC data to contrast TJC-accredited and non–TJC-accredited homes health care facilities using the Five-Star Quality Rating, the Outcome and Assessment Information Set (OASIS) quality measures, and two risk-adjusted, claims-based outcome measures (how often home health care patients needed urgent, unplanned care in the emergency room, and how often home health care patients needed to be admitted to the hospital).
Methods
Population
We downloaded three data sets from the CMS HHC website in August 2016, representing home health agency performance in 2015, 2014, and 2013. A total of 11,590 home health care facilities, with data spanning all 3 years, were identified. Accreditation status was determined by matching accredited organization records in TJC’s database using CMS Certification Number (CCN). Twenty-five home health facilities in TJC database (1.6%) could not be matched based upon missing or invalid CCN numbers. A total of 1,582 accredited home health facilities were successfully matched to the 3-year HHC data set. The final data set used in the analysis, therefore, included 10,008 (86%) non–TJC-accredited and 1,582 (14%) TJC-accredited organizations. To address the influences of agency ownership type, and small counts associated with certain ownership subtypes, agencies were grouped into three broad categories that have been used in previous studies: for-profit, not-for-profit, and public (i.e., government). 2 For-profit agencies were identified based upon the “Proprietary” designation using the HHC variable “type of ownership.” Government agencies were identified based upon multiple ownership subtype values including “Government,” “Combination GOVT & Voluntary,” or “State/County,” or “Local.” The remaining agencies were grouped as “Not-for-Profit.” These included the categories of “Private” or “Religious Affiliation” or “Other.”
Measures
Star ratings
The primary outcome of interest within the HHC data set is the star rating, which was available in the 2014 and 2015 (but not the 2013) data sets. The methodology for calculating the star ratings is based on a combination of individual measure rankings generated from nine of 24 reported process and outcome quality measures. These include (1) Timely Initiation of Care, (2) Drug Education on all Medications Provided to Patient/Caregiver, (3) Influenza Immunization Received for Current Flu Season, (4) Improvement in Ambulation, (5) Improvement in Bed Transferring, (6) Improvement in Bathing, (7) Improvement in Pain Interfering With Activity, (8) Improvement in Shortness of Breath, and (9) Acute Care Hospitalization. Additional details associated with the CMS methodology are available online. 12 Star ratings associated with a given year actually reflect aggregate OASIS quality measurement data from the previous year (e.g., the 2015 star ratings are based upon measure data representing January 1, 2014 to December 31, 2014), and claims data (associated with the acute care hospitalization measure), from a 12-month period that is one quarter behind the OASIS data (e.g., the 2015 star ratings use claims data from October 1, 2013, to September 30, 2014).
Quality measures
The secondary measures of interest were the individual quality measures in the HHC data set. These measures are derived from two sources: (1) OASIS quality measures which are submitted by home health agencies and (2) data submitted in Medicare claims. 13 This study includes 22 of these quality measures, based upon their availability across all 3 years of the study period. Of the 22 measures, 13 are OASIS process measures (i.e., they report a home health agency’s use of specific evidence-based processes of care) and seven are OASIS outcome measures (i.e., measures that reflect change/improvement in a patient’s ability to perform a specific task or level of functioning). The remaining two measures are claims-based outcome measures that address potentially avoidable events (how often home health care patients needed urgent, unplanned care in the emergency room, and how often home health care patients needed to be admitted to the hospital). Like the star rating, the risk-adjusted outcome measures were only available during years 2014 and 2015. The outcome measures are risk-adjusted using a hierarchical multivariate model that includes adjustment for patient age and sex, enrollment status, activities of daily living scores, care received during the prior proximal hospitalization, length of prior proximal hospitalization, diagnosis and procedure categories during the prior proximal hospitalization, other care received within 1 year of the home health stay, number of prior acute discharges, and number of outpatient emergency department visits. 14
The OASIS process and outcome measures are submitted to CMS by home health agencies, and they are calculated using a patient’s completed episode of care, beginning with admission to the home health agency (or a resumption of care following an inpatient facility stay) and ending with discharge or transfer to inpatient facility. The claims-based outcome measures are calculated based on the first home health claim that starts an episode of care for a patient and ends either 30 or 60 days after the initial claim.
Statistical Analysis
Differences between star ratings were evaluated using a general linear model with accreditation and ownership type as fixed effects. Differences in star ratings were also analyzed as categorical grouping (e.g., 1 star, 1.5 stars, 2 stars . . . 5 stars) using a chi-square test. Similarly, a chi-square test was used to evaluate differences in risk-adjusted outcome categories (designation as performing “better than,” “the same as,” or “worse than” expected) between TJC-accredited and non–TJC-accredited organizations for each year. OASIS quality measure rates were included in the CMS HHC data set as calculated rates (without raw numerator or denominator counts), and therefore could not be weighted by the number of cases. Rates were not reported for organizations with fewer than 20 complete quality episodes or for organizations that had been certified by CMS for less than 6 months. For each of the OASIS quality measures reported as a rate, a longitudinal model was used to determine differences between TJC-accredited organizations versus non–TJC-accredited organizations with accreditation status and ownership type as fixed effects in addition to year and accreditation status as interaction terms. From each measure model, least squares means estimates were used to compare rates of TJC-accredited organizations versus non–TJC-accredited organizations. Statistical significance was determined at the 0.05 level.
Results
Based upon the ownership designations available through the HHC data set, TJC-accredited home health agencies were more likely to be for-profit facilities and less likely to be government-owned (p < .001) than non–TJC-accredited facilities (see Table 1), and the distribution of star ratings based upon ownership status is provided in Figure 1. Government-owned facilities had lower proportions of 4, 4.5, and 5 star agencies and a greater proportion of 1, 1.5, 2, and 2.5 star rated agencies than both for-profit and not-for-profit agencies. Not-for-profit agencies and for-profit agencies were similar in their proportions of 4, 4.5, and 5 star organizations, although the not-for-profit agencies had fewer low-performing organizations (1, 1.5, 2, and 2.5 star agencies).
Accreditation Status by Ownership Type.
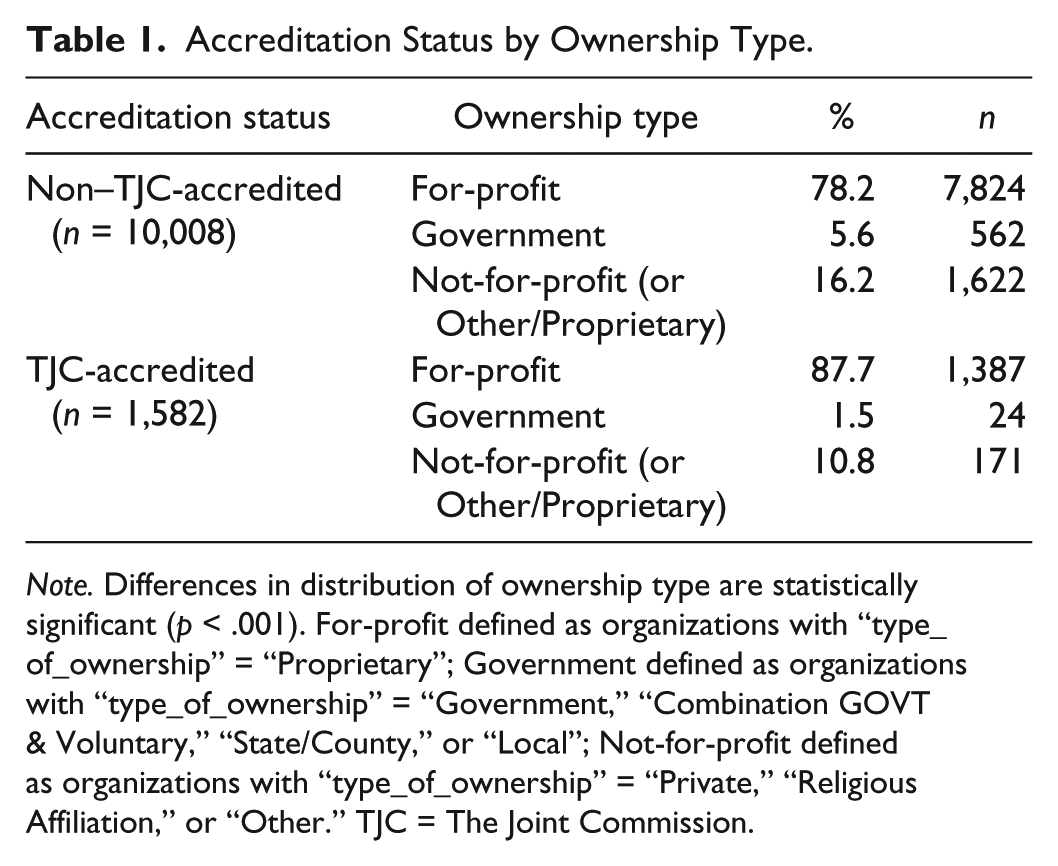
Note. Differences in distribution of ownership type are statistically significant (p < .001). For-profit defined as organizations with “type_of_ownership” = “Proprietary”; Government defined as organizations with “type_of_ownership” = “Government,” “Combination GOVT & Voluntary,” “State/County,” or “Local”; Not-for-profit defined as organizations with “type_of_ownership” = “Private,” “Religious Affiliation,” or “Other.” TJC = The Joint Commission.
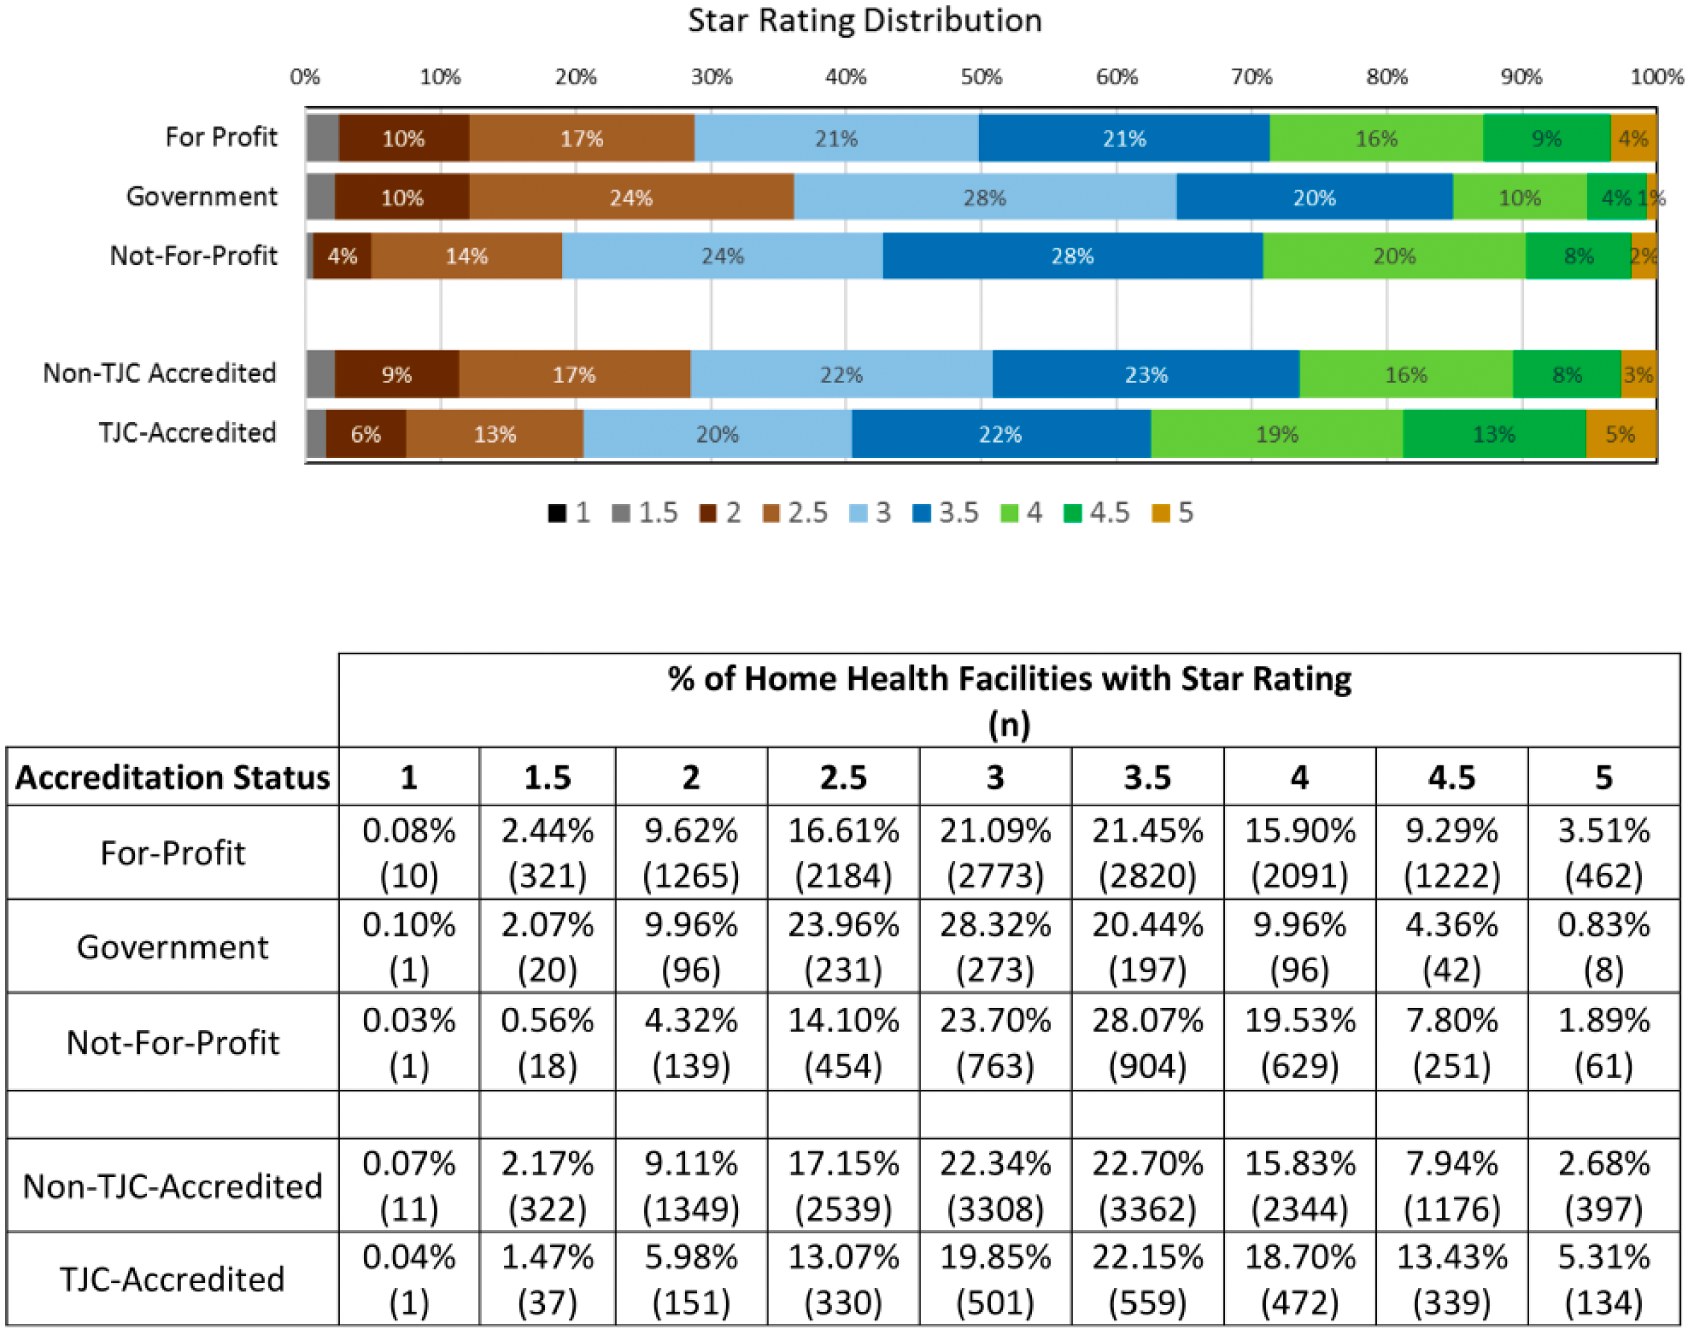
Distribution of home health agency star ratings by accreditation status (combined for 2014 and 2015).
TJC-accredited facilities had better average star ratings than non-TJC-accredited facilities for both years in which star ratings were available (3.4 vs. 3.2, p < .001). The distribution of star ratings by star rating category (e.g., 1 star, 1.5 stars, 2 stars . . . 4.5 stars, 5 stars) also favored TJC-accredited facilities over non–TJC-accredited facilities (see Figure 1). When categories were collapsed to evaluate differences, the analysis revealed that a significantly larger proportion of TJC-accredited facilities were clustered within the 4, 4.5, and 5 star ratings (p < .001), and fewer TJC-accredited organizations were clustered within the 1, 1.5, 2, and 2.5 star categories (p < .001).
A similar approach was taken to analyze differences between TJC-accredited and non–TJC-accredited home health agencies on the two claims-based outcome measures (See Table 2). TJC-accredited facilities had a statistically significant lower rate of home health patients who needed urgent, unplanned care in the ER without being admitted than non–TJC-accredited facilities across all 3 years (p < .001). The rate of home health patients who had to be admitted to the hospital was also lower for TJC-accredited facilities in all 3 years, but differences did not reach statistical significance.
Comparison of Claims-Based Outcome Measures by Accreditation Status.
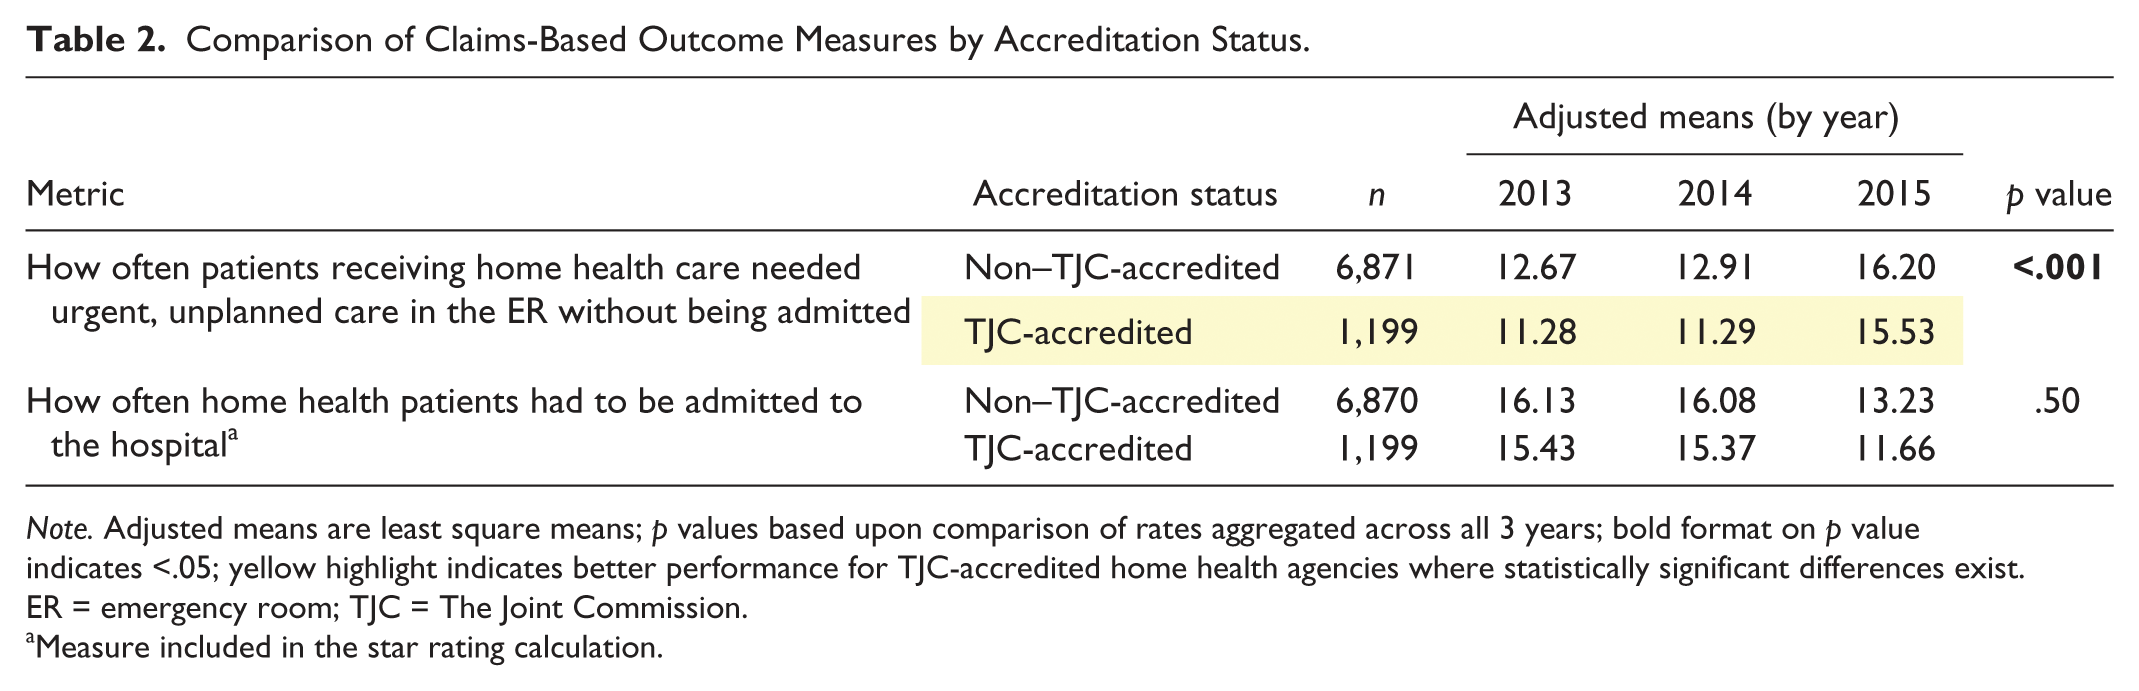
Note. Adjusted means are least square means; p values based upon comparison of rates aggregated across all 3 years; bold format on p value indicates <.05; yellow highlight indicates better performance for TJC-accredited home health agencies where statistically significant differences exist. ER = emergency room; TJC = The Joint Commission.
Measure included in the star rating calculation.
The HHC data set also provides a risk-adjusted designation of performance for facilities on each of the claims-based outcome measures. The designation indicates whether the facility is performing “better than expected,” the “same as expected,” or “worse than expected” on each measure. Compared with non–TJC-accredited organizations, TJC-accredited home health organizations had significantly higher proportions of organizations that performed “better than expected” and lower proportions of organizations that performed “worse than expected” (p < .001). These differences between TJC-accredited and non–TJC-accredited organizations were consistent across reporting years, despite changes in the risk model calculations.
Table 3 presents a comparison of 20 OASIS quality measures (13 process measures and seven outcome measures) included in the HHC data set. TJC-accredited organizations performed consistently better across all 3 years studied than nonaccredited home health agencies on 13 of 20 measures (10 process measures and three outcome measures; p < .05); non–TJC-accredited organizations performed better on a single outcome measure (How often patients got better at taking their drugs correctly by mouth; p < .001). Differences observed between TJC-accredited and non–TJC accredited facilities were consistent across the reporting years on 19 of 20 measures. The performance rates for one of 20 measures (How often patients’ wounds improved or healed after an operation) shifted directions across years with rates favoring TJC-accredited organizations in 2013 and favoring non–TJC-accredited organizations in 2014 and 2015. Not surprisingly, no statistically significant difference in aggregate rates was observed for that measure (p = .88).
Comparison of OASIS Process and Outcome Measures and Claims-Based Outcome Measures by Accreditation Status.
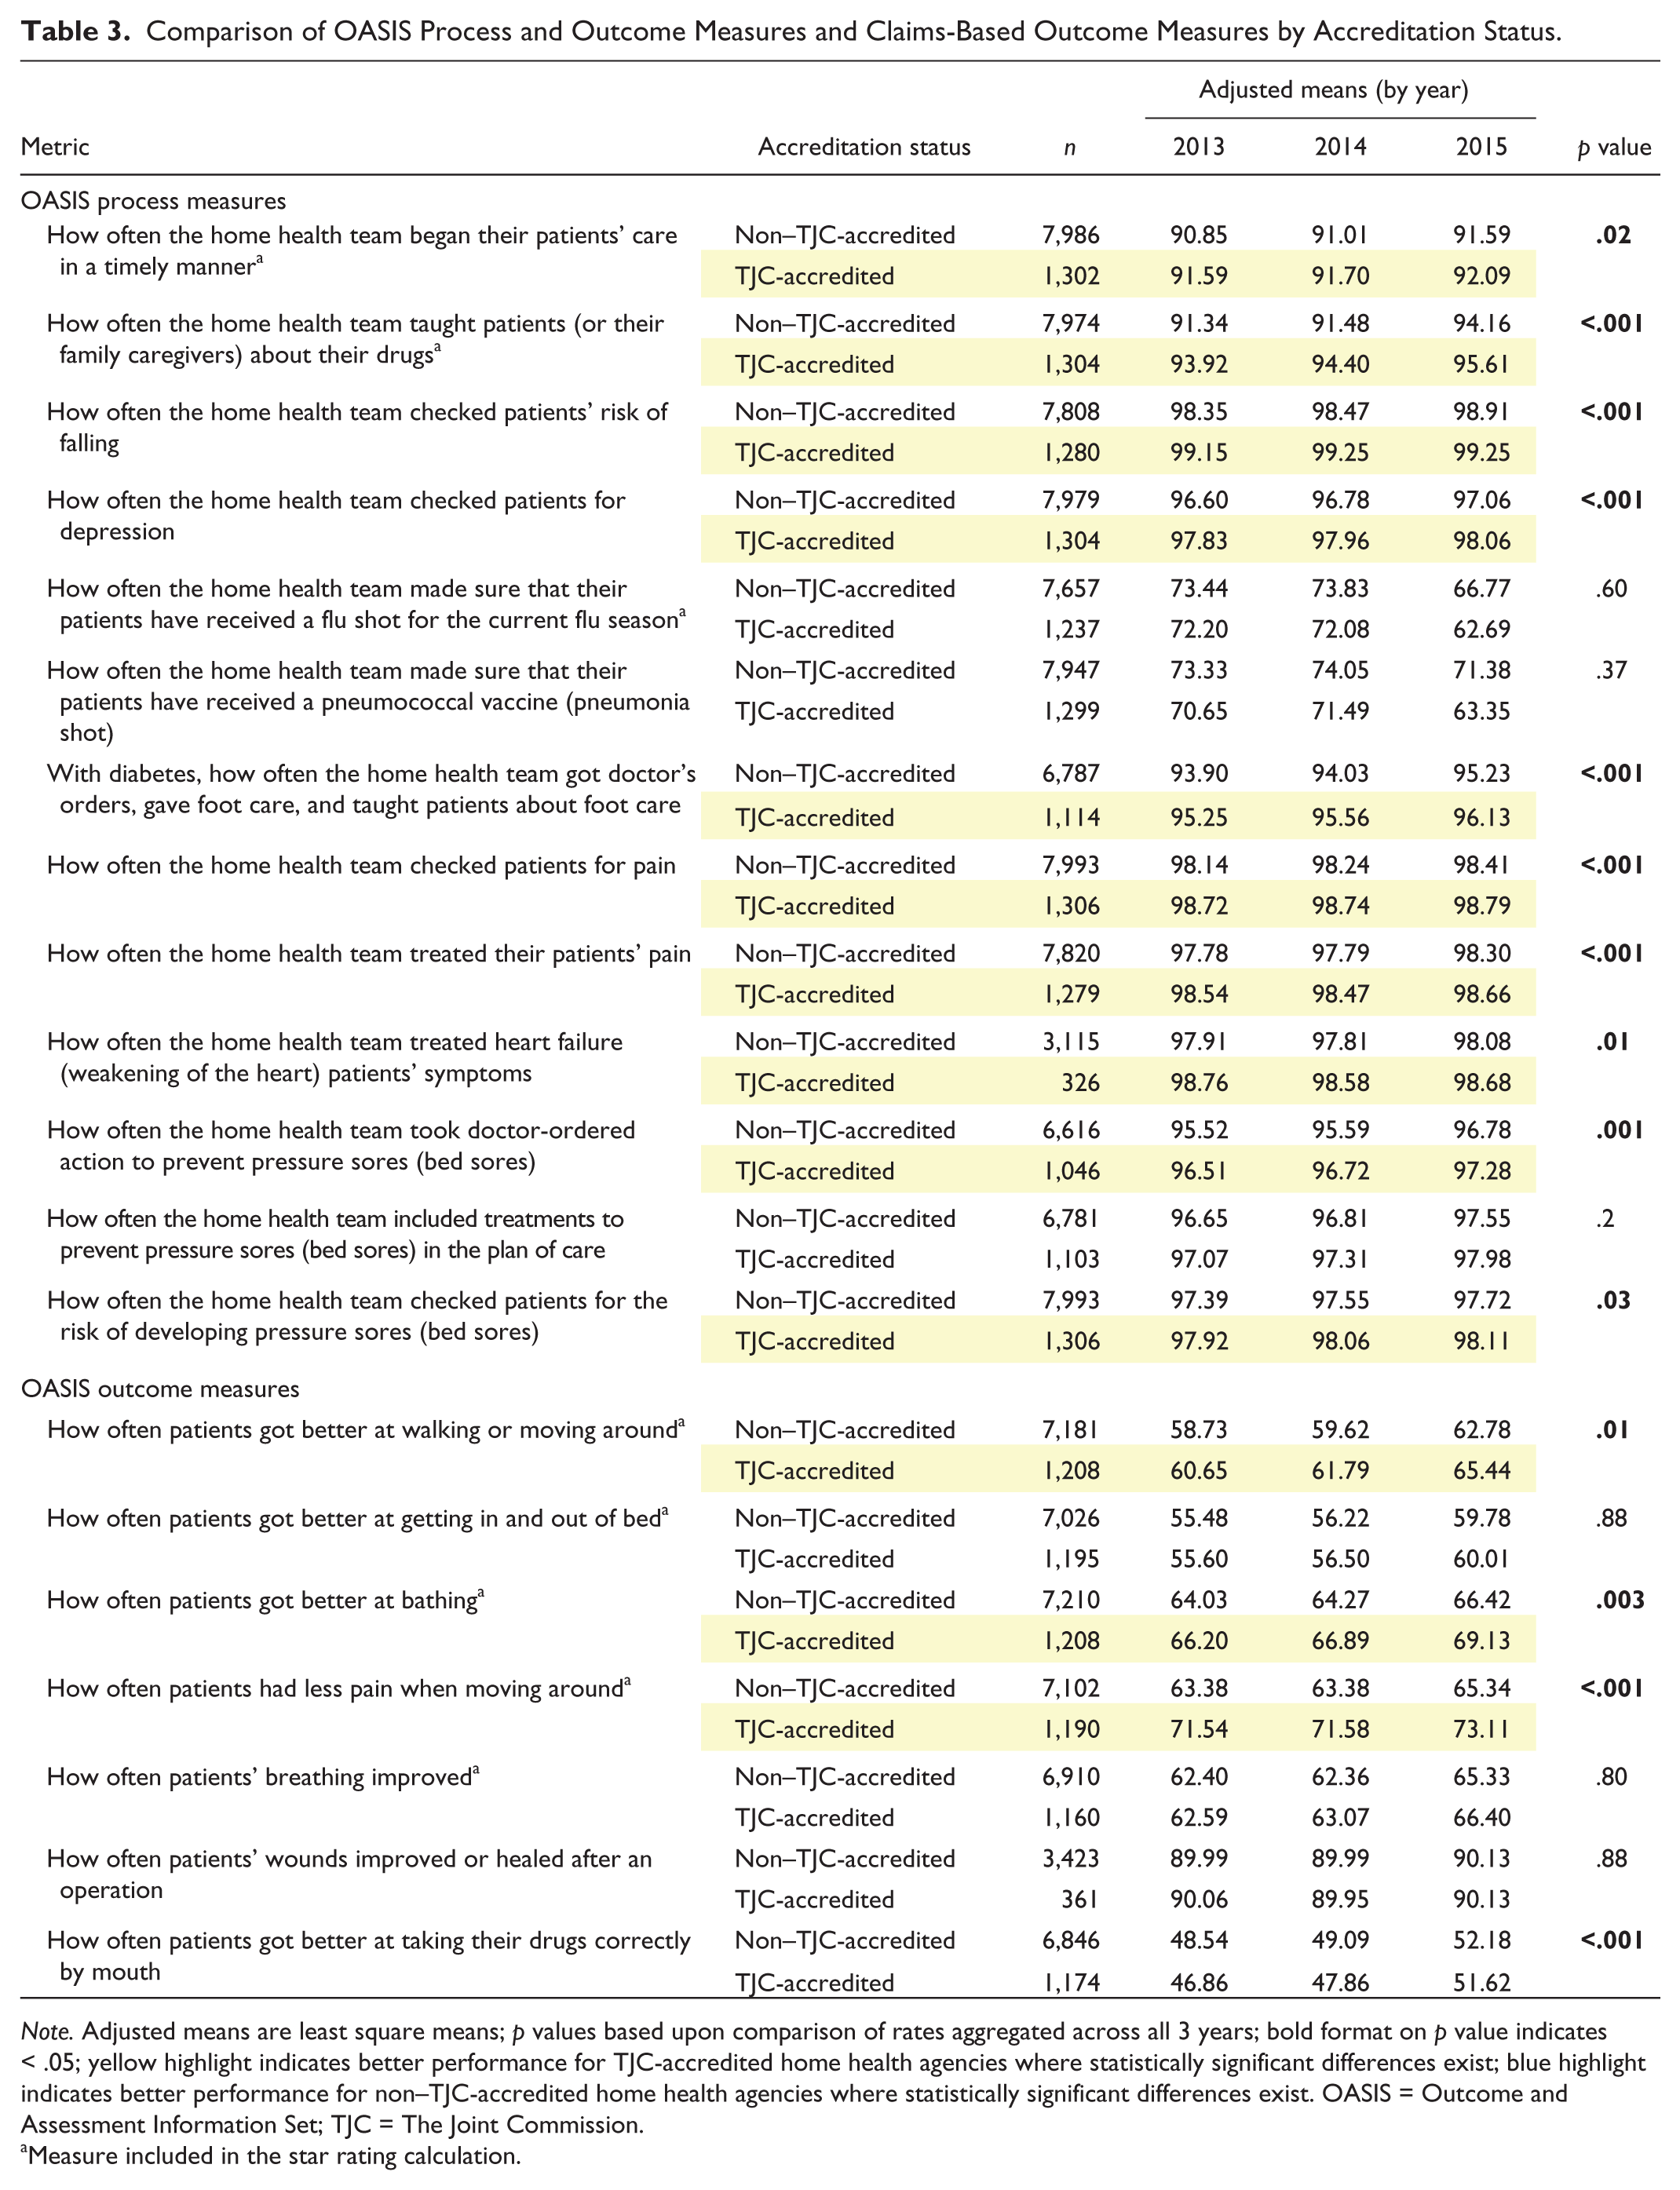
Note. Adjusted means are least square means; p values based upon comparison of rates aggregated across all 3 years; bold format on p value indicates < .05; yellow highlight indicates better performance for TJC-accredited home health agencies where statistically significant differences exist; blue highlight indicates better performance for non–TJC-accredited home health agencies where statistically significant differences exist. OASIS = Outcome and Assessment Information Set; TJC = The Joint Commission.
Measure included in the star rating calculation.
Discussion
TJC-accredited home health agencies performed statistically better than non–TJC-accredited home health agencies on multiple dimensions of care reported in the CMS HHC data set. These differences were consistently observed across multiple years. Differences in star ratings reflected a greater proportion of TJC-accredited facilities with 4, 4.5, and 5 star ratings and fewer 1, 1.5, 2, and 2.5 star ratings. While TJC-accredited agencies were somewhat more likely to be for-profit organizations and somewhat less likely to be not-for-profit or government-owned agencies, and the distributions of star ratings differed based upon ownership type, it is interesting to note that these differences did not account for differences observed between TJC-accredited and non–TJC-accredited agencies. TJC-accredited agencies had higher proportions of high-performing agencies than any of the comparison groups and rates of low-performing agencies that were similar to those of the lowest comparator (not-for-profit agencies).
Analysis of the 20 OASIS HHC quality measures, as well as the two claims-based measures, revealed that TJC-accredited facilities performed better on 14 of the 22 measures, whereas non–TJC-accredited organizations had superior performance on one of 22 measures. Among the measures included in the CMS star rating calculation, four of the nine were not associated with statistical differences related to accreditation.
While many of the comparisons between TJC-accredited and non–TJC-accredited facilities on the OASIS quality measures were statistically significant, these differences were typically very small. What is noteworthy, therefore, is not the size of the absolute difference observed for each individual measure but that these differences were so remarkably consistent over time (i.e., favoring accredited facilities). These results suggest that performance of home health care organizations follows a general pattern of findings in the literature, which show accredited organizations outperforming nonaccredited facilities using publicly available data sets in other health care settings including nursing homes,5,6,10,11,15,16 hospitals, 7 and behavioral health care organizations. 9
A clear explanation for why accredited health care organizations seem to perform better than nonaccredited organizations has not been established. One possible explanation for the findings relates to selection bias. Home health agencies that have greater resources (and are therefore better positioned to invest in accreditation) may already have superior quality to agencies that do not pursue accreditation. In contrast, another possible explanation, previously offered to explain differences observed in accredited nursing homes, is that accreditation standards establish expectations for improvement which can be used to drive changes in behavior, such as those that require leaders create and maintain a culture of safety. 17 It is also possible that accredited and nonaccredited facilities differ in other unmeasured confounding factors. While this study adjusted for the influences of broad categories of ownership type (e.g., for-profit, not-for-profit, and government affiliation), which have previously been shown to be related to home health agency quality,1,2 it did not adjust for other factors such as ownership subtypes (e.g., not-for-profit religious affiliation or state vs. local government ownership), payer mix, agency size, or financial status due to the lack of availability of the data for this study. It is possible that these factors or some set of previously unidentified factors would explain many of the differences currently associated with accreditation status. Unfortunately, longitudinal research that tracks the impact of accreditation (before, during, and after the accreditation process is complete) is needed to shed light on these explanations, 18 but this research is rarely available beyond individual case studies.19,20
Finally, while not directly related to the focus of this study, analysis of the OASIS quality measure data revealed an interesting finding related to the vaccination measures. Rates on the majority of OASIS process and outcome measures were relatively stable from year to year, generally showing small but steady improvement each year, independent of accreditation status. The only exception to this trend was observed for the two vaccination measures. Between 2014 and 2015, vaccination rates decreased significantly, and by several absolute percentage points. We were unable to find a published explanation for this decrease, although the data collection specifications for the influenza vaccination measure were changed starting in 2015. No such adjustment was made to the pneumococcal measure, however, suggesting that the 2015 decrease in vaccination rates may be worth exploring in future research.
Conclusion
TJC–accredited home health agencies had better performance than non–TJC-accredited agencies on CMS star ratings and across a broad range of process and outcome measures available in the CMS HHC data set. This relationship between accreditation and home health agency quality is consistent with findings in other health care settings, including hospitals, nursing homes, and behavioral health care organizations. The underlying factors associated with these differences are not well established, and additional research is needed to explore the specific mechanisms that lead to better quality and safety.
Footnotes
Declaration of Conflicting Interests
The author(s) declared no potential conflicts of interest with respect to the research, authorship, and/or publication of this article.
Funding
The author(s) received no financial support for the research, authorship, and/or publication of this article.