
Abstract
Dysmetabolic states, such as type 2 diabetes (T2D), characterized by insulin resistance (IR), are associated with fatty liver, increased cardiovascular disease (CVD) risk, and decreased functional exercise capacity (FEC). Rosiglitazone (RO) improves exercise capacity and IR in T2D. However, the effects of RO on FEC and other markers of CVD risk in prediabetes are unknown. We hypothesized that insulin sensitization with RO would improve exercise capacity and markers of CVD risk in participants with impaired glucose tolerance (IGT). Exercise performance (peak oxygen consumption and oxygen uptake kinetics), IR (homeostasis model assessment of IR and quantitative insulin sensitivity check index), and surrogate cardiovascular endpoints (coronary artery calcium (CAC) volume and density and C-reactive protein (CRP)) were measured in participants with IGT after 12 and 18 months of RO or placebo (PL). RO did not significantly improve exercise capacity. Glycemic measures and IR were significantly lower in people on RO compared to PL at 18 months. CAC volume progression was not different between PL and RO groups. RO did not improve exercise capacity during an 18-month intervention despite improved IR and glycemia in people with IGT. Future studies should explore why effects on FEC with RO occur in T2D but not IGT. Understanding these questions may help in targeting therapeutic approaches in T2D and IGT.
Keywords
RO improves exercise capacity and IR in people with T2D. However, the effects of prediabetes on exercise capacity and of RO on exercise capacity and markers of cardiovascular risk in prediabetes are unknown.
While RO improved IR in people with IGT, it did not improve exercise capacity. These findings suggest that other factors are implicated in reduced exercise capacity in people with IGT and T2D.
This study implies that the reduced exercise capacity in pre-diabetes does not improve with the improvement in IR seen with thiazolidinedione (TZD) treatment. Further research should assess other factors that may impact exercise capacity in this population at high risk of progression to diabetes; such knowledge may inform risk assessment and therapeutic approach.
Introduction
Cardiovascular disease (CVD) remains a leading cause of morbidity and mortality in individuals with type 2 diabetes (T2D). Despite overall reduced CVD mortality in recent decades, the relative risk of death from CVD in T2D remains two to four times higher than in populations without diabetes.1,2 People with prediabetes are also at increased CVD risk.3,4 Prevention of prediabetes progression to T2D remains an important strategy for preventing microvascular and macrovascular complications of T2D. 5
Our group and others have demonstrated impairment in maximal and submaximal exercise, manifested by reduced peak oxygen consumption (VO2peak) and slowed oxygen uptake (VO2) kinetics, among individuals with T2D, compared with age, weight, and activity-matched controls.6–8 Lower exercise performance in T2D is clinically significant based on the strong association between fitness and mortality in T2D.9,10 Interventions that improve functional exercise capacity (FEC) in individuals with T2D include the insulin-sensitizing agent, rosiglitazone (RO)11–13 and multiple forms of exercise training. 14 Given the RO-responsiveness of FEC and the consistent association between insulin sensitivity and FEC in T2D, we hypothesized that RO might also improve FEC in prediabetes, a stage at which increased physical activity has great potential for delaying T2D onset and ameliorating CVD risk. 15 Coronary artery calcium (CAC) volume16,17 scores correlate (positively and inversely, respectively) with atherosclerotic burden and CVD risk. These interrelated assessments are accepted non-invasive measures of subclinical atherosclerosis based upon their utility as independent predictors of CVD events and CVD-related mortality across several study populations, including T2D.18–23 We hypothesized that 18 months of insulin sensitization with RO would improve FEC and markers of CVD risk in participants with impaired glucose tolerance (IGT), a form of prediabetes.
Materials and methods
Participants
The study was approved by the Colorado Multiple Institutional Review Board. All participants provided written informed consent prior to participation.
Study population
Participants were recruited from a community primary care practice setting. Inclusion criteria were diagnosis of IGT (75-g 2-h glucose of 140–199 mg/dL), age 25–75, fasting plasma glucose (FPG) <125 mg/dL, glycosylated hemoglobin (HbA1c) <6.5%, body mass index (BMI) 25–40 kg/m2, and physically inactive lifestyle (participating in ≤one bout of low-to-moderate intensity exercise/week, confirmed by low-level physical activity recall (LOPAR) questionnaire). 6 Exclusion criteria included breastfeeding, current/planned pregnancy, concurrent use of hormonal contraception or hormone therapy, clinically significant hepatic disease or liver function test levels >two times the upper limit of normal, history of hypersensitivity to thiazolidinediones (TZDs), any contraindication to RO, angina, New York Heart Association class 3/4 congestive heart failure requiring drug therapy, systolic blood pressure >160 mmHg or diastolic blood pressure >100 mmHg, active alcohol or drug abuse, chronic disease requiring periodic treatment with oral or intravenous corticosteroids, current smoking, and inability to adhere to protocol requirements. Additionally, participants were excluded if any clinically significant abnormality identified during the screening physical examination, laboratory tests, or electrocardiogram was felt to preclude safe study completion. Female participants were using effective barrier contraceptive measures, surgically sterile, or postmenopausal, and those of childbearing potential had a documented negative urine pregnancy test before all electron beam computed tomography (EBCT) measurements.
Primary outcomes were defined as FEC, measured by VO2peak, and CAC volume. Secondary outcomes were measures of adiposity (BMI, waist circumference, body fat percentage, adipose tissue volume in subcutaneous, visceral, and pericardial spaces), physical activity (LOPAR), glycemia/insulin sensitivity (HbA1c, FPG, 2-h oral glucose tolerance test (2h OGTT), homeostasis model assessment of insulin resistance (IR) (HOMA-IR), quantitative insulin sensitivity check index (QUICKI)), liver function measures (AST, ALT, GGT), and inflammation (high sensitivity C-reactive protein (hsCRP), interleukin-6 (IL-6)).
Screening visits
Participants with FPG >95 mg/dL at routine clinic visits were consented to participate in the study, followed by a 2h OGTT conducted as per Diabetes Prevention Program (DPP) protocol. 24 If the OGTT returned abnormal (2-h post-prandial plasma glucose 140–199 mg/dL), it was repeated a second time within 7–10 days after the initial OGTT. If the 2-h post-prandial glucose at the second OGTT was 130–139 mg/dL, participants were allowed to repeat the OGTT once more. At the time of the second OGTT, labs were obtained, including liver function measures, HbA1c, insulin, c-peptide, and glucose level to calculate HOMA-IR and QUICKI, lipid panel, and measures of inflammation (hsCRP, IL-6). All labs were performed via Quest Diagnostics (www.questdiagnostics.com). If the second OGTT returned abnormal, participants were scheduled for randomization, EBCT, and exercise testing.
Randomization, intervention, and measurements
Randomization to RO 4 mg or a placebo (PL) pill once daily in a double-blinded fashion (investigator and participant) was performed by the Denver Veterans Affairs (VA) research pharmacy. At randomization, participants met with a dietitian for instruction on an American Diabetes Association diet to maintain body weight for the study duration and were encouraged to perform 30 min of moderate exercise at least 5 days/week. The importance of the diet and exercise regimen was reinforced at each visit. The primary study physician and coordinators were blinded to glucose values. A timeline of study visits and procedures is outlined in Figure 1. Participants were followed every two months for the first six months and then every three months for the remainder of the study. Participants were instructed to fast and not take the study medication for each of the ten outpatient study visits. Labs were repeated at visits 8 and 10. A telephone visit was completed one month after the 18-month visit to collect adverse event information.
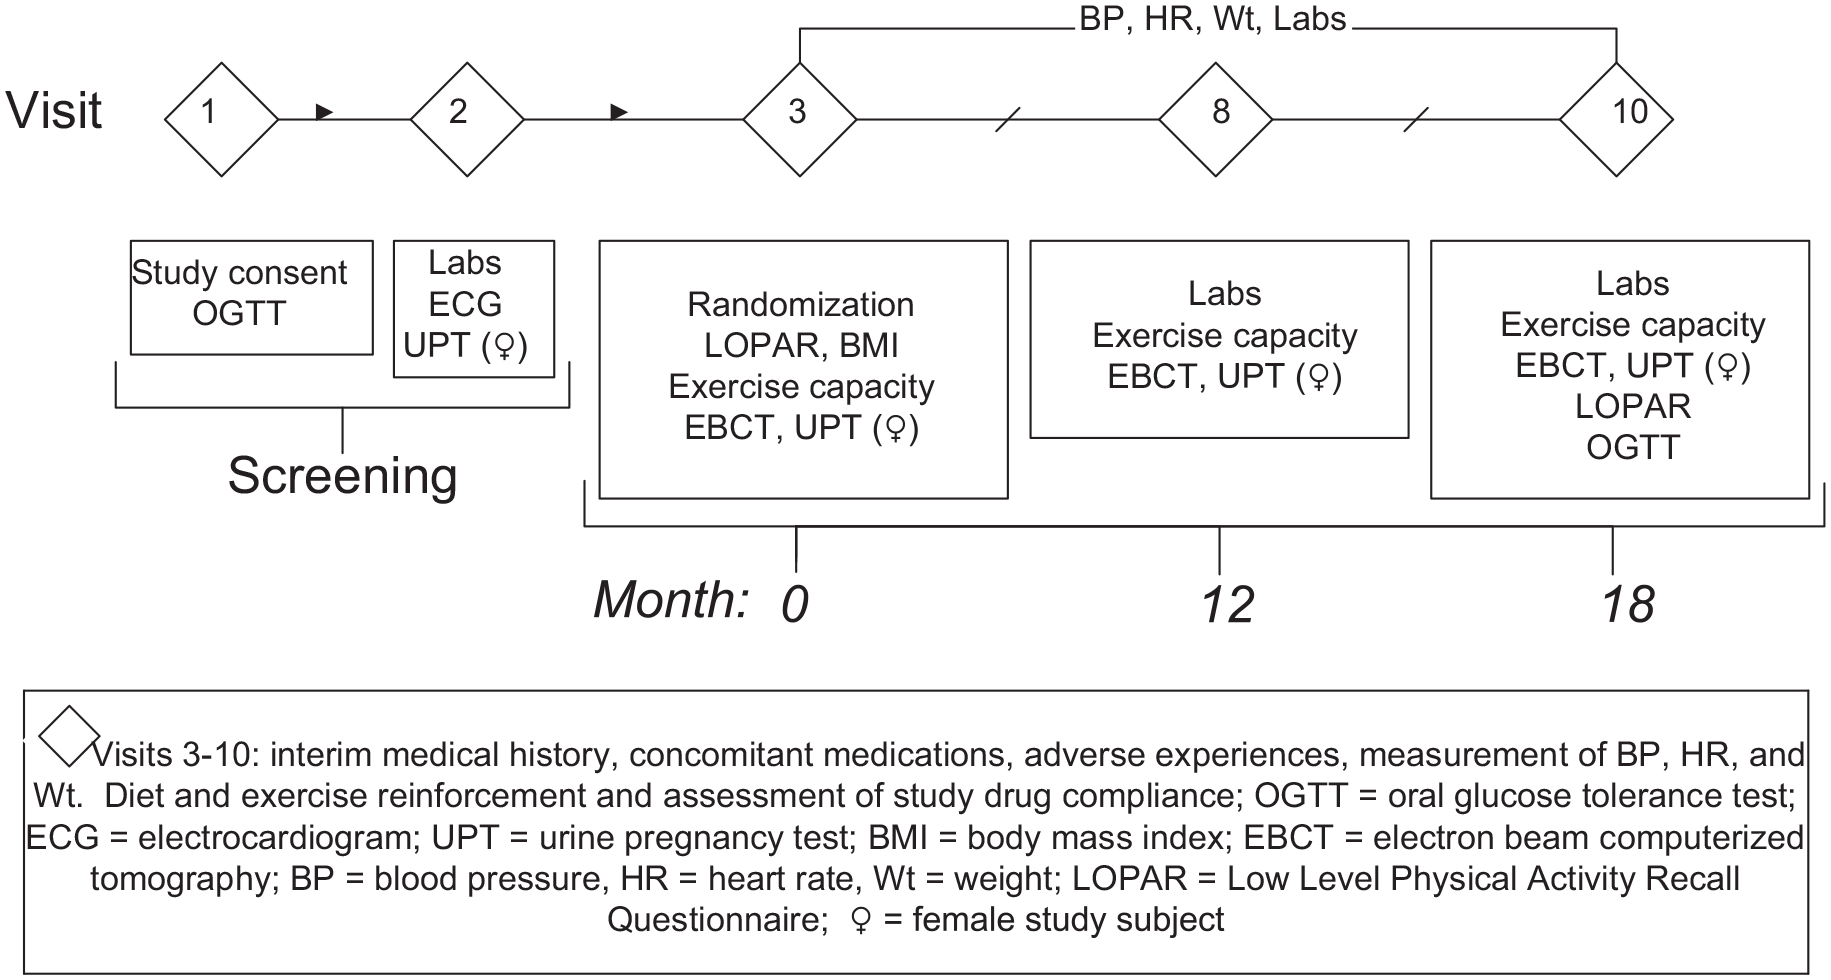
Diagram of study visit flow.
Exercise testing
All participants completed bicycle ergometry exercise testing, including a graded protocol to exhaustion and a constant workload test at entry, 12 months, and 18 months. For all exercise tests, VO2 and carbon dioxide production (VCO2) were measured, breath-by-breath, at rest and during exercise on a cycle ergometer (Medgraphics, Minneapolis, MN, USA) while breathing into the mouthpiece of the metabolic cart (Medgraphics CPX/D, Medical Graphics Corp., St. Paul, MN, USA).12,25 Arm blood pressure and heart rate were obtained every minute during exercise. Cardiac status was continuously monitored throughout each test by a 12-lead electrocardiogram. The respiratory exchange ratio (RER) was calculated as VCO2/VO2. Exercise tests were performed at the same visit and were spread out to ensure participants had returned to resting heart rate before the start of the next test. All exercise testing was done within a single lab and interpreted by this lab.
Graded exercise test—To determine VO2peak and ventilatory threshold, a graded bicycle protocol to exhaustion was carried out as previously reported. 8 Work load was increased by 10–25 watts/min (according to subject ability) to bring the participant to maximal exercise capacity between 8 and 12 min. The ventilatory threshold was identified using the V-slope method. The RER ≥ 1.1 was used to confirm a valid VO2peak result.
Constant-load tests—Oxygen uptake kinetic values were obtained as described previously. 8 Briefly, each test consisted of measurements at rest, during unloaded cycling, and finally cycling at a pre-selected workload (85% of individual ventilatory threshold) for 6 min to ensure achievement of steady state. This workload was performed once, and the mean response time for the increase in VO2 (MRT; the exponential time constant of VO2 onset kinetics approximating the time needed to reach 63% of steady-state VO2 26 ) was calculated.
CAC measurement
CAC volume was assessed by EBCT with a 100-ms exposure (Imatron C-150, San Francisco, CA, USA) and completed at a single site with two studies done 5 min apart to improve reliability. CAC measures were obtained at baseline, 12 and 18 months using a standard acquisition protocol. 27 We report a square root transformation of CAC volume to reduce the heterogeneity of the variance. The change in square root volume from baseline was calculated for 12 and 18 months and was compared by treatment group over time. Imaging was interpreted by a single investigator.
Adipose tissue volume measurement
Visceral adipose tissue (VAT) and subcutaneous adipose tissue (SAT) volumes were measured by a single trained reader using a single 6-mm-thick image at L4-L5 on EBCT scans taken at baseline, 12 and 18 months during suspended respiration, as has been previously described. 28 Pericardial adipose tissue (PAT) volume was assessed by a single trained reader from EBCT scans taken at baseline, 12 and 18 months using Analyze Direct version 11.0 volume analysis software (Mayo Clinic, Minneapolis, MN, USA), as has been previously described. 29
Statistical methods
At the time of study design, no previous studies had been performed testing the impact of TZDs on FEC or EBCT measures in people with IGT. Therefore, this was a pilot study intended to provide preliminary data. As such, we estimated the sample size based on prior studies of the effect of RO on FEC in patients with T2D.12,13 We assumed a standard deviation of 2 mL/kg for the change in VO2peak, a standard deviation of 5 mL/kg for baseline VO2peak, and a correlation of −0.17 between baseline VO2peak and change in VO2peak. To detect a mean difference of 3 mL/kg change in VO2peak among the treatment groups with a power of 0.91 with a Type I error rate of 0.04, 10 participants were needed per treatment group. We expected 25% attrition over the course of the study. Therefore, our targeted sample size was 13–16 participants per group.
Statistical analysis
Data were analyzed for normality, and non-normally distributed variables were transformed for analysis. IL-6 and hsCRP were log-transformed. The square root of the CAC volume was used for analysis to reduce the variance, as reported previously. 30 Metabolic measures, exercise data, CAC volume, and adipose tissue volume were compared univariately by treatment group at baseline using Student’s t-test for continuous variables and chi-square test for categorical data. Comparisons of primary and secondary outcomes over time were made by treatment group using repeated measures mixed models, adjusted for BMI due to baseline differences in BMI by group. Unadjusted models were also examined for primary outcomes (VO2peak and square root CAC volume), and visit time point (baseline and 12- and 18-month) by treatment group interactions were evaluated. Primary and secondary outcomes are reported by group as least square means and standard errors from the repeated measures mixed models. A sensitivity analysis was performed for the primary outcomes, examining the change from baseline at 12 and 18 months, adjusted for the baseline value. A p-value < 0.05 was considered statistically significant. We used the CONSORT checklist when writing our report. 31
Results
Baseline characteristics
Protocol was performed without deviations. There were 40 participants randomized (20 per group). Nineteen participants with complete data in each group were included in the analysis (Figure 2). Demographic, clinical, and biochemical data at entry are provided in Table 1. Despite careful randomization procedures, the PL group had higher BMI than the RO group at baseline (Table 1). Baseline physical activity, age, blood pressure, and biochemical CVD markers (CRP, interleukin-6, cholesterol panel, and liver transaminases) were similar between groups. Given this baseline difference in BMI, results were adjusted for BMI in Table 2.
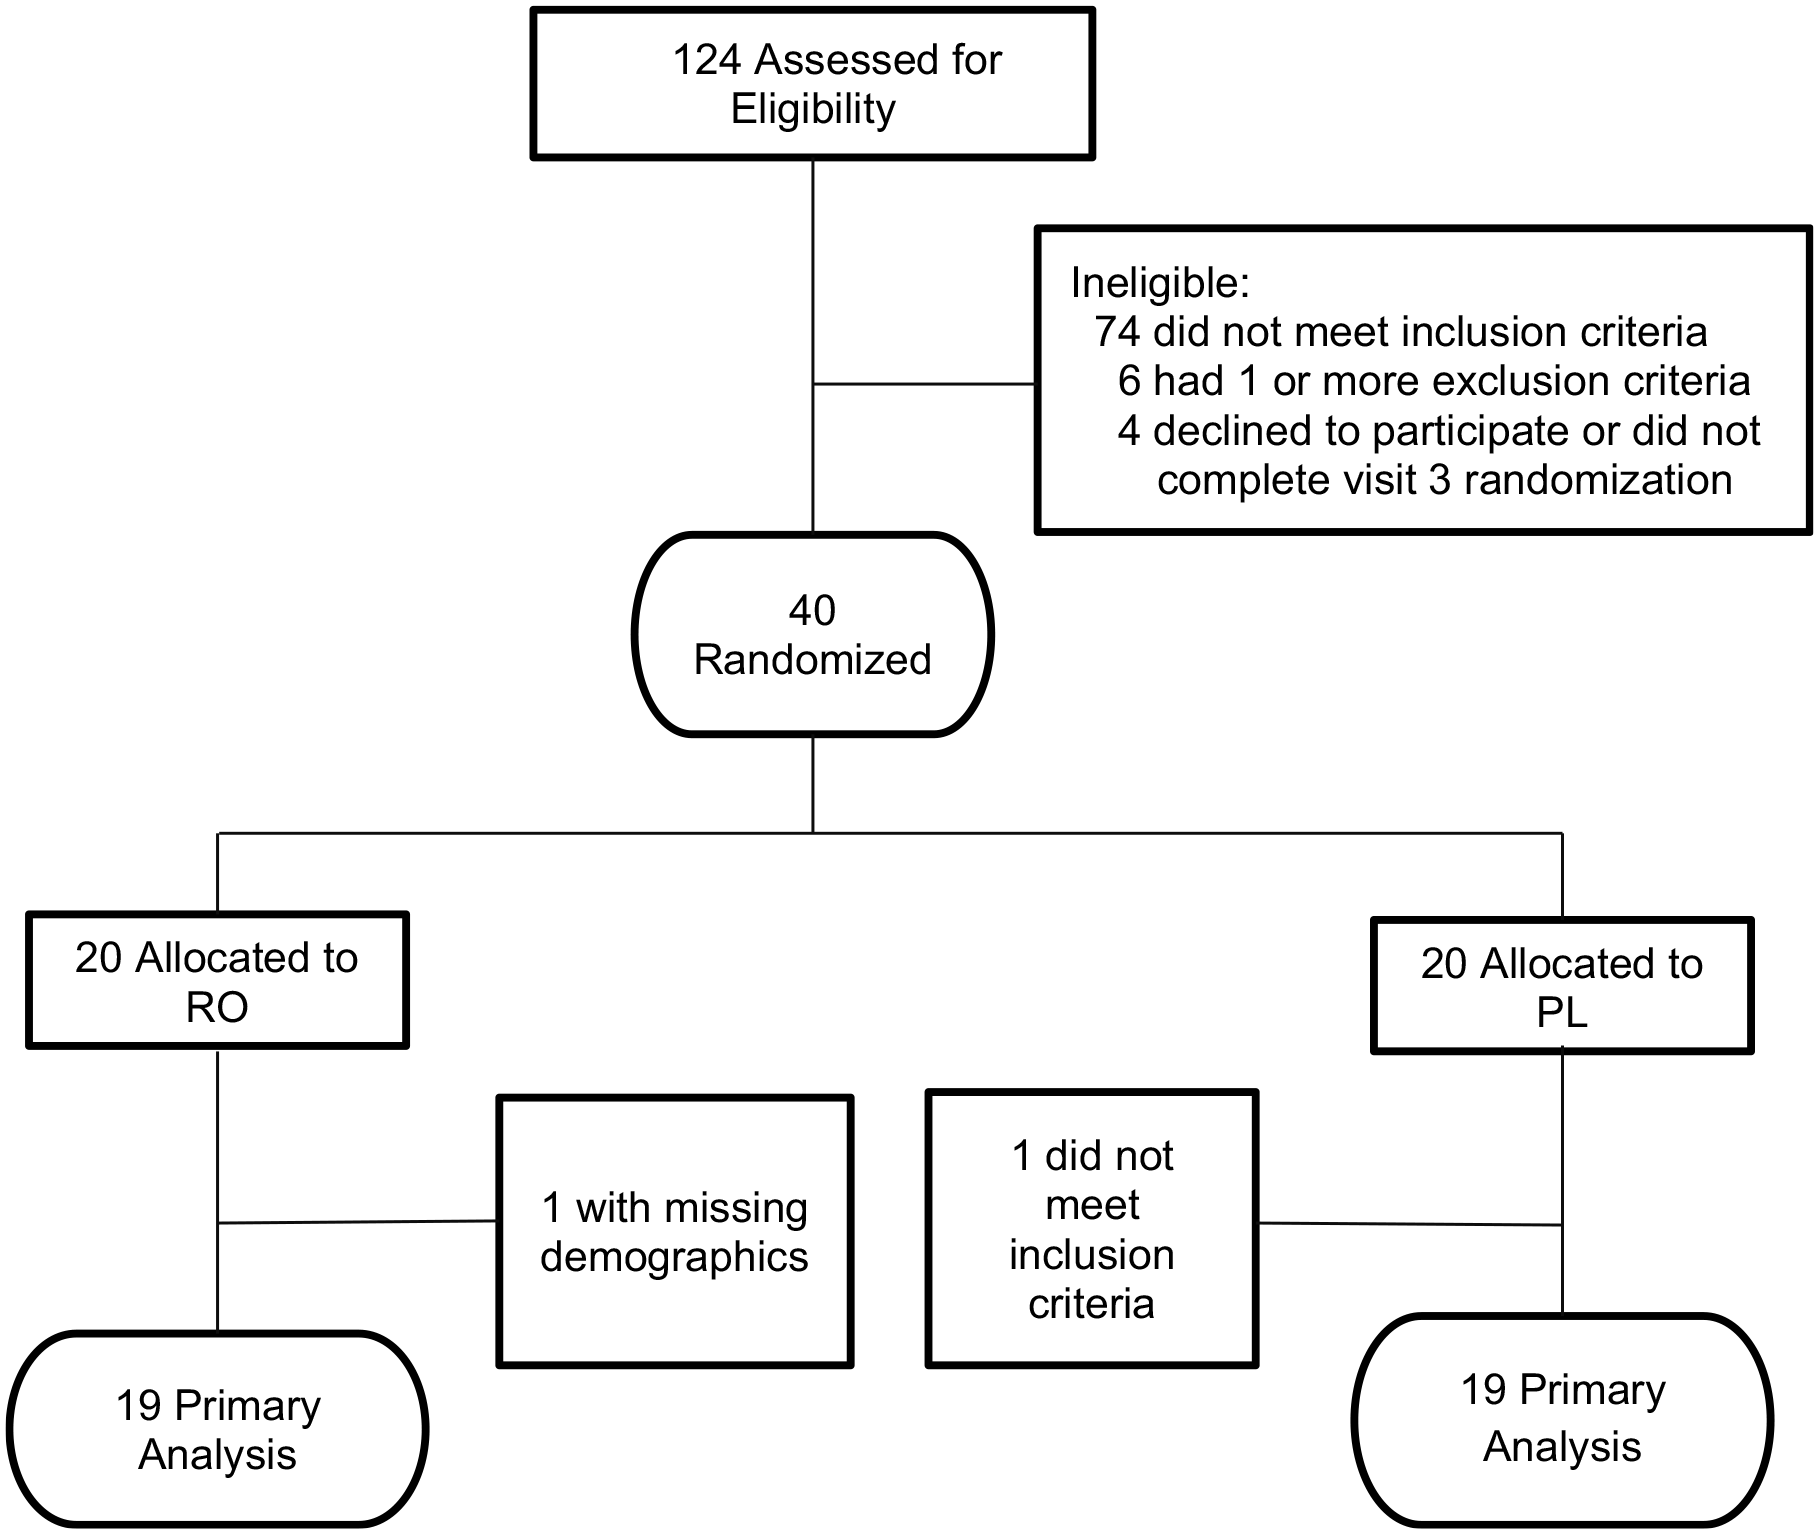
Enrollment flowchart.
Baseline characteristics.
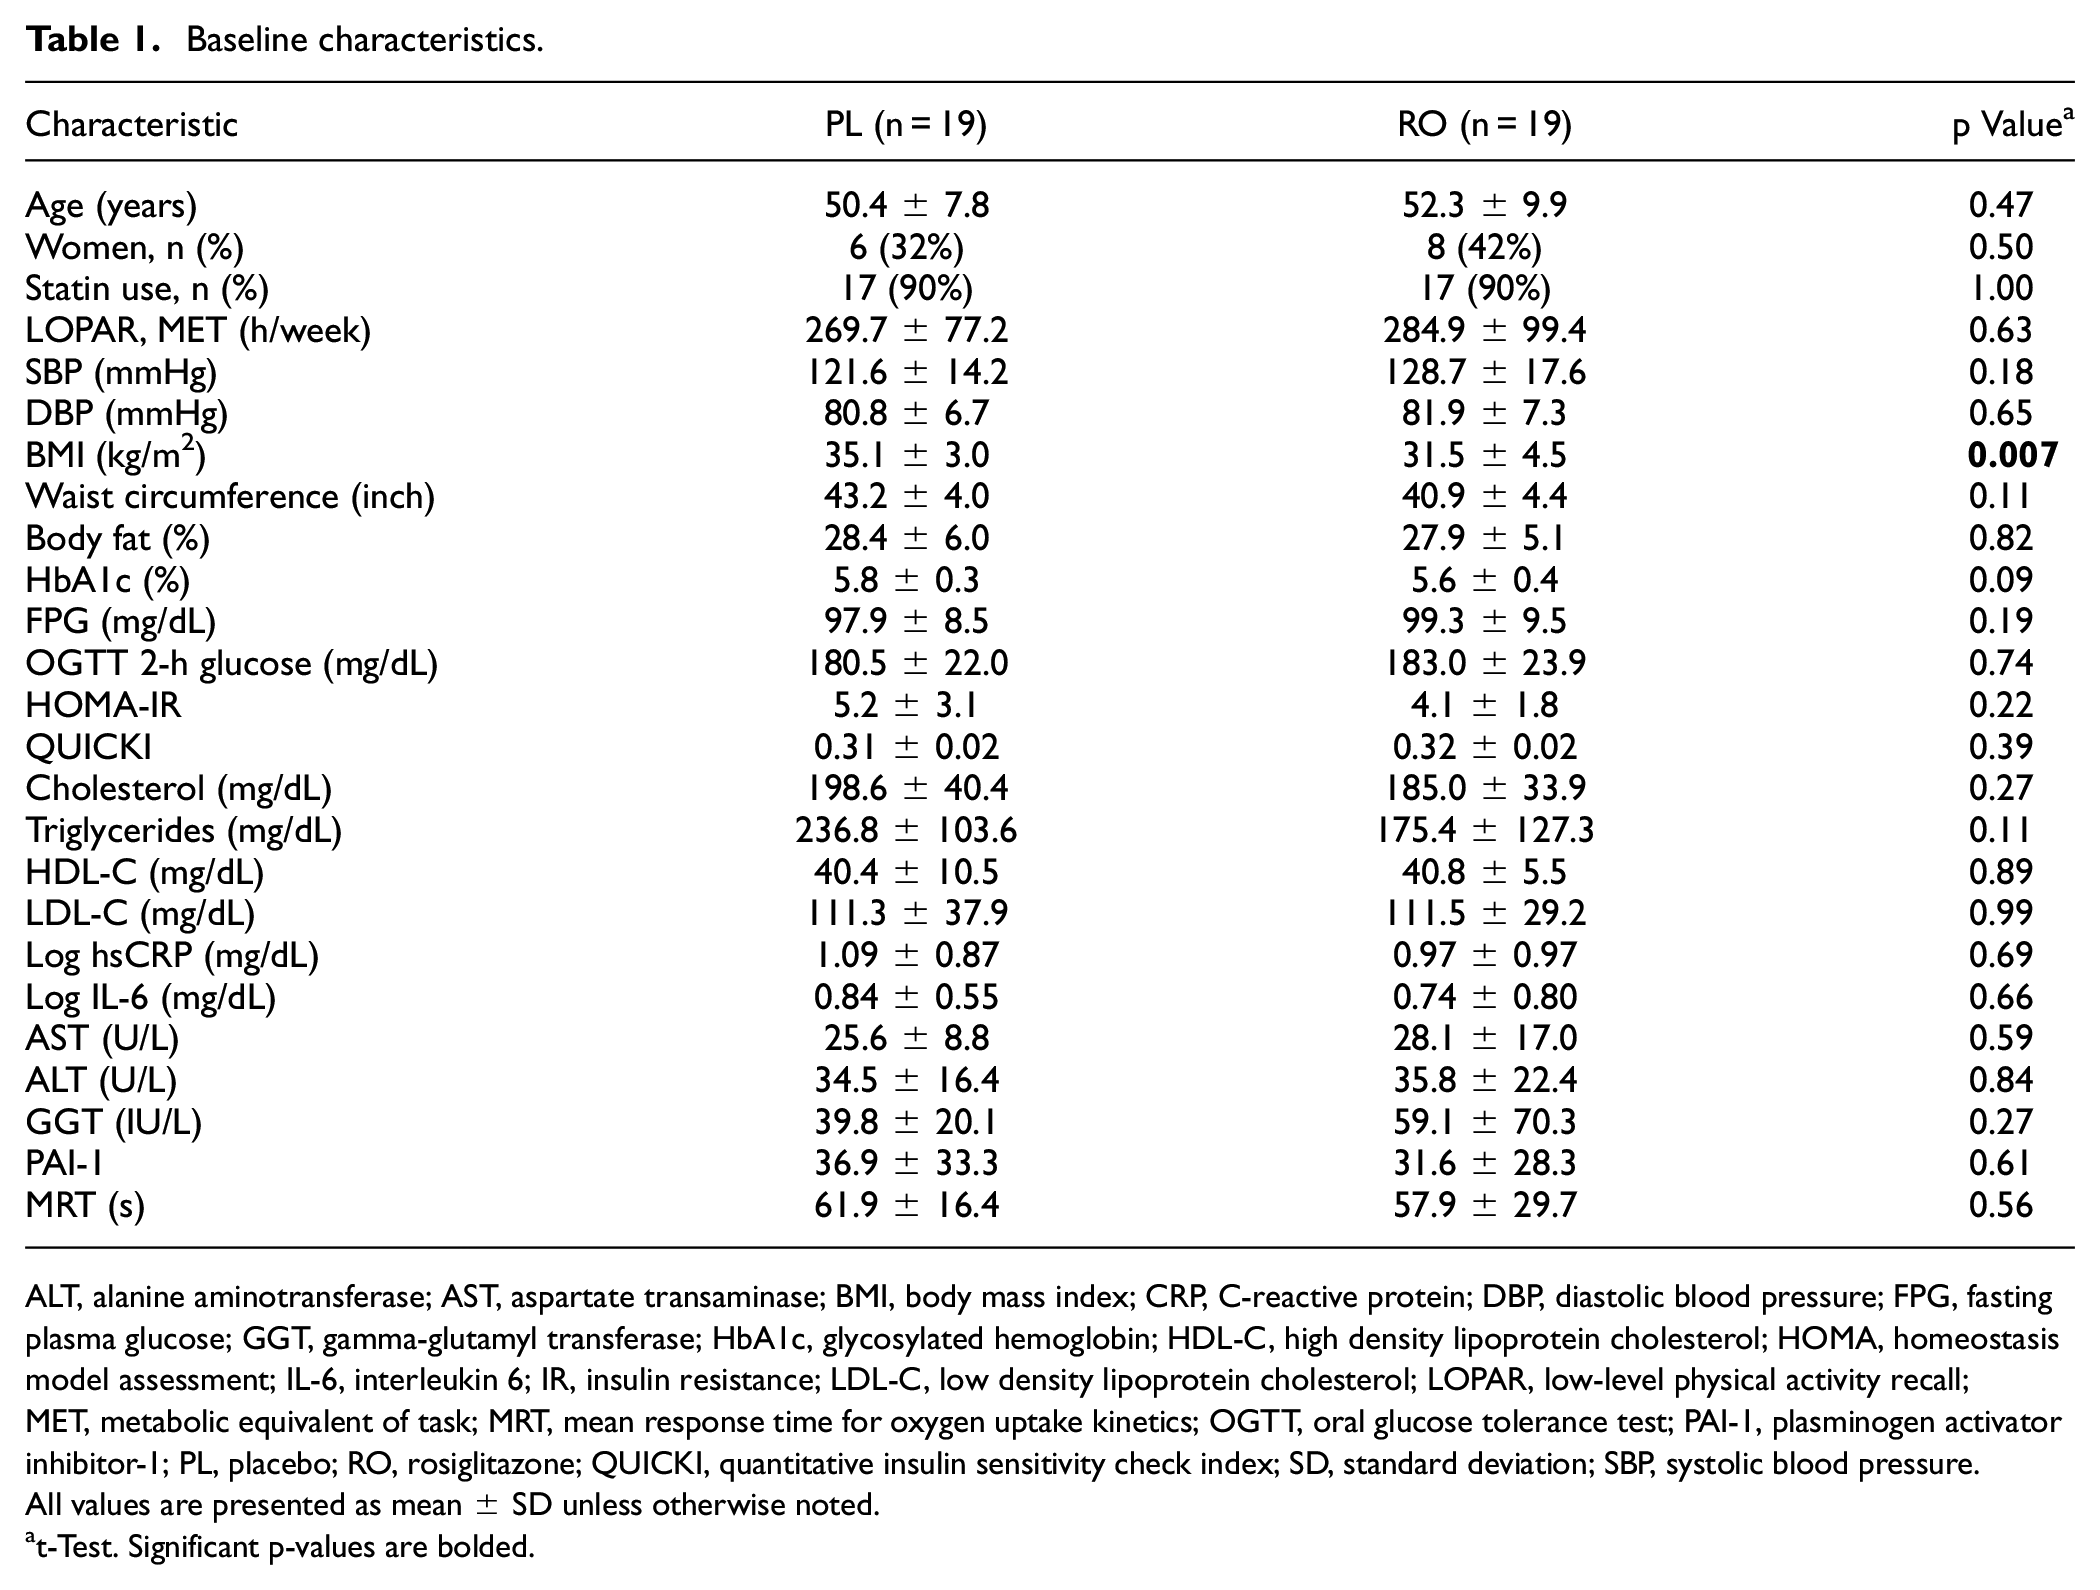
ALT, alanine aminotransferase; AST, aspartate transaminase; BMI, body mass index; CRP, C-reactive protein; DBP, diastolic blood pressure; FPG, fasting plasma glucose; GGT, gamma-glutamyl transferase; HbA1c, glycosylated hemoglobin; HDL-C, high density lipoprotein cholesterol; HOMA, homeostasis model assessment; IL-6, interleukin 6; IR, insulin resistance; LDL-C, low density lipoprotein cholesterol; LOPAR, low-level physical activity recall; MET, metabolic equivalent of task; MRT, mean response time for oxygen uptake kinetics; OGTT, oral glucose tolerance test; PAI-1, plasminogen activator inhibitor-1; PL, placebo; RO, rosiglitazone; QUICKI, quantitative insulin sensitivity check index; SD, standard deviation; SBP, systolic blood pressure.
All values are presented as mean ± SD unless otherwise noted.
t-Test. Significant p-values are bolded.
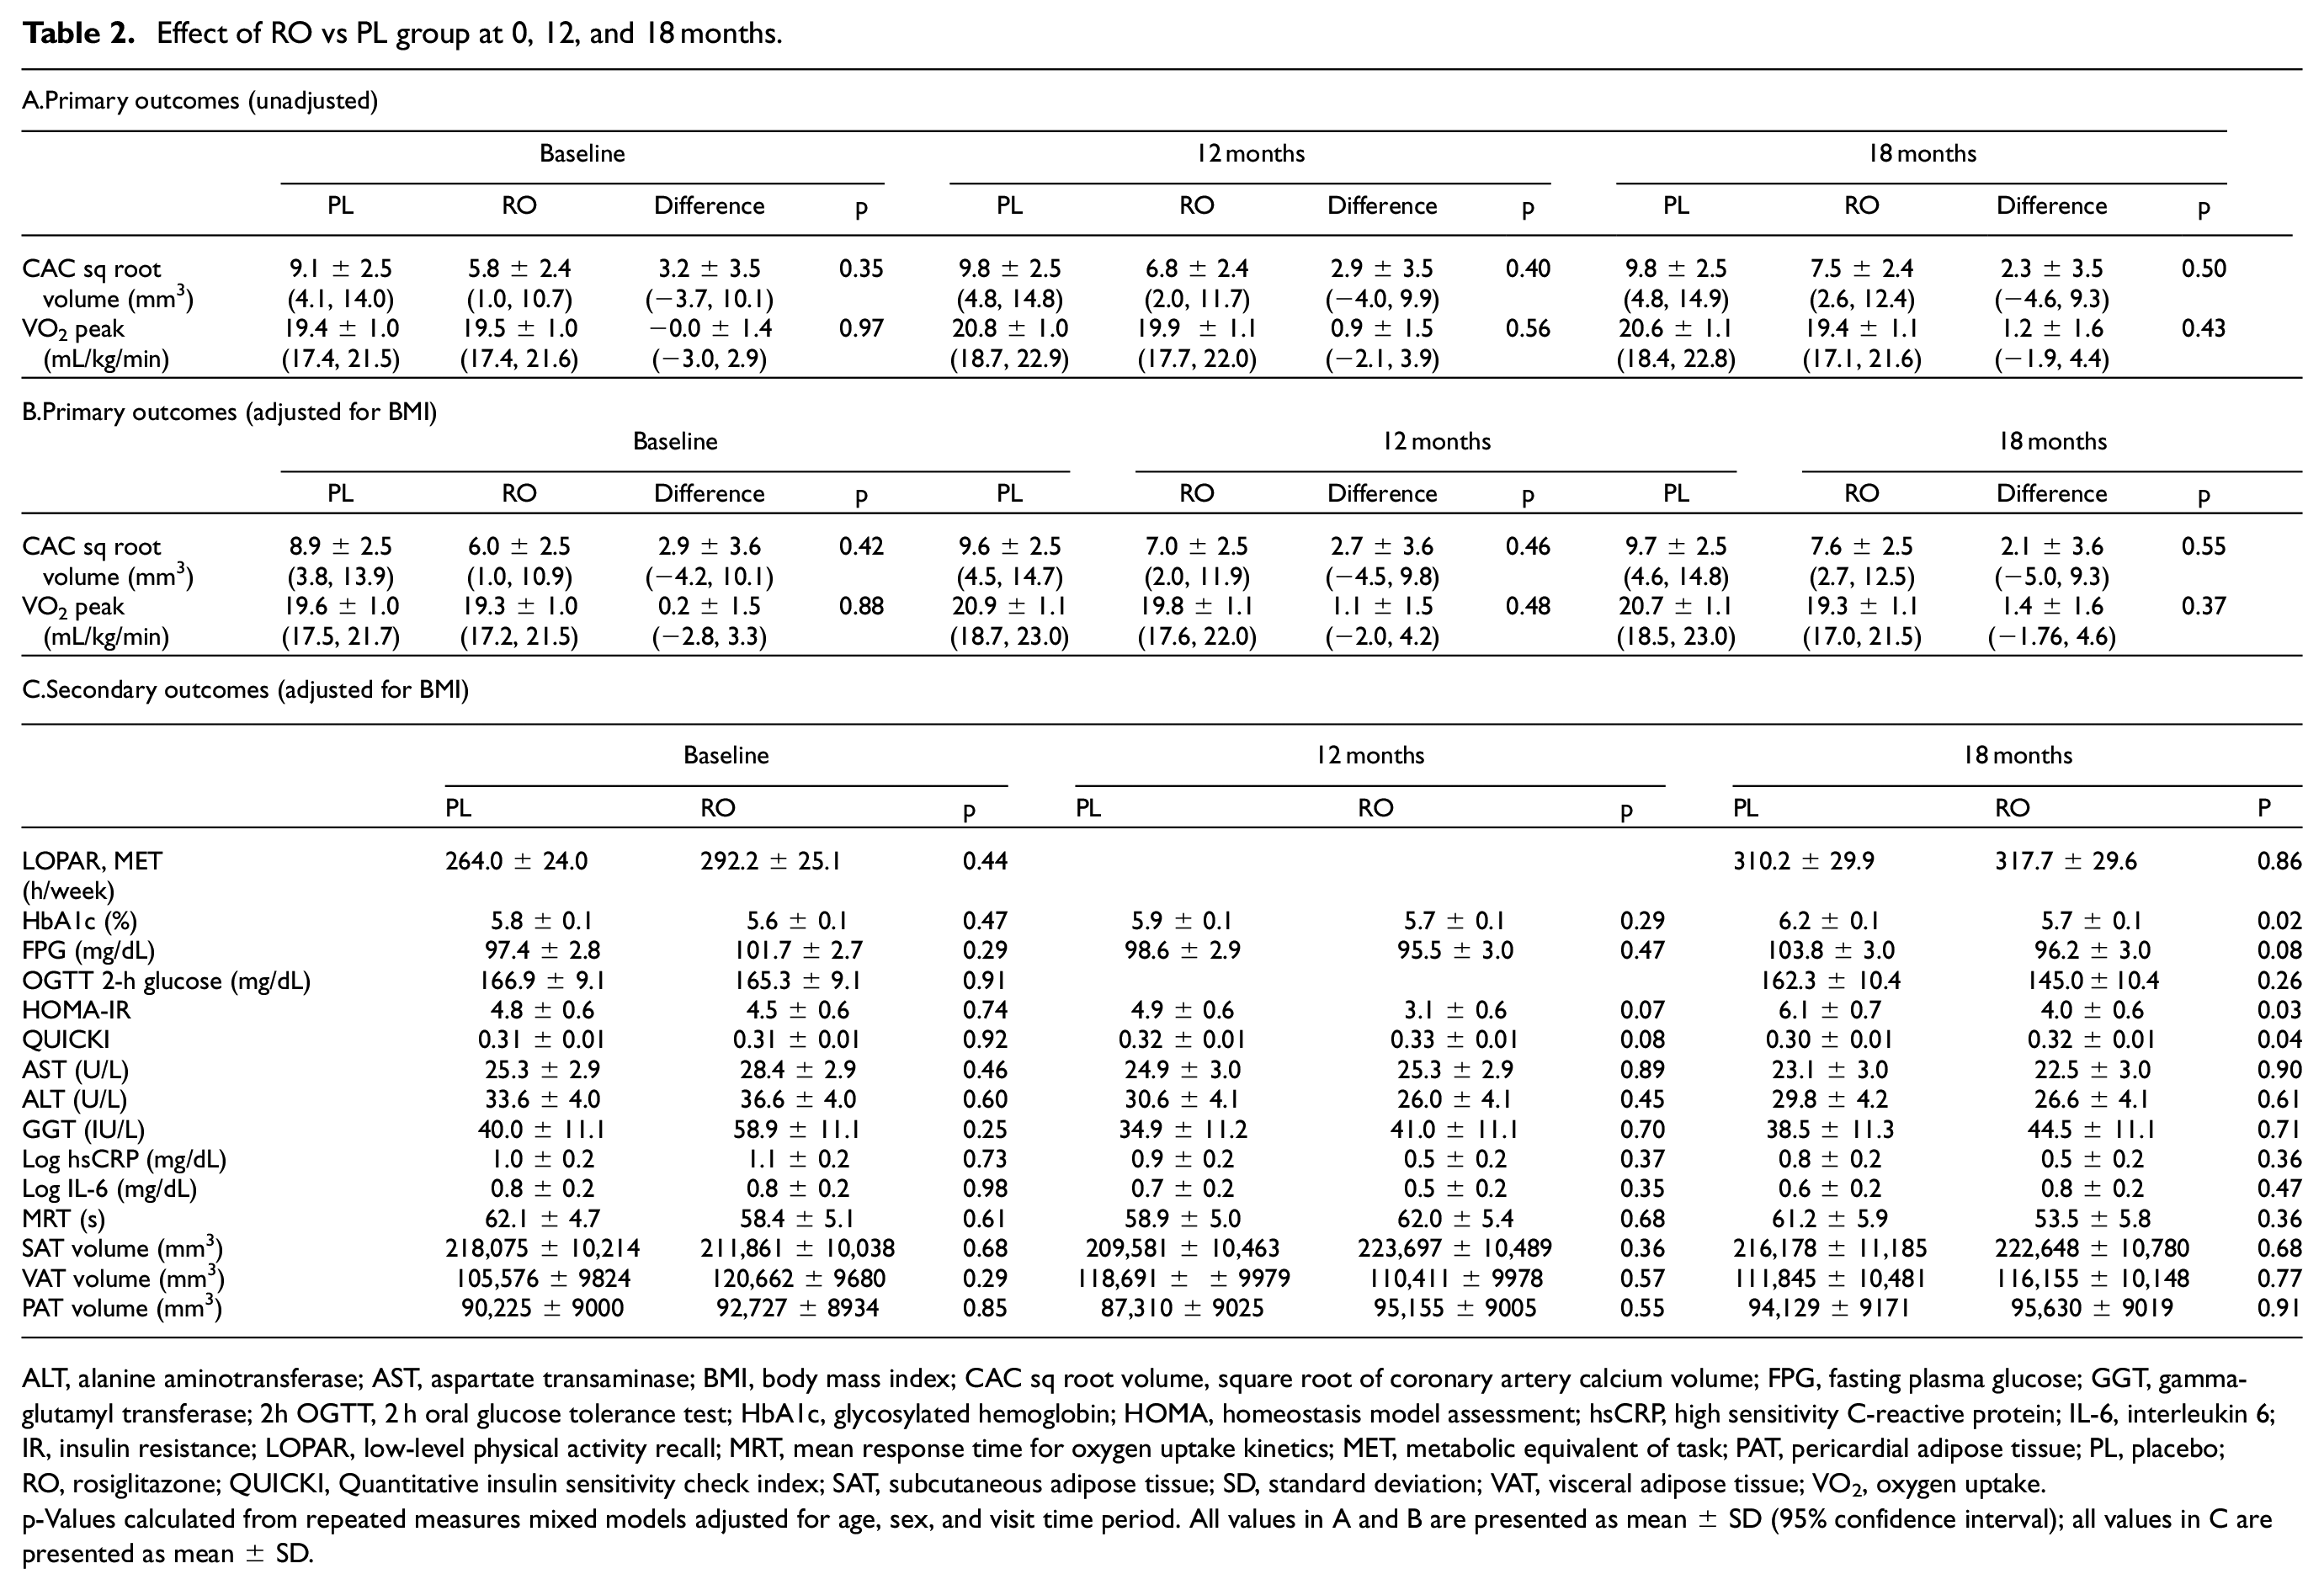
Effect of RO vs PL group at 0, 12, and 18 months.
ALT, alanine aminotransferase; AST, aspartate transaminase; BMI, body mass index; CAC sq root volume, square root of coronary artery calcium volume; FPG, fasting plasma glucose; GGT, gamma-glutamyl transferase; 2h OGTT, 2 h oral glucose tolerance test; HbA1c, glycosylated hemoglobin; HOMA, homeostasis model assessment; hsCRP, high sensitivity C-reactive protein; IL-6, interleukin 6; IR, insulin resistance; LOPAR, low-level physical activity recall; MRT, mean response time for oxygen uptake kinetics; MET, metabolic equivalent of task; PAT, pericardial adipose tissue; PL, placebo; RO, rosiglitazone; QUICKI, Quantitative insulin sensitivity check index; SAT, subcutaneous adipose tissue; SD, standard deviation; VAT, visceral adipose tissue; VO2, oxygen uptake.
p-Values calculated from repeated measures mixed models adjusted for age, sex, and visit time period. All values in A and B are presented as mean ± SD (95% confidence interval); all values in C are presented as mean ± SD.
Anthropometrics and activity
There was no significant difference in the SAT, VAT, or PAT volume between groups at 18 months. LOPAR assessment of physical activity indicated that the PL group increased physical activity more during the 18 months than did the RO group, though neither increase reached statistical significance (Table 2). Pill counts revealed no difference between groups in treatment adherence (89 ± 18 and 88 ± 12% compliance, respectively; p = 0.83). No adverse events were reported related to the study drug in either group.
Biochemical markers
Measures of insulin sensitivity (HOMA-IR and QUICKI) improved significantly with RO at 18 months of treatment (Table 2). HOMA-IR changes were significantly different overtime in the placebo group (−1.3 [95% CI −2.3, −0.4, p = 0.008]) but not in the RO group (0.5 [95% CI −0.4, 1.5, p = 0.27]). There was a significant difference over time by treatment group in HOMA-IR (p = 0.02 overall). HbA1c was also significantly lower in the RO group at 18 months (Table 2). Within each treatment group, HbA1c significantly changed at 18 months in the PL group (−0.4 [95% CI −0.6, −0.2, p < 0.0001]) but not in the RO group (−0.1 [95% CI −0.3, 0.1, p = 0.40]). The change in HbA1c over time was also significantly different by treatment group (p = 0.03 overall).
Exercise capacity
VO2peak and VO2 kinetics (MRT) were not statistically different at baseline or at study conclusion between groups (Table 2).
Coronary artery calcification
At baseline, most participants (79%) had some measurable CAC, though few (14%) had severe CAC, defined as an Agatston score greater than 400. Square root CAC volumes were not different between groups at any point (Table 2).
Sensitivity analysis of change in primary outcomes
We examined the change in the primary outcomes (VO2peak and square root CAC volumes) from baseline to 12 and 18 months, adjusted for the baseline VO2peak and square root CAC volume by group. Change in VO2peak did not differ by treatment group at 12 months (p = 0.68) or at 18 months (p = 0.43). Change in square root CAC volume from baseline did not differ by treatment group overall at 12 months (p = 0.52) or at 18 months (p = 0.34).
Discussion
We found that compared to PL, RO improved IR and glycemia in people with IGT. HbA1c worsened over time in the PL group (as expected in IGT, a high-risk group for progression to T2D), while it remained stable in those in the treatment group. Despite improvement in glycemic measures, RO did not improve measures of FEC, unlike our previous observations in participants with uncomplicated T2D. Additionally, there was no statistical difference in CAC volume between groups after treatment. The current study results suggest that targeting IR prior to overt diabetes with a TZD is inadequate to perturb CVD risk factors of cardiorespiratory fitness or CAC in individuals with IGT.
The physically inactive individuals with IGT in this study have a low VO2peak (mL/kg/min) averaging 19–20 mL/kg/min; this VO2 peak falls halfway between those of obese controls and participants with T2D in our prior study. 11 This finding is consistent with studies from our group and others linking IR and decreased VO2peak in healthy participants.32,33 Poor cardiorespiratory fitness is a strong predictor of CVD and mortality,9,10,34,35 regardless of diabetes status. Compared to activity- and weight-matched controls, individuals with T2D have impairments in FEC in the absence of apparent CVD.7,8 Our group and others have demonstrated specific impairments including reductions in VO2 peak and slowed VO2 kinetics during maximal and submaximal exercise in people with T2D.6,8,11,36 Similar findings have previously been reported in people with IGT at risk of T2D 37 ; additionally, those with low FEC are more likely to have metabolic syndrome. 38 Since IR has been inversely correlated to FEC,11,39 therapies targeting IR in those with established T2D or metabolic syndrome may have important implications for fitness, CVD, and associated mortality in this population. TZDs have been shown to reduce IR in obese persons with or without underlying IGT, delay progression of IGT to T2D, and mitigate the decline of glycemic control in T2D, and this study further supports these TZD effects.40,41
Based on this relationship of IR to FEC,12,25 we had expected to find that RO-mediated insulin sensitization would improve exercise function in participants with IGT and IR. Our results differ from a more recent study of 14 male participants with metabolic syndrome which showed an improvement in exercise capacity with pioglitazone. Notably, baseline VO2peak was much higher in the fully male participant panel, 42 whereas the current study enrolled both male and female participants with no differences based on sex between groups. Additionally, in that study, while the male participants had increased exercise capacity, there was no correlation with markers of insulin sensitivity (HOMA-IR). This lack of correlation between FEC and IR with RO in our study and this other study suggests that factors other than IR, potentially hyperglycemia and/or vascular dysfunction, play a role in exercise dysfunction in people with metabolic syndrome and/or IGT.
Differing results across these studies may potentially reflect the impact of ongoing physical activity, which may improve VO2peak. While our study attempted to account for this variable by measuring LOPAR via the LOPAR questionnaire at baseline and 18 months, this measure is subjective as it is participant reported and thus is subject to reporting bias. Notably, both groups were advised to engage in regular exercise during the study, and LOPAR increased in both groups with no significant between-group difference (Table 2). At the same time, there seemed to be a greater increase in reported physical activity in the PL group. While this may not have been enough to impact VO2peak, an increase in habitual physical activity may have had a positive effect on other health parameters (body fat percentage, waist circumference, BMI), potentially contributing to the finding of no differences in VO2peak over the course of treatment in both groups. Regardless, increased physical activity would have likely had the most effect on insulin sensitivity measures (HOMA-IR, QUICKI, FPG, HbA1c) and we would then expect no difference in these measures. However, we found that those on RO had significantly improved IR despite this potential difference in LOPAR.
In addition to not seeing improvements in VO2peak, we also did not see an improvement in CAC volume after RO in IGT. We evaluated this marker of arterial calcification as a measure of cardiovascular risk. Previous studies have shown that IR is a risk factor for CVD. 43 Therefore, as insulin-sensitizing agents, TZDs would be expected to reduce risk of CVD. Large clinical trials have shown that pioglitazone reduces risk of atherosclerotic CVD (ASCVD) events (myocardial infarction, cardiac death, stroke) in those with T2D44,45 and in those with IGT with recent history of ischemic stroke or transient ischemic attack. 46 There is also data that suggest TZDs lead to reduced progression of atherosclerotic plaque in those with T2D.47,48 These previous studies assessed the impact of TZDs on plaque via coronary intravascular ultrasonography and carotid artery intima-media thickness via ultrasonography and only in those with T2D. 49 One of these previous studies assessed CAC progression using EBCT in people with T2D as a secondary endpoint and found no difference between those on pioglitazone compared to those on glimepiride. However, there was no comparison to a PL group in this study. At the same time, our study also similarly shows no change in CAC volume by EBCT with RO in those with IGT. 50 To our knowledge, no previous studies have been done evaluating the effect of TZDs on EBCT-determined CAC volume in people with IGT.
The current study was limited by a small sample size and a 25% dropout rate. However, based on sample size and power calculations from our T2D data, 12 this prespecified sample size would be expected to detect an improvement in FEC comparable to what was found by our group in T2D. At the same time, given the lack of overt diabetes status, sample size may not have been large enough to detect a smaller difference in VO2peak in people with IGT compared to control participants. Additionally, this study may not have had sufficient power to detect changes in secondary outcomes that may have impacted both IR and FEC, such as LOPAR (habitual activity) but there were no significant differences in this factor between groups. Regardless, any effect would be anticipated to have an inverse effect on insulin sensitivity measures and FEC. At the same time, there was a low effect size and multiple secondary outcome measures with no correction for multiple comparisons in our analysis. There was no difference in FEC found in this study, yet there were significant improvements in IR and glycemia. It remains possible that any improvement in FEC from RO in this IGT population was smaller in magnitude than the effect seen in our T2D population, and below the limit of detection. Finally, while we used a randomized controlled trial design, our randomization was not able to eliminate all differences in study participant characteristics at baseline. In particular, BMI differed across randomization groups, and given that this is an important factor related to the primary and many of the secondary outcomes, this baseline difference in adiposity could have contributed to the negative study results, despite statistical adjustment. Given the limited sample size, results were not stratified by sex, statin use, BMI, age, or other characteristics that may have impacted results.
Strengths of the study include its fidelity (lack of protocol deviations, high medication adherence between groups) and its design, including that it was a double-blinded study with screening based on DPP protocol, all protocol procedures done at a single site with EBCT interpreted by a single investigator, and exercise testing done in a single lab with interpretation by that lab.
Our study supports future investigation of mechanisms beyond IR in the etiology of decreased FEC in prediabetes and T2D. In addition, further exploration of pharmacologic agents as modifiers of exercise performance should be assessed, both with and without important lifestyle treatments such as exercise training.
Supplemental Material
sj-doc-1-imj-10.1177_10815589231225183 – Supplemental material for Rosiglitazone improves insulin resistance but does not improve exercise capacity in individuals with impaired glucose tolerance: A randomized clinical study
Supplemental material, sj-doc-1-imj-10.1177_10815589231225183 for Rosiglitazone improves insulin resistance but does not improve exercise capacity in individuals with impaired glucose tolerance: A randomized clinical study by Layla A Abushamat, Irene E Schauer, Cecilia C Low Wang, Stacey Mitchell, Leah Herlache, Mark Bridenstine, Roy Durbin, Janet K Snell-Bergeon, Judith G Regensteiner and Jane EB Reusch in Journal of Investigative Medicine
Footnotes
Acknowledgements
We would like to thank Dr James Ehrlich and the Radiologists of Colorado Imaging Associates for their assistance with CAC measurement and Dr Tim Bauer for his assistance with the design of the exercise testing.
Declaration of conflicting interests
The author(s) declared no potential conflicts of interest with respect to the research, authorship, and/or publication of this article.
Funding
The author(s) disclosed receipt of the following financial support for the research, authorship, and/or publication of this article: Funding support for this study came from the Department of Veterans Affairs, Colorado Clinical Translational Science Institute, and GlaxoSmithKline investigator-initiated grant program. Funding from GlaxoSmithKline supported all study costs including labs, exercise testing, coordinator fees, patient compensation, and standard per-visit reimbursement. GlaxoSmithKline had no input on the study design, execution, data analysis, or writing of the manuscript. LAA is supported by American Diabetes Association Junior Faculty Development Award (#4-23-CVD1-01). JGR is supported by National Institutes of Health [R01-DK-124344, K12 HD057022, U54 AG062319], Department of Veterans Affairs [CX001532], the Doris Duke Charitable Foundation and the Ludeman Family Center for Women’s Health Research. JEBR is supported by National Institutes of Health [R01-DK-124344, P30-DK-116073, UL1-TR-001082, R01-AG-066562], Department of Veterans Affairs [BX002046 and CX001532], and Ludeman Family Center for Women’s Health Research.
Supplemental material
Supplemental material for this article is available online.
References
Supplementary Material
Please find the following supplemental material available below.
For Open Access articles published under a Creative Commons License, all supplemental material carries the same license as the article it is associated with.
For non-Open Access articles published, all supplemental material carries a non-exclusive license, and permission requests for re-use of supplemental material or any part of supplemental material shall be sent directly to the copyright owner as specified in the copyright notice associated with the article.