
Abstract
Electrical conductivity of most polymeric insulators can be drastically enhanced by introducing a small volume fraction
Keywords
1. Introduction
The discovery of carbon nanotubes (CNTs) in 1991 by Iijima [1] was an influential achievement because of their strength, low weight, and high mechanical, thermal, and electrical properties [2, 3]. To take advantage of these extraordinary physical properties, CNT-reinforced composites are developed as an emerging class of advanced lightweight nanocomposites [4–7]. The properties and behavior of various structures made of these composite materials have been widely evaluated and reported in the literature using different experimental, analytical, and numerical approaches, and numerous potential applications spanning across automotive, electronics, energy storage, biomedical engineering, sports equipment, and structural reinforcement are reported for this class of composites [8–14].
Analytical micromechanics theories such as the rule of mixture [15–17], Eshelby’s equivalent inclusion method (EIM) [18–20], Halpin–Tsai method [21–24], Lewis–Nielsen method [25, 26], and Mori–Tanaka method [27–29] have been widely used in many studies to evaluate the overall physical properties of composite materials with reasonable accuracy. Developed by Eshelby [20], one of the most popular theories, the EIM shows that the elastic fields inside an ellipsoidal inhomogeneity can be assumed to be uniform if the ellipsoidal particle is perfectly bonded to an infinitely extended matrix with a uniform load applied at infinity. One of the main advantages of EIM is that the solution is limited to a system of algebraic equations, and it can be applied to the different behavior of materials such as elastic-plastic, viscoelastic, and creep [30]. The EIM was extended by Dunn and Taya [31] for the problems with the coupled electro-elastic behavior of piezoelectric composites based on the rigorous electro-elastic solution of an ellipsoidal inclusion in an infinite piezoelectric medium. The method in steady-state heat conduction was extended further for the randomly oriented particle composites with uncoupled thermal and electromagnetic behavior by Hatta and Taya [32, 33]. They considered two distribution functions for the inclusions and showed that their model is able to consider the effects of interaction between different inclusion orientations. Chen and Wang [34] proposed an analytical model based on the Mori–Tanaka mean field theory and the EIM to evaluate the thermal conductivity of the composite materials. They developed a new distribution function called Kacir’s single-parameter exponential function to model the inclusion orientation. Odegard and Gates [35] developed a method to modify the constitutive models of polymer composite reinforced by randomly oriented CNTs. They captured the effect of the discrete nature of the atomic interactions at the nanoscale and the interphase between CNTs and the polymer matrix using the EIM. Three different patterns for the dispersion of CNTs including CNTs with an axisymmetric orientation, aligned, and randomly oriented CNTs were considered in their work. Seidel and Lagoudas [36] used Mori–Tanaka, self-consistent, and composite cylinders micromechanical models in conjunction with Eshelby’s method to analyze the elastic behavior of nanocomposites reinforced by CNTs. They used a tessellation procedure and a multi-phase Mori–Tanaka approach to capture the effect of clustering of CNTs in the polymer matrix. Moreover, the effects of interphase regions were taken into account. Jin et al. [37] proposed a closed-form solution for the stress caused by the disturbance of an elliptical inhomogeneity in an infinite isotropic elastic plane. Their study showed that the EIM is a useful tool at least for solving the classical elliptical inhomogeneity problem.
Several analytical models were developed to analyze the electrical conductivity and piezoresistivity of CNT-reinforced composites. In another work by Seidel and Lagoudas [38], a micromechanical model based on the Mori–Tanaka approach and EIM was proposed to investigate the effects of electron hopping by considering conductive interphase layers around particles. Their results showed that the thickness of the electrical tunneling interphase layer relative to the CNT radius gives a distinct percolation concentration in which the well-dispersed CNT fillers are in close vicinity and electrical tunneling easily happens. A simple analytical model was presented by Deng and Zheng [39] to predict the electrical conductivity of CNT-reinforced composites considering the effects of the percolation, conductive networks, conductivity anisotropy, and waviness of CNT inclusions. Their results revealed that the waviness of CNTs has an important influence in evaluating electrical conductivity. Following their model, Takeda et al. [40] proposed an analytical model for evaluating the electrical conductivity of CNT-reinforced polymers by taking into account the nanoscale effects and the electron hopping. They also conducted experiments and compared the results with their analytical model. Feng and Jiang [41] developed a hybrid analytical model to evaluate the electrical properties of CNT-reinforced polymers by incorporating electron hopping and conductive networks. An interphase layer surrounding the CNT was used to capture the nanoscale effect of electrical tunneling based on the electron hopping theory. They illustrated that electron hopping and conductive networks contribute to the electrical conductivity, while the conductive networks’ effect is dominant above the percolation threshold. Garcia-Macias et al. [12] developed a micromechanics model which can take into account the non-straightness by a helical waviness model and non-uniform dispersion of CNTs by a two-parameter agglomeration approach for evaluating the effective electrical conductivity of cement-based composites. The electron hopping and conductive networks were modeled via an interphase surrounding the CNTs and changes in the CNTs aspect ratios, respectively. Haghgoo et al. [42] studied the effects of aspect ratio, volume fraction, clustering, and distribution of CNTs on the electrical conductivity of hybrid polymer composites reinforced by CNTs and carbon fibers. The effect of electron tunneling was considered by modeling an interphase layer. They showed that the electrical conductivity highly depends on the aspect ratio, alignment angle, and the distance among the CNT particles. A micromechanical model based on the Eshelby–Mori–Tanaka approach was conducted by Mora et al. [43] to evaluate the electrical conductivity of polymer nanocomposites with agglomeration and segregation of CNT particles. Their model is able to predict the effect of segregation on the electrical conductivity of nanocomposites. Their model was validated by comparing the predicted electrical conductivity to the experimental values. Chanda et al. [44] developed two analytical models based on micromechanics and a simplified fiber–fiber contact network to calculate the electrical conductivity of random and aligned composites. They investigated the effect of aspect ratio, waviness, orientation, interphase, and percolation threshold on the effective conductivity of composites. Shingare and Naskar [45] investigated the micromechanical modeling of fiber-based composites, emphasizing the impact of random fiber orientation on piezoelastic properties. They estimated the effective properties of composites considering the different orientations, shapes, and geometrical aspects of graphene fibers. Tang et al. [46] presented a simple analytical model to estimate the percolation threshold and electrical conductivity of CNT-reinforced composites by considering the effects of waviness, dispersion, volume fraction, and size of particles. They validated their model by comparing their results with experimental values in the literature. Saberi et al. [47] presented a multi-step analytical model to predict the electrical conductivity of the short carbon fiber-reinforced hybrid composites with graphene nanoplatelet particles. They investigated the effects of volume fraction, interphase characteristics, and fiber aspect ratio. Haghgoo et al. [48] presented a two-step analytical approach considering percolation network and electron tunneling to predict the electrical resistivity and percolation threshold in CNT-reinforced hybrid nanocomposites with carbon black. Quinteros et al. [49] proposed a computational framework for evaluating the electromechanical behavior of CNT-reinforced composites during fracture by combining electrical-deformation-fracture finite element (FE) modeling with a mixed micromechanics formulation. In their model, the electrical conductivity has a nonlinear relationship with the volume content of distributed CNTs.
To summarize the above discussion, the idea of equivalent inclusion proposed by Eshelby [20] for elasticity has been widely extended to evaluate the other overall physical properties of inclusion–matrix materials, e.g., thermal conductivity [32–34, 50] and electrical conductivity [12, 38, 41, 43] of composites. However, in the case of electrical conductivity, the lack of detailed formulation derivation is notable. Calculations based on the EIM are highly sensitive to input parameters which are often overlooked. Moreover, while most analytical calculations focus on isotropic composites, CNTs are commonly distributed in a non-uniform manner in composites, influenced by factors such as the manufacturing process or deformation due to large strain. Specific applications may call for deliberate manipulation of inclusion distribution to enhance material performance and achieve optimal designs. To address these issues, we present a rigorous analytical formulation for computing effective electrical conductivity of polymer nanocomposites accounting for both conductive networks and electron hopping [32, 38, 51]. Our calculations demonstrate a high sensitivity of results on input parameters such as energy barrier for electron hopping, intrinsic CNT conductivity, and percolation threshold. Often, the exact values of these parameters are not reported in experiments and care must be taken to use appropriate values in computational models. Finally, we model the non-uniform distribution of CNTs using a limit angle of filler orientation and a probability distribution function. The EIM of homogenization is reviewed in section 2 and is generalized to include electron hopping in section 3. The model is validated with experimental data in section 4. We also discuss the role of CNT volume fraction, orientation, distribution, and dimensions in this section with the help of numerical examples. The conclusions are reported in section 5.
2. EIM
This section summarizes the EIM for calculating the effective electrical or thermal conductivity of two-phase composites [20, 32, 33, 52, 53]. The inclusions can be modeled with or without an interphase coating with a different conductivity [41, 54]. First, the method is applied to a matrix with a single ellipsoidal particle and then extended to a matrix with numerous ellipsoidal particles, considering the interactions between them.
2.1. Overall electrical conductivity of two-phase composites
In general, the overall electrical conductivity of any two-phase composite,

where horizontal line denotes the averaged quantity over the volume


Ohm’s law in each phase is given as:

where


By calculating

By substituting

Hence, in order to estimate
2.2. Matrix with a single ellipsoidal particle
Consider a single ellipsoidal particle embedded in an infinite matrix while the constant electric current density

where


(a) A single ellipsoidal particle embedded in an infinite matrix subjected to the applied current density and (b) the equivalent inclusion inducing transformation electric field.
As shown in Figure 1(b), consider an imaginary subdomain
Based on this method, the disturbed current density inside the matrix and particle domains are expressed as:


Here, we introduce

The formulas to calculate

Upon comparing equations (7) and (11), we get:

The above equation expresses a relation between the real composite and the equivalent inclusion.
2.3. Matrix with numerous ellipsoidal particles
The approach presented in section 2.2 for a single ellipsoidal particle can be extended for an infinite matrix with numerous ellipsoidal particles as shown in Figure 2. In this case, the interactions between the particles should also be taken into account.
Numerous ellipsoidal particles embedded in an infinite matrix.
Here, the total electric field

where

With a similar approach to the EIM for a single ellipsoid presented in the previous section, equations (9b) and (12) can be rewritten for composites with numerous ellipsoidal particles as:

and

By defining |□| that specify the outer boundary of □ and the partial differentiation operator

since

that results in:

Thus, recalling equation (13), the volumetric average of the total electric field is given as:

Making use of equations (15) and (17), we get:

The electric field when integrated over the inclusions can be written as:

Hence, using


Next, we need to determine
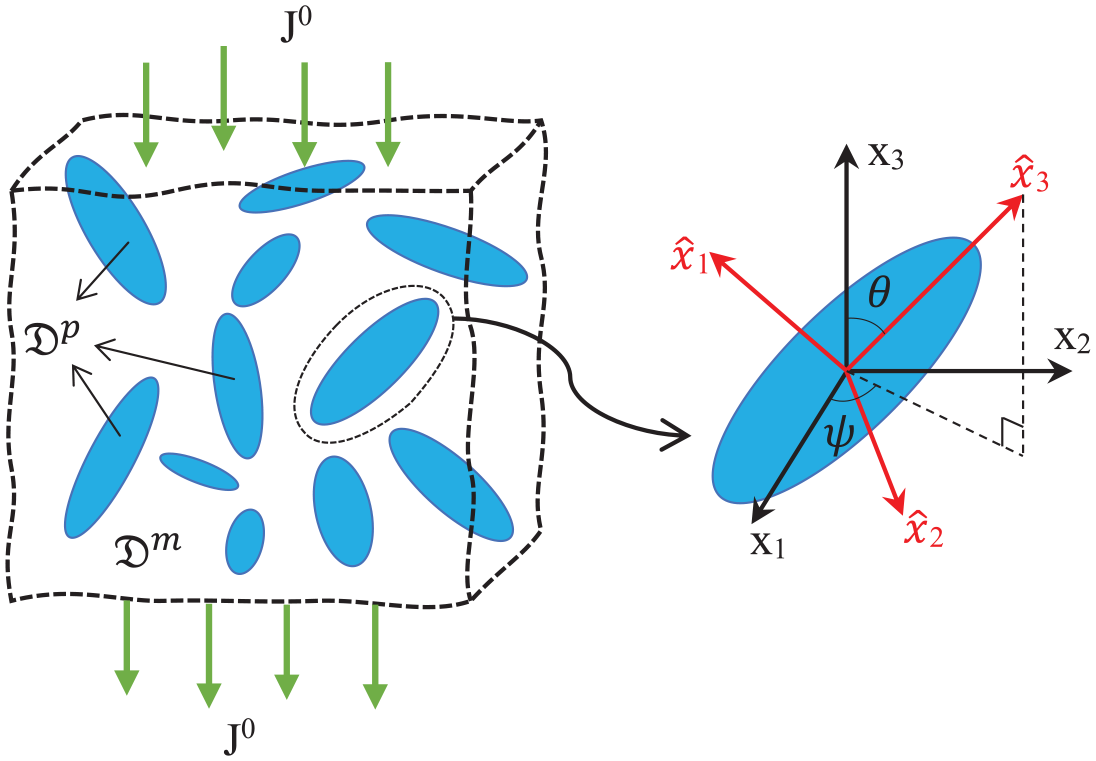
2.4. Composites with randomly distributed inclusions
In order to evaluate the overall electrical conductivity of a composite reinforced by randomly distributed inclusions, we need to determine

and

where the hat accent refers to the local coordinate system on representative inclusion. Equations (24) and (25) can be held for every inclusion distributed in the matrix. From equations (24) and (25), we can obtain:

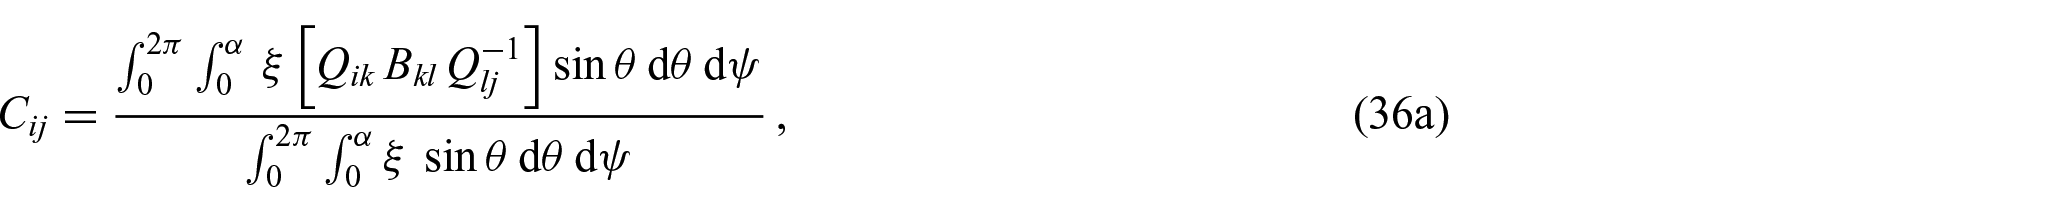
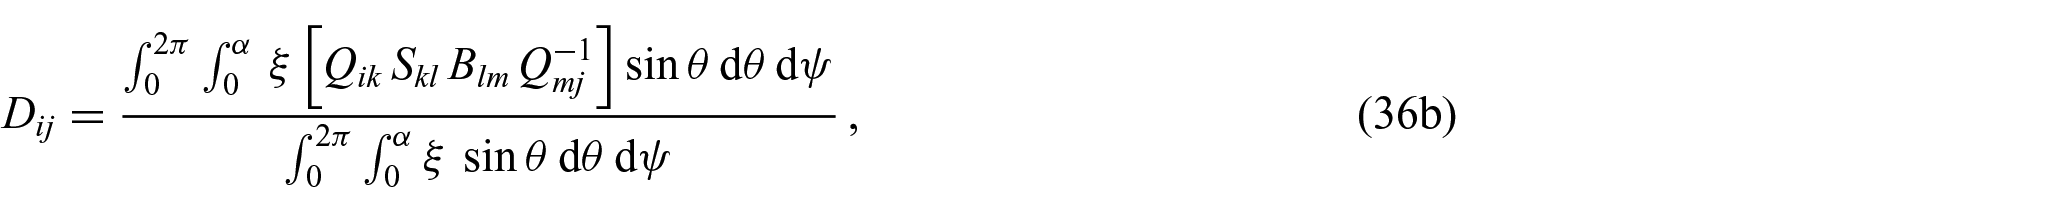
Upon introduction of second-order tensors


the value of

From equations (25) and (28), we can eliminate

The rotation tensor

Using this tensor, we can transform the conductivity tensor into the global coordinate system. So, by transforming equations (28) and (29), we can obtain:


Now, consider a unit sphere where the orientation of inclusion is indicated by Euler angles
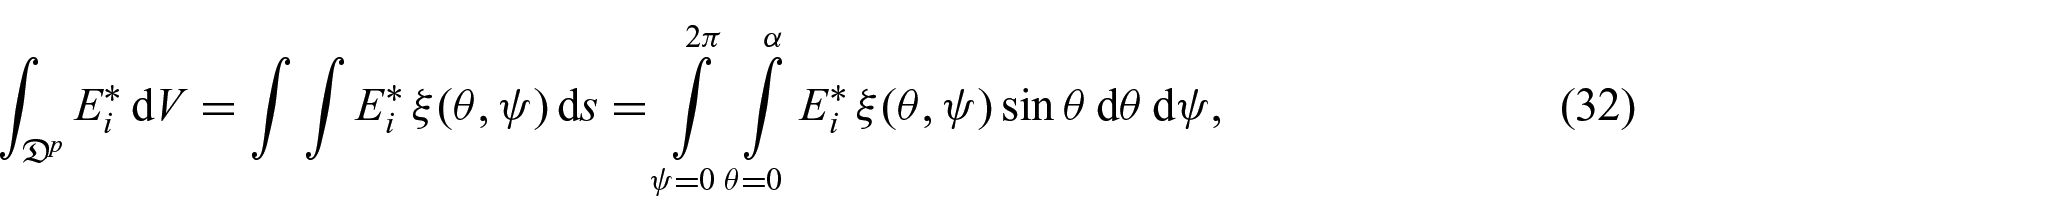
where

The volume fraction of inclusions,

By inserting


Substituting
to compact the formulation further, equation (19) yields:

Considering the fact that


so that the components of


Finally, the non-zero components of the overall electrical conductivity


The established EIM for estimating the overall electrical conductivity of randomly distributed inclusions inside a matrix in equations (40) is only valid when there is no electron hopping between particles, and thus, no conductive networks of particles are formed in the composite.
2.5. Particles with interphase coatings
To take into account the effects of electron tunneling and conductive networks, the EIM derived in section 2.4 for randomly distributed particles is extended for a system with particles with interphase layers by replacing every regular particle with an equivalent particle. For this purpose, it is assumed that every particle is surrounded by an interphase layer of thickness
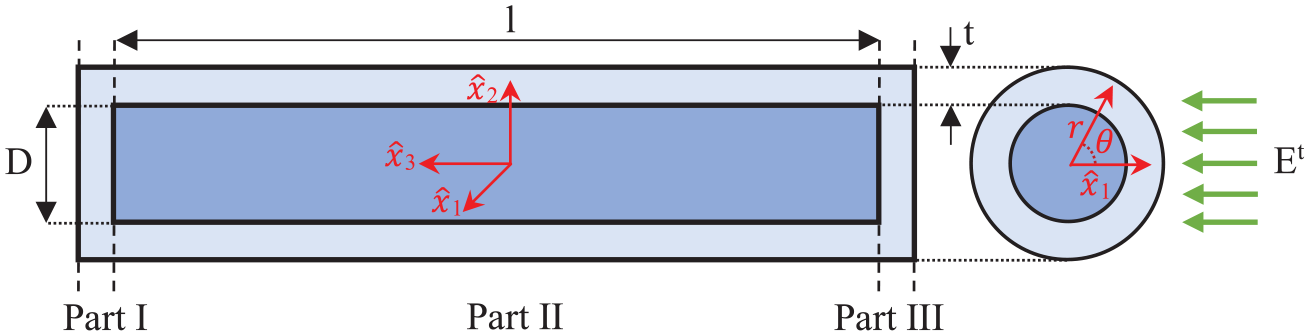
An equivalent cylinder particle with its interphase layer surrounding it divided into three parts.
The effective conductivity of the equivalent cylinder can be derived using Maxwell’s equations and the rule of mixture [41, 54]. This requires the equivalent cylinder to be divided into two isotropic interphases (parts I and III) and one transversely isotropic region of CNT/interphase (part II) as shown in Figure 3. The overall electrical conductivity of part II along

The overall electrical conductivity of part II along

The boundary conditions are prescribed as:


where the superscripts


where:

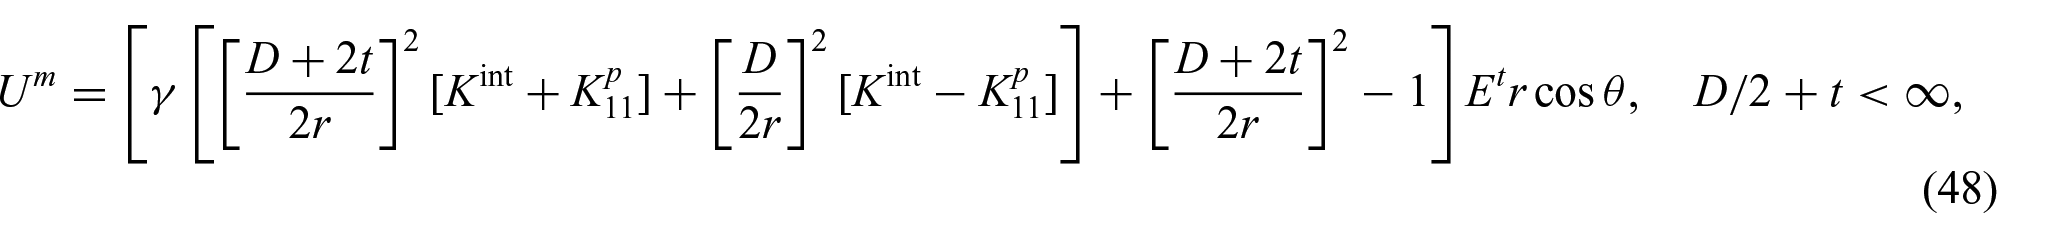
Also, the transverse electric field of the interphase and CNT parts of the equivalent cylinder can be evaluated as:


with:

Using the volumetric average, we can obtain:

Therefore, using equations (52) and (53), we can write:

Finally, the effective conductivity of an equivalent cylinder with a length of


where the electrical conductivity tensor in the local coordinate system of the equivalent cylinder is given as
Based on these effective cylinders, the effective volume fraction

Therefore, the EIM described in section 2.4 to estimate the overall electrical conductivity of randomly distributed inclusion composites can be extended for composites with interphase layer by replacing the inclusions by equivalent particles, i.e., replacing
3. Electron tunneling and conductive networks
From this section onward, we focus on CNT/polymer nanocomposites and the inclusions are chosen to be CNTs. When the distance between two CNTs is less than a threshold value, electrons can transport from one CNT to another via a phenomenon commonly referred to as electron tunneling or electron hopping [55–58]. In this section, we specialize the EIM developed for composites with interphase layers around inclusions in section 2 by considering the interphase layer around CNTs to be a model for electron hopping [38].
Simmons [59] derived a generalized method to calculate the tunneling current between electrodes separated by an insulating region. By assuming a uniform thickness of the insulator and neglecting any variations in barrier height along its thickness, we can apply the formula designed for a rectangular potential barrier. Based on this, a generalized framework is developed where the fillers are treated as three-dimensional (3D) continuum objects. This approach is widely used in the literature to model the conductivity due to electron tunneling for CNT-based composites [12, 41, 43, 44, 49, 60, 61]. The tunneling resistance

where
The distance
3.1. Conductive networks
In order to consider the effect of the conductive networks of CNTs, the average junction distance between CNTs

where
Eventually, the overall electrical conductivity of CNT-reinforced polymer nanocomposite can be estimated based on a simple rule of mixture considering the effect of electron hopping and conductive networks of CNTs. Estimating the fraction of CNTs taking part in forming conductive networks after percolation threshold as [39]:

while the rest contribute to the electron tunneling mechanism, the overall electrical conductivity of the composite is:

here,
It is noted that we started from a general equivalent inclusion model with a wider range of applications in section 2 which is valid in predicting the thermal or electrical conductivity of any type of composite reinforced by particles that can be assumed as ellipsoids with various aspect ratios. In section 2.5, the general EIM was specified for fibers (cylinder-shaped fillers) to consider the effect of the interphase layer. It is noteworthy that this interphase layer consideration for fibers can be re-evaluated when dealing with other shapes of fillers. The model did not account for quantum phenomena such as electron hopping and conductive networks of particles yet. The effects of electron tunneling and conductive networks were considered into account in section 3 for CNT/polymer composites. It should be noted that this electron tunneling and conductive networks consideration for CNTs can be re-evaluated when dealing with other nanoparticles. Analytical models have some assumptions which simplify the actual problem in the real world. It is acknowledged that the presented model comes with certain limitations. For example, it does not account for commonly encountered features such as CNT waviness, agglomeration, segregation, variability in dimensions, multiple coatings, and possibilities of void formation [12, 43, 44, 60].
4. Results and discussion
In this section, the model developed in section 3 is validated using experimental data and is used to study the influence of CNT dimension, volume fraction, orientation, and distribution on the overall conductivity of the nanocomposite. The aspect ratio of CNTs is considered to be high
Model parameters with constant values.
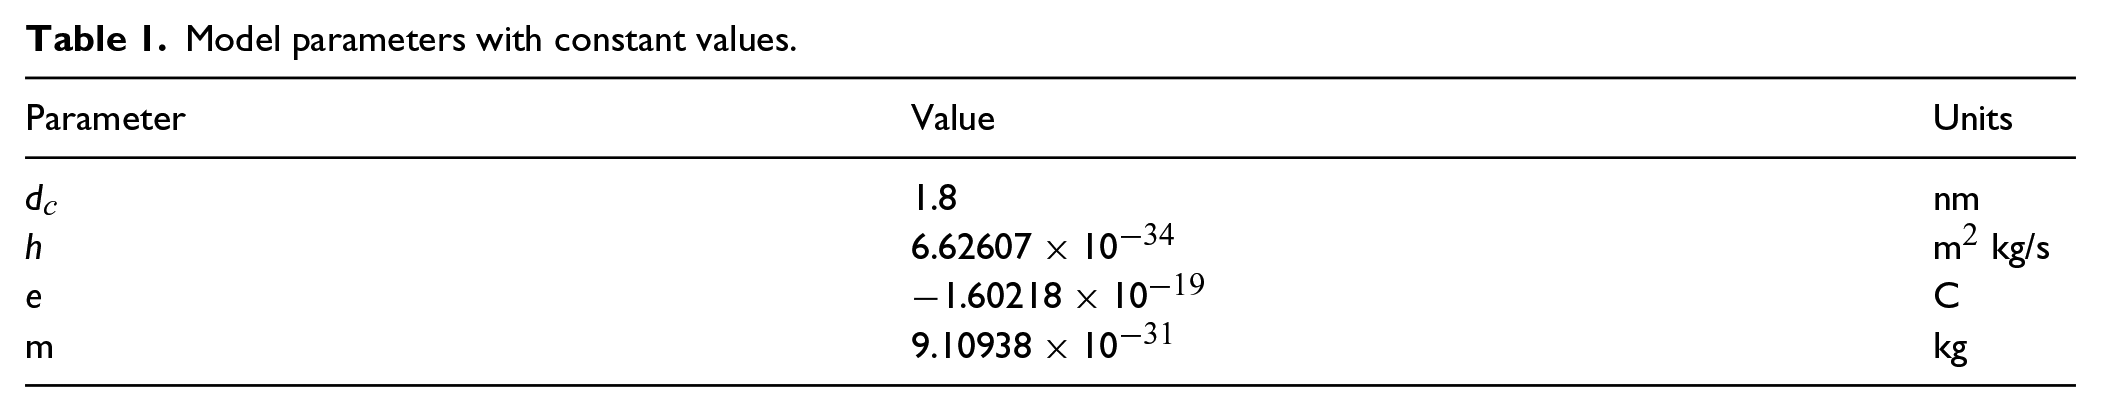
However, choosing other parameters needs more care since different types of CNTs and polymer matrices with various manufacturing processes for a wide range of applications have been reported. Accordingly, we estimate the model parameters by validation with several experimental studies in section 4.1. The length

where
Nevertheless, the values of electrical conductivity of CNT nanoparticles
We utilize Mathematica software to perform numerical study cases in this study. The method proves highly efficient and economical in terms of time, thanks to the inherent advantages of this analytical approach. The Mathematica code for this analysis is shared in an open-source format [66]. The link to the code can be accessed in “Availability of data and materials” at the end of this manuscript.
4.1. Validation with experimental data
In order to verify the accuracy of the presented model, the analytical results are compared with some experimental studies herein. The case studies are chosen from four different nanocomposites—CNT/PS from Wang et al. [60], CNT/thermoplastic polyurethane (TPU) from Takeda et al. [43], CNT/epoxy from Kim et al. [67], and CNT/thermoplastic ultrahigh molecular weight polyethylene (UHMWPE) from Lisunova et al. [68]. The values of length and diameter of CNTs, percolation volume fraction, and intrinsic electrical conductivity of matrices for all four examples are listed in Table 2.
Parameters used for model validation in section 4.1.
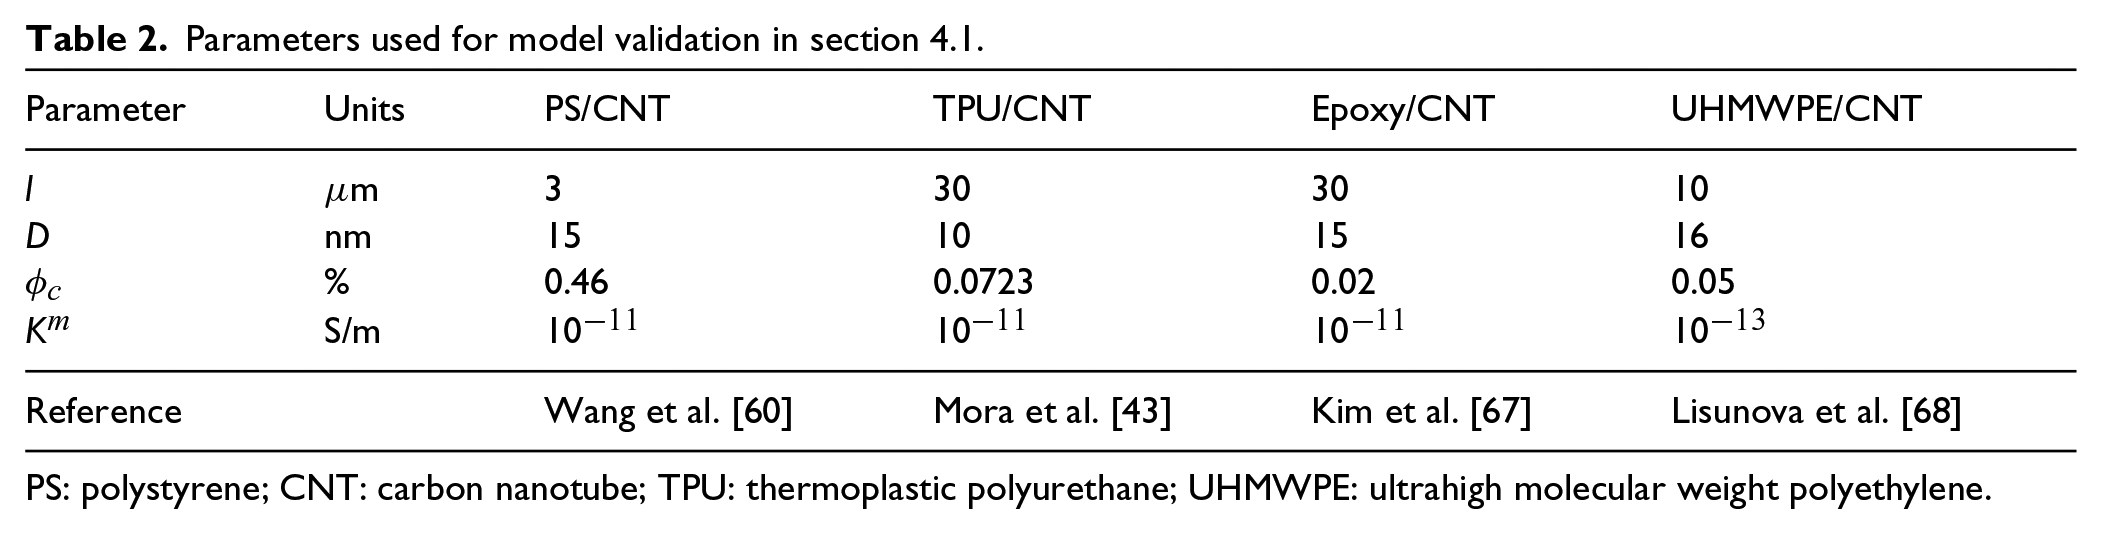
PS: polystyrene; CNT: carbon nanotube; TPU: thermoplastic polyurethane; UHMWPE: ultrahigh molecular weight polyethylene.
The unspecified parameters are the intrinsic electrical conductivity of CNTs

In equation (62),
Our computation results in the value of
Figure 4 illustrates the electrical conductivity of PS/CNT, TPU/CNT, epoxy/CNT, and UHMWPE/CNT nanocomposites predicted by the current model versus those given by experiments for different volume fractions of CNT. The graphs are plotted for 0.1, 2.5, and 5.0 eV, and the optimized value of
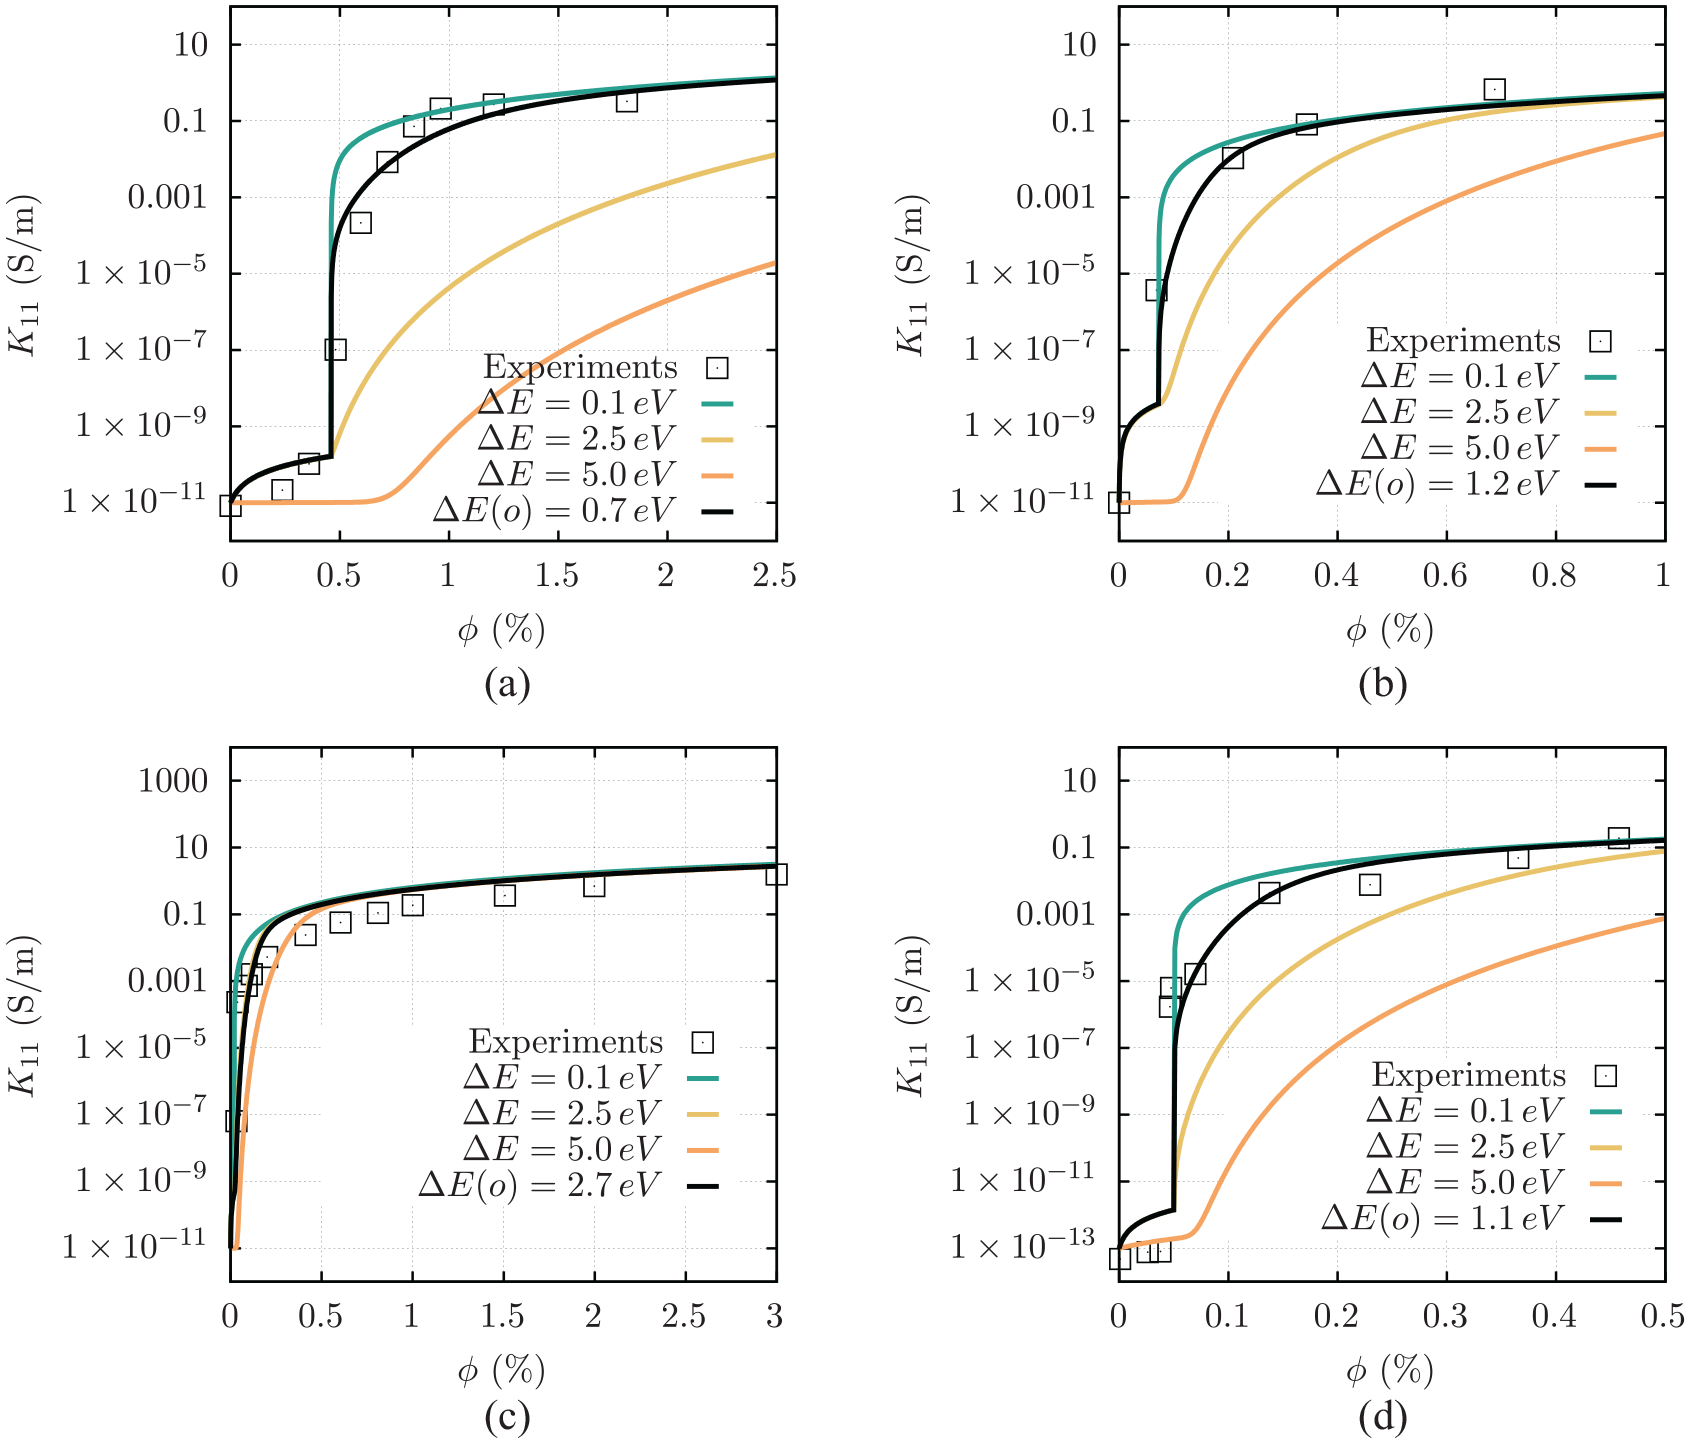
All graphs show a good agreement between the model and the experimental results. In Figure 4(a), it can be observed that for energy barriers higher or lower than
4.2. Effect of CNT orientation, distribution, and dimensions
Having validated our model with experimental data, we now study the effect of CNT alignment, distribution, and dimensions on the transverse and longitudinal effective electrical conductivity of the nanocomposites. For this parametric study, PS/CNT composite material from Wang et al. [60] is selected. The values of the parameters for PS/CNT composite are listed in Table 2. Also, the value of the energy barrier is obtained as
4.2.1. Limit angle
As discussed in section 1, non-uniform distribution of CNTs can be achieved by application of large strains on isotropic composites or directly manufacturing composites with a preferred CNT alignment. Fabricating devices with well-aligned CNTs is also desirable for better performance with lesser materials and smaller designs [72]. One of the parameters that control the alignment of CNT particles is the limit angle
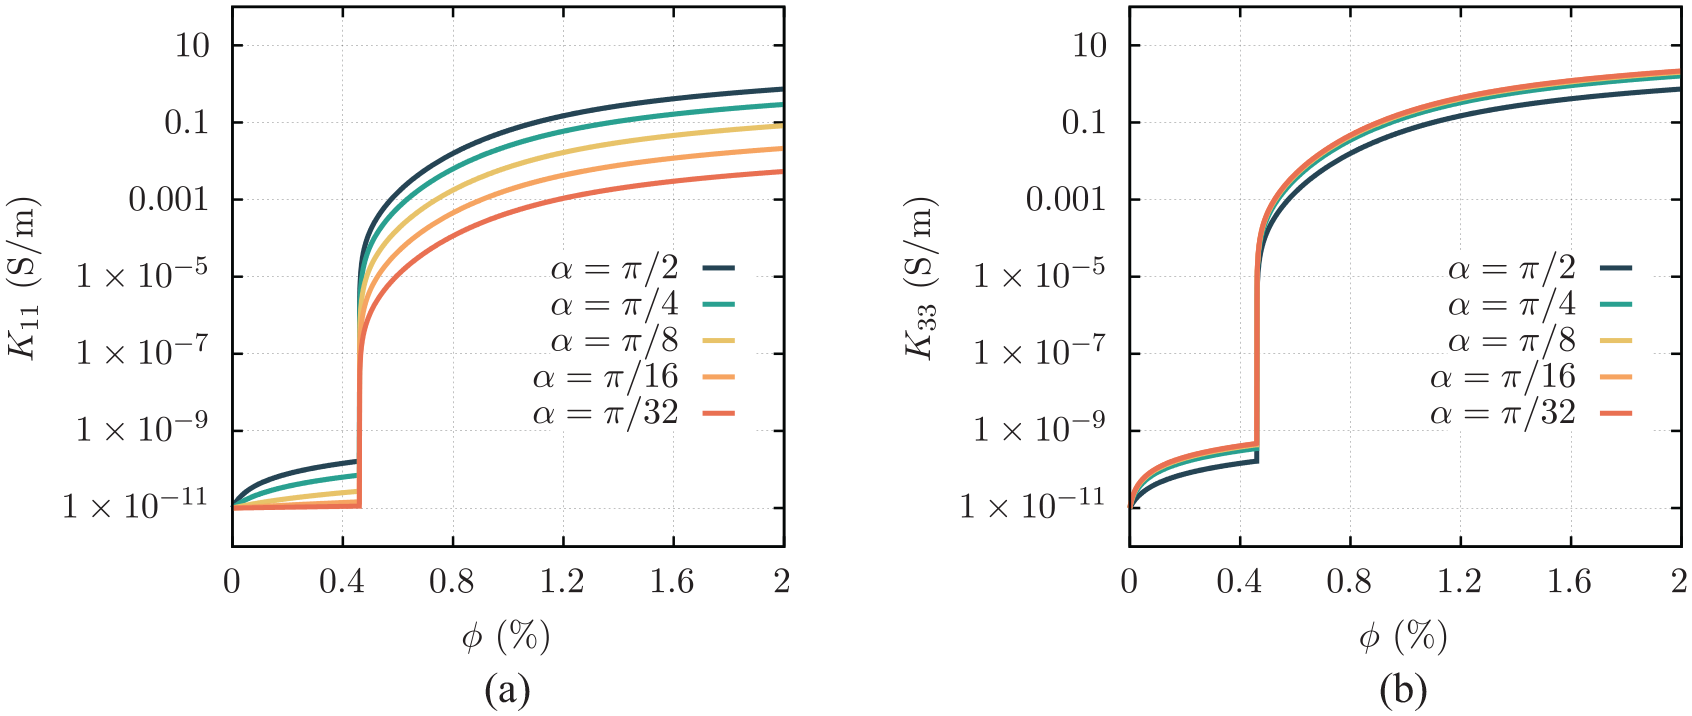
The effect of different
As expected, upon reducing
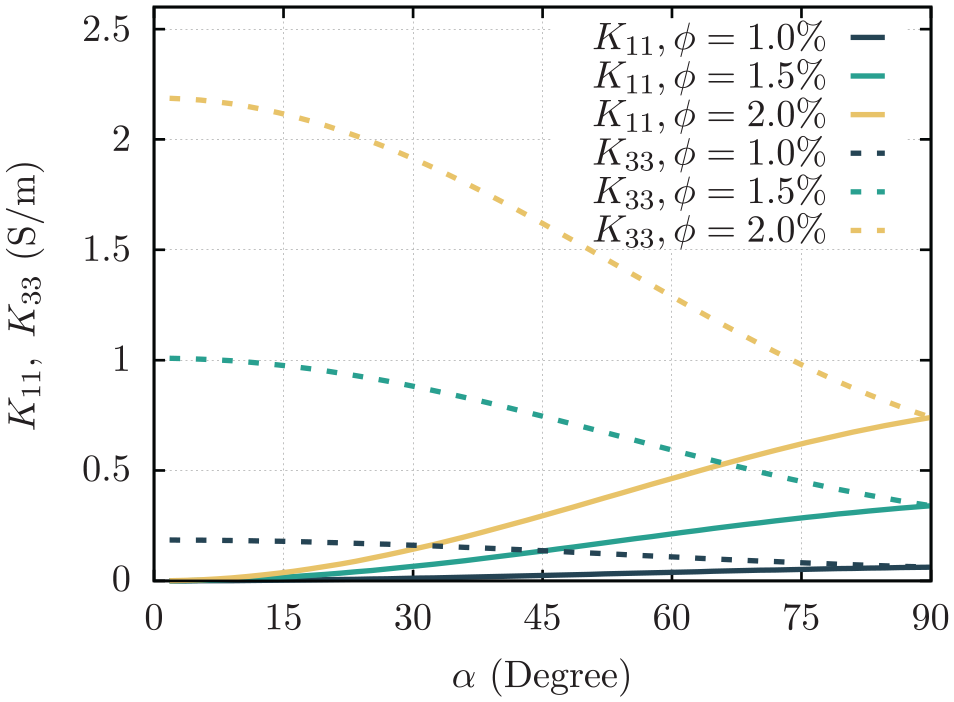
The effect of different
Figure 6 confirms that decreasing the angle from
4.2.2. Distribution function
The other parameter that directs the orientations of inclusions is the distribution function
In the preceding analysis, a uniform distribution

and is demonstrated in Figure 7 for the uniform, linear, cosine, and exponential distributions. As shown, the exponential function gives the most aligned inclusions in one direction while in uniform distribution which is an ideal case, the inclusions are randomly distributed. We note that the probability distribution functions defined above are not unique. They can also be defined such that the function reaches zero smoothly. For example, the cosine distribution function
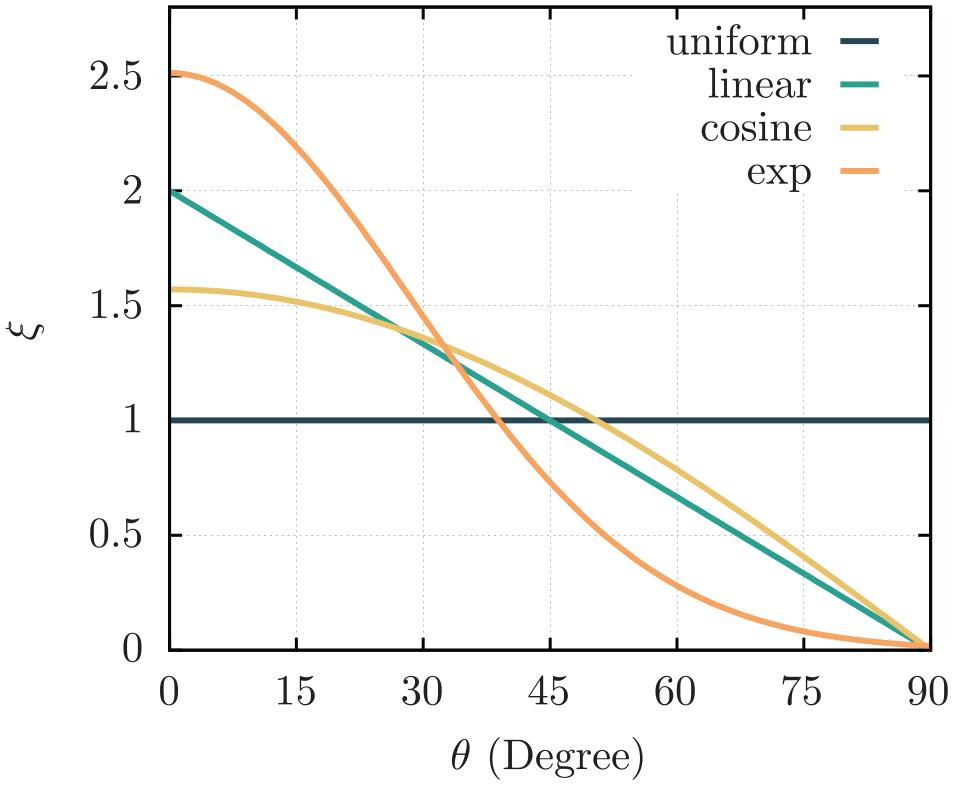
The uniform, linear, cosine, and exponential distribution functions versus
Figure 8 shows the effect of the four different distribution functions on the transverse and longitudinal electrical conductivity of composite for different volume fractions. As expected, a notable trend is observed; transitioning from a uniform distribution function to a non-uniform function exerts a pronounced effect on electrical conductivity. Specifically, such a shift results in higher longitudinal conductivity and lower transverse conductivity. This disparity becomes particularly evident and significant as the volume content of CNTs is increased. This finding underscores the critical role played by the distribution function in shaping the electrical properties of CNT-based composites, highlighting its significance as a key parameter in the design and optimization of such materials.
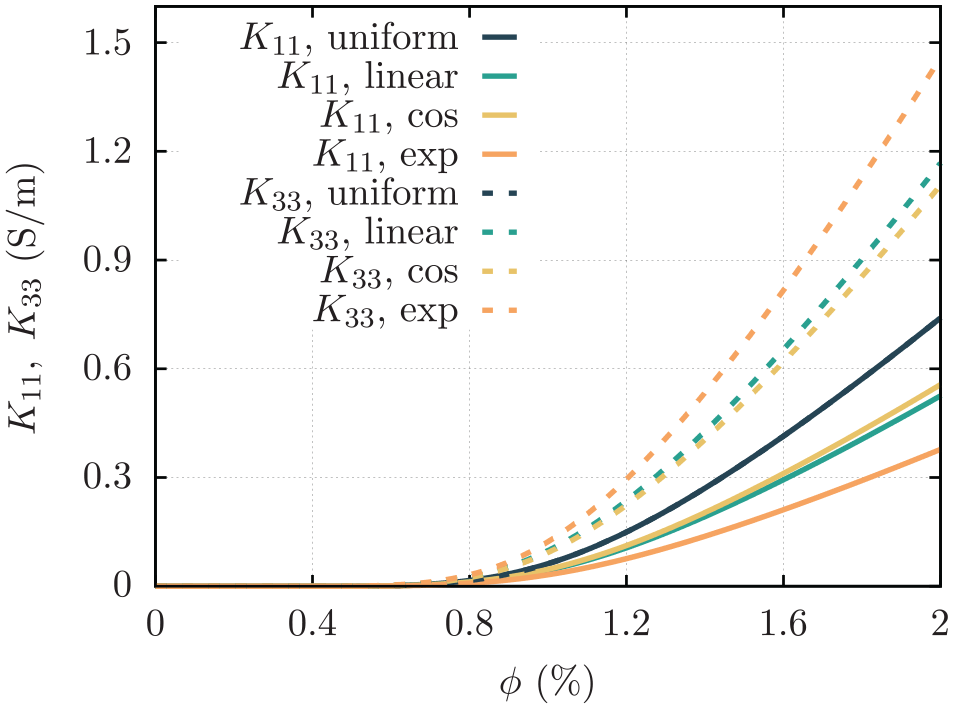
The effect of different distribution functions on the transverse (solid lines) and longitudinal (dashed lines) electrical conductivity of the composite.
4.2.3. CNT dimensions
Different single-walled and multi-walled CNTs with various architectures such as armchair, chiral, and zigzag can be found in various diameters and lengths, offering a versatile selection of composite fillers [73, 74]. Here, the effect of the size of CNT length and diameter on the electrical conductivity is investigated. The analysis of how varying the size of CNTs impacts the electrical conductivity contributes to a deeper understanding of the relationship between CNT dimensions and conductivity, guiding the selection of appropriate CNT fillers for various applications.
Figure 9 demonstrates the effect of the size of CNT particles with different volume fractions on the electrical conductivity of the composite with uniform distribution. It can be observed that longer CNTs demonstrate higher electrical conductivity compared to shorter ones. This can be attributed to the increased number of conductive pathways formed by longer CNTs, allowing for more electrons to pass through the material. Conversely, shorter CNTs exhibit lower conductivity due to the reduced number of conductive sites available. Also, keeping the volume fraction constant, composites made with CNTs of smaller diameters tend to exhibit higher effective electrical conductivity compared to composites made with CNTs of larger diameters. This is because of the higher surface area to volume ratio of CNTs with smaller diameters, which enables a greater number of conductive paths for electrons passing through the composite. Upon increasing the length or decreasing the diameter of the CNT beyond a certain threshold, no significant change in the conductivity is observed. At this point, the conductivity reaches a plateau as the dominant factors affecting conductivity, such as intrinsic material properties and the distribution of the CNTs, become more influential.
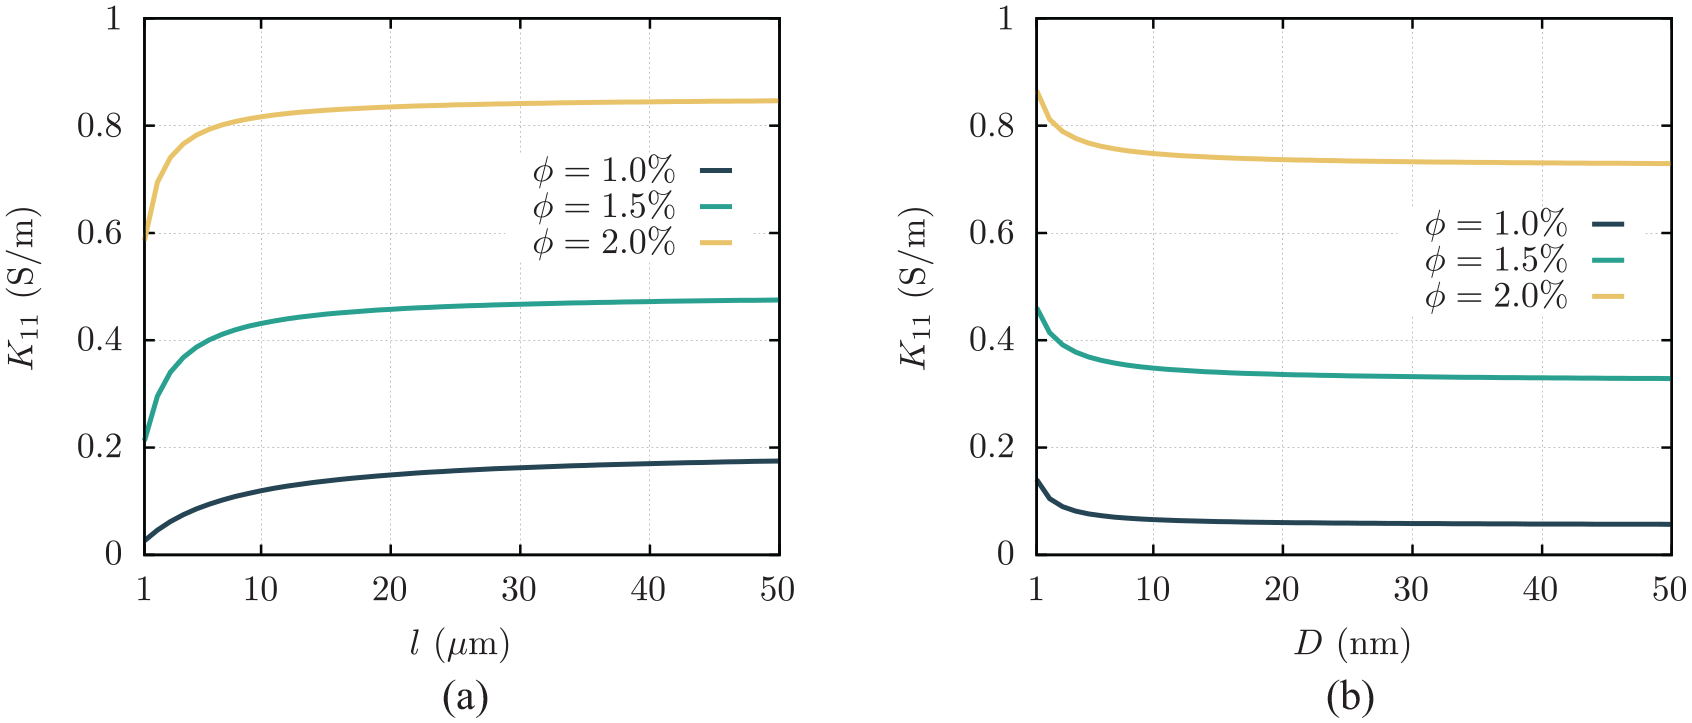
The effect of (a) the length and (b) the diameter of CNTs on the electrical conductivity of composite with uniform distribution for
Figure 10 shows the impact of the size of CNT particles with different distribution functions on the electrical conductivity behavior of the composite material with
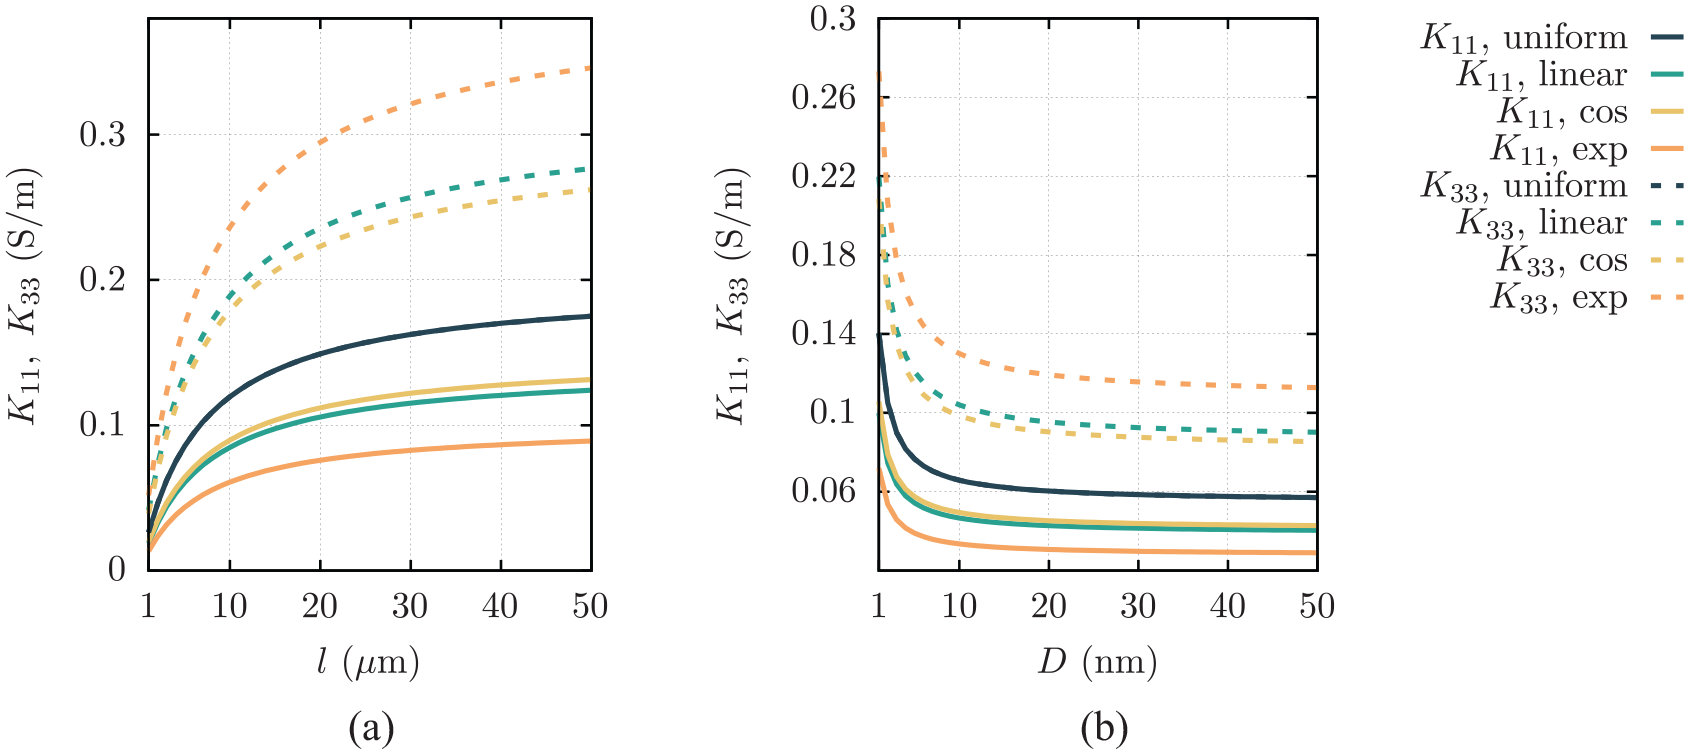
The effect of (a) the length and (b) the diameter of CNTs on the transverse (solid lines) and longitudinal (dashed lines) electrical conductivity of composite with
Overall, these results highlight the complex interplay between CNT length, diameter, distribution, and volume fraction in determining the electrical conductivity of the composite material. This complexity highlights the need for a detailed understanding of the combined effects of these parameters. The findings emphasize the importance of carefully considering these parameters as they significantly impact the electrical conductivity and, consequently, the performance of such materials in various applications. The conductivity plays a crucial role in determining the overall performance of such materials across a spectrum of applications. It is evident that variations in CNT length, diameter, distribution, and volume fraction contribute to the diverse electrical properties observed in the composite. This insight emphasizes the necessity for a thoughtful approach to the design and engineering of CNT/polymer nanocomposites.
5. Conclusion
In this study, the overall electrical conductivity of composites with distributed inclusions is investigated with a specific focus on the impact of orientation and distribution of inclusion. An analytical model is presented based on Eshelby’s equivalent inclusion deriving mathematical relationships through a rigorous step-by-step process. Despite the popularity of EIM for predicting conductivity, a lack of detailed formulation derivation is sensed in recent literature. This paper addresses this gap and highlights the commonly overlooked non-uniform distribution of inclusions. The model is developed to predict the electrical conductivity of composites with random as well as preferred distribution of the fillers. This EIM formulation is valid for predicting the electrical and thermal conductivity of composites reinforced by randomly oriented ellipsoid fillers. The method is further extended by considering an interphase layer around the inclusion.
Subsequently, the method is extended for electrical conductivity of CNT-filled composites by assuming the interphase layers around the particles function as electron tunneling and conductive networks. The validity of the model is confirmed by comparing its results with experimental data from four different CNT-reinforced polymer matrices. The values of the energy barrier are determined for each case study based on a comparison to the experimental data, and it is observed that the energy barrier plays a crucial role in predicting electrical conductivity. It is worth noting that this issue has been rather avoided to be discussed in depth in the literature, and the sensitivity of analytical models to these parameters is neglected in most cases except for a few articles. Furthermore, a parametric study is conducted to investigate the effects of different aspects of the reinforcements on the transverse and longitudinal electrical properties. The effects of CNT orientation and distribution patterns on the electrical conductivity, highlighting how the alignment of CNTs influences overall properties, are investigated. Two measurements, namely, the limit angle of inclusion orientation and probability distribution function, are used to control the orientation. The limit angle of CNT orientation is varied, and it is found that decreasing the angle from a uniformly random distribution to a fully aligned state results in a drastic decrease in the transverse electrical conductivity. However, the longitudinal electrical conductivity shows less sensitivity to the angle variation. Also, it is revealed that distributing CNTs with non-uniform probability distribution functions has a noticeable impact on electrical conductivity. In particular, this shift leads to an increase in longitudinal conductivity and a decrease in transverse conductivity. This difference becomes more prominent when the volume content of CNTs is raised. In addition, the effects of particle dimensions are examined. It is observed that composites with shorter CNTs demonstrate lower electrical conductivity compared to composites with longer CNTs. This is due to the reduced number of conductive pathways available in shorter CNTs. CNTs with smaller diameters exhibit higher electrical conductivity of composite compared to those with larger diameters of CNTs. However, beyond a certain threshold, further modification of the length or the diameter of CNTs has a minimal impact on electrical conductivity as other factors become more influential.
The presented analytical model facilitates the design and optimization of composite materials for specific electrical conductivity requirements. This approach finds applications in fields such as flexible electronics, smart materials, energy storage, and aerospace, guiding the development of advanced materials. The presented mathematical model assumes simplifications such as straight CNT particles with uniform dimensions, neglecting their actual curviness, variability, agglomeration, segregation, and void formation effects observed in reality. This analytical framework provides a straightforward method for predicting the electrical conductivity of CNT-reinforced composites. The same framework can be used to model the thermal or electrical conductivity of any composite where inclusions might have multiple coatings. However, for modeling CNT nanocomposites more accurately, certain manufacturing-induced complexities need to be accounted for. Further research directions may include expanding the model to incorporate additional factors and parameters such as the waviness and the clustering of CNTs or performing the model on other fillers such as graphite, as well as incorporating experimental data from a wider range of composite materials. Modeling these important features is an important research direction that will be considered as an extension of this work.
Footnotes
Appendix 1
Funding
The author(s) disclosed the following financial support for the research, authorship, and/or publication of this article: The authors acknowledge the support of Engineering and Physical Sciences Research Council through the project no. EP/V030833/1.