
Abstract
Introduction
Pulmonary B-lines can be seen on lung ultrasound (LUS) and indicate the presence of pulmonary edema, as is seen in high-altitude pulmonary edema (HAPE). While asymptomatic B-lines have been observed in high-altitude travelers without clinical HAPE, their prevalence and relationship to high-altitude physiology remain poorly understood. This study aims to characterize B-line development in high-altitude travelers and its relationship to physiologic changes.
Methods
This observational study investigated adult trekkers in Nepal's Khumbu Valley. An 8-point LUS was performed to obtain a B-line quantification score. Altitude (2610–5364 m), vital signs, and Lake Louise score (LLS) for acute mountain sickness (AMS) were also recorded. A subset of participants was followed longitudinally as they ascended. Regression analyses were performed to compare the B-line score with altitude, pulse oximetry (SpO2), and LLS.
Results
A total of 88 subjects were enrolled, and 21 of these were followed longitudinally. There was a significant positive correlation between altitude and B-line score (r = 0.18, p = .049) in the general population; however, this finding was not significant in the longitudinal group (r = 0.21, p = 0.13). B-line score was inversely correlated with resting SpO2 (r = -0.3, p = 0.0008). There was no significant relationship between B-line score and LLS (r = 0.14, p = 0.12).
Conclusions
LUS B-line scores were higher with increases in altitude, and resting SpO2 decreased with higher B-line scores. B-line scores were not correlated with the development of symptoms of AMS. More research is needed to elucidate the clinical significance of these asymptomatic findings.
Keywords
Background
B-lines, also known as ultrasound comet tails, are a lung ultrasound (LUS) artifact caused by vertical reverberation and indicate the presence of pulmonary edema. 1 These ultrasound findings are seen in a wide variety of conditions associated with fluid extravasation into the lung parenchyma, including high altitude pulmonary edema (HAPE), a severe form of pulmonary edema associated with rapid ascent to high altitude. Significant physiological changes associated with decreased partial pressure of oxygen occur at high altitudes, typically above 2500 m (8200 ft). At these elevations, individuals can experience lower peripheral oxygen saturation (SpO2), increased respiratory rate, and diminished exercise performance, even in the absence of noticeable symptoms or development of acute mountain sickness (AMS) or HAPE. 2
Point-of-care ultrasound (POCUS) has been increasingly used in the early detection of HAPE. However, while B-line presence on LUS is a sensitive finding for HAPE, it is nonspecific and there is currently no agreed-upon threshold for B-line prevalence that is diagnostic of HAPE.3,4 Prior research shows that B-lines increase with elevation, but there is significant variability regarding their relationship with clinical symptoms.5–13 While one small study found lower-than-expected B-line prevalence using a similar 8-point technique, we sought to validate this finding. 5
Study Aims
This study aims to further investigate the relationship between B-line development and altitude. We hypothesize that B-lines will be found more frequently at higher elevations, and B-line score (BLS) will be positively correlated with altitude. We additionally aim to evaluate the relationship between B-line presence and changes in pulse oximetry, as well as clinical symptoms that often correlate with the degree of acclimatization (headache, gastrointestinal symptoms, weakness/fatigue, and dizziness).
Methodology
Study Design and Participants
This study was an observational cross-sectional study evaluating the correlation of pulmonary B-lines, altitude, and Lake Louise score (LLS). Participants were enrolled from a convenience sample taken at multiple different locations and altitudes along the Everest Base Camp (EBC) trail in the Khumbu Valley of Nepal. Information gathered from the participants included a survey questionnaire (with LLS), vitals (BP, HR, RR, SPO2), and LUS B-line quantification using an 8-point POCUS technique. 14 The elevation of each participant's location was also recorded in order to assess for changes in vital signs, B-line prevalence, and LLS with respect to altitude. Subjects were re-enrolled if we came across them again on their ascent path. This resulted in some participants being assessed at multiple points throughout their ascent, creating a subset of individuals that were followed longitudinally, undergoing serial LUS and independent analysis as their daily elevation increased along the trail. Participants were included in the longitudinal group if they had at least 2 measurements performed at different altitudes. The most measurements contributed by an individual participant was 4.
Subjects were eligible for inclusion if they were 18 years or older, at a current elevation greater than 2500 m (8200 ft), had a home elevation of less than 2500 m, and were in the ascent portion of their itinerary. Potential subjects were excluded if they had a history of chronic lung conditions or heart failure, if they had previously ascended to a similar elevation during the preceding month, or if they exhibited signs or symptoms of HAPE.
The protocol was reviewed and approved by the University of Colorado Combined Institutional Review Board (COMIRB) and Nepal Health Research Council (NHRC) prior to subject enrollment. Written informed consent was provided by all study participants.
Sampling and Data Collection
All subjects were recruited from lodges along the EBC trail. Each subject verbally provided basic demographic information, medical data, and LLS using a questionnaire. In order to study asymptomatic pulmonary edema, all potential participants were screened for symptoms of HAPE and were excluded and sent for urgent medical evaluation if positive. Vital signs were recorded using an automatic blood pressure cuff and a fingertip pulse oximeter. SpO2 readings were verified by ensuring appropriate waveforms with the readings. An 8-point LUS was performed on each subject using a Sonosite iViz (FUJIFILM VisualSonics, Toronto, Canada), in which the probe was placed at 8 different points on the patient's anterior/lateral chest to screen for the presence of B-lines. The presence or absence of B-lines was noted for each view, and if present, the B-lines were quantified and scored. 14
B-Line Scoring (BLS) Quantification
A validated 8-point LUS technique with anterior and lateral zones was used to detect the presence of B-lines. 14 The 2 anterior zones included one view at the apex and the other a rib space below for each lung. The lateral zones were one view just above the diaphragm and one rib space above for each lung. In order to quantify the severity of B-lines and therefore pulmonary edema, a scoring system validated for 8-point LUS was utilized: 0 B-lines = 0 points, 1–2 B-lines = 1 point, 3 or more distinct B-lines = 2 points, and confluence of an interstitium (25% or more) = 3 points. 14 The total BLS used is the sum of the scores for all 8 lung views.
Statistical Analysis
Regression analyses were performed to obtain a correlation coefficient and p-value for the relationships of BLS with elevation, SpO2, and LLS, individually. BLS was used as the dependent variable in these analyses. Given the concern of the lack of independence of this analysis, we repeated the evaluation of BLS and elevation using only the first entry of participants who were scanned multiple times. We additionally evaluated the relationship between BLS and SpO2 while controlling for elevation by performing a multiple linear regression analysis with the response variable set as BLS and the exploratory variables set as SpO2 and altitude. We ensured that the underlying assumptions of the multiple linear regression were upheld by checking for normality and independence of the residuals, as well as making sure that the 2 exploratory variables did not show signs of multicollinearity.
Results
Participant Demographics
A total of 88 subjects were enrolled, and 21 of these subjects were followed longitudinally as they made their ascent. There were 55 scans from this longitudinal group, and a total of 122 LUS scans were performed. The average age was 38 years (range 20–71) in the general population and 36 years (range 21–69) in the longitudinal group. The general population consisted of 46 female and 42 male participants (52% and 48%, respectively), while the longitudinal population had 12 female and 9 male participants (57% and 43%, respectively). Average home altitude was 363 m (range 2 m–1901 m) for the general population and 408 m (range 5 m–1609 m) for the longitudinal group (Table 1). 14 Participants were recruited from 11 sites along the EBC trail, ranging in elevation from 2610 m to 5364 m (Table 2).
Participant Demographics.
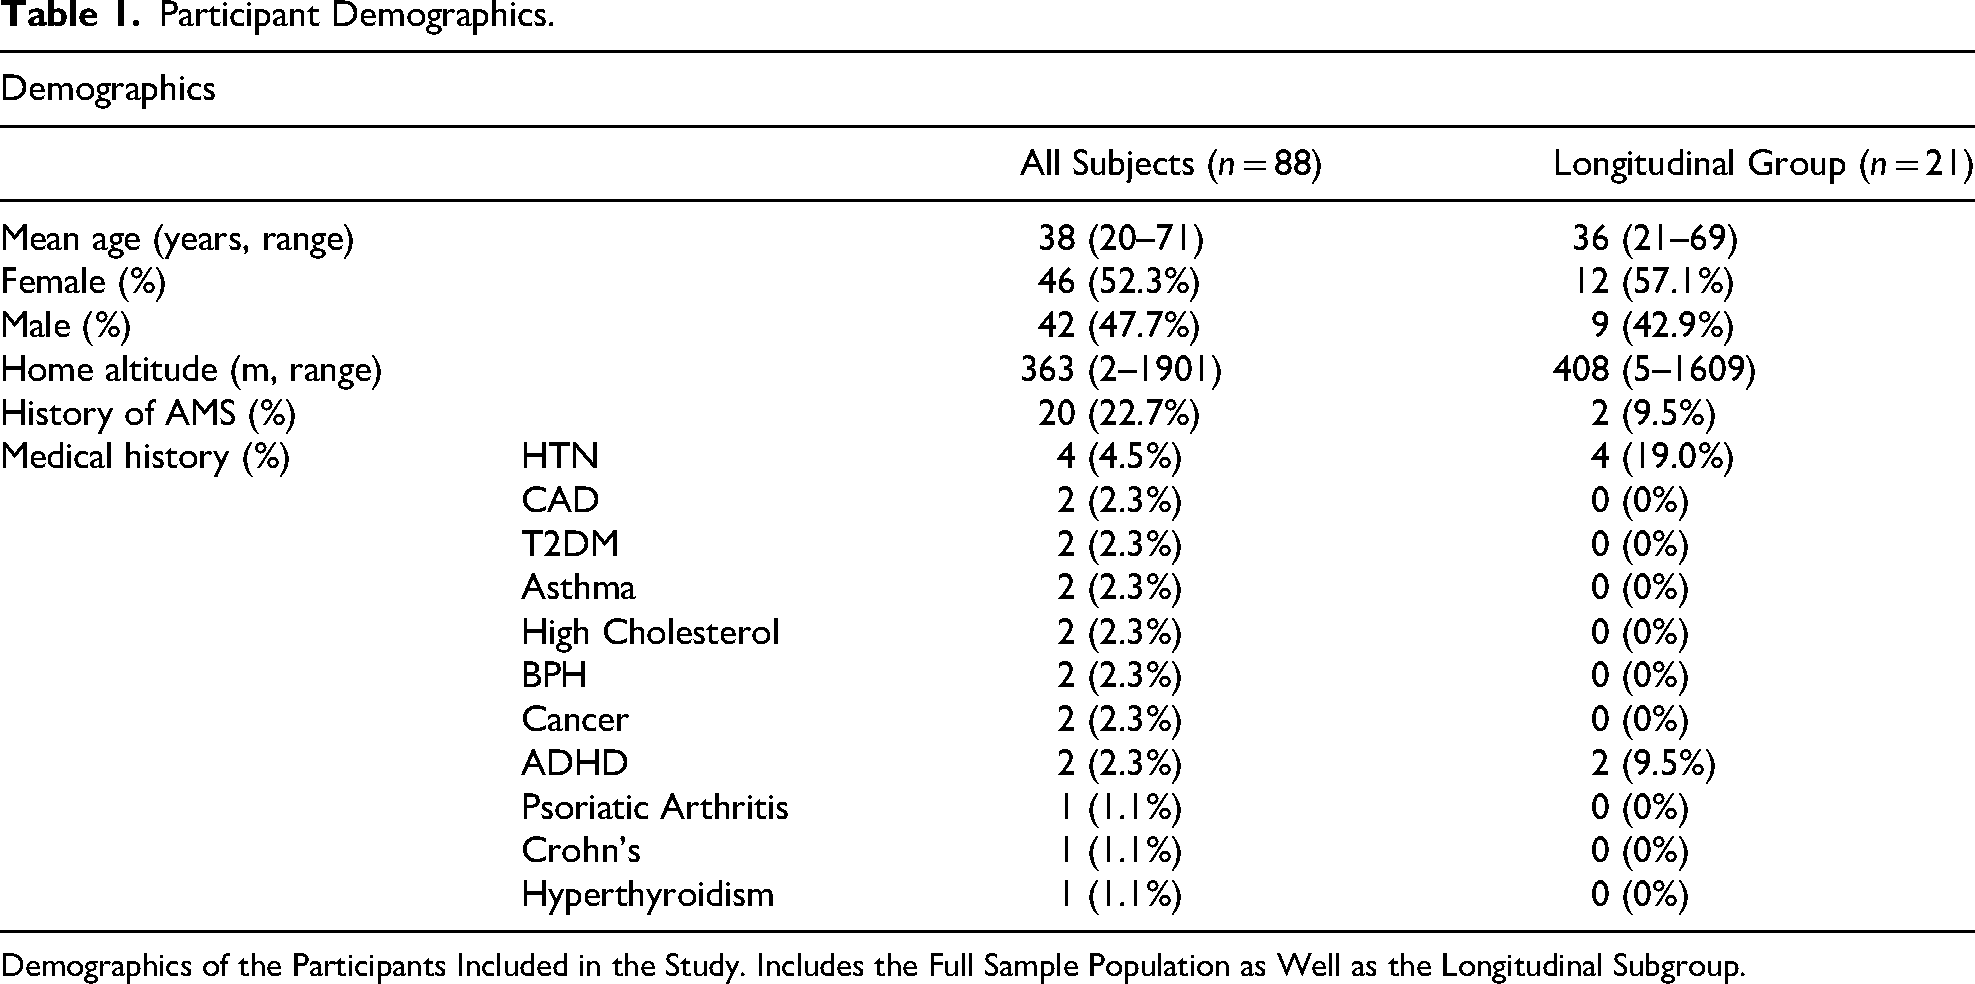
Demographics of the Participants Included in the Study. Includes the Full Sample Population as Well as the Longitudinal Subgroup.
Scanning Locations.
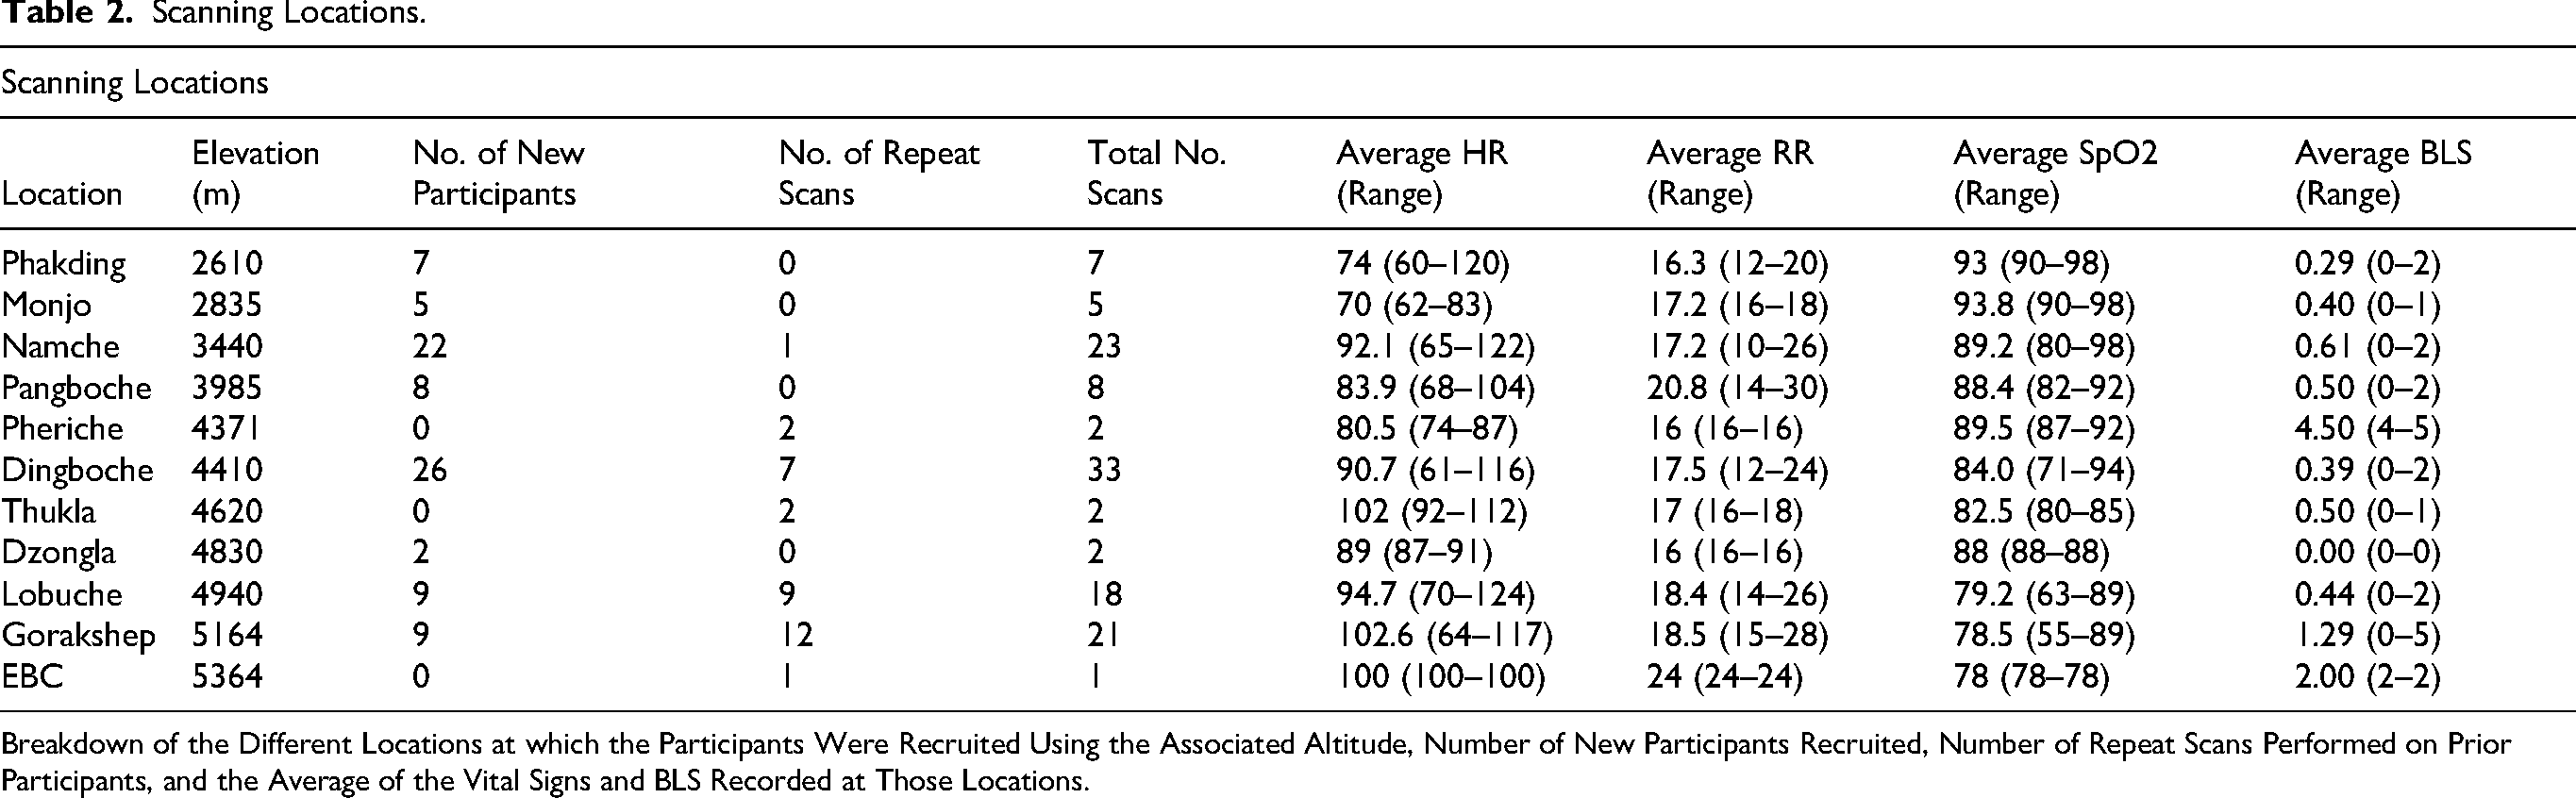
Breakdown of the Different Locations at which the Participants Were Recruited Using the Associated Altitude, Number of New Participants Recruited, Number of Repeat Scans Performed on Prior Participants, and the Average of the Vital Signs and BLS Recorded at Those Locations.
Lung Ultrasound
Of the 122 scans performed across all elevations (above 2500 m), 52 had at least one B-line present (42.6%). BLS for individual participants ranged from 0 to 5, with the majority of scans having a BLS of 0 (57.4%), and no scans having a BLS of 6 or more. Out of the 52 scans with BLS greater than 0, 17 scans (32.7%) had B-lines present in the anterior/superior lung zones, and 42 scans (80.8%) had B-lines in the lateral/inferior lung zones. The cumulative BLS for all 122 scans was 82—42 points from zones over the left lung field and 40 points from those over the right (51.2% and 48.8%, respectively) (Figure 1).
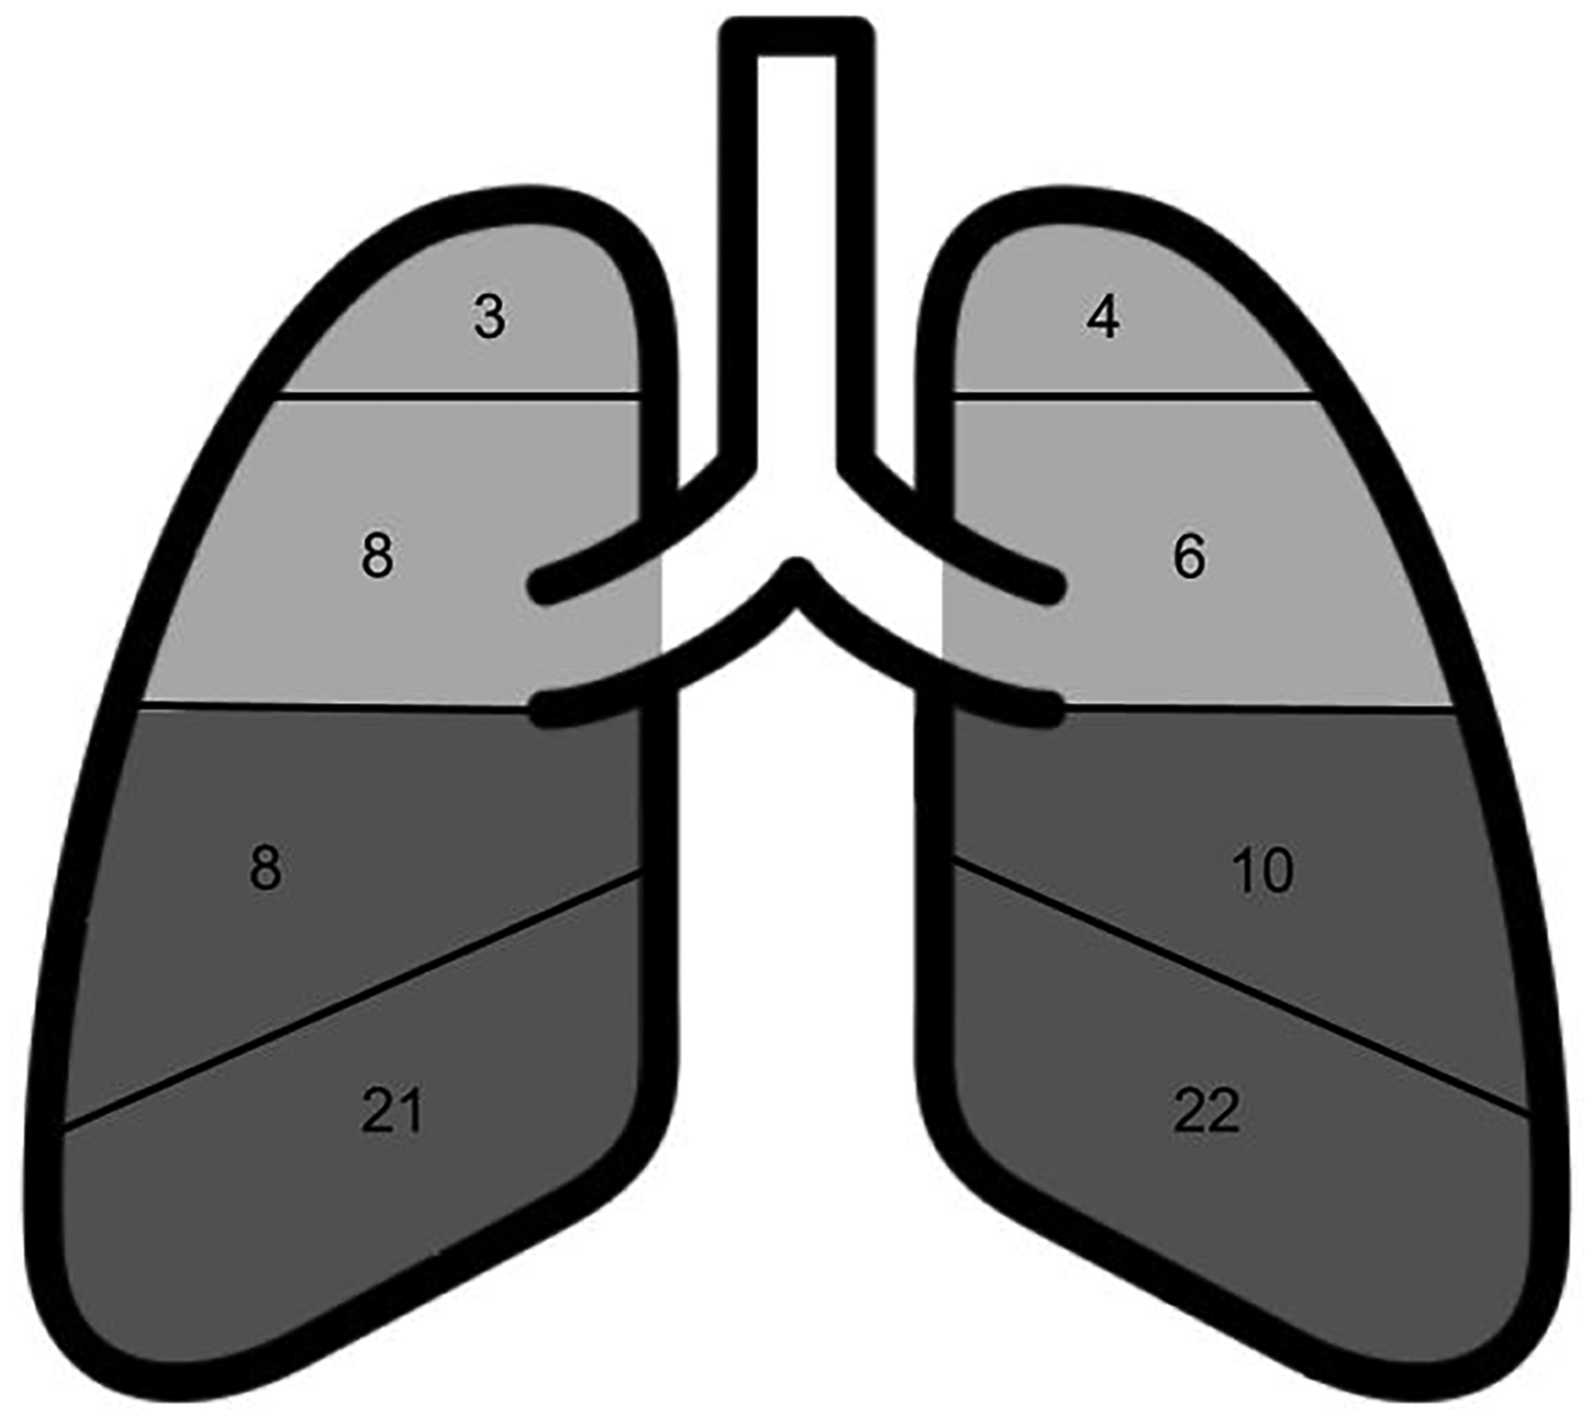
Cumulative B-line scores for each scanned lung field. An 8-Point LUS was done to quantify B-lines in 8 different lung zones. A sum of all B-line scores was calculated across all participants.
Relationship Between Altitude and BLS
There was a significant positive correlation between LUS screening altitude and BLS (r = 0.18, p = .049) in the general population, with the highest BLS recorded in participants (n = 2) at 3867 m and 4940 m (Figure 2). However, this correlation was not significant in the longitudinal group (r = 0.21, p = 0.13). When this regression was repeated using only the first scan of longitudinal participants, a weaker correlation that was not significant was seen (r = 0.12, p = 0.27). Of note, this analysis eliminated 34 scans of the total 122. The average altitude of the 122 scan analysis was 4257 m, the average altitude of the eliminated 34 scans was 4826 m, and the average altitude when only the first scan of each participant was used was 4037 m.
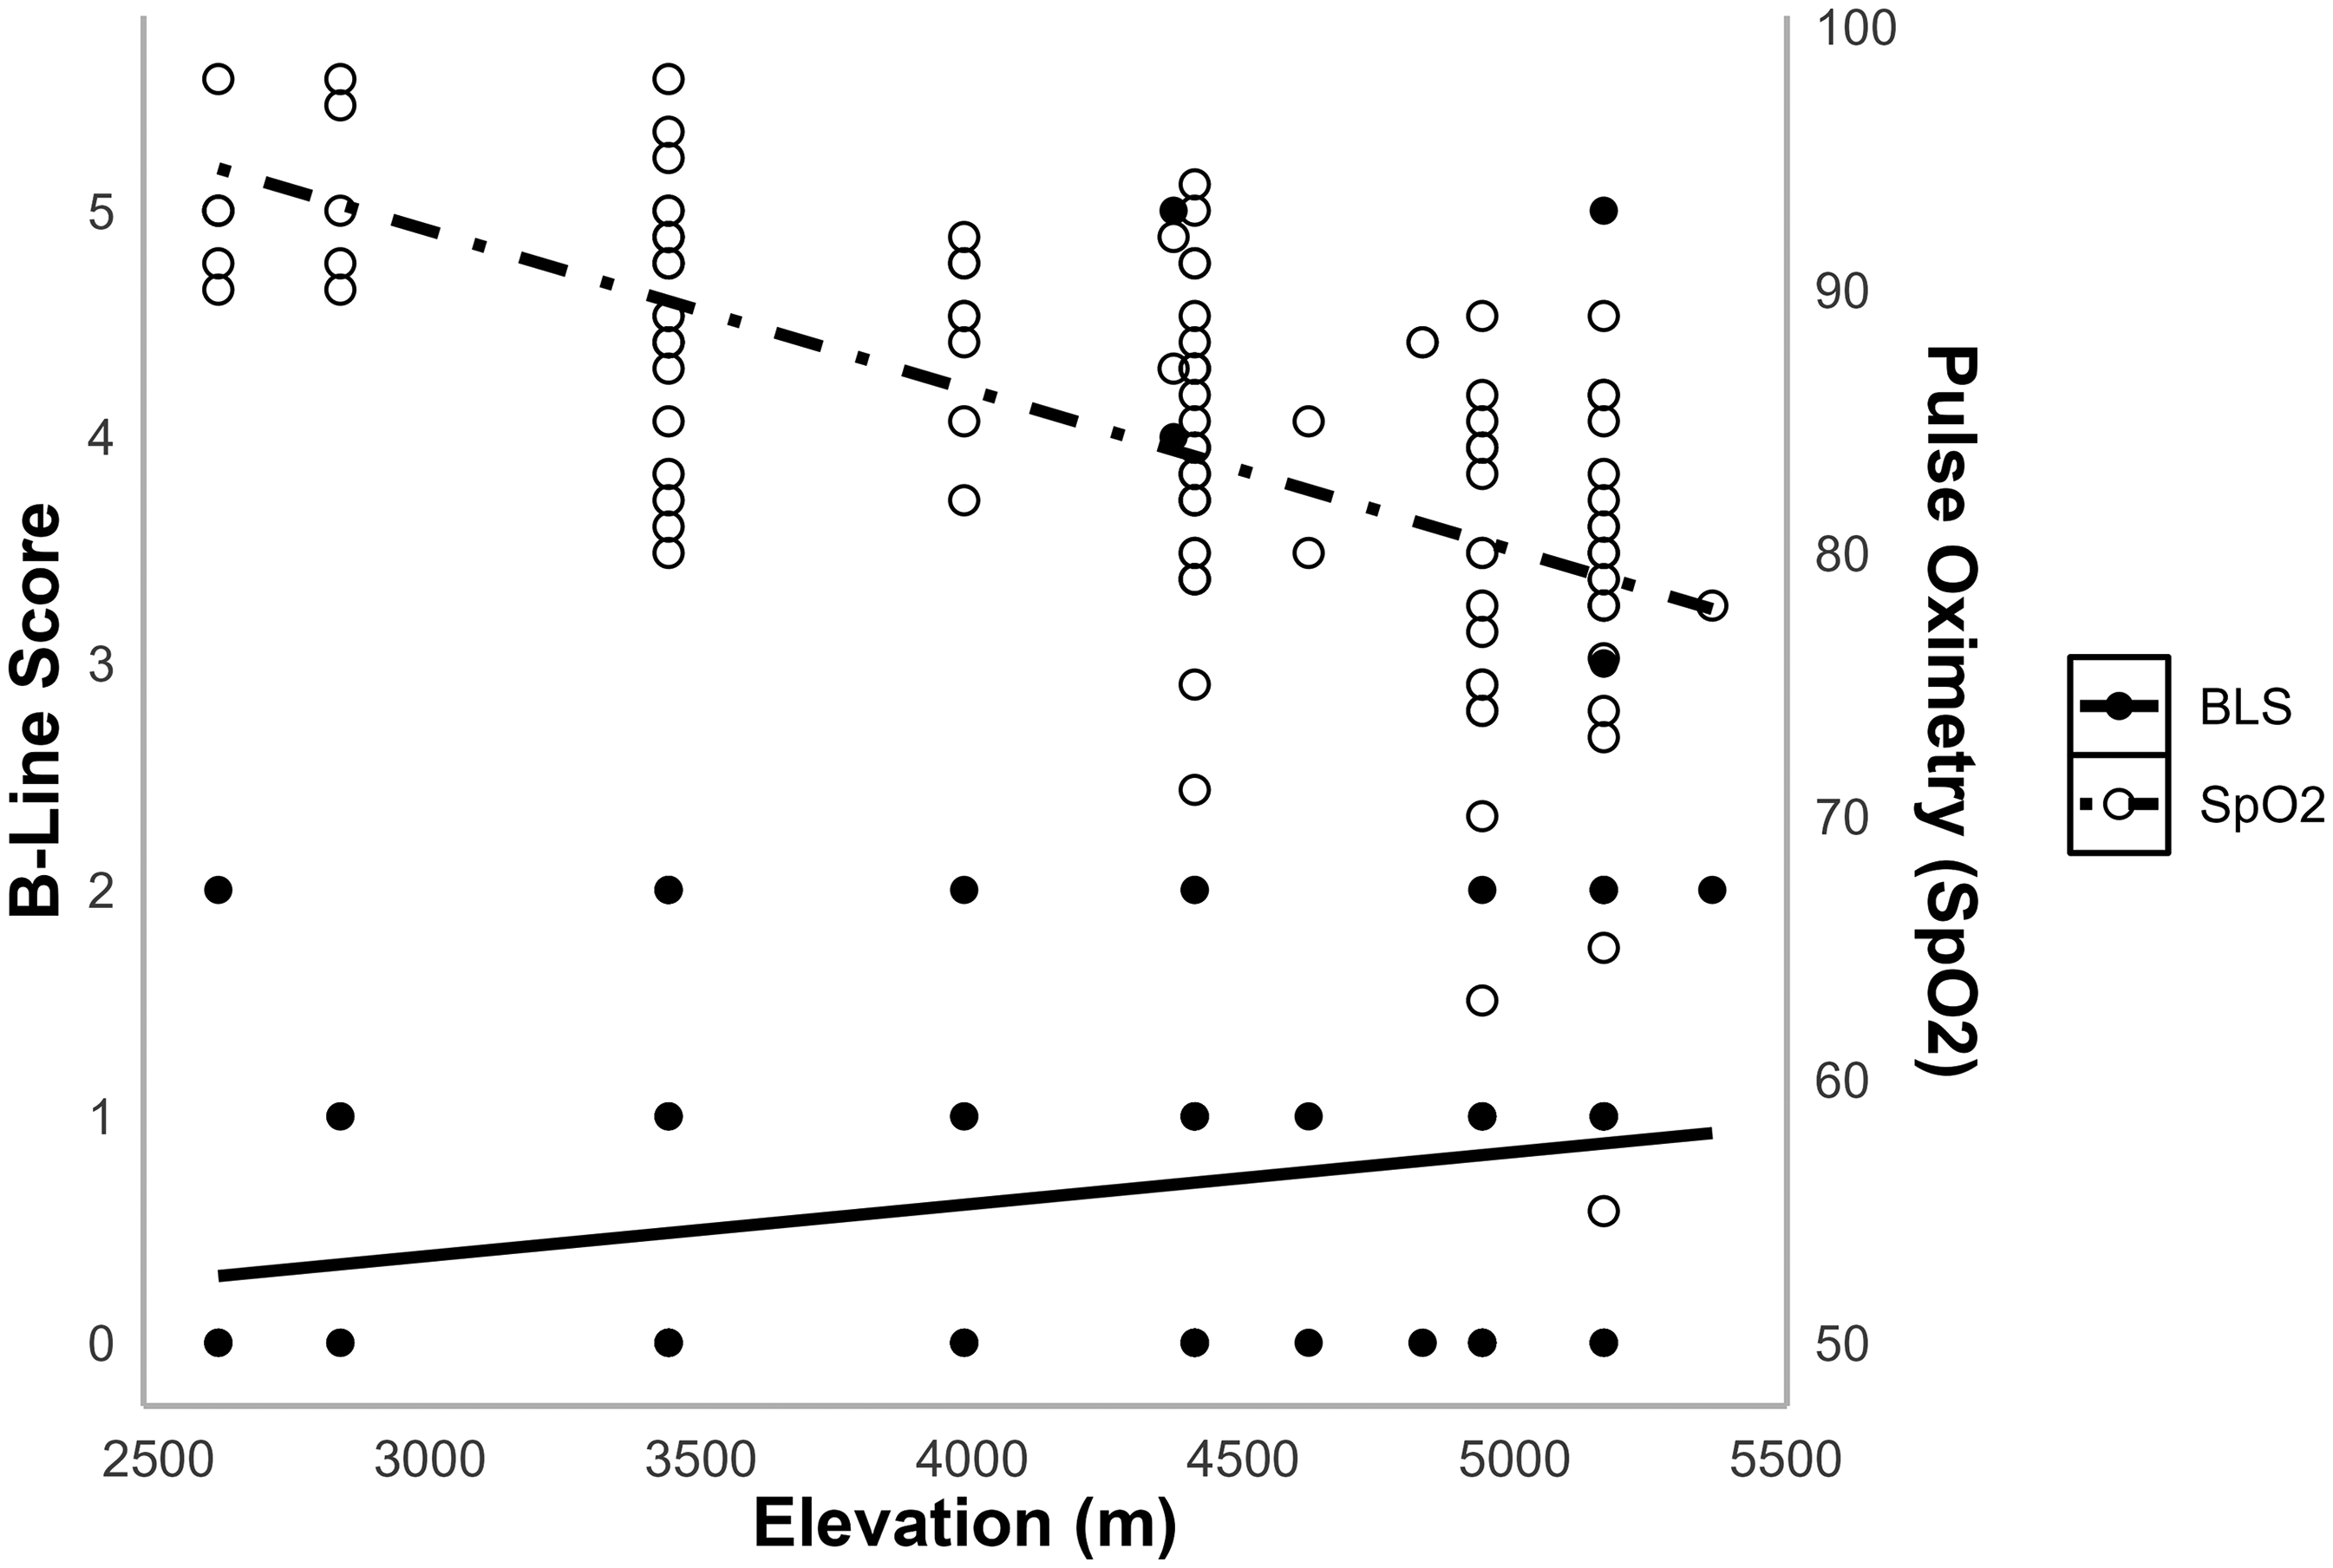
Elevation versus B-line score and elevation versus SpO2. B-line score was found to be positively correlated with elevation (r = 0.18, p = .049). SpO2 was found to be negatively correlated with BLS (r = –0.3, p = 0.0008), even when controlling for elevation (r = –0.1, p = 0.007).
Relationship of BLS with Pulse Oximetry and LLS
Observed BLS was inversely correlated with the resting SpO2 of each participant (r = –0.3, p = 0.0008), although this finding was not significant in the longitudinal group (r = –0.15, p = 0.28) (Figure 2). When controlling for altitude, the relationship between BLS and SpO2 remained statistically significant, although less strong (r = –0.1, p = 0.007). This analysis was not performed on the longitudinal group, given the small sample size.
There was no significant relationship between cumulative BLS and LLS in either the general population (r = 0.14, p = 0.12) or the longitudinal group (r = 0.069, p = 0.61).
Discussion
Findings
This study evaluated the potential relationship between subclinical pulmonary edema and high altitude through the detection of B-lines on LUS. We detected B-lines in 42.6% of LUS at elevations greater than 2610 m, a significantly lower proportion than previous similar studies conducted at similar elevations.6–9 This study utilized a simplified 8-point LUS protocol; the decreased B-line prevalence may be attributed directly to that screening technique. A study using a similar protocol found no evidence of B-lines until 5380 m and then only reported 1 out of 15 participants (6.7%) with evidence of subclinical pulmonary edema. 5 Our study presents a similar ultrasound protocol with a much higher incidence of subclinical pulmonary edema. This difference in incidence may be a result of our larger sample size or our sample population. While the previous study's population consisted of a guided group undergoing the same ascent profile, we did not control for ascent profile and therefore may have captured more subclinical pulmonary edema because of more participants with inadequate acclimatization. This study also used a qualitative approach, defining interstitial edema as 3 or more B-lines in 2 ultrasound windows, while we used quantitative BLS to evaluate for edema.
BLS was found to be higher with increases in altitude and decreases in measured SpO2 but was not correlated with LLS. The finding that BLS increases with altitude has been demonstrated in multiple prior studies.5–11 While this finding was not significant when repeated with only the first scan of all participants (n = 88), this may be due to a lower sample size and decreased amount of scans at higher altitudes. This finding was further supported by the negative correlation between SpO2 and BLS, as SpO2 is known to decrease with altitude. 15 We additionally found SpO2 to be negatively correlated with BLS even when controlling for altitude. Although this was a weak association and requires further validation, it may suggest a change in oxygen saturation resulting from subclinical pulmonary edema. The clinical importance of this finding remains uncertain, as all the participants in this study were asymptomatic.
BLS was used to quantify the sonographic severity of subclinical pulmonary edema in our population. While LLS is used to quantify the severity of AMS, a disease process believed to be separate from the development and presentation of HAPE, we used LLS as a proxy for subjective acclimatization in our population. In comparing LLS and BLS, we attempted to analyze if a relationship existed between participants experiencing symptoms of inadequate acclimatization and those who had subclinical pulmonary edema, but we did not find evidence of such a relationship.
B-lines were found predominantly in lower lung fields, indicating that fluid collection in subclinical pulmonary edema may develop in a gravity-dependent manner similar to other forms of pulmonary edema.
No participants reported clinical symptoms of HAPE, despite showing the characteristic LUS findings that are typically associated with the illness. One participant had a BLS of 5 and an SpO2 of 55%, however, did not report any clinical symptoms of HAPE, such as dyspnea at rest, and was therefore included in the study. While an SpO2 of 55% was an outlier in our population, we did record 22 participants with an SpO2 of 70–79% and 2 with an SpO2 of 60–69%. As HAPE is ultimately a clinical diagnosis, and little consensus exists on “normal” pulse oximetry at altitude, we did not exclude participants with low SpO2 as long as they were asymptomatic for HAPE. We are not aware of any participants going on to develop HAPE following their enrollment and did not have any participants present for treatment at the clinic in which we were based in Pheriche (4371 m). However, no formal follow-up was conducted. At this time, there is no formal BLS threshold diagnostic of HAPE, and therefore, accurate diagnosis of this condition requires careful clinician evaluation. While the finding of B-lines on LUS can be helpful in differentiating the diagnosis of HAPE from other causes of respiratory distress at altitude, the presence of B-lines alone without respiratory symptoms is of unclear significance. Therefore, more research is needed to understand the appropriate weighting of LUS findings in diagnosing HAPE. While the results from this and similar studies indicate the possibility of a spectrum of disease, more research is needed to determine if this is truly the case, or if individuals exhibiting asymptomatic B-lines are at heightened risk of developing clinical HAPE upon ascent to higher elevations.
Our findings that LLS was not correlated with BLS was demonstrated in 2 out of the 5 studies that were reviewed, indicating that more research is needed to further evaluate this relationship.4,6–10 HAPE and AMS are entirely different physiologic disruptions; however, more study is needed to determine if increases in LLS are due to impaired oxygenation from B-lines or are simply correlated with increases in altitude alone.
Our study provides additional data on B-line incidence at high altitude and demonstrates that 8-point LUS can be used to demonstrate sonographic evidence of asymptomatic pulmonary edema, albeit at lower rates than more extensive scanning protocols. We found BLS to be independently associated with lower SpO2, although further research is needed to elucidate the clinical significance of this finding. We additionally present evidence that asymptomatic B-lines are not correlated with subjective measurements of impaired acclimatization, such as LLS. Future studies could be performed to evaluate if BLS in patients who are asymptomatic at rest is correlated with decreased exercise capacity and/or exertional dyspnea to further analyze the clinical significance of these B-lines. Additional future areas of research include expanding the sample size of the longitudinal group to generate more data in a homogenous population and evaluating BLS in asymptomatic patients who are followed longitudinally to correlate with HAPE development.
Limitations
Our study reported a significantly lower rate of B-line development than previous studies, using an 8-point scanning pattern. This simplification may have resulted in decreased sensitivity in B-line detection compared to other studies since fewer lung windows were imaged. Additionally, the longitudinal group was still relatively small, making generalization of these results and identification of more subtle data trends more difficult.
Footnotes
Acknowledgments
We would like to sincerely thank the Himalayan Rescue Association for allowing this research to be conducted in proximity to their clinic and with their providers and patients. We would also like to sincerely thank Sonosite for loaning the iViz portable ultrasound devices used in this research.
Ethical Considerations
The protocol was reviewed and approved by the University of Colorado Combined Institutional Review Board (COMIRB) and Nepal Health Research Council (NHRC) prior to subject enrollment.
Consent to Participate
Written informed consent was provided by all study participants.
Author Contribution(s)
Financial/Material Support
The authors received no financial support for the research, authorship, and/or publication of this article.
Disclosures
The authors declared no potential conflicts of interest with respect to the research, authorship, and/or publication of this article.
Data Availability
The data underlying this article will be shared on reasonable request to the corresponding author.