
Abstract
Following a network perspective, risk of sexual reoffending can be understood as a construct that emerges from the interactions between risk factors. If these interrelationships are validly mapped out, this leads to an increased understanding of the risk and thus may contribute to more effective and/or more efficient interventions. This paper reports on personalized network modeling mapping the interrelationships of dynamic risk factors for an individual convicted of sexual offenses, using experience sampling (ESM) based on Stable-2007 items. The longitudinal character of ESM enables both the assessment of interrelations between risk factors within a timeframe and the relationships between risk factors over time. Networks are calculated and compared to the clinical assessment of interrelationships between the risk factors.
Introduction
People convicted of sexual offenses form a very heterogeneous group, varying considerably in personal characteristics as well as the characteristics of their victims and their offenses, and, more importantly, in their risk of reoffending. Yet research has established several risk factors that are important in the assessment of recidivism risk for all people convicted of sexual offenses (Hanson & Morton-Bourgon, 2005). These established risk factors include dynamic traits and proclivities, like those listed in Stable-2007 (Hanson et al., 2007), one of the most used risk assessment instruments for this group (Kelley et al., 2020). Although not without criticism (Ward & Fortune, 2016), these dynamic risk factors predict reoffending, and a decrease in these dynamic risk factors is associated with lower risk of reoffending (Van den Berg et al., 2018). This indicates these factors as legitimate treatment targets that may have causal connections to the offending behavior.
Constructs and Networks
Risk factors for people convicted of sexual offenses are often theorized to refer to underlying propensities or latent constructs that embody the risk of reoffending (e.g., Mann et al., 2010; Brouillette-Alarie et al., 2022). These latent, underlying constructs are unobserved and inherently uncertain (Cronbach & Meehl, 1955), and although the theoretical model that includes the construct evolves with evidence, it is never known with certainty, at least not in psychology. In this view, the risk factors can be understood as “markers” or “symptoms” of the underlying risk construct. The word “symptom” originates from the medical world and implies there is a specific disease that underlies certain symptoms. For example, a headache is a possible symptom of a brain tumor. Mental disorders are often regarded in a similar way within mental health care (Borsboom, 2017): all symptoms are considered to arise from an underlying unambiguous condition, namely the disorder.
Alternatively, it can be argued that a mental disorder arises when a causal system of symptoms develops that dynamically influence and cause each other (McNally, 2016), thus together creating the construct rather than being symptoms referring to it. The causal system in which the symptoms influence each other can be visually displayed in a network. In recent years, this network-thinking has received increased attention, as statistical models have been developed that allow estimating the relationships in these networks (Fried et al., 2017). In a network, the different factors are not analyzed as “symptoms” that refer to an underlying latent construct but as a complex network of factors that mutually influence each other (Borsboom & Cramer, 2013). We do not regard the network models as superior or preferable to propensity models, but merely as a different perspective which may provide new insights and possibilities. Network analyses show which factors play a central role and which possible causal or temporal relationships may exist between the factors. Network analysis has been used to map various mental disorders, such as anxiety disorders (Heeren & McNally, 2016), autism (Deserno et al., 2017) and PTSD (McNally et al., 2015).
The way in which factors within a network influence each other can lead to the resulting construct being maintained over time. Looking at disorders, there is often an influence of factors that form a feedback loop (Borsboom, 2017). An example are dietary restrictions that a person imposes on themselves, which predict subsequent binge eating, which predicts subsequent dietary restrictions, for example, via feelings of guilt about the binge eating. The interaction between these factors is self-perpetuating. For the treatment of disorders, it is important to gain insight into how these interactions manifests themselves and to find ways to break them. To assess temporal relationships, time series data or repeated measurements are needed (Bringmann et al., 2013). The use of data from cross-sectional research cannot reflect the directions and possible causal nature of the relationships between factors (Borsboom & Cramer, 2013; Rhemtulla et al., 2016).
Networks of Risk Factors
Like mental disorders, the risk of sexual reoffending can also be understood as a construct emerging from the interactions, balances, and feedback loops between risk factors. Recently, network analysis has been applied to risk factors for people convicted of sexual offenses (Van den Berg et al., 2020). In this study, network analysis was applied to single assessment data of Stable-2007 items of 788 sex offenders from the Dynamic Supervision Project (DSP; Hanson et al., 2007). Results showed how dynamic risk factors related to each other on a group level. For instance, the factors “Social rejection/loneliness”, “Lack of concern for others” and “Sex as coping” took the most central positions, meaning that these risk factors had the most and strongest relationships with other risk factors. Van den Berg et al. (2020) theorized that when related dynamic risk factors are triggered, they may come together in a feedback loop that increases the risk of recidivism. And that, conversely, a successful intervention targeting connected risk factors may result in breaking a feedback loop and creating a new balance at a lower risk level. Such a model is in accordance with the clinical observation that in treatment patients tend to show “turning points” at which several risk factors appear to collectively decrease, instead of a gradual, one by one, decrease of the specific risk factors targeted in treatment (Cording, 2018).
The notion that risk-factors interact is not new. The role of different risk factors involved in different stages of the build-up to, and the perpetration of the offenses, are generally included in patient reports in the form of “offense dynamics”, “crime-analysis”, “offense chains”, or “offense pathways”. In residential forensic treatment in the Netherlands, yearly risk assessment reports for patients are mandatory and these include a description of the interrelationships between the risk factors deemed relevant for the individual. To map these dynamics, current practice generally relies on clinical judgement, the reliability and validity of which is unknown. Recently, the Van der Hoeven Forensic Hospital introduced network analysis as an additional analytical method for the assessment of the interrelationships between risk factors. If these interrelationships are validly mapped out, this leads to an increased understanding of the risk and may contribute to more effective and/or more efficient interventions.
Experience Sampling
A commonly used method to collect the required time series data for directed network analysis is the experience sampling method (ESM; Larson & Csikszentmihalyi, 2014). By means of repeated measurements at relatively short intervals, data is collected from the daily life of the participant (Bringmann et al., 2013). Assessment of people’s mood and behavior by means of ESM brings a number of benefits. A large amount of data is collected per participant, which makes it possible to properly reflect the dynamics of the mood/behavior of this individual. In addition, recall bias is reduced because the data collection takes place in the moment instead of retrospectively. Recall bias refers to the fact that participants can view themselves and their interactions very differently in retrospect. As an example, Mokros (1993) found that people with depression gave similar scores as controls for their symptoms during the day, such as irritation and sadness. However, they retrospectively indicated that they experienced these symptoms significantly more. Moreover, patients (and people in general) often have problems to adequately reproduce an order of events retrospectively. For example, Bringmann et al. (2013) assessed several symptoms of a patient suffering from panic disorder, chosen after intake together with her therapist. Subsequent ESM assessment (five times a day for 2 weeks), however, indicated that none of the selected symptoms were associated with her fear of having a panic attack, carrying important implications for her treatment. Comparisons to the risk factors of people convicted of sexual offenses are obvious. For example, with regard to “Sex as coping” and “Social rejection/loneness”, it is important to assess whether a patient masturbates following feelings of loneliness or whether feelings of loneliness follow masturbation.
Personalized Networks
Based on experience sampling data, intraindividual network structures can be computed through network analysis (Epskamp, Van Borkulo et al., 2018). This allows for two personalized network structures to be estimated: temporal and contemporaneous networks that reflect how the factors are related between the measurement moments and within the measurement moments respectively (Borsboom & Cramer, 2013; Epskamp, Van Borkulo et al., 2018; Epskamp, Waldorp, et al., 2018). The temporal network, between the measurement moments, is represented by arrows that show temporal relationships, both the direction (from which factor to which other factor) and the value (positive or negative influence) and the strength of the relationship are taken into account. If the increase in a factor at moment 1 predicts an increase in a (different) factor at moment 2, this can be seen as an indication of a causal relationship, however, not as conclusive evidence, because relationships could also arise from factors not included in the analysis. When a factor in the network influences many other factors, it assumes a central role within the network, where many arrows “spring” from this factor. These central, “radiating” factors form an important focus in treatment.
In the current report, personalized network modeling was used to map the interrelationships of dynamic risk factors of an individual convicted of sexual offenses, using experience sampling data regarding risk relevant factors based on Stable-2007 items. This study is exploratory in two ways: it is an experimental method, and it generates experimental clinical hypotheses about a specific individual patient. The resulting networks should be seen as additional to the assessment of relevant risk factors and their level of presence (e.g., by means of the Stable-2007). The method intends to provide additional hypotheses on the interrelatedness of the risk factors in an individual patient. A lack of interrelatedness does not imply absence of the risk factor and strong interrelatedness does not imply a maximum presence of the risk factor. The results of the analyses were compared to a clinical network model compiled by the treatment team. Potential added utility of this method is discussed as well as limitations and suggestions for future use.
Method
Data
The data used, was collected as part of the treatment of a patient at the Van der Hoeven Forensic Hospital who provided informed consent for the use of his data for this report. He was a white man in his thirties who was admitted by court order for inpatient clinical treatment of limited length, between 6 and 24 months, in a forensic psychiatric facility. The patient was convicted for sexual assault of adult women and various non-contact sexual offenses. He was diagnosed with an attention deficit hyperactive disorder (ADHD), inattentive type. The patient completed senior secondary vocational education, was not in a committed relationship at the time of the assessment and did not have any underage victims. His clinical treatment continued during the 2 weeks that the experience sampling data was gathered. The patient also worked inside the facility, practiced sports, participated in a theater program, and had (supervised) leave.
During the treatment program, Static-99R and Stable-2007 are routinely used. In this treatment facility, multiple scores are assessed at each risk assessment, referring to multiple (possible) contexts: e.g., residing in the facility with no leave, being allowed supervised leave, unsupervised leave, or living independently in society. The patient had a total score of 4–9 on the Stable-2007 assessment closest to the period of this study’s measurements; the assessed risk-contexts varied from supervised leave (the situation he was in during the weeks of the experience sampling) to living independently in society. Given that his Static-99R score was 3, this combines into an overall “low-moderate” risk level, or Level III, “Average risk”, according to the standardized risk levels (Hanson, Babchishin, et al., 2017; 2017b). The most prominent risk items for all contexts were “Capacity for relationship stability” (1), “Sexual preoccupation” (1–2), and “Deviant sexual interests” (2). Increased freedom was associated with increased scores on “Poor cognitive problem solving” (1), “Sex as coping” (1), and “Lack of cooperation with supervision” (1). Living independently in society was assessed to increase “Feelings of rejection/loneliness” (1).
Instruments
Experience Sampling Questionnaire
The questionnaire used was based on the 13 items of the Stable-2007 (Hanson et al., 2007) which measures the dynamic risk factors of people convicted of sexual offenses. The Stable-2007 is normally scored annually by raters, overseeing the past year, and projecting a year into the future. The scores per item range from ‘no problem’ (0) to ‘yes, certainly a cause for concern’ (2). The higher the overall score, the greater the estimated risk of (sexual) recidivism. The Stable-2007 has good internal consistency (α = .80) and is a moderately accurate predictor of sexual recidivism (AUC = .76; Hanson et al., 2007; Hanson et al., 2015). High inter-rater reliability was found for the total score (ICC = .86; Fernandez & Helmus, 2017). Most importantly, the Stable-2007 is intended to provide insight into the relevant problem areas of a patient (Harris & Hanson, 2010). Patients in the treatment facility where the current study was conducted are familiar with the Stable items and what they are intended to measure, as the Stable is scored for them each year and extensive feedback is provided to them regarding the results.
Dynamic Risk Factors of Stable-2007 and Questions Based on these Factors for Experience Sampling.
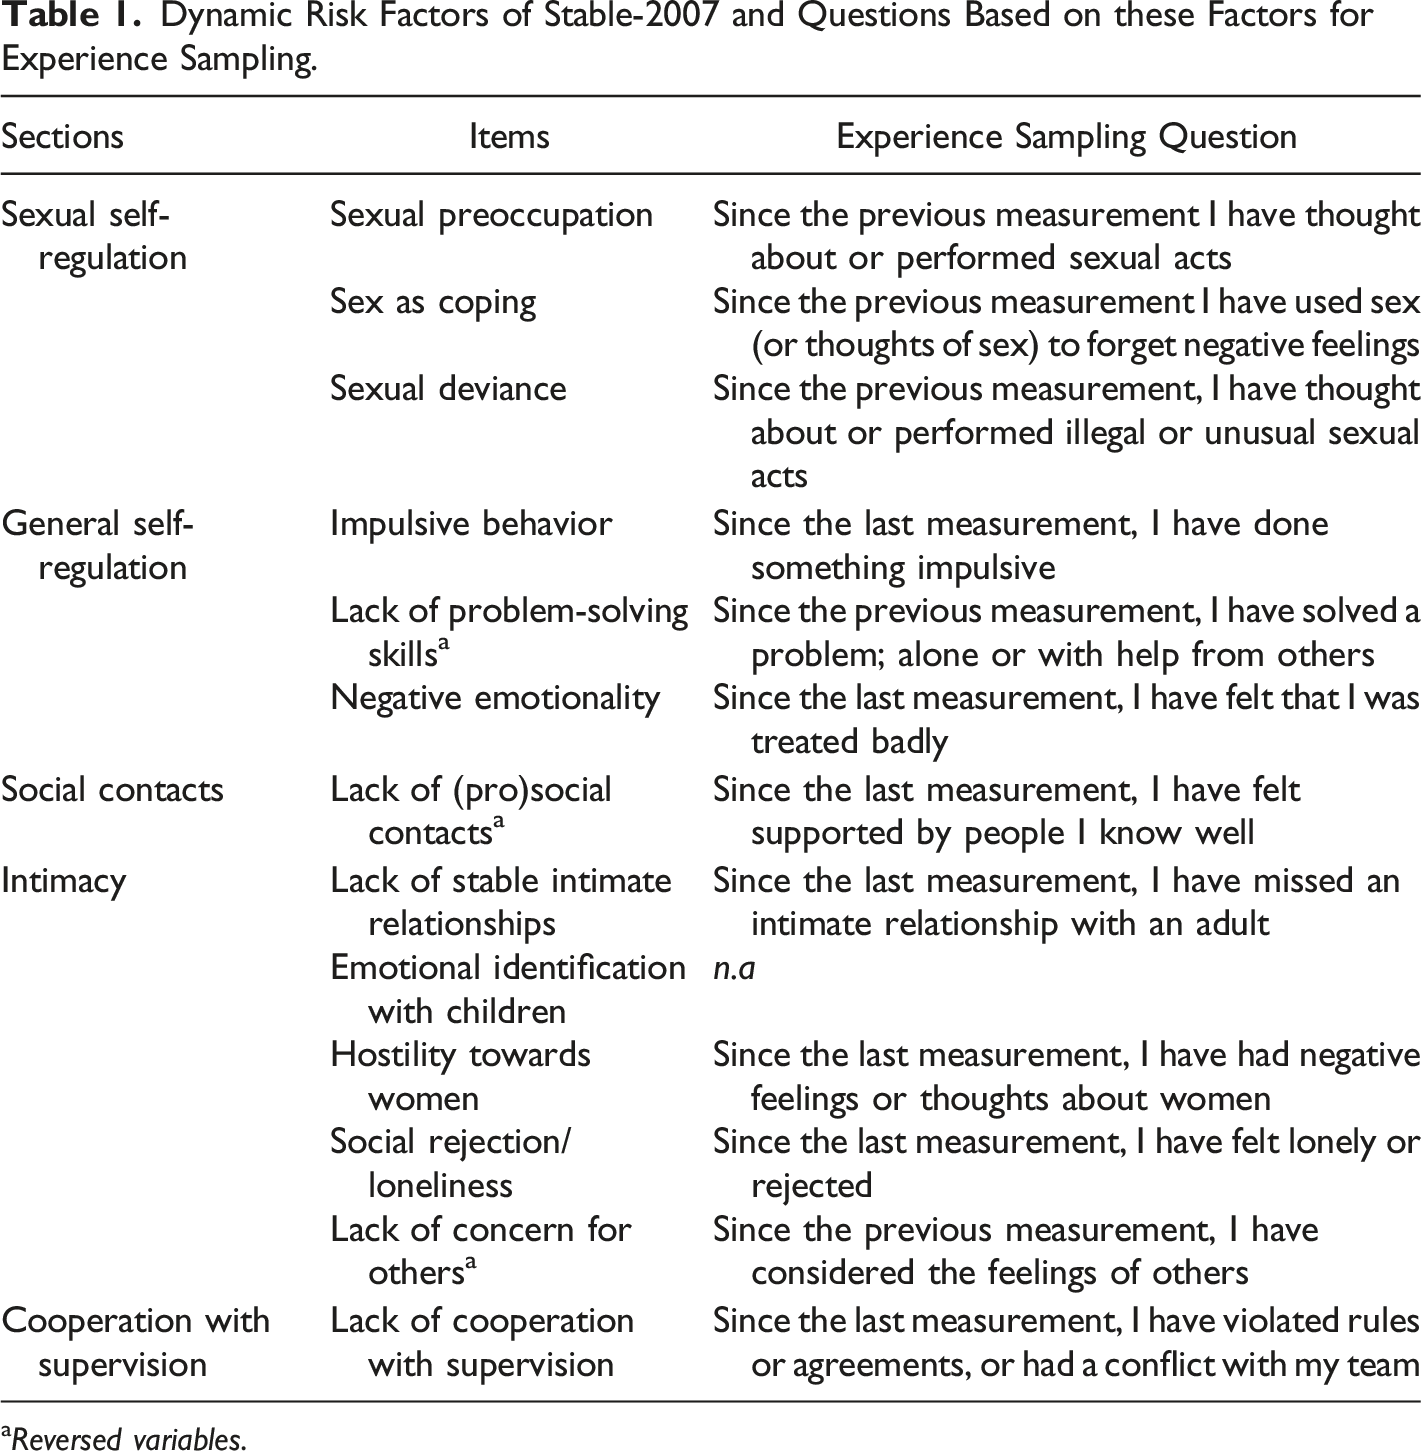
aReversed variables.
The items “Lack of (pro)social contacts”, “Lack of problem-solving skills” and “Lack of concern for others” were reversed to promote unambiguous scoring (and were then re-reversed for the analysis). The respondent did not have any child victims; therefore, the item “Emotional identification with children” was omitted, in line with regular use of Stable-2007. Because the respondent was not in a committed relationship, item 2, inquiring after feelings and thoughts about a current relationship was redirected towards feelings and thoughts about the “desire for a committed relationship”.
An additional first question was added that assessed the current mood of the patient: “How are you feeling at the moment?” and was scored on a 5-point Likert scale ranging from “very bad” to “excellent”. This question was not included in the statistical analyses, as it does not focus on a dynamic risk factor. It was added to give respect to the mood of the respondents and to provide extra information in possible cases of extreme scores (which did not occur for this patient). The final questionnaire consisted of 13 questions, 12 of which were based on the risk factors of the Stable-2007.
Smartphone and Application
The questionnaire was presented by means of an application (Minddistrict) on an iPhone SE, specifically prepared for this assessment and managed remotely. The smartphone had limited functions and could only use the pre-installed offline application to collect the experience sampling data. To prevent any adjustments made to the smartphone by the patient, the smartphone was covered in colored, unremovable stickers. The stickers covered the back, the cameras, and the side of the smartphone. No photos could be taken, and the SIM card could not be removed or replaced without removing the stickers and thus damaging them. The smartphone and stickers were visually controlled by the treatment team on a regular basis.
The application used was: Minddistrict (version 3.20.0 for iOS). Minddistrict is an e-Health platform, which is, among other things, able to repeatedly offer questionnaires via notifications to be answered on a mobile device. Because the smartphone had no internet connection, data was saved locally and retrieved at the end of the 2-week period by connecting it to the internet and synchronizing it with the servers of Minddistrict located in secure databases in the European Economic Community (EEC). All raw anonymous data used for the analyzes was downloaded from these servers and stored on our own secured servers.
Form
The patient’s treatment team was provided with a form on which the dynamic risk factors of the Stable-2007 (minus item 3) were projected in a circle. They used this form to note the assumed interrelations between the various dynamic risk factors for this individual patient, as concluded from their usual clinical case analysis. This network, drawn by the treatment team, could be seen as a self-generated hypothesis for the network structure of the patient’s risk factors (Borsboom & Cramer, 2013). To facilitate comparison, all networks were projected in the same circular layout.
Procedure
The patient provided informed consent for the (anonymous) reporting on his data, as gathered within the context of his treatment. This report was made following all ethics laws and regulations applicable in Europe and the Netherlands (Central Committee on Research Involving Human Subjects (CCMO), 2018, Dutch Research Council (NWO), 2018, Standing Committee on Science and Ethics (VCWE), 2018) and was approved after review by the research department of Forensic Care Specialists.
During the assessment, the patient carried the smartphone with him all day for 2 weeks, inside the facility as well as on any occurring leave. The smartphone provided a notification at fixed times (± every 3 hours), when the patient had to open the application and answer the 13 questions. To open the application, the patient created a personal code, to ensure the privacy of his answers. However, after forgetting his first code, the patient voluntarily stored his new code in a sealed envelope that was kept in the staff room, where he could look it up at his request. During the week he received a notification on the smartphone 6 times a day (7.00 a.m./10.00 a.m./1.00 p.m./4.15 p.m./7.00 p.m./9.45 p.m.) and on weekends 5 times a day (10.45 a.m./1.15 p.m./4.00 p.m./7.00 p.m./9.45 p.m.). The times were tailored to interfere as little as possible with the patient’s daily program, which is why the times were slightly different during the weekends. The patient was responsible for the smartphone and for completing the questionnaires on time. He was not reminded of this by staff. All staff throughout the facility was informed about the fact that the patient was allowed to carry a smartphone during these weeks, as mobile (smart)phones are generally not allowed within the facility. After the last questionnaire of the day was completed by the patient at 9.45 p.m., staff carried out a visual inspection of the smartphone to check that all stickers were undamaged. And subsequently put the smartphone in a loading dock to return it to the patient the next morning before the first measurement.
The treatment team received the form for the clinical assessment of the interrelationships between the dynamic risk factors at the same time as the patient received the smartphone. The form was completed in consensus by the joint treatment team in a regular meeting regarding the treatment of the patient. The treatment team’s clinical assessment of the interrelationships of the dynamic risk factors was carried out by drawing arrows of a temporal network on the form, connecting risk factors and indicating whether the relationship was assumed to be positive/increasing or negative/decreasing.
Statistical Analysis
Data
Variables with no variance were excluded from further analysis. Missing measurements were imputed using the Kalman filter. For time series data, it has been noted that this generates the best result (Moritz & Bartz-Beielstein, 2017; Moritz et al., 2015), even when there are multiple missing variables (Twumasi-Ankrah et al., 2019).
Assumptions
Before performing the network analysis by utilizing vector autoregression (VAR), the assumption of stationarity was tested, meaning that there is no trend of the average score or variance over time. Though movement in the scoring of the items was intended, it was not intended that item scores change structurally over the period of the assessment, while this would interfere with theories or models based on the data (Manuca & Savit, 1996). Stationarity can be assessed by analyzing the residual variance of the variables, i.e., the variance that is not explained by the previous measurement. If the residual variance is constant over time (a flatline), the assumption of stationarity has been met. If the residual variance of an item gradually increases or decreases, the assumption of stationarity has not been met and the trend can be removed by excluding the residues that cause this trend (linear detrending; Oreel et al., 2019).
VAR models generally assume consistent time intervals between measurements. In the current assessment the time intervals between the measurement moments were consistent during the day (±3 hours), however, during the nighttime two time periods were skipped to allow for sleep. This could potentially be statistically solved by regarding every day as a new beginning and excluding the comparisons of the last measurements of the previous day with the first measurements of the next day in the network analysis (De Haan-Rietdijk et al., 2017). However, not only does this strongly reduce the power of the analyses, but clinical experience also indicates that every day is not a new beginning for forensic patients and their problems usually continue to play a role at night, if not more so. Given the fact that we phrased the questions to refer to the patient’s experiences since the last measurement, the sampling was covering his experiences throughout the periods in between measurements rather than at specific points in time, providing the option to include the nights in our analyses. Both analyses with- and without inclusion of the overnight associations were performed and reported.
Post hoc, an extra exploratory network analysis was performed, including only the most prominent factors emerging from the prior network analyses, i.e., the factors that emerged from the network analyses with multiple and/or relatively strong associations with other factors. This was done to increase statistical power, following Mansueto et al. (2022), who advised the inclusion of six factors. All resulting networks were compared to deduce and interpret convergent results.
Network Analysis
The R package graphical VAR (Epskamp, 2020a; Epskamp, Waldorp, et al., 2018) was used to estimate the associations between two measurement moments (temporal) and the associations within one measurement moment (contemporaneous) of the 12 factors. In a psychometric network model, factors are represented by ‘nodes’ that are connected by ‘edges’, which are weighted according to some statistic (Epskamp, 2020b). In the temporal network, graphical VAR calculates the model that optimally predicts the next measurement moment from the previous measurement by means of regression equations. In each regression, one factor in a certain time frame (t) is predicted by all other factors including itself in an earlier time frame (t-1). The resulting relationships are represented by an arrow between the associated factors and weighed by their regression coefficients. This temporal network gives an indication of possible causation, although it does not provide proof.
The residuals of the temporal VAR-model are correlations within the same time frame. These correlations cannot be explained by the temporal model. In the contemporaneous network, a model is created from the partial correlations between these residuals. In this network, correlations between two nodes are estimated by controlling for all other factors as well as the temporal effects. The relationships between the nodes are represented as lines because there is no indication of direction (Epskamp, Van Borkulo, et al., 2018; Epskamp, Waldorp, et al., 2018) and weighed by their partial correlation coefficients. Summarizing, the temporal network shows the direction of the relationships over time and the contemporaneous network shows the relationships between the factors within the time frames.
To visualize the associations in the networks, the R package qgraph (Epskamp et al., 2012) was used. The factors were projected as nodes and the associations between the factors as lines or arrows. Only the significant associations were projected with p < .05. The layout of the network analysis was set as a circle to facilitate comparison with the clinical network provided by the treatment team.
Centrality statistics were used to identify which factors in the network were most strongly connected to other factors, depending on the amount and weight of their associations. This so-called strength of the factors is plotted with the R-package qgraph (Epskamp et al., 2012) and is represented in z-scores to facilitate comparison. In the temporal networks there is a distinction between “in-strength” and “out-strength”. “In-strength” refers to the extent to which a factor is influenced by other factors, i.e., the number and weight of the arrows running towards it. “Out-strength” refers to the extent to which a factor influences other factors, i.e., the number and weight of the arrows originating from it (Jongeneel et al., 2020). Factors with a high “out-strength” specifically may be considered as important treatment goals, because they have large influence on other factors.
Results
Means and Standard Deviations per Factor. Possible Scores Ranging from 1 (not at all) to 5 (Extremely).
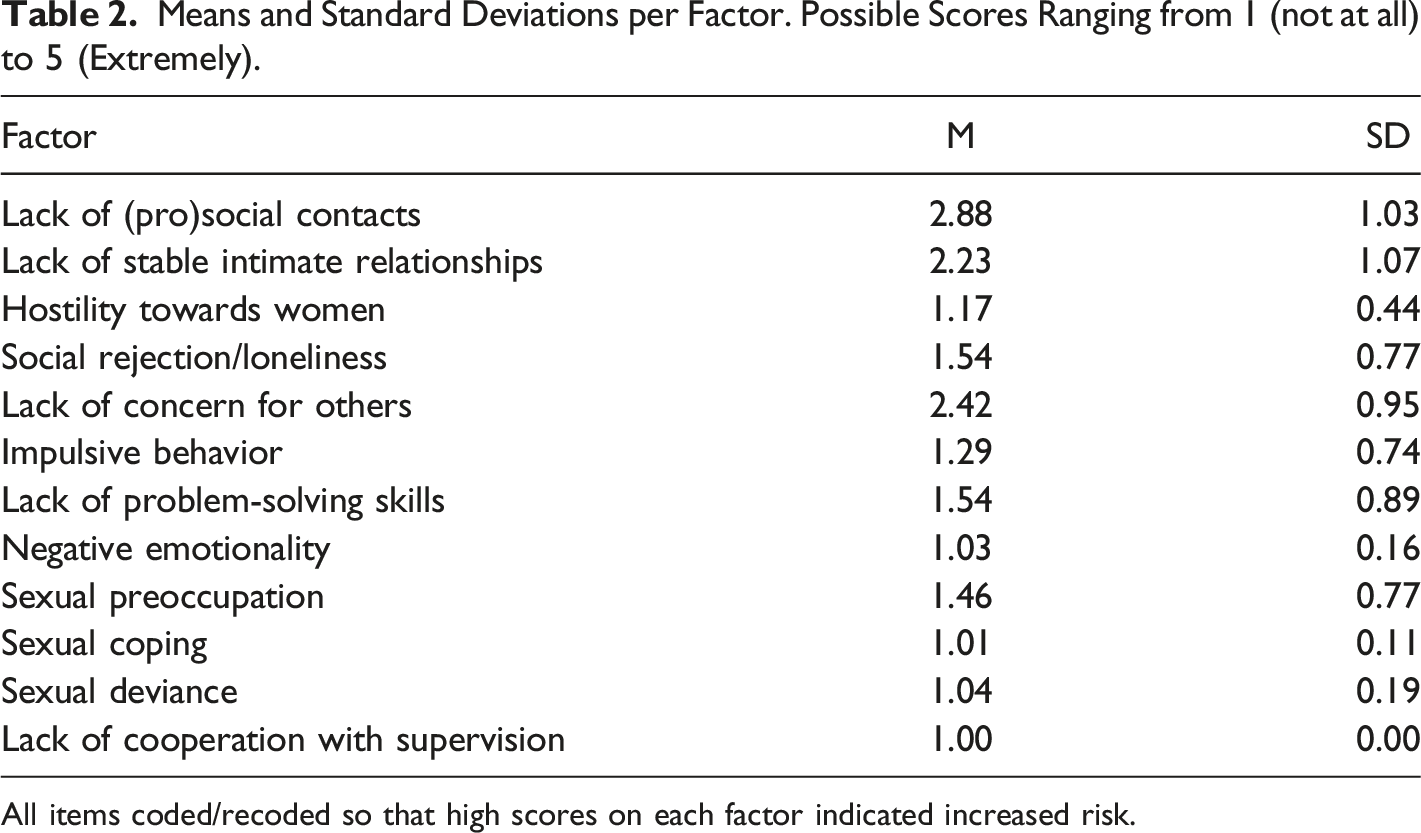
All items coded/recoded so that high scores on each factor indicated increased risk.
Contemporaneous Networks
Stationarity was not achieved for the factors “Lack of (pro)social contacts”, “Lack of concern for others”, and “Lack of problem-solving skills”, and trends were removed by linear detrending (Oreel et al., 2019). Figure 1 provides the contemporaneous and temporal networks and strengths with the overnight associations included in the analysis, i.e., the regressions of the first measurements of each morning on the last measurements of the evening before. Figure 2 provides the contemporaneous and temporal networks and strengths with the overnight associations excluded. Figure 3 provides the post hoc contemporaneous and temporal networks and strengths including only the six most relevant factors from the first network analyses. The contemporaneous networks are a representation of how risk factors are related within the timeframes, i.e., which factors tended to occur together. The temporal networks are a representation of how factors predicted themselves (i.e., autoregression) and other factors in following time frames. Factor-strengths were assessed through the number and weight of all associations a factor had with other factors. A. The Estimated Contemporaneous Network with Nights Included. Note. Edge weights are partial correlations. B. The Centrality Statistic of the Strengths of Each Factor in the Contemporaneous Network. C. The Estimated Temporal Network with Nights Included. Note. Edge weights are regression coefficients. A. The Estimated Contemporaneous Network with Nights Excluded. Note. Edge weights are partial correlations. Dotted lines refer to negative relationships. B. The Centrality Statistic of the Strengths of Each Factor in the Contemporaneous Network. C. The Estimated Temporal Network with Nights Excluded. Note. No significant relationships were identified. D. The Post Hoc Estimated Contemporaneous Network with Nights Included, Including the Six Most Relevant Factors. Note. Edge weights are partial correlations. B. The Centrality Statistic of the Strengths of Each Factor in the Contemporaneous Network. D. The Post Hoc Estimated Temporal Network with Nights Included, Including the Six Most Relevant Factors. Note. Edge weights are regression coefficients. Dotted lines refer to negative relationships.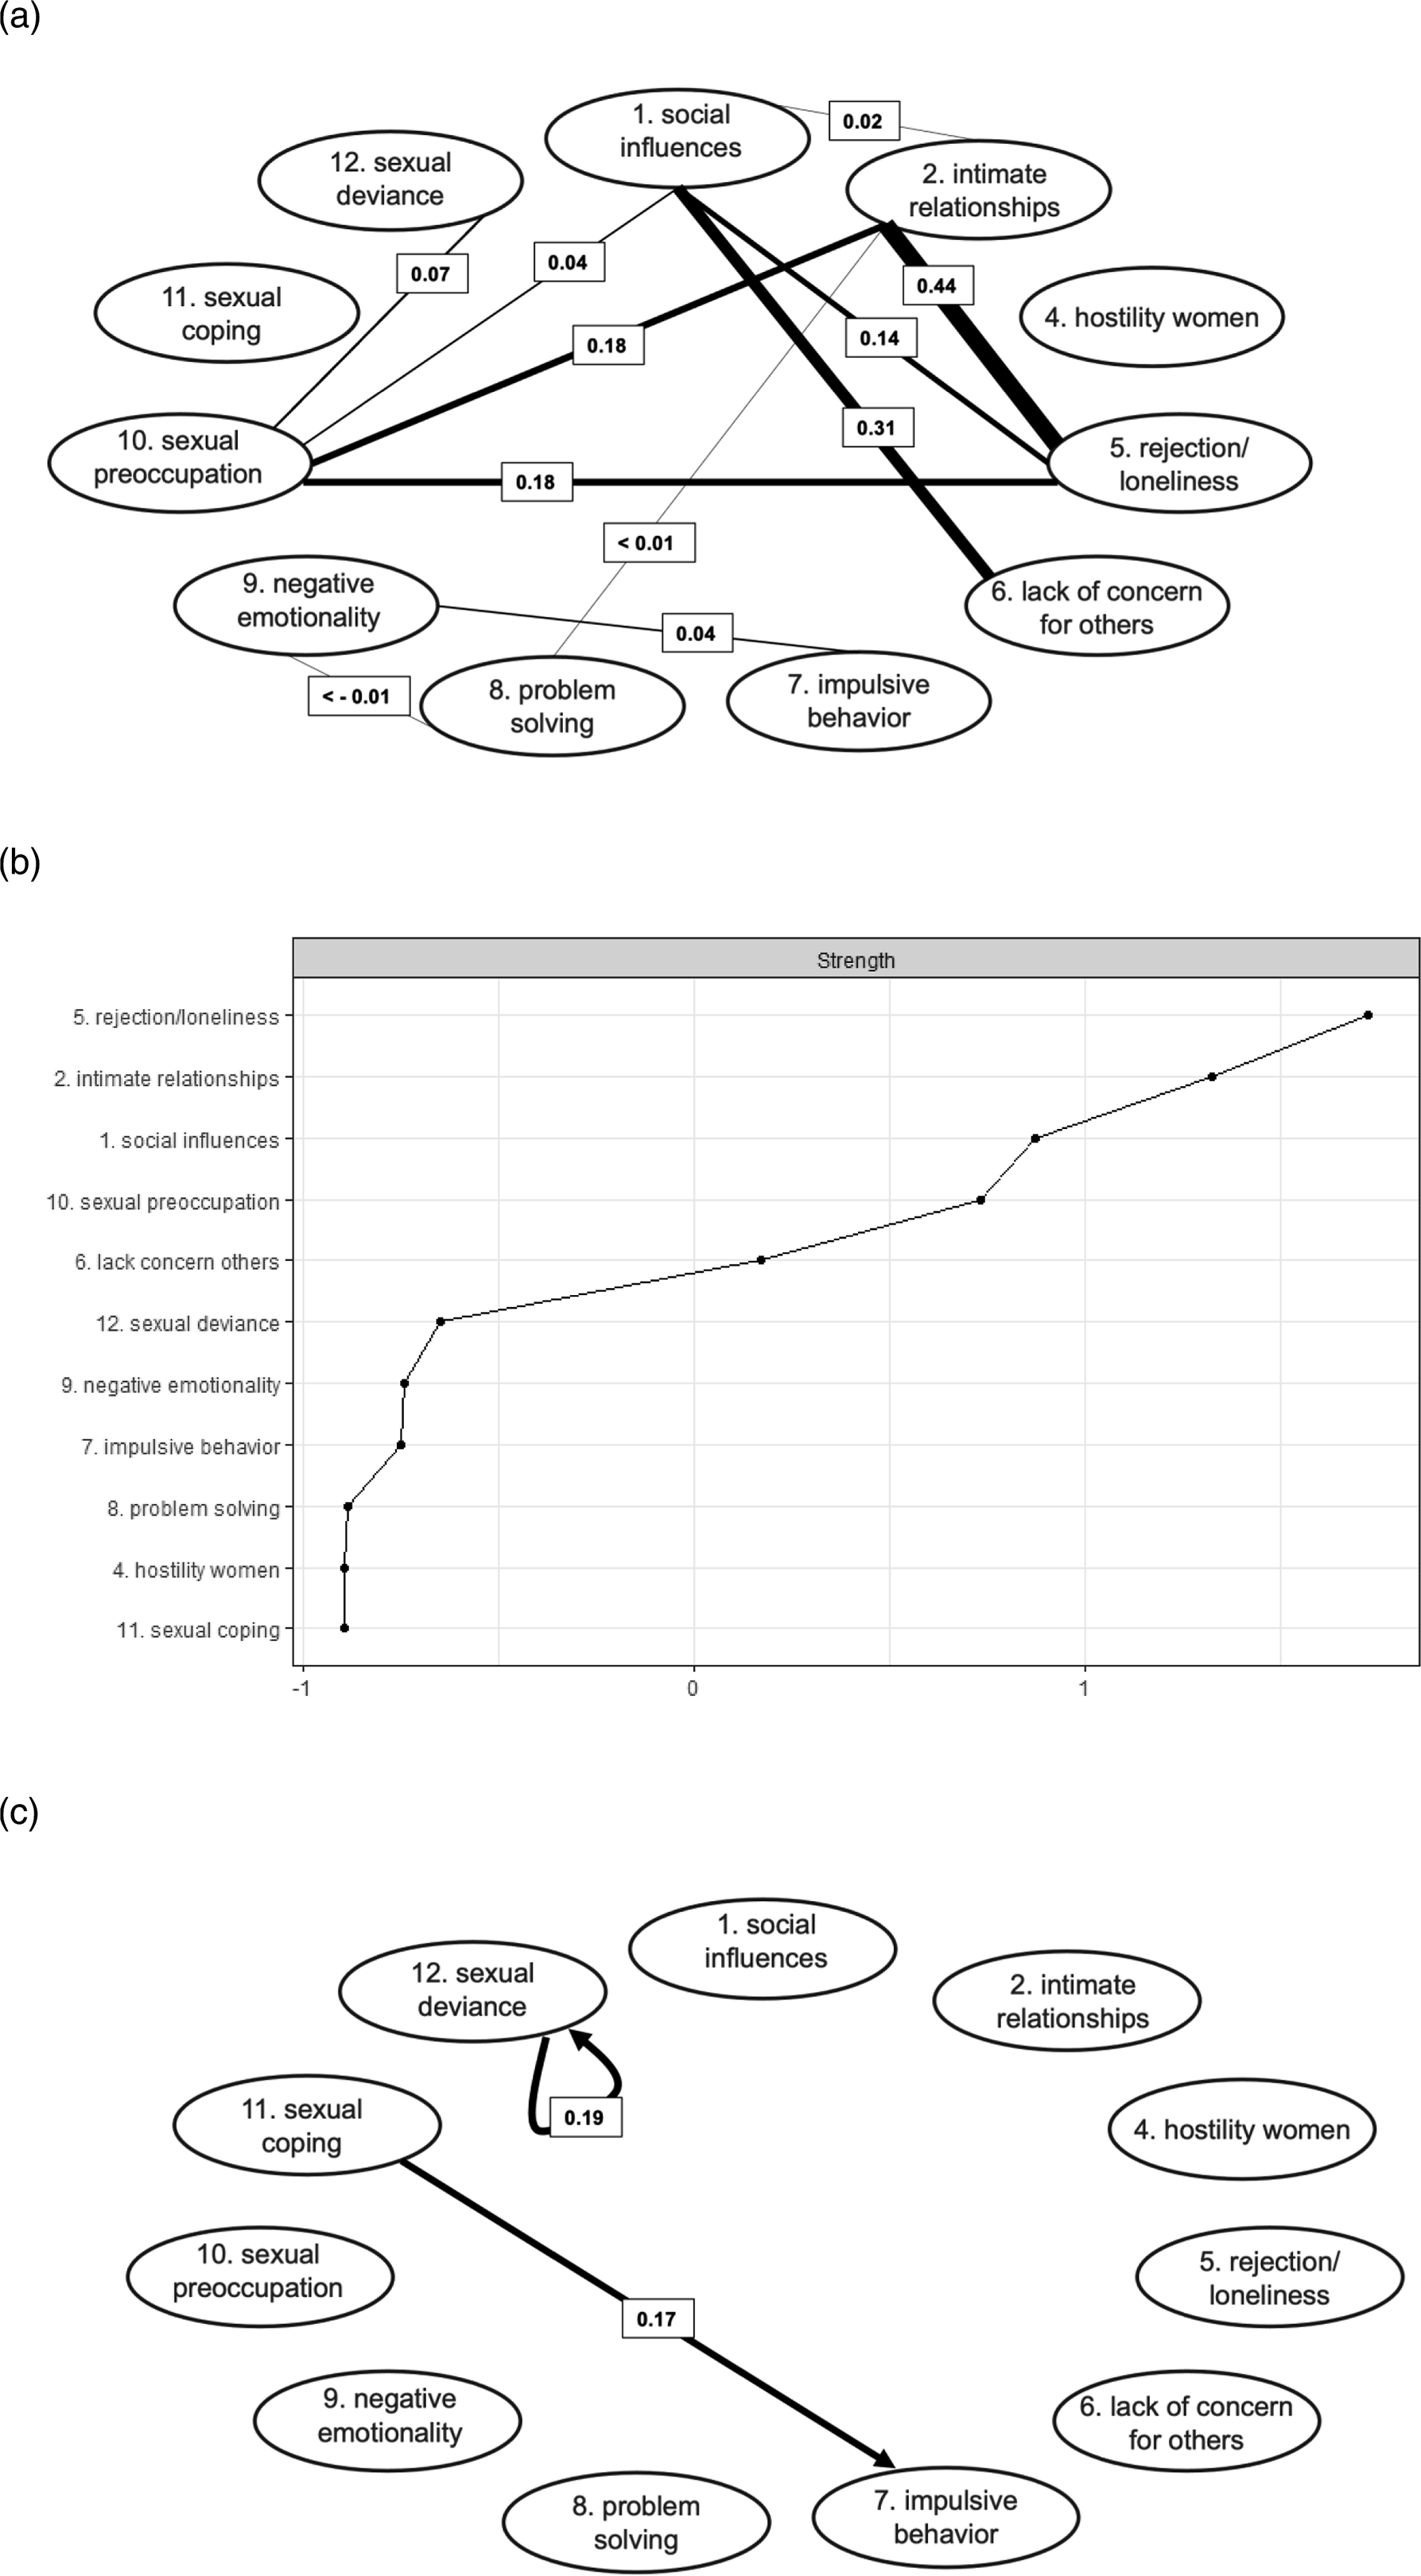
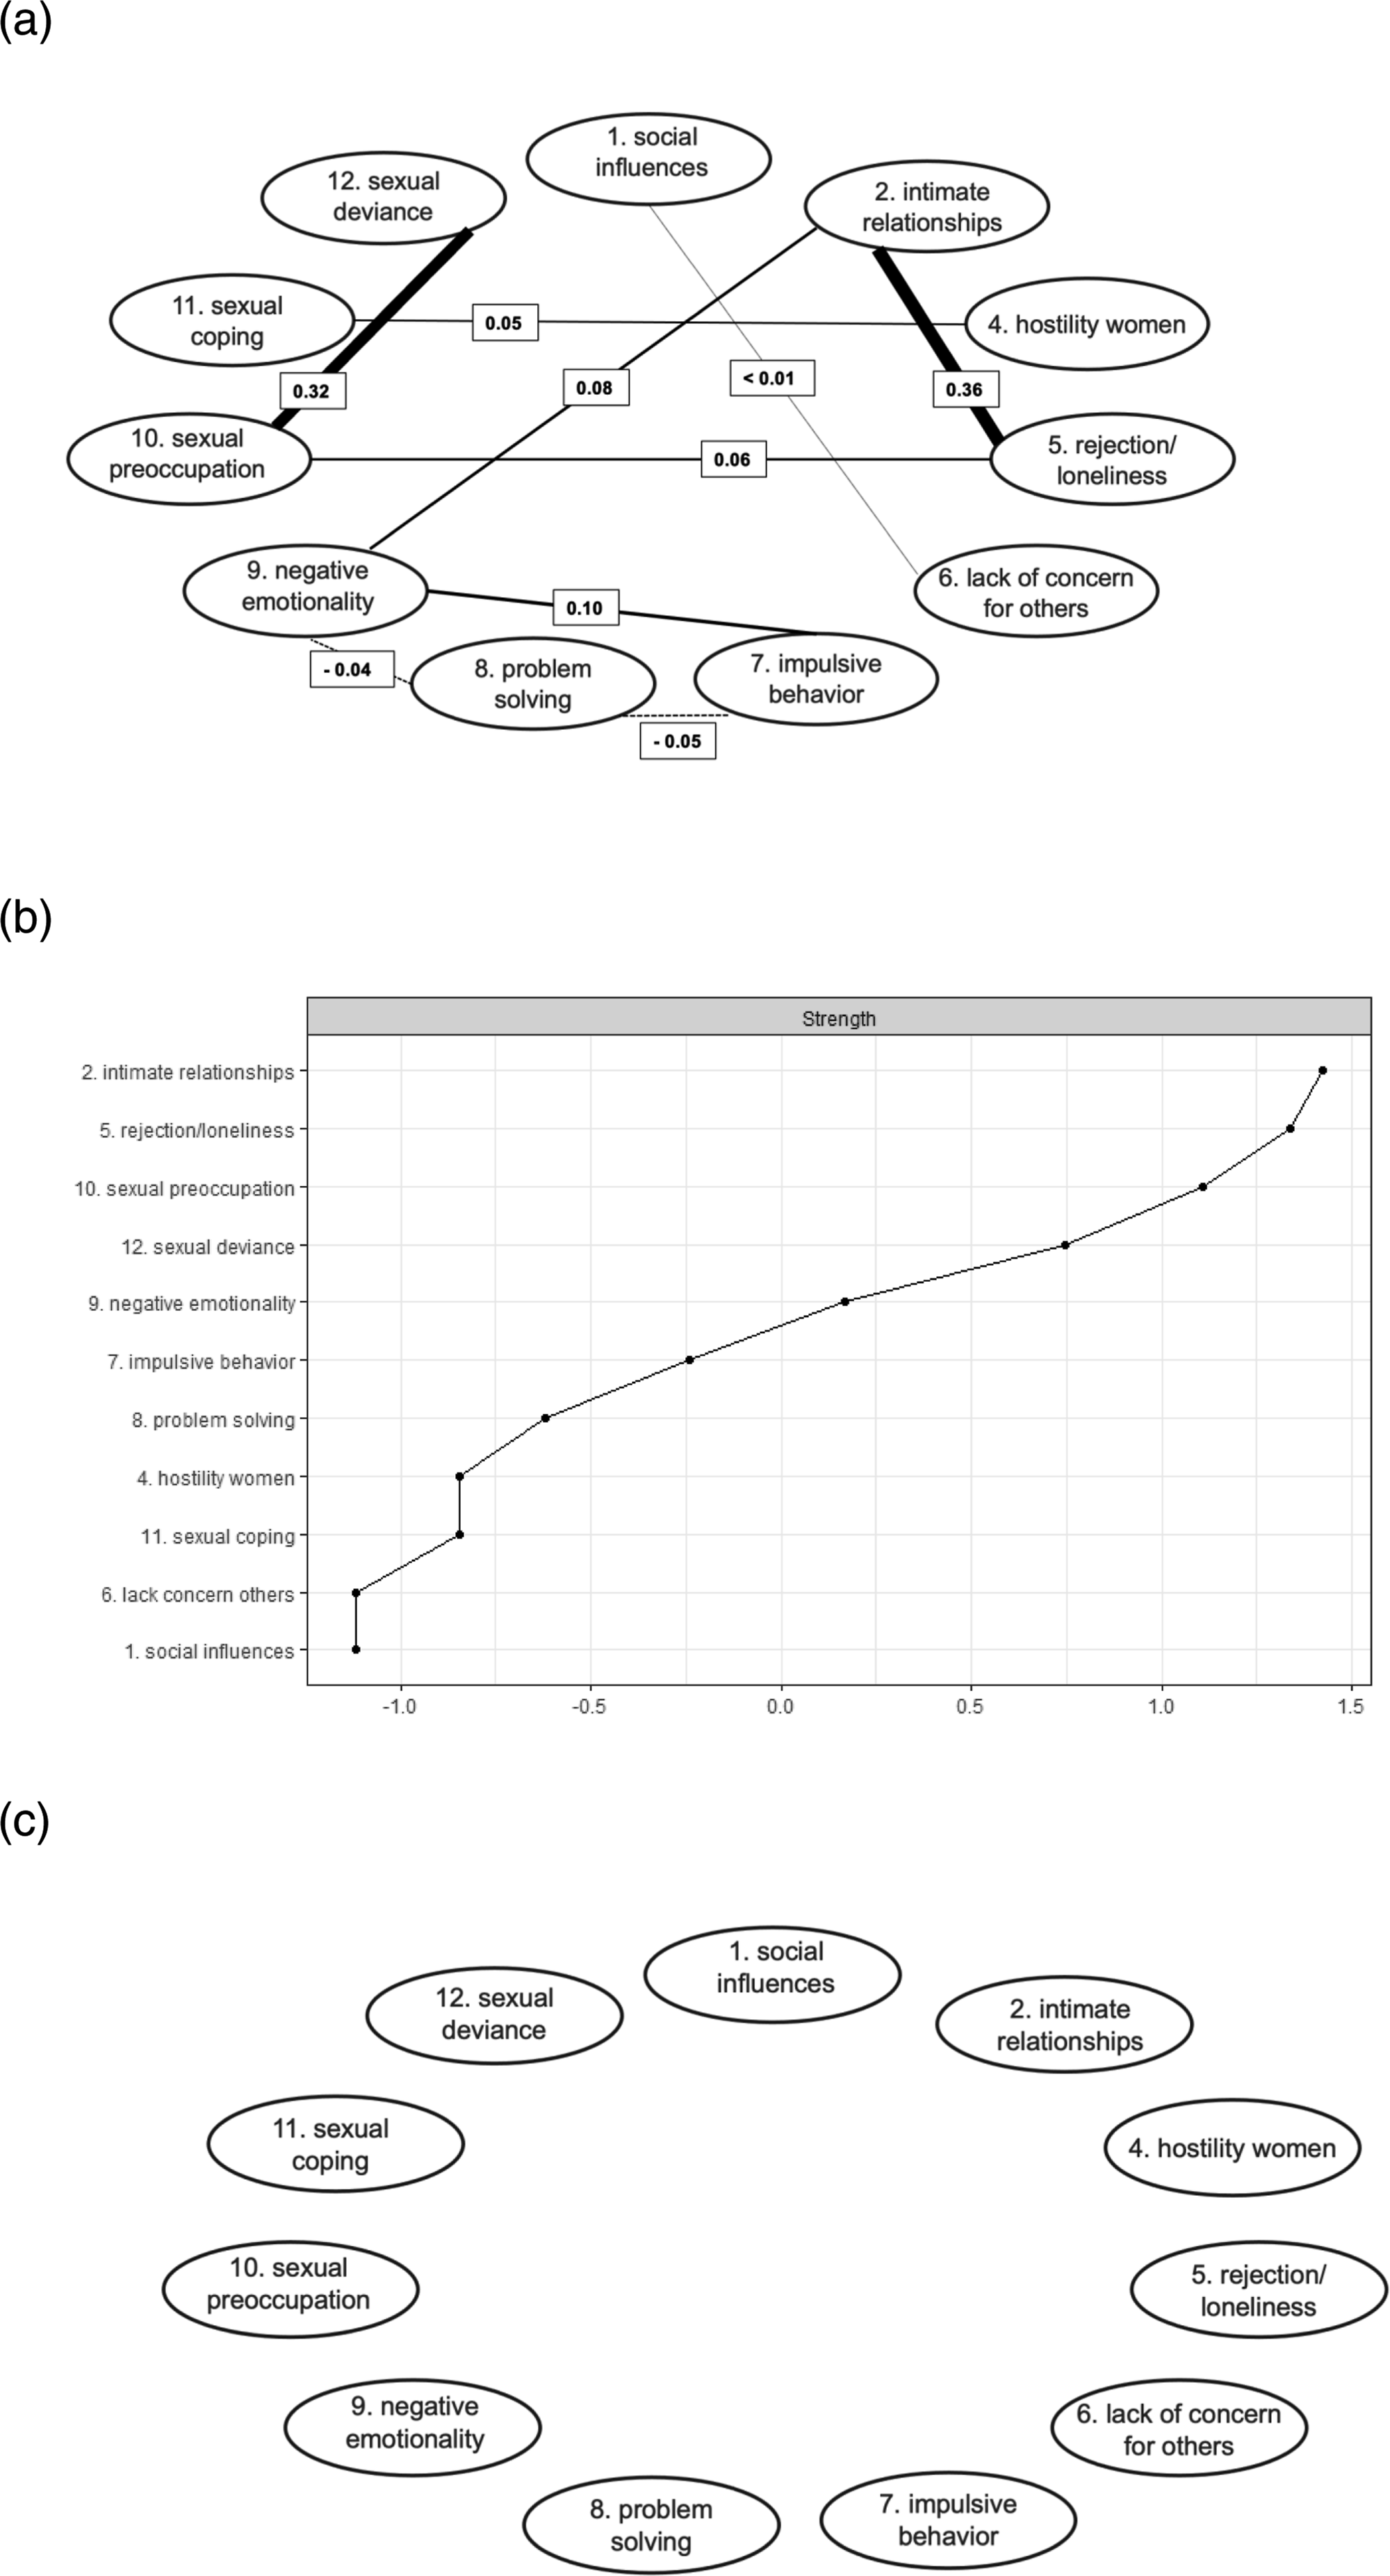
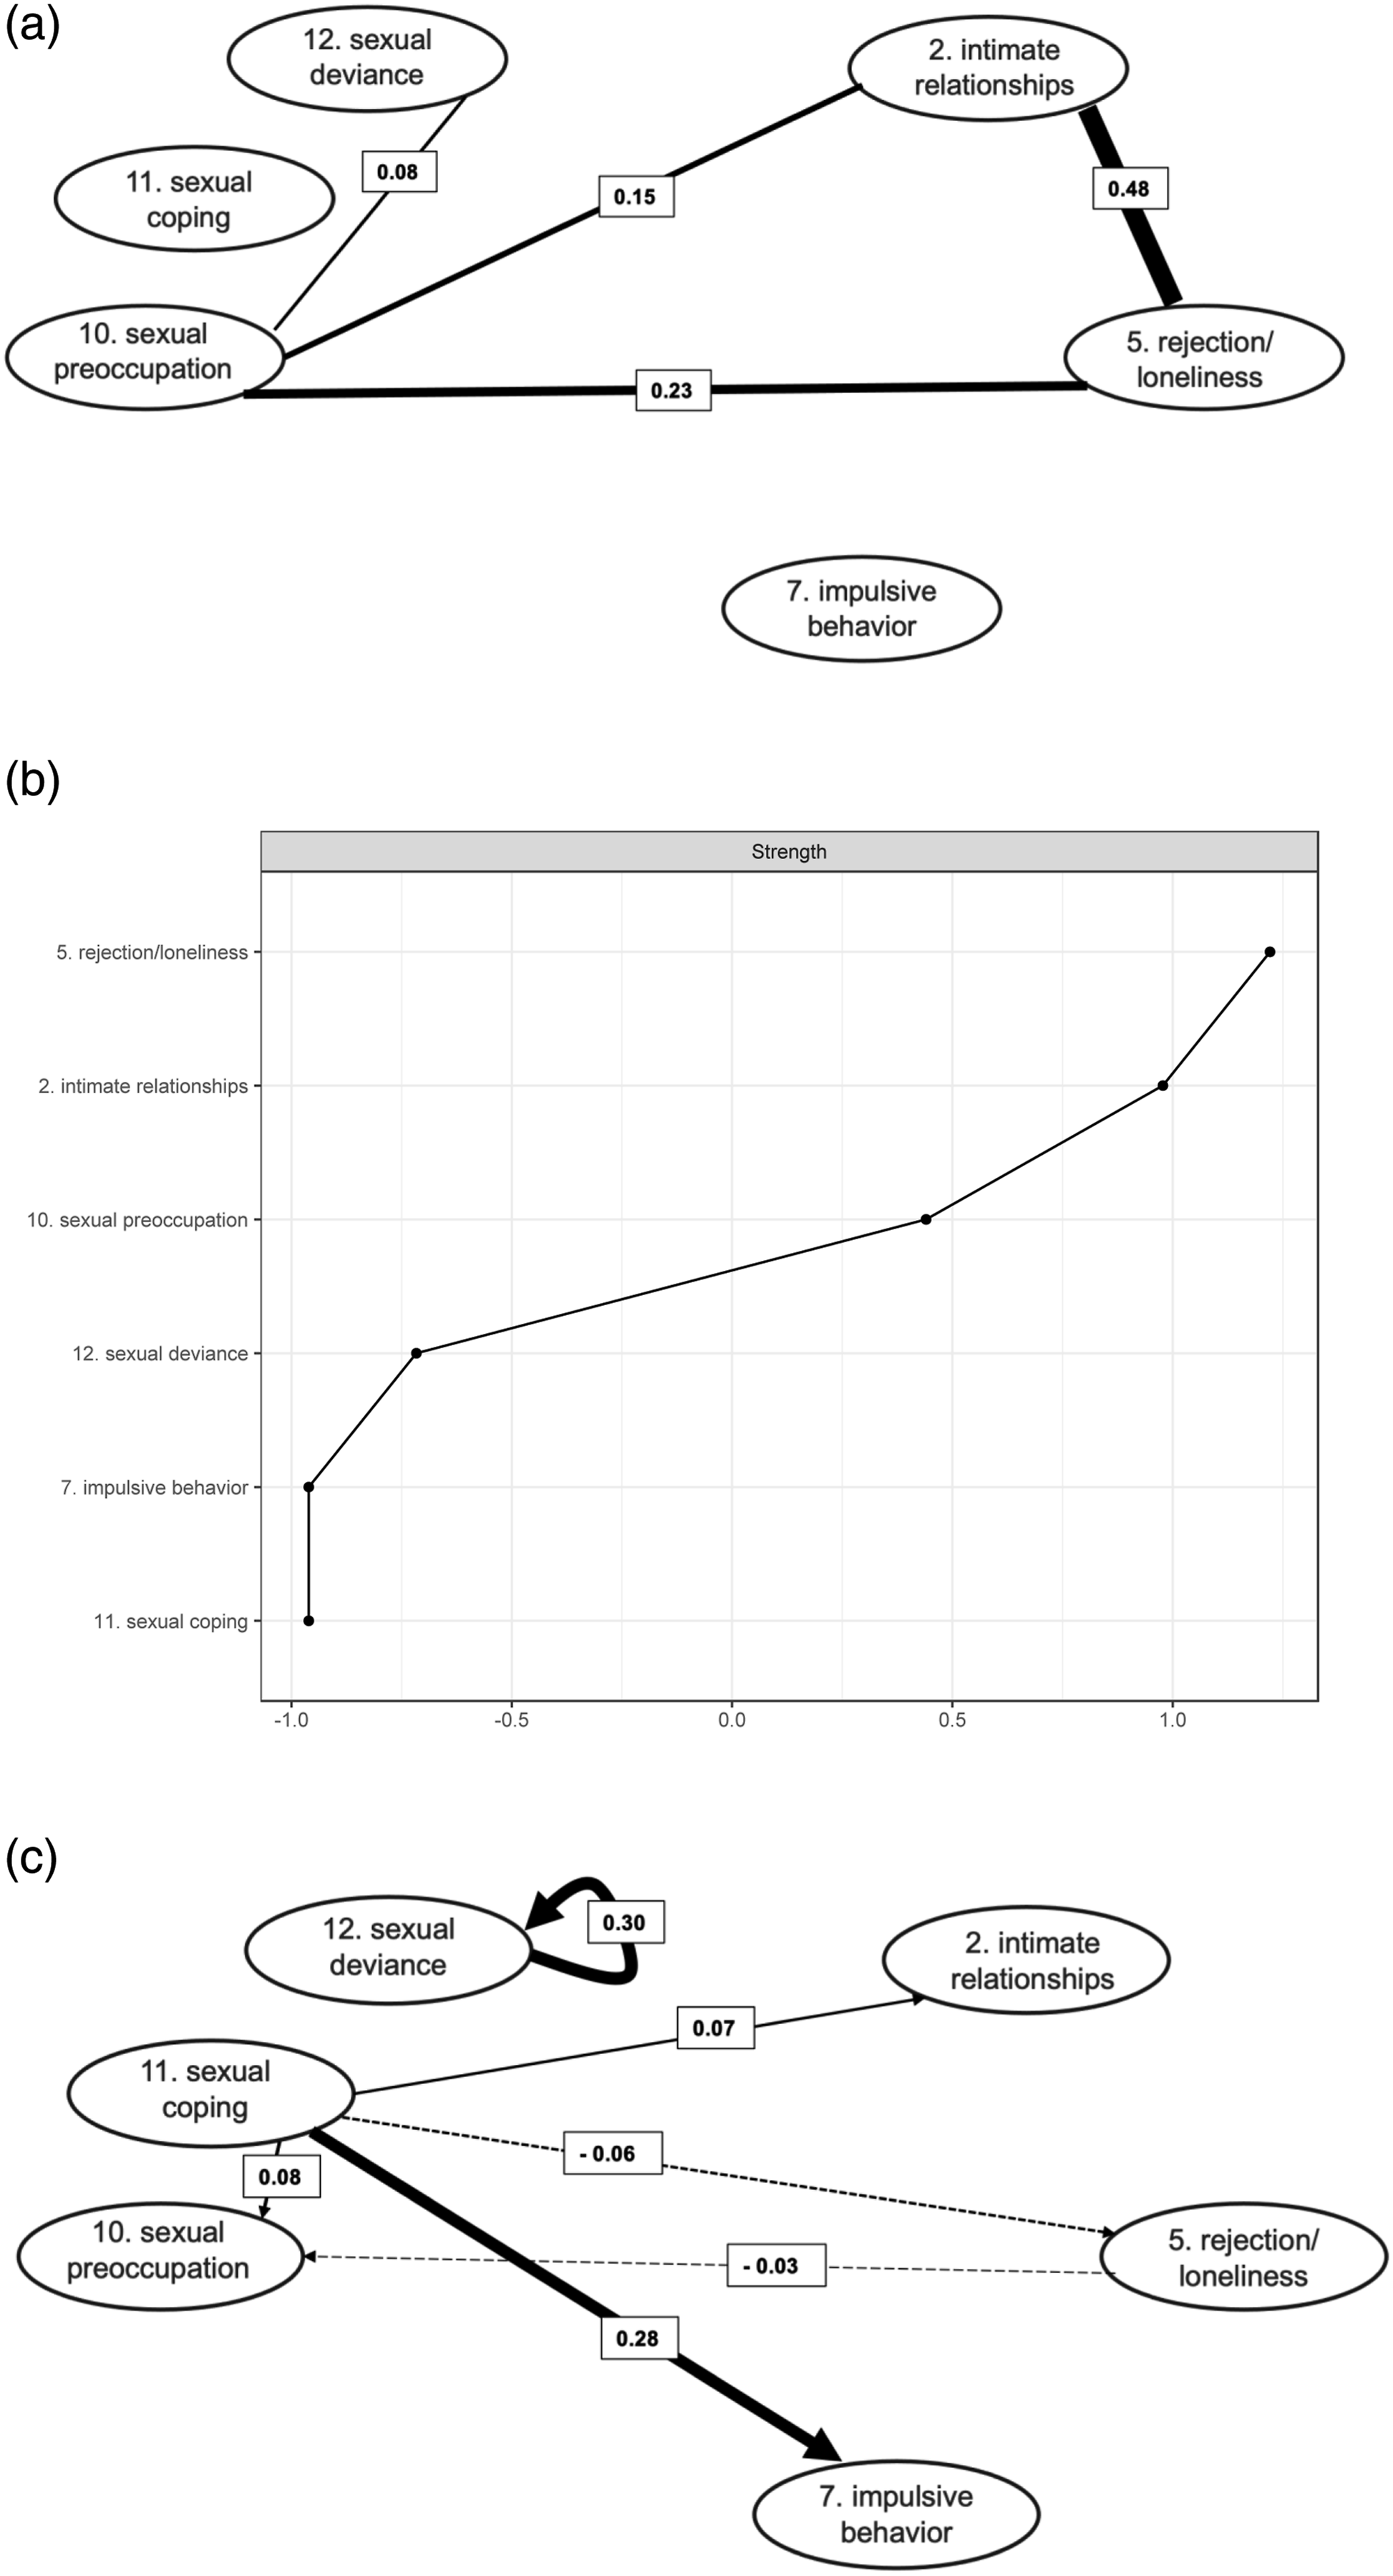
In the contemporaneous networks the variable “Social rejection/loneliness” consistently showed relatively high strength and positive associations with “Lack of stable intimate relationships” (edge weights ranging from .36 to.48) and “Sexual preoccupation” (edge weights ranging from .06 to .23). This indicates that feelings of rejection and loneliness, feelings of missing an intimate relationship and (thoughts of) sexual behavior were relatively likely to coincide within a certain time frame. “Sexual preoccupation” was also consistently associated with “Sexual deviance” (edge weights ranging from .07 to .32), indicating that (thoughts of) sexual behavior were relatively likely to coincide with (thoughts of) illegal or unusual sexual behavior. The relationship between “Lack of (pro)social contacts” and “Lack of concern for others” (edge weight .31) in the network including the nights indicates that an increase in the feeling of being supported by others was associated with increased consideration for the feelings of others.
Temporal Networks
In the temporal network excluding the nights, no associations were visible, possibly due to low power. In the temporal networks including the nights, the factor “Sexual deviance” predicted itself in the next time frame (edge weights ranging from .19 to .30), represented as a circled arrow from the factor to itself. This means that when the patient “experienced thoughts or showed behavior referring to illegal or unusual sexual activities” in a certain time frame, these were more likely to also be present in the next time frame. In addition, “Sexual coping” was predictive of “Impulsive behavior” (edge weights ranging from .17 to .29), meaning that when the patient “used sex (or thoughts of sex) to forget negative feelings” in a certain time frame, he was more likely to “do something impulsive” in the next time frame. The post-hoc temporal network analysis, including only the most relevant factors that emerged from the prior analyses, had more statistical power and showed some additional associations. “Sexual coping” was now also predictive of “Sexual preoccupation” (edge weight .08) and “Lack of stable intimate relationships” (edge weight .07), meaning that when the patient “used sex (or thoughts of sex) to forget negative feelings” in a certain time frame, he was more likely to show “(thoughts of) sexual behavior” and “feelings of missing an intimate relationship” in the next time frame. “Sexual coping” was also negatively predictive of “Social rejection/loneliness” (edge weight .06), meaning that when the patient “used sex (or thoughts of sex) to forget negative feelings” in a certain time frame, he was less likely to have “feelings of rejection and loneliness” in the next time frame. The added temporal associations in this network resulted in “Sexual coping” clearly emerging as the factor with the most out-strength.
Clinical Network
Figure 4 shows the temporal clinical network drawn up by the treatment team. In this network the edges do not have weights, but factors “Sexual deviance” and “Lack of stable intimate relationships” can be seen as the most central, with three connections each, followed by “Sex as coping”, “Sexual preoccupation” and “Impulsive behavior”, with two connections each. The clinical temporal network by Patient’s treatment team.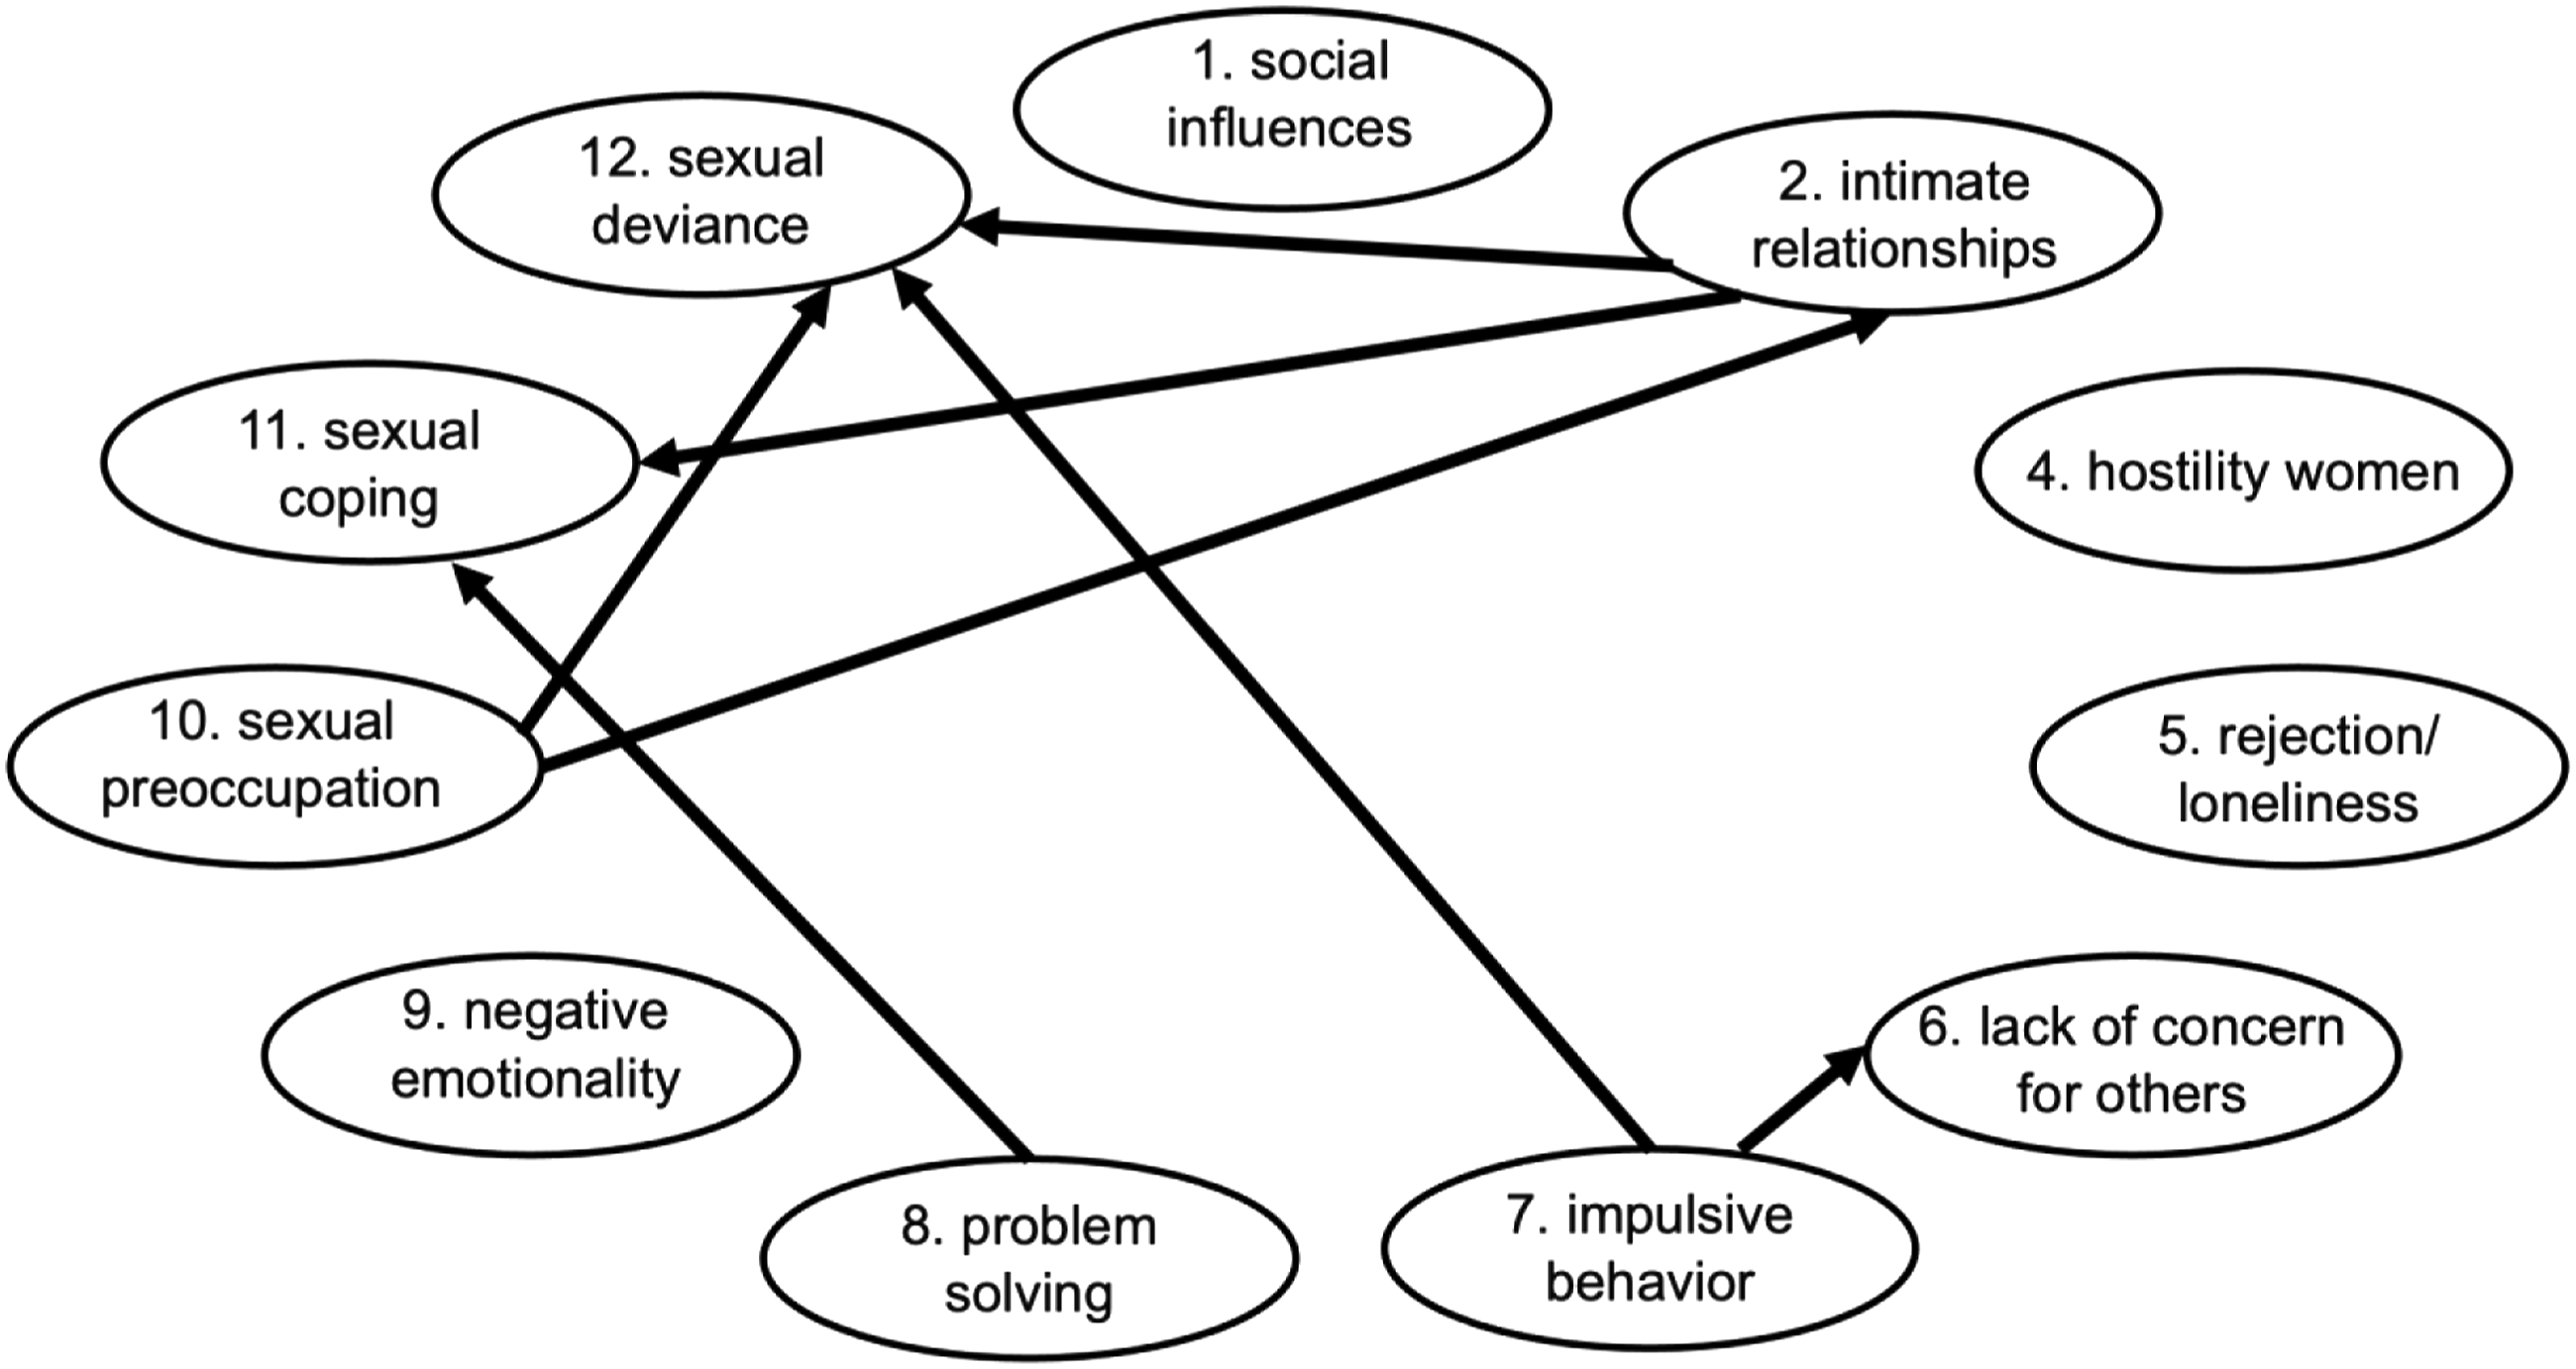
The factors “Lack of stable intimate relationships”, “Impulsive behavior” and “Sexual preoccupation” are assigned the largest out-strength, each influencing two other factors. The factor “Sexual deviance” is thought to have the largest in-strength, with three incoming influences from other factors. Followed by “Sex as coping”, with two incoming influences from other factors.
Discussion
This paper reports on the use of personalized network modeling to map the interrelationships of dynamic risk factors for an individual convicted of sexual offenses, using experience sampling data based on Stable-2007 items. Results indicate that the assessment was practically feasible and acceptable for the patient. The various contemporaneous networks show a fairly consistent “triad” of simultaneously occurring feelings of rejection and loneliness, missing an intimate relationship and (thoughts of) sexual behavior. In addition, emerging (thoughts of) sexual behavior appear to be, at least partly, (thoughts of) deviant sexual behavior.
Results of the temporal analysis with sufficient power identify the use of sex (or thoughts of sex) to forget negative feelings as the factor with the most “radiating” effect on other factors. This factor is predictive of increased impulsive behavior, and possibly increased (thoughts of) sexual behavior and feelings of missing an intimate relationship. At the same time the use of sexual coping may be (somewhat) effective in reducing feelings of rejection and loneliness. Additionally, (thoughts of) deviant sexual behavior tend to linger. It is remarkable that most arrows spring from “Sex as coping”, because both the name and description of this factor (“I have used sex (or thoughts of sex) to forget negative feelings”) seem to imply that it serves as a reaction to something else. It is possible this origin lies outside the factors included in this model, with, e.g., boredom, emptiness, or dysthymia.
Comparison with Clinical Assessment
Comparison between the clinical assessment and the network analyses shows considerable overlap and a few interesting differences. An important similarity is that both clinical and experience sampling assessment indicate almost exactly the same factors as most relevant for the patient. The only difference in this pertains to patient’s feelings of rejection and loneliness. Network analysis identifies this as a relevant and central factor, while it may have been overlooked in the clinical assessment. It must be noted that patients may report their feelings differently at the time of experiencing them versus retrospectively, e.g., in a Stable interview. Therefore, it is also possible that loneliness was felt significantly at certain time points (and coincided with missing a partner and sexual thoughts) but was not reported retrospectively or was not present often enough to show an overall trait reflected in a high Stable score. Whether or not that would mark loneliness as a relevant factor, is up for discussion. It is also possible that the team was not aware of patient’s feelings of rejection and loneliness or underestimated their connectedness to other factors. These points are saliant, given that Van den Berg et al. (2020) name “Social rejection/loneliness” as one of the most, if not the most central factor in the network of people convicted of sexual offenses in general. It is possible that this factor deserves some extra attention in clinical practice in general and in the treatment of this patient specifically.
With regard to the directional relationships between the factors, an important difference emerges. The clinical assessment shows sexual self-regulation problems (i.e., “Sex as coping” and “Sexual deviance”) as factors that are mainly believed to be fed from other factors (i.e., “Lack of stable intimate relationships”, “Impulsive behavior” and “Lack of problem-solving skills”). Whereas in the statistical networks, the temporal relationships originate from the sexual self-regulation factors (i.e., “Sexual coping” and “Sexual deviance”) and influence other factors (“Impulsive behavior”, “Lack of stable intimate relationships”, “Social rejection/loneliness”) or perpetuate themselves (i.e., “Sexual deviance”). A possible explanation for the difference in these directions is that the treatment team may have looked at the factors from an etiological perspective and included a role for various factors in the development of the patient’s sexual self-regulation problems. However, the sexual self-regulation problems may have become so ingrained in the patient that they have taken on a “life of their own”. This could be seen as similar to addiction problems in people with ADHD, who often develop comorbid substance abuse problems as a form of “self-medication”. But treating the ADHD no longer has the desired effect on the substance abuse, for the addiction has taken on a life of its own and will have to be dealt with separately (Wilens & Morrison, 2012). A clinical implication of this finding is that sexual self-regulation problems, in particular “Sexual coping”, deserve specific and primary focus in the treatment of this patient. First, its radiating effects may help to influence various other factors simultaneously. Second, treatment focused on other factors may not have the desired effect if these factors keep on being “fed” by “Sexual coping”.
Limitations and Recommendations
Although the current assessment shows promise in personalized network modelling of risk factors for people convicted of sexual offenses, there are a number of limitations and recommendations for possible future improvements. Causal relationships and network interactions can best be detected with precise assessment techniques to reduce measurement error, however, these are hard to come by. We tried to be as precise as possible by using experience sampling gathered directly at the source: the patient, and we included as large a number of measurements as feasible over a prolonged period of time. Nevertheless, it is unlikely that all noise is excluded, and the results are best considered hypotheses.
The analyses have limited sensitivity due to the still relatively low number of measurements. This is especially notable for the temporal analysis excluding the nights, through which no significant temporal relationships could be detected. Although this problem could be solved by extending the assessment period or add more measurements per day, this would put an extra burden on the patients. In this case the patient indicated that he considered 2 weeks “quite long enough” and patients may not answer all questions conscientiously and accurately if measurements are significantly increased. It has been noted recently (Mansueto et al., 2022) that 75–100 time points are deemed feasible for clinical practice, but that the sensitivity of the analyses is indeed low with these sample sizes, especially for the estimation of temporal networks. Instead of increasing the number of time points, however, Mansueto et al., recommend reducing the number of factors, preferably to six. Reducing the number of factors could be done in advance, for example, by selecting only those factors for which a patient scores at least a “1” on the related Stable-2007 item. The disadvantage of excluding factors in advance, however, is that some of them may be unjustifiably excluded, like, for example, the feelings of rejection and loneliness for the patient in this report. The number of factors can also be reduced by selecting the most relevant items from the first analysis for a post hoc analysis, like in the current report.
The choice for an average-risk patient (level III) with a restricted range of problems might have limited the findings. However, most patients are of average risk (or thereabout), and it seems relevant that a new method is applicable to most patients. DIRN-analysis of a high risk patient is an interesting option for future research. Not only do the outcomes exclusively apply to one individual, average risk patient, but the patient also resided in a specific inpatient setting during the gathering of the data. Although he participated in a wide range of activities, e.g., work, sports, theater, and (supervised) leave outside the facility, he might not have undertaken all activities and experienced all feelings that he might have done while living in the community.
We aimed to keep the experience sampling questions as close to the Stable-2007 items as possible. However, whether the adjusted questions optimally represent the Stable-2007 traits remains a topic for further validation. Another topic for improvement is that the variance in the item scores over time was limited, reducing the ability of the analyses to identify relationships. The questionnaire was formulated in a general manner to be applicable to various patients. To enhance variance, a future development could be to use more personalized items or even use sum scores of multiple personalized items to assess a single dynamic risk factor. Items could be personalized by discussing with the patient what specific feelings, behaviors or thoughts would signify the presence of a certain factor for them and use that information to compose the items for their personalized questionnaire.
In line with common clinical practice, the clinical model used for comparison in this study was simpler than the statistical network model for it did not distinguish between a temporal and a contemporaneous network and did not add weights to the arrows. A future development could be to ask clinicians to provide all these clinical assessments to make a more complete comparison. Finally, it is important to realize that network analysis with experience sampling data is based on a patient’s self-report. For patients with a tendency for social desirability or a profound lack of self-insight, distorted pictures could arise. Thus, the method is not suitable for all patients, specifically in a forensic context. But for some patients, dynamic individual risk networks can provide a method to better tailor (risk) assessment and treatment to their individual needs and improve their treatment.
Footnotes
Author Note
Nathalie Van den Heuvel is now at Forensic Addiction Clinic Antes, Poortugaal, Netherlands.
Declaration of Conflicting Interests
The author(s) declared no potential conflicts of interest with respect to the research, authorship, and/or publication of this article.
Funding
The author(s) received no financial support for the research, authorship, and/or publication of this article.