
Abstract
Purpose
Oncology care continues to evolve at a rapid pace including provision of infusion-based care. There is currently a lack of robust metrics around oncology infusion centers and pharmacy practice. The workgroup completed a nationwide survey to learn about oncology-based infusion pharmacy services offered. The objective was to highlight consistent, measureable oncology-based infusion pharmacy metrics that will provide a foundation to describe overall productivity including emphasis on high patient-safety standards.
Methods
A nationwide survey was developed via a workgroup within the Vizient Pharmacy Cancer Care Group beginning in April 2019 and conducted electronically via the Vizient Pharmacy Network from September to November 2020. The survey was designed to capture a number of key metrics related to oncology-based infusion pharmacy services.
Results
Forty-one sites responded to the survey. Responses highlighted hours of operation (median = 11.5), number of infusion chairs (median = 45). Staffing metrics included 7.1 pharmacist full-time equivalent (FTE) and 7.6 technician FTE per week. 80.5% of sites had cleanrooms and 95.1% reported both hazardous and nonhazardous compounding hoods. 68.3% of sites reported using intravenous (IV) technology, 50.0% measured turnaround time, and 31.4% prepared treatment medications in advance.
Conclusion
There was variability among oncology infusion pharmacy practices in regard to survey responses among sites. The survey results highlight the need for standardization of established productivity metrics across oncology infusion pharmacies in order to improve efficiency and contain costs in the changing oncology landscape. The survey provides insight into oncology infusion pharmacy practices nationwide and provides information for pharmacy leaders to help guide their practices.
Introduction
The incidence of cancer continues to have a large impact on our society and healthcare system with an estimated 1.8 million newly diagnosed cases in 2020. The national expenditures for cancer care in the United States in 2018 was $150.8 billion with anticipated growth over time due to an ageing population and as newer, more expensive treatments are adopted as standard of care for patients. 1
Ambulatory-based oncology care has continued to grow with the addition of many new oral therapies and increase in the number of parenteral agents being given in outpatient infusion centers. The shift in care to the ambulatory setting for oncology patients is driven by a number of factors including but not limited to: expansion and advancement of available therapies, evolving care delivery, available billing and reimbursement for oncology services, and an overall demand to treat patients where it is most convenient. 2 With the COVID-19 pandemic, cancer care delivery has continued to further evolve with the rapid uptake of telemedicine and increased discussion around home-infusion-based therapies. 3
Changes in reimbursement landscape
Chemotherapy and oncology agents can be administered at different sites of care including: inpatient hospital admission, hospital-based infusion centers, free-standing infusion centers, provider offices, or even within the homecare setting. Changes in rules and regulations for reimbursement over time have influenced the preferred site of care. Congress passed H.R. 1900 – Social Security Amendments of 1983 which established a payment method for hospitals for operating costs of inpatient hospital services on the basis of diagnosis-related groups (DRGs) prospective rate. 4 Reimbursement based on DRGs resulted in increased costs to give chemotherapy in the inpatient setting. Oncology-based infusion treatments subsequently shifted to the outpatient setting (including hospital-based infusion centers, provider offices, or the homecare setting). 5 The federal government created the 340B Drug Discount Program in 1992 which required drug manufacturers to provide outpatient medications at a discounted price to nonprofit or public hospitals and/or clinics that met the criteria for serving a disproportionate share of low-income patients. The Medicare Prescription Drug Improvement and Modernization Act (MMA) in 2003 expanded the eligibility criteria to include rural and small urban general acute-care hospitals that met or exceeded the disproportionate share percentage of low-income patients while also changing the reimbursement of physician dispensed outpatient drugs covered under Part B. The Affordable Care Act in 2010 further expanded eligibility to all critical access hospitals, sole community hospitals, rural referral centers, and cancer centers and allowed multiple contract pharmacies for all covered entities. 6 Both declining physician reimbursement and expansion of the 340B Drug Discount Program over time have been cited for the growth of oncology infusions being administered in hospital-infusion center in place of provider offices or community oncology clinics. 7 The 2020 Community Oncology Practice Impact Report indicated that between 2008 and 2020, 1748 community oncology clinics and/or practices either closed, were acquired by hospitals, underwent corporate mergers, or reported financially challenges. 8
The MMA facilitated the expansion of Medicare Advantage and privately managed Medicaid enrollment. The majority of oncology patients are represented by either private payer insurance plans, Medicare Advantage, or privately managed Medicaid plans. These private payers heavily influence coverage and reimbursement policies for oncology therapies, including price negotiations. Several publications have studied the charge variation between chemotherapy given in an outpatient hospital-based infusion center and community-based infusion center using claims data and have shown that charges are higher for patients treated in the hospital-outpatient setting.9–12 However, the studies all note that there are limitations to using claims data and that clinical variables such patient risk factors and performance status, cancer type, or physician's choice of treatment are not readily available which makes it difficult to describe the cost variation completely. Given the increased costs seen with hospital-outpatient infusion centers, private payers are increasingly developing strategies to direct patients to alternative, lower-cost sites of services (e.g. provider-based clinics, homecare setting). Some payers are not authorizing treatments in hospital-based infusion centers and are instead requiring patients to be treated in alternative sites of care.10,13
Impact of turnaround time
Changes in the reimbursement landscape in the ambulatory oncology infusion setting have introduced new financial pressures which require health systems to continually evaluate their resources and care delivery models. Infusion centers must innovate to streamline processes and develop standard work to maximize resource utilization for the infusion center.
Previous publications have shown that increased patient wait time for chemotherapy is a source of dissatisfaction for patients.14,15 There are many checks and balances involved in a typical infusion visit and each process steps adds to the total patient wait time. Pharmacy teams need to work closely with other caregiver teams within the ambulatory oncology infusion setting to ensure coordination of activities from prescribing to administration of oncology therapies to minimize the wait time. One strategy is to perform activities such as nurse triage, pharmacist review of orders, and premixing of the chemotherapy prior to the patient's arrival as a mechanism to reduce patient wait times. 15
The pharmacy team plays an instrumental role in facilitating the appropriateness of oncology therapies from prescription to preparation for patients while also maintains the appropriate balance between safety and efficiency. 16
Available benchmarking data
Few publications have analyzed oncology infusion center metrics and many have limited specific data available regarding pharmacy services.17–20 There are a small number of single-center studies that have sought to develop productivity measurements within outpatient oncology sites.21,22 There have been no publications to date that evaluated multicenter outpatient oncology infusion site metrics to describe the current pharmacy landscape. With limited literature regarding benchmarking data, it is challenging for pharmacy leaders to right size their teams to best care for these complex patients. This survey was designed to evaluate oncology-based infusion pharmacy services offered by academic medical centers nationwide.
Materials and methods
The survey was conducted electronically via the Vizient Pharmacy Network and Pharmacy Cancer Care Group. The Vizient Pharmacy Network is a group of 107 academic medical centers throughout the United States. The Pharmacy Cancer Care Group is a subgroup of Vizient Institutions who provide Oncology Services. This survey was approved by the Vizient Pharmacy Network Executive Committee.
Survey design
The initial survey was developed via a workgroup within the Vizient Pharmacy Care Group beginning in April 2019. The purpose of the survey was to learn more about oncology-based infusion pharmacy services offered nationwide. The goal was to describe best practices that can enable centers to operate efficiently and safely. The objective was to highlight consistent, measureable oncology-based infusion pharmacy metrics that will provide a foundation to describe overall productivity while maintaining emphasis on high patient-safety standards. The survey was designed to capture information on a number of key metrics related to oncology-based infusion pharmacy services offered. The initial survey questions were designed to describe oncology-based infusion pharmacy demographic information which included hours of operation, areas/services provided, outpatient chemotherapy dispensing, and infusion/clinic/inpatient unit infrastructure. Survey questions were also directed toward full-time equivalent (FTE) for both pharmacists and technicians including breakdown by work activities. Survey questions were designed to understand the pharmacy compounding space for hazardous and nonhazardous oncology infusions. Lastly, the survey captured information regarding oncology-based infusion pharmacy practices including usage of robotics and automation technologies, order verification, products dispensed, turnaround time (TAT), and advanced preparation.
Definitions
TAT is time elapsed from patient assessment by nursing to preparation ready for administration and defined internally by responding institution. Advanced preparation is the preparation of treatment medications prior to a patient's appointment determined internally by responding institution. Survey respondents were asked to respond on behalf of the largest infusion pharmacy if an institution had more than one infusion pharmacy location.
Survey deployment
Survey data were collected via survey tool via QualtricsXMTM hosted at Vizient. Initial survey was sent on September 2020 to Vizient Pharmacy Network and Vizient Pharmacy Cancer Care Group via electronic mailing. The survey was resent via electronic mailing on November 2020 to Vizient Pharmacy Network and Vizient Pharmacy Cancer Care Group in order to capture additional respondents. No duplicate respondents were noted. The survey was deployed to Vizient institutions and was completed by representatives at each site by pharmacists or pharmacy managers and directors.
Statistics
Data analysis was completed utilizing Microsoft Excel (Microsoft Corporation, Redmond, WA). Data collected included survey responses. Data was analyzed using descriptive statistics, as appropriate.
Results
There were a total of 41 (n = 41) respondents to the survey. Thirty-one (n = 31) survey participants responded to the initial electronic mailing of the survey. Ten (n = 10) additional participants responded after the second electronic mailing reminder. Participants were from 29 different states.
Infusion pharmacy demographics
Pharmacy hours of operation for the infusion centers ranged from 8.5 to 24 h (median 11.5) during the weekdays (Monday to Friday) (Table 1). The most common start time during weekdays include 7:00 AM. Weekend hours differed among sites with seven pharmacies (17.1%) maintaining the same hours on the weekend (Saturday and Sunday). Fourteen pharmacies were closed on Saturday (34.1%) and 19 pharmacies were closed on Sunday (46.3%). One pharmacy (2.4%) maintained 24 h coverage 7 days per week.
Infusion pharmacy hours of operation.
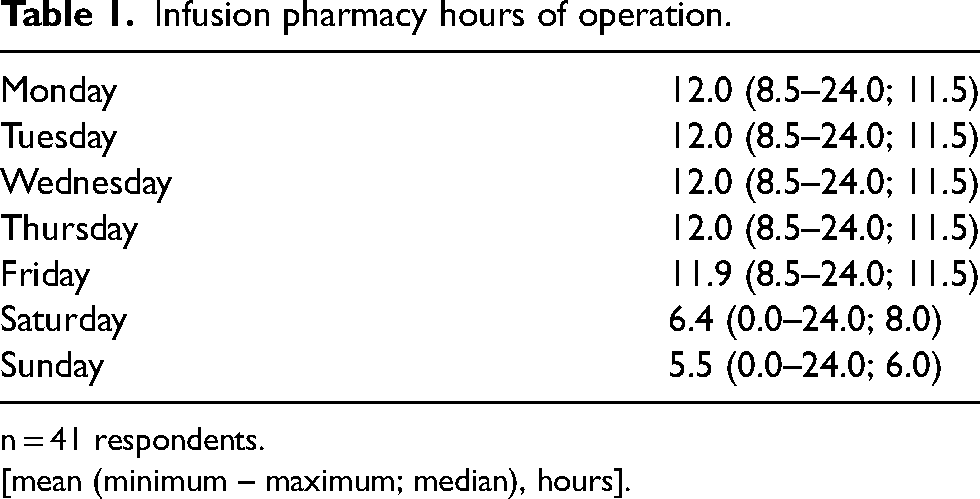
n = 41 respondents.
[mean (minimum – maximum; median), hours].
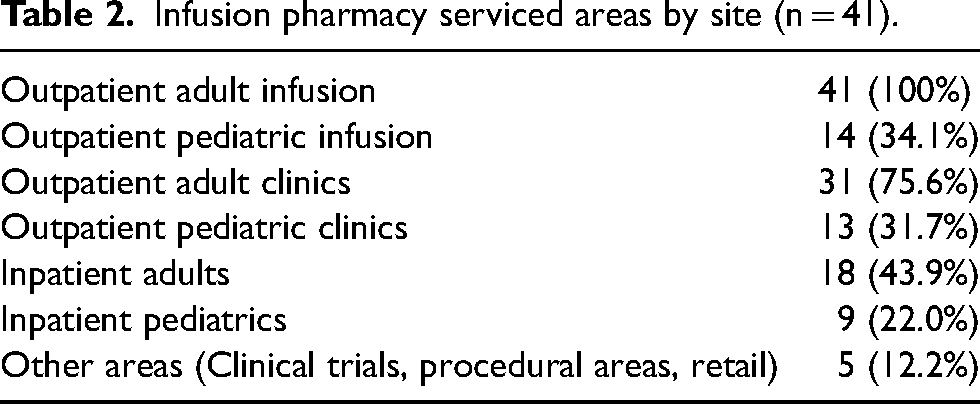
The infusion pharmacies provided services primarily to outpatient adult infusion areas (100.0%) while many sites also provided outpatient pediatric infusions (34.1%). Sites also provided services to outpatient adult clinics (75.6%) and outpatient pediatric clinics (31.7%). Many sites provided services to their hospitals including inpatient adults (43.9%) and inpatient pediatrics (22.0%) (Table 2).
Infusion pharmacy serviced areas by site (n = 41).
All of the infusion pharmacies serviced patients with cancer (hematology/oncology) (100.0%). The majority of the oncology infusion pharmacies also serviced bone marrow transplant (BMT) patients (68.3%) and patients requiring infusions for nononcology specialties such as rheumatology, dermatology, and gastrointestinal (75.6%) (Table 3). When asked about how outpatient chemotherapy is dispensed via the retail setting, 37 (90.2%) respondents indicated that their institution has their own retail/specialty pharmacy whereas three (7.3%) utilized a contracting pharmacy.
Hematology/oncology specialty services provided (n = 41).
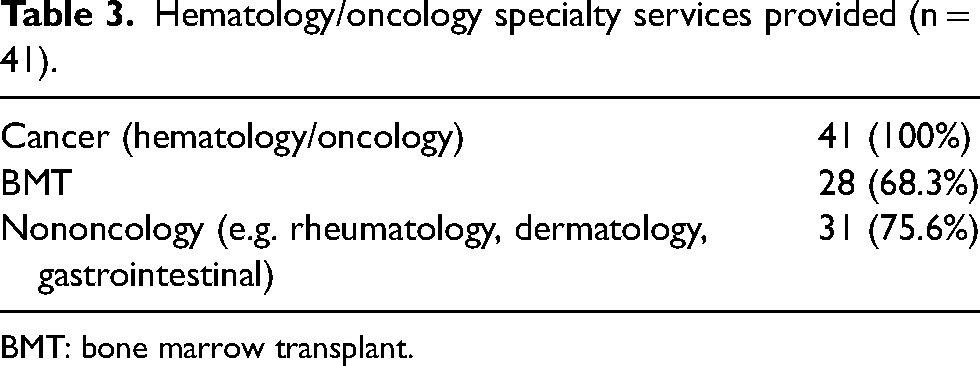
BMT: bone marrow transplant.
Thirty-nine (95.1%) respondents reported total infusion chairs covered by pharmacy services ranged from 7 to 200 chairs (median 45). Twenty-two sites that responded reported inpatient beds covered by the infusion pharmacy ranged from 1 to 800 inpatient beds (median 75.5). Thirty-two respondents reported the number of clinics served which ranged from 2 to 50 (median 10) (Table 4).
Infusion chairs, inpatients beds, and clinics supported by infusion pharmacy.
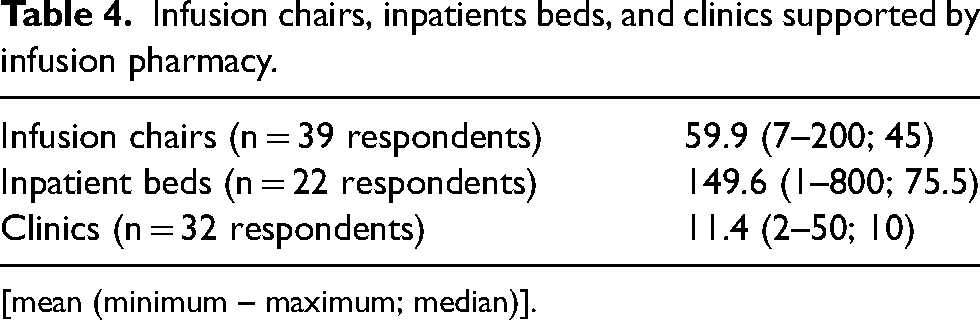
[mean (minimum – maximum; median)].
Infusion pharmacy staffing
When reviewing staffing for the pharmacy within each site, respondents reported an average of 7.1 pharmacist FTE per week and an average of 7.6 technician FTE per week. Breakdown of daily pharmacist FTE staffing activities and daily technician FTE staffing activities are described below (Tables 5 and 6).
Pharmacist FTE staffing breakdown.
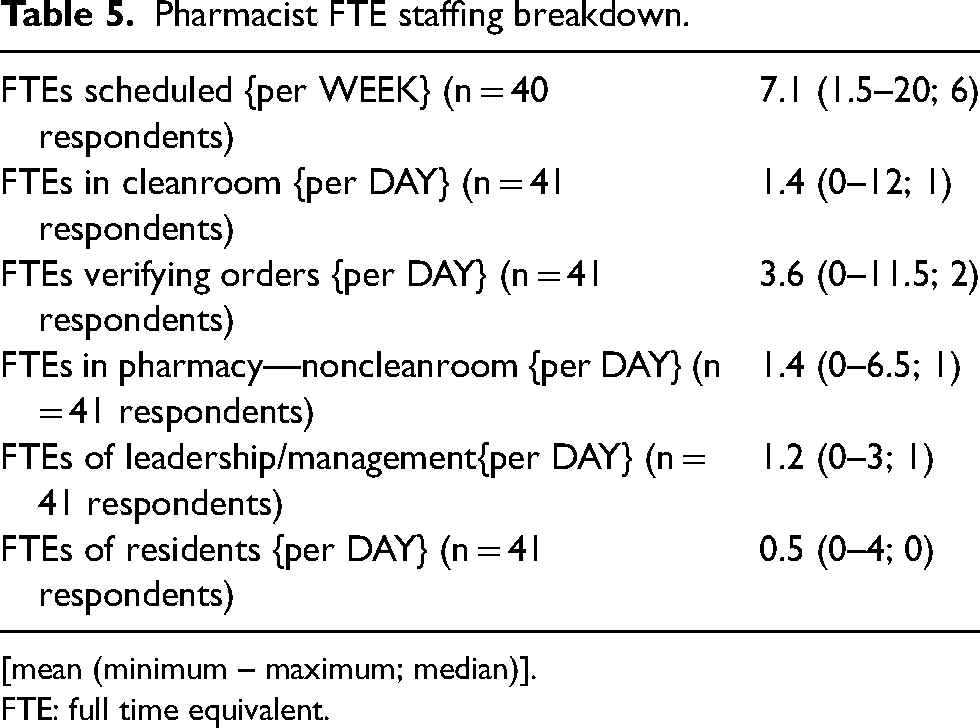
[mean (minimum – maximum; median)].
FTE: full time equivalent.
Technician FTE staffing breakdown.
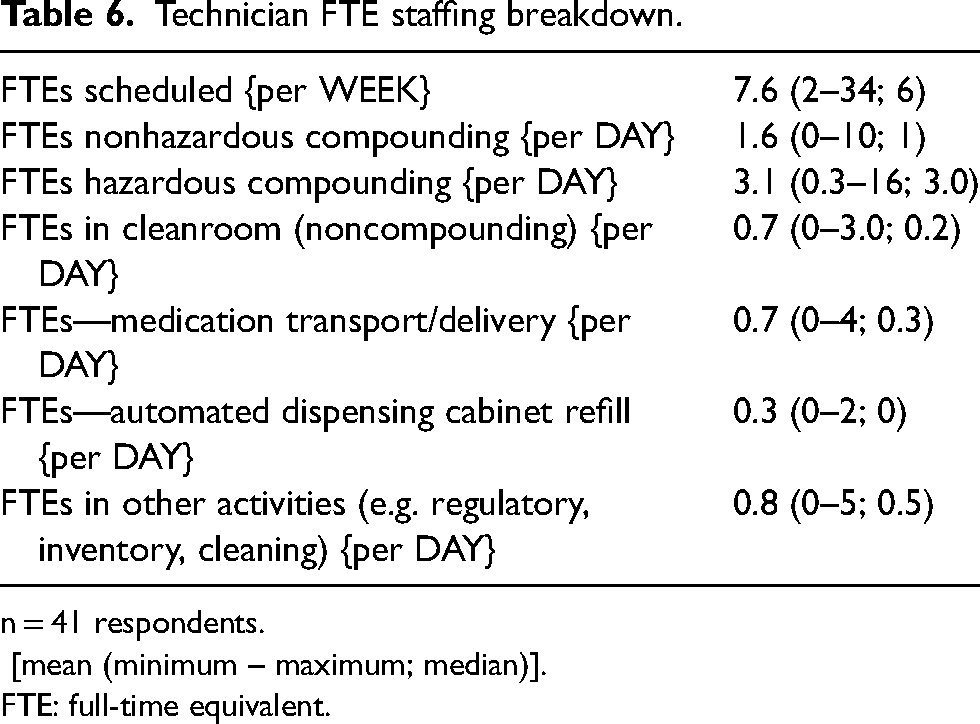
n = 41 respondents.
[mean (minimum – maximum; median)].
FTE: full-time equivalent.
Sites reported an average of 3.6 pharmacist FTE verifying orders per day and 1.4 pharmacist FTE in the cleanroom. The infusion pharmacy had on average 1.2 pharmacist FTE in a leadership and/or management position. Sites reported an average of 1.6 technician FTE in non hazardous compounding and 3.1 technician FTE in hazardous compounding which represented the majority of daily technician FTE as compared to remaining activities.
Infusion pharmacy compounding area
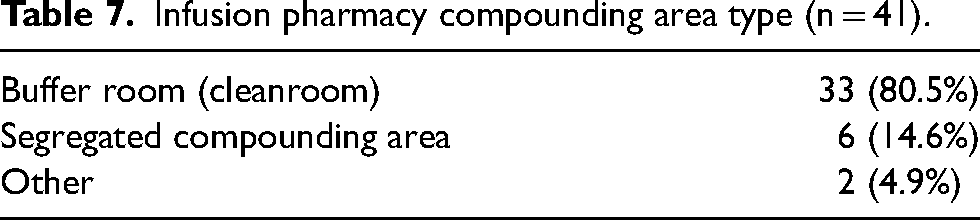
Thirty-three (80.5%) of respondents prepared infusions in cleanroom. Six (14.6%) sites prepared infusions in segregated compounding area (SCA). One respondent in the other category had a hybrid configuration (cleanroom for robotics and SCA for manual compounding) (Table 7). Sites reported a median of three hazardous and two nonhazardous compounding hoods (Table 8). Thirty-nine (95.1%) respondents reported having both hazardous and non hazardous hoods in their compounding space and two respondents had only hazardous hoods in compounding area. Fifteen (36.6%) respondents have a dedicated cellular therapy and/or gene therapy hood and 9 (22.0%) have a dedicated investigational therapy hood; however, median values for both hood types were zero (Table 8).
Infusion pharmacy compounding area type (n = 41).
Infusion pharmacy compounding area breakdown (IV compounding hoods).
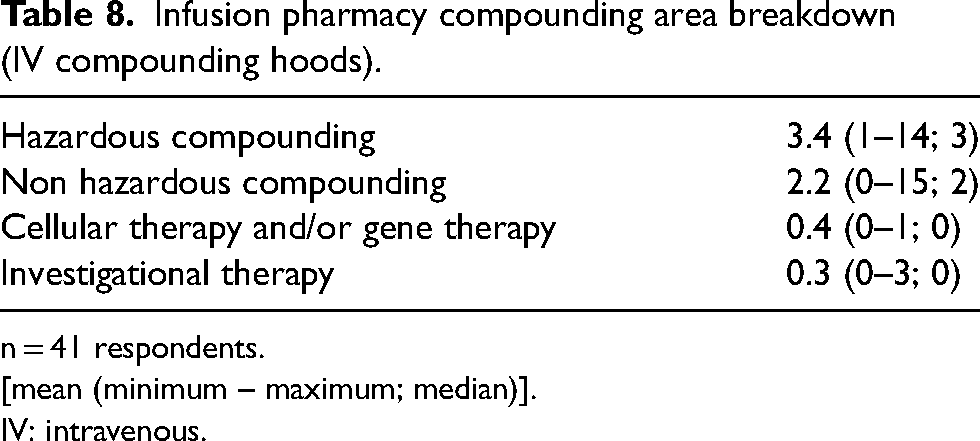
n = 41 respondents.
[mean (minimum – maximum; median)].
IV: intravenous.
Infusion compounding area breakdown
Twenty-eight respondents (68.3%) reported using intravenous (IV) workflow technology to verify products. Twenty-three respondents (56.1%) reported using a camera during product preparation. Seven respondents (17.1%) reported using robotic automation for compounding and 10 respondents (24.4%) reported using gravimetrics during product preparation. Three respondents (7.3%) utilized gravimetrics for product preparation but did not have robotic automation (Table 9). Of sites with robotic automation for compounding that reported number of infusion chairs within their institution (n = 6), the mean number of infusion chairs covered by the sites was 126.2 chairs.
Utilization of technologies in infusion pharmacy (n = 41).
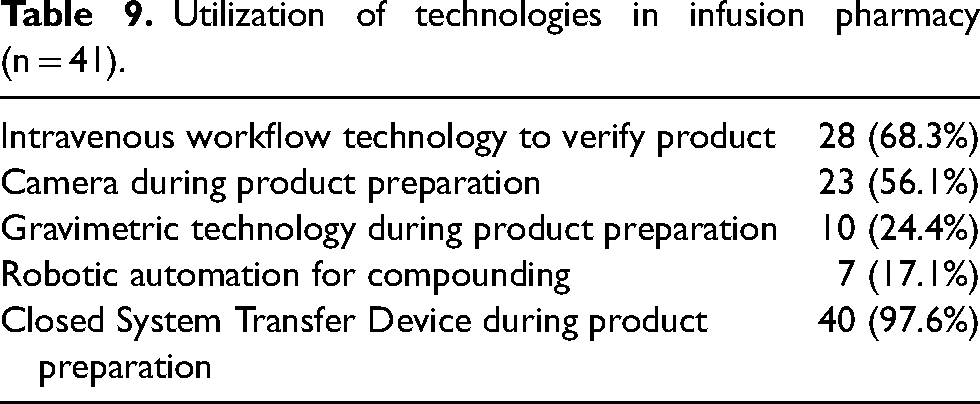
Forty respondents (97.6%) reported using closed system transfer devices (CSTD) during product preparation (Table 9). Breakdown of infusion compounding area technologies by vendor are included in Appendix 1.
Infusion pharmacy compounding and productivity metrics
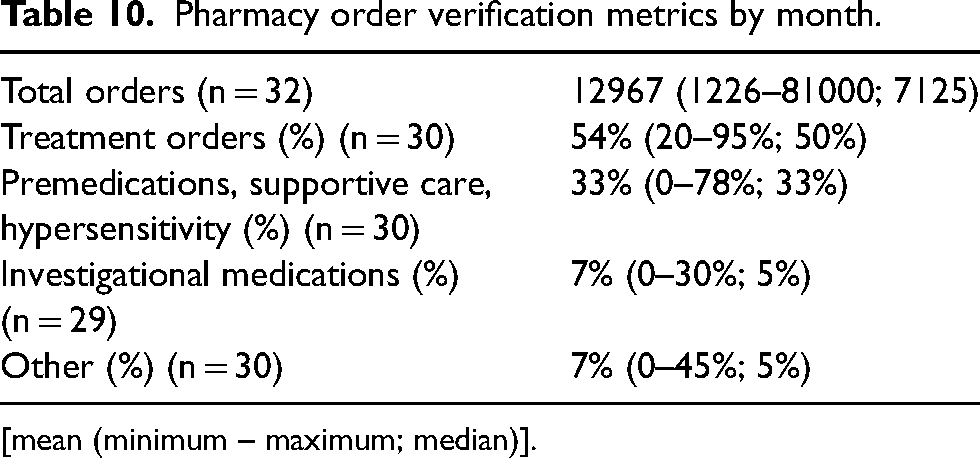
Thirty-two respondents reported order verification metrics for their infusion sites with a median of 7125 (range 1226–81,000) orders verified per month. Breakdown of order verification volume (n = 30) includes majority treatment orders (median 50%; range 20–95%) and premedications, supportive care, or hypersensitivity agents (median 33%, range 0–78%). The remainder of order verification data was made up of investigational medications and other medication types (Table 10).
Pharmacy order verification metrics by month.
[mean (minimum – maximum; median)].
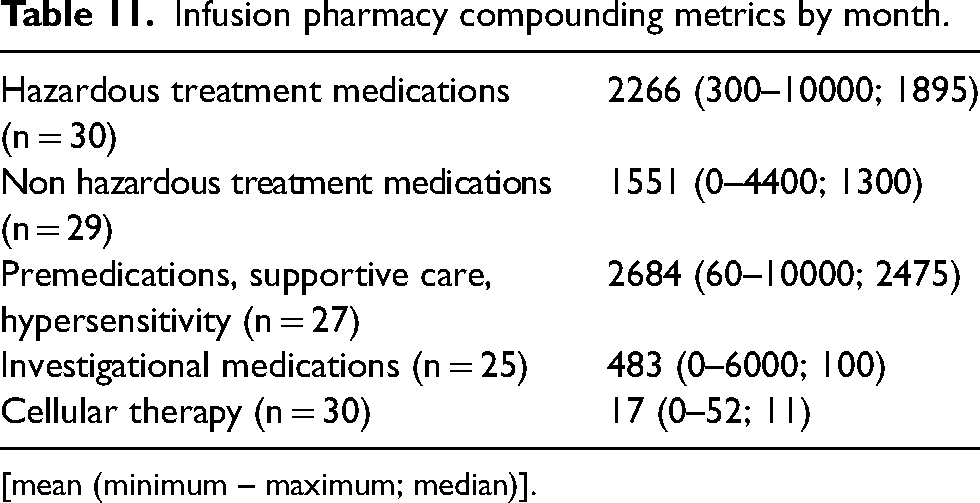
Respondents reported a median of 1895 (range 300–10,000) hazardous treatment medications per month and median of 1300 (range 0–4400) non hazardous treatment medications per month. Respondents reported a median of 100 (range 0–6000) investigational medications per month and median of 11 (range 0–52) cellular therapy doses per month (Table 11). Five respondents reported that 42% of their total infusion preparations were completed via robotics compounding systems [mean 42%, range 7–80%; median 40%].
Infusion pharmacy compounding metrics by month.
[mean (minimum – maximum; median)].
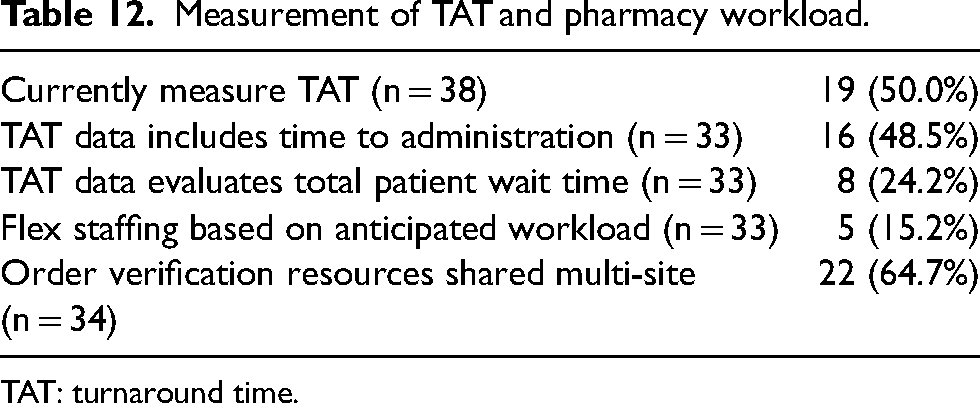
Nineteen respondents (50.0%) reported that they currently measure TAT with a variable response on what the measurement entails (Table 12). However, 30 respondents were interested in defining a standard measurement for TAT across institutions. Thirty-three respondents indicated they had previously measured TAT via various modalities including: 21 respondents using electronic health record (EHR), six respondents via manual collection, two respondents using a third-party technology resource, and four via other methodology to collect data. Additional details regarding TAT from respondents can be found in Table 12. Twenty-two respondents (64.7%) reported that they shared pharmacist order verification resources across sites while five respondents (15.2%) reported they flex their staffing based on anticipated volume (Table 12).
Measurement of TAT and pharmacy workload.
TAT: turnaround time.
Eleven respondents (31.4%) reported preparing treatment medications in advance of patient appointment (Table 13). Of these 11 respondents, the average percentage of treatment medications prepared in advance was 14.5%. Ten (90.9%) of these 11 sites reported preparing treatment medications the day before the patient appointment. Seven (70.0%) of 10 respondent sites also reported preparing treatment medications on the day of patient appointment before arrival. Ten (90.9%) of these 11 sites required orders to be signed in advance by the provider while seven (63.6%) required labs in advance of preparing the medication. Four (36.4%) of these 11 sites required a patient check-in call before preparing the medication while eight (72.7%) required an assessment of patient reliability (Table 13).
Advanced preparation workflow assessment.
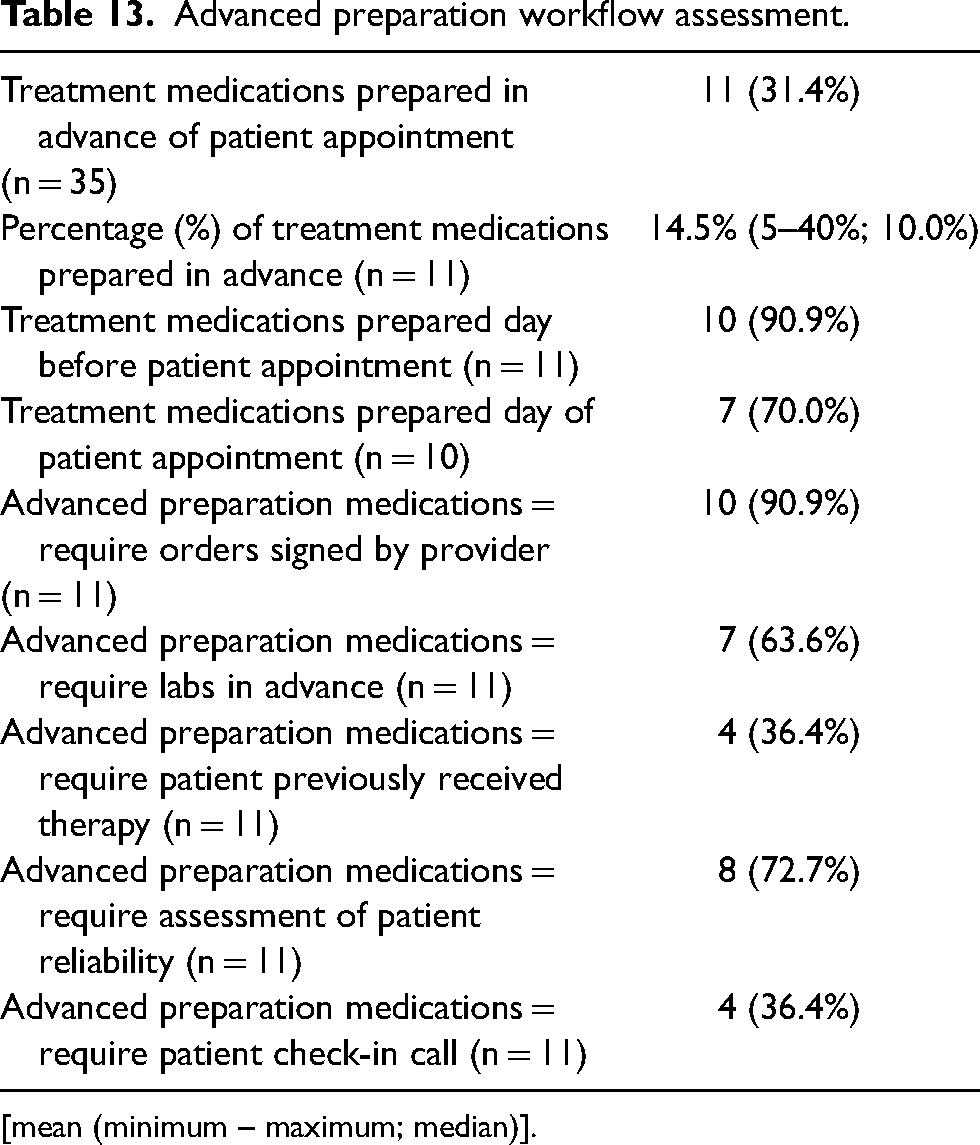
[mean (minimum – maximum; median)].
Discussion
Infusion pharmacy staffing
Pharmacists and technicians are critical in providing oncology infusion services; unfortunately, there is limited data available to date. This research project deemed it critical to describe comparative practices related to scope and diversity in pharmacy staffing. Previous literature has described that 60% of infusion centers have a dedicated pharmacist, technician, or both responsible for mixing chemotherapy. 17 Of the infusion centers with pharmacy staff, most programs (88%) have pharmacy technicians and pharmacists for the infusion center while 12% of sites reported only employing pharmacists (7%) or pharmacy technicians (5%), respectively. 17 In this survey, the mean pharmacist schedule FTE per week was 7.1 FTE (Table 5). Previous publications reported median of 1.9 FTE daily of pharmacist FTE for oncology infusion sites. 17 This difference demonstrates the size of institutions represented within this survey and the number of pharmacists required for maintaining oncology infusion operations.
The majority of the pharmacist FTE per week was dedicated to order verification with mean of 3.6 FTE per week. The process of chemotherapy prospective order review is complex to ensure the high-risk therapies that are ordered are safe and clinically appropriate. Previous literature has demonstrated that there are 57 independent checks identified for IV chemotherapy which demonstrates the complexity in ordering and dispensing chemotherapy and where pharmacists are critically involved. 23 Pharmacist verification is an important safety check that takes place between the prescribing of medications and the administration to patients and should be prospectively completed before preparation, dispensing, and administration of medications. 24 When reviewing orders for oncology infusion medications, there are two components: prospective clinical verification for order appropriateness of clinical order (cogitative order verification) and verifying the final preparation of the product is appropriate to dispense (product verification). 25 The Institute for Safe Medication Practices (ISMP) supports the use of independent double checks but does not describe specifically which high-risk medications should be included. 26 However, literature has demonstrated a relative increase of 33.3% in corrected errors identified upon second verification of parenteral oncology orders by a pharmacist during the independent double-check process. 25 Many oncology institutions have therefore established an independent double check with pharmacists completing prospective order review as the gold-standard of safety. While not specifically addressed within the survey, it is expected that given the majority of pharmacists FTE time dedicated to order verification was that many sites are practicing in this capacity. The number of FTE dedicated to this task per week demonstrates the overall importance of in chemotherapy processing across surveyed institutions.
Pharmacist involvement with final product verification can be variable across sites especially with institutions that have technology platforms to assist with final product verification. In institutions that are using technology platforms to assist with final product verification, pharmacists may not need to be present in the cleanroom, if State Board-specific regulations allow for remote verification. For sites that have pharmacist staff present inside the cleanroom, there is median of 1.4 pharmacist FTE per day.
Respondents reported a mean of 1.2 pharmacist FTE in a leadership and/or management position related to providing oncology infusion services. Given the activities required in providing oncology infusion services including but not limited to: sterile product preparation, compliance/regulatory, clinical care of complex patients, patient safety, prior authorization and financial stewardship, structured leadership in the oncology space is critical and was reflected in the survey.
Infusion technician staffing
The mean technician schedule FTE per week was 7.6 FTE but varied across sites. The largest portion of technician FTE was in hazardous drug (HD) compounding with 3.1 FTE which was not unexpected given the number of HDs used to treat oncology indications via chemotherapy (Table 6). Previous referenced article reported a median of 1.8 pharmacy technician FTE per day. In terms of daily activities, 39% had pharmacy technicians only preparing chemotherapy and 39% have pharmacists and pharmacy technicians preparing chemotherapy. And 19% had only pharmacists preparing chemotherapy. 17 Similar to the pharmacist metrics, the median number of technicians was demonstrably higher when compared to available literature which can be attributed to the size of the institutions represented within the survey and the number of technicians required for compounding oncology infusions across sites. Given this survey was directed at oncology infusion sites, the finding above around pharmacy technician staffing was not unexpected. There are many additional safeguards in place for hazardous compounding including use of a CSTD and utilization of IV technologies in product preparation that could require additional time requirements to pharmacy technical staff when compounding. Our survey demonstrated that majority of sites are using some component of IV workflow technology and CSTD in practice (Table 9). The use of these technologies in compounding practice often requires additional training for technician staff.
With the next release of the NIOSH List of Hazardous Drugs in Healthcare Settings, existing technician staffing models will be adapted as team members rotate between hazardous and non hazardous compounding settings to align with new regulations.27,28 The use of technicians in compounding of non-HDs had the next highest portion of technician time with 1.6 FTE (Table 6). Many of the other tasks included regulatory activities, medication transport, and refilling of automated dispensing cabinets which are all important roles in ensuring the infusion centers continue to serve patients (Table 6). The regulatory activities that require technician intervention are driven by the requirements of US pharmacopeia (USP) <797> and USP <800> .29,30
With the ongoing, severe shortage of pharmacy technicians across healthcare settings, institutions may be required to deploy other options for staffing hazardous and nonhazardous cleanrooms in the future for oncology product preparation. 31 Options could include robotics and deploying pharmacists to staff the cleanrooms for product preparation. The impact of the changes within technician workforce and ability to staff in infusion areas will continue to have a major impact on oncology product preparation.
Infusion compounding area infrastructure
Compliance with laws and regulations issued by local, state, and federal government agencies (e.g. Food and Drug Administration, Centers for Medicare & Medicaid Services, State Board of Pharmacy) and guidelines of accreditation bodies (e.g. The Joint Commission) is critical in the practice of sterile compounding. The regulations and standards set forth by these organizations are primarily based on USP <797> and USP <800> that provide minimum expectations for pharmacy departments to maintain in order to prepare sterile products and handle HDs.29,30 USP <800> describes practice and quality standards for safe handling of HDs in the healthcare setting, whereas USP <797> describes standards for compounding sterile medications.29,30 Both USP <797> and <800> contain language around facility and engineering controls that must be met by institutions when designing compounding facilities.19,20
The majority of sites reported having cleanroom for compounding oncology preparations (80.5%), whereas a minority utilized segregated compounding area (14.6%) (Table 7). As HDs are compounded, there are many layers of protection in place that are described as primary, secondary, and supplemental engineering controls. Engineering controls are required to ensure products do not have hazardous cross-contamination and microbial contamination (if sterile products are being prepared). 30 The containment primary engineering control (C-PEC) is a ventilated device designed where compounding occurs in International Organization for Standardization (ISO) 5 environments and must be externally ventilated if HDs are being prepared. 30 The C-PEC is located with a containment secondary engineering control (C-SEC) which can be found within ISO 7 buffer room with an ISO 7 class ante room or unclassified containment segregated compounding area (C-SCA). 30 While the C-PEC located within C-SEC buffer room is preferred per USP <800> for compounding HDs, both options are allowed. 30 If the C-PEC is located within C-SCA, the beyond use dating is limited per USP <797> (e.g. Category 1 limit of ≤12 h for controlled room temperature or ≤24 h for refrigerator). Of note, for both C-SEC options there are stringent requirements for facilities design (air changes per hour and negative pressure) that must be adhered to and monitored on a regular basis which adds layer of complexity in HD compounding.
Many of the oncology therapies utilized are considered hazardous and/or chemotherapy agents. USP < 800> requires that a list of HDs is maintained by the institution and National Institute for Occupational Safety and Health (NIOSH) has published a list of Hazardous Drugs in the Healthcare Settings that is used as basis for the chapter.27,30 USP <800> requires that antineoplastic hazardous agents requiring manipulation must adhere to standards set forth including dedicated compounding space. Therefore, our results of median of 3 hazardous hoods and 2 non hazardous hoods per site were expected (Table 8). Given sites have opportunity to perform their own risk assessment in USP <800> for agents outside of antineoplastic HDs, some sites may compound more of their non hazardous oncology agents (e.g. immunotherapy) in the hazardous areas to ensure additional protection. NIOSH is also in the process of updating their categorization of HDs in draft language which would impact how agents are handled within the compounding spaces. 28
For newer drugs and investigational agents, NIOSH provides criteria that can be used to evaluate medications and institutions can utilize to perform assessment of risk.
27
Our results show that some sites have dedicated compounding space for investigational agents (n = 9) and/or cellular therapy/gene therapy (n = 15); however, the median is 0 hoods per site for investigational and/or cellular therapy/gene therapy areas (Table 8). As the preparation of novel gene therapies and investigational agents continue to grow in the oncology therapeutic space, pharmacy teams could be exposed to medications with potentially unique biological and hazardous handling requirements.32–34 Gene therapy and/or investigational agents open up new therapeutic options in the oncology space; however, handling of these agents is important and include principles found in USP <800> including ensuring policies and procedures, staff training, and establishing infrastructure to accommodate.
32
As pharmacies become more involved in the preparation of novel therapies with biological and hazardous risk, the use of dedicated compounding space for the preparation of gene therapy products and investigational drugs may increase
Pharmacy technologies in infusion pharmacy
CSTD
There are many unique technologies utilized in oncology infusion preparation that are highlighted in Table 9. In order to minimize HD exposure, the utilization of CSTD is a commonplace among majority of sites (97.6%). USP <800> describes the use of CSTDs as SECs in order to provide additional protection during compounding or administration of HDs. CSTDs must be used in administration of HDs when the dosing form allows and should be used when compounding HDs when the dosing form allows. 30 Based on the available data from this survey, the use of CSTDs is now a common practice among the cancer centers surveyed. While USP <800> acknowledges that some CSTDs have been shown to limit potential of generating HD aerosols during compounding, it is not certain that all available products will perform at the same level and that users should rely on peer-reviewed literature to evaluate claims of performance. 30 There are many CSTDs available on the market and the breakdown of user sites on which product is used can be found in Appendix 1. There exists literature on effectiveness of CSTDs in oncology practice that is available in peer-reviewed journals. 35
IV workflow technologies and gravimetric
Significant opportunities exist to augment manual preparation of compounded products through use of pharmacy IV workflow technologies and/or gravimetric verification. The majority of sites reported using an IV workflow technology (68.3%) and further breakdown demonstrated use of cameras (56.1%) and gravimetric weighing steps (24.4%) Table 9.
ISMP has published ISMP Guidelines for Safe Preparation of Compounded Sterile Preparations and specifically recommends technology solutions (e.g. barcode scanning of ingredients, gravimetric verification of drug/diluent, and/or robotic image recognition) to augment manual processes of preparing and verifying sterile product preparations. ISMP specifically recommends use of barcoding and gravimetric verification when preparing chemotherapy as gravimetric verification adds an additional quality control step to confirm expected weight of ingredients and combined base solution when sterile products are prepared. 36 ISMP provides further clarification in their ISMP Targeted Medication Safety Best Practices for Hospitals and indicates that processes should be in place when using these technologies to ensure software is updated and that technology is used in manner to maximize medication safety features of the individual technologies. 37 ISMP indicates that manual inspection of sterile products by pharmacists and technicians is not completely effective in preventing preparation and dispensing errors and that barcode scanning of ingredients and base solutions should be the minimum expectation. 36 Based on the results of the survey, the majority of sites have some form of IV workflow technology (68.3%) but there is still considerable opportunity to increase uptake at sites to at least reach minimum expectation. When considering the best practice of gravimetric used in chemotherapy preparation, approximately a quarter (24.4%) of sites have this technology in their workflow. Sites should consider implementation of these IV technologies in order to ensure safety in high-risk chemotherapy compounding. There is existing literature describing the use of various IV workflow technologies; however, differing study designs limit the number of conclusions that can be made about the technologies in real-world practice.38–43 The IV workflow technologies can provide opportunities for virtual pharmacist checks of compounded oncology products including remote verification of photographs/videos of compounding steps, inline checks of high-risk medications, and final gravimetric verification (if applicable). Oncology sites can engage with their State Boards of Pharmacy around how to incorporate these technologies into practice to maximize pharmacist productivity while ensuring safety. Similar to the CSTDs, there are a number of available products on the market and site breakdown can be found in the Appendix 1.
Robotics
The IV robotic systems can improve safety and efficiency in compounding through standardization of workflow while also limiting HD exposure for compounding staff through self-containing compounding units.44,45 The implementation of IV robotic systems in sterile compounding of HDs requires many items including: adaptations in compounding workflow, facilities requirements within sterile compounding environment, and legal considerations with State Boards of Pharmacy around implementation.44,45 There are many key stakeholders in ensuring preparations are capable of being handled through IV robotic systems such as infusion pharmacists and technicians, robotics manufacturers, and pharmaceutical manufacturers to ensure vial usability within the platforms.45,46 There are some medications in the oncology infusion areas that are unable to be compounded by the available IV robotics systems due to various limitations but sites should continue to work with IV robotics system manufacturers to expand available medications within their libraries.
There exists literature on effectiveness of IV robotics systems in oncology practice; however, the data has shown variable findings across the various platforms.35,47–50 Based on the financial data available within these studies, an institution has to maintain a high-volume of infusions annually with IV chemotherapy robotics systems to justify the return-on-investment with the systems.50,51
Given the considerations of implementing an IV robotics system, only 7 out of 41 (17.1%) of respondents reported utilization of robotics in their oncology infusion practice. The mean number of infusion chairs serviced by sites with IV robotics systems (n = 126.2) was higher than the mean across all sites (n = 59.9). While opportunity exists for more organizations to incorporate technologies into sterile compounding practice, it was not unexpected to see higher incorporation of IV workflow technologies (including use of gravimetric verification) as compared to IV robotic systems which can be more costly and space prohibitive. One single-center study analyzed use of IV gravimetric-assisted workflow and use of IV robotics systems and found comparable compounding accuracy and precision. 52 This could provide suitable alternative for sites that are unable to implement the IV robotics systems within their infusion center.
Pharmacy metrics—productivity
Productivity monitoring is a tool used to evaluate processes and defines set of metrics to assess utilization of time and resources. 22 Outputs of system are compared to inputs for any given activity. 22 Benchmarking involves comparison of value and effectiveness of processes between both internal and external comparators.21,22 Internal benchmarking provides measurement of self-comparison over time and often is preferable to external benchmarking given its removal of potential for inaccurate comparisons due to nonsimilarity between organizations.22,53
There are a small number of single-center studies that have sought to develop productivity measurements within outpatient oncology sites.21,22 However, there are currently no established, nationally recognized standards for oncology infusion pharmacy productivity metrics. Standardized metrics is an area of future growth for oncology pharmacy leaders to define for benchmarking across sites.
As seen with the results of the survey in other areas, there is significant variability in responses for productivity metrics across sites (Tables 10 and 11) particularly for pharmacy order verification metrics and infusion pharmacy compounding metrics which can be attributed to range of size of organizations completing the survey. There are wide ranges of values for orders verified by pharmacists and types of orders verified (e.g. treatment orders, premedications, investigational agents). There is also wide array of types of oncology infusions preparation types by site (e.g. hazardous, non hazardous, premedications, investigational, and cellular therapies). This variability can be attributed to differences in size of site respondents which was unable to be controlled for in this survey. There are also differences in interpretation of regulatory requirements such as those defining hazardous medications per USP <800> and NIOSH which can alter how sites define number of hazardous and non hazardous preparations.27,30 The differences in measuring nonstandard inputs within oncology pharmacy infusion sites creates challenges in external comparisons between sites. There are a number of potential factors influencing productivity measurements within each site including but not limited to:
Number of infusion chairs/inpatient oncology beds Number of pharmacist and technician in staffing model Number and type of compounding areas Hours of operation Patient scheduling Complexity of product preparation: hazardous versus nonhazardous, investigational, and cellular therapies Utilization of intravenous technologies throughout the compounding process
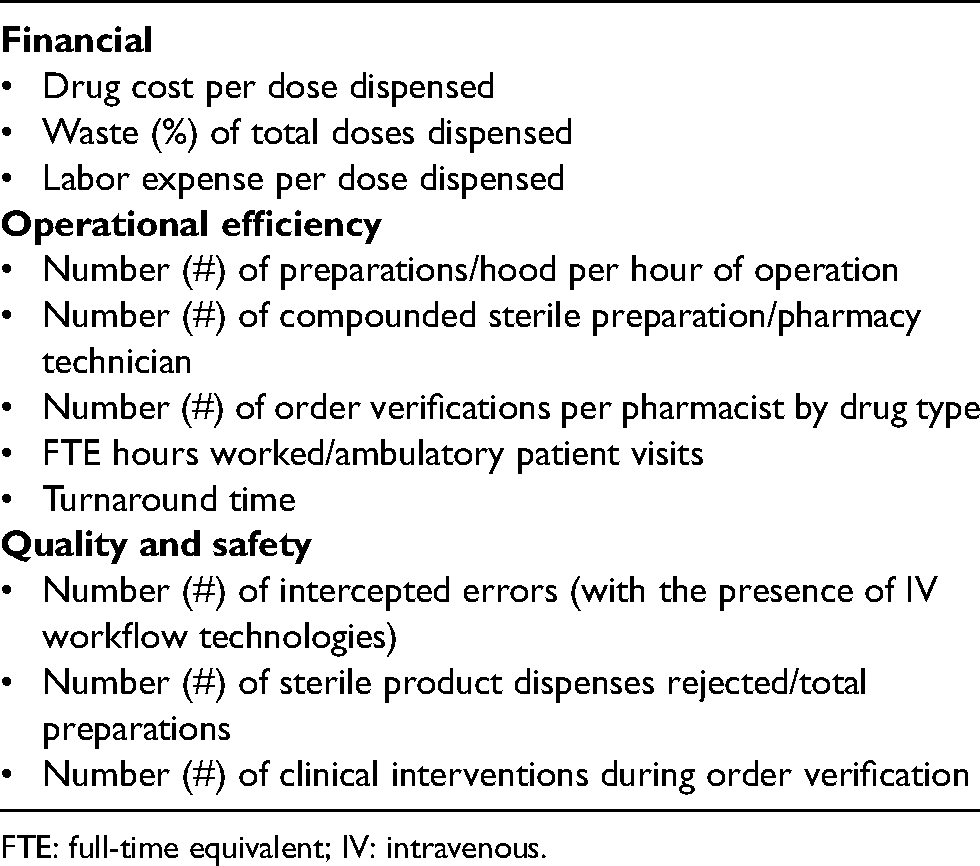
Productivity metrics should be aligned with similar site types in order to create accurate comparisons in external benchmarking. Careful consideration should be made when comparing across sites to ensure appropriate metrics and comparators are being reviewed. Understanding the number of factors that can influence productivity should be considered when establishing both inputs and outputs. In light of no industry standard metrics currently available, examples of proposed oncology infusion productivity metrics can be found in Appendix 2 that include potential measures for volume, operations, financials, and quality of care provided. While this survey begins to assess productivity across sites, future studies can work to better standardize and develop national benchmarks across oncology infusion pharmacies. Additionally, future studies can open the opportunity to determine the correlation of size of institution and volume to adoption of technology and workflow methodologies.
TAT and workload impact
TAT and infusion center efficiency has been addressed previously by a National Comprehensive Cancer Network (NCCN) workgroup. This workgroup sought to identify best practices in infusion center efficiency to minimize patient wait times while also maintain high-level of patient safety. The workgroup sent three surveys to NCCN member institutions regarding patient wait time, chemotherapy premixing practices, infusion chair use, and premedication protocols. The surveys identified practice variability across sites and recommended standardization across centers. 19
Of institutions surveyed in our data, only 19 respondents (50.0%) reported currently measuring TAT (Table 12). However, 33 respondents reported details on measuring TAT via various methodologies. Of those respondents, 16 reported TAT included time to administration and only 8 reported TAT included total patient wait time. NCCN workgroup reported a mean wait time of 58 min across responding institutions (range 25–102 min) which was defined as appointment time (or arrival time) to first drug initiated, including premedication, when applicable. 19 Data from this survey demonstrates inconsistency on how the TAT is measured and further standardization is warranted. We found similar sentiments among sites surveyed as 30 respondents were interested in defining standard measurement for TAT among institutions. The majority of sites (n = 21) in our survey utilized the EHR to measure TAT when they measured. EHR is recommended for measurement of TAT as consistent time stamps can be measured over reliance of manual methodologies used by other sites.
Opportunities to improve efficiency within infusion center were assessed with the NCCN survey data and drivers included amongst others: variable infusion rates of same drug regimen, absence of advanced preparation of medications, delivery of IV premedication over oral agents. Patients being “roomed” in the infusion chair prior to drug regimen being prepared and variation in planned time for nursing activity were also noted. 19 These drivers created significant variability in patient wait times and subsequently patient satisfaction.14,15,19
While the aforementioned factors were not assessed in our survey directly, there were other factors with ability to impact TAT that were assessed across our respondents. Five respondents (15.2%) reported flexing their staffing based on the anticipated workload and 22 respondents (64.7%) reported order verification pharmacist resources were shared across multi-sites. By combining flexible staffing models with more robust measurement of TAT by site, institutions can continue to gain efficiency in minimizing patient wait times and further study is warranted. Additionally, partnership with nursing and ambulatory oncology operations teams is important, as factors both within pharmacy and outside pharmacy impact TAT.
Advanced preparation
Advanced preparation or pre-preparation of chemotherapy medications is a strategy that can be utilized in order to reduce TAT. The NCCN efficiency workgroup study showed the minority of sites (12–19%) prepared some chemotherapy regimens in advance of appointment but of the sites that also reported TAT they saw mean reduction in patient wait time of 18 min compared to all sites. 19 A second study demonstrated 66% reduction in TAT after implementing advanced preparation program and third study demonstrated a reduction of 20.8 min in TAT upon implementation of similar program.11,45 There were differences in medications prepared across studies but many included different chemotherapy agents and other oncology agents.
Despite available data surrounding reduction of TAT with advanced preparation programs, our survey demonstrated only 11 institutions preparing oncology medications in advance of patient appointment (31.4%). Of sites who do utilize advance preparation programs, the mean (%) treatment medications prepared in advance is 14.5%. Majority of sites who have this type of program prepared medications the day prior to patient appointment (90.9%) and the majority also prepared medications (70.0%) on the day of the patient appointment. There exists features available in specific EHR that allow oncology medications to be prepared prior to patient appointment to facilitate this practice. Ten sites who have advanced preparation program (90.9%) require provider to sign orders before preparing which can also ensure the patient should receive the therapy (Table 13).
One of the concerns with advanced preparation program is potential waste if patient is not able to be treated. The reported waste in an advanced preparation program varies between available literature (0–21.7%) while some sites selected lower cost medications to minimize financial impact of waste; while cost formulas were not explicitly defined in available studies.15,19,54 In our study, there are a number of strategies that sites have taken to minimize waste including: obtaining labs in advance, requiring patient received therapy previously, patient screening for reliability, and check-in calls prior to therapy. The frequency which these strategies were deployed was variable across sites (Table 13). Each institution must determine which medications are eligible for an advanced preparation program and factors to consider can include cost, availability of medication, product stability, and ability to re-use if intended patient cannot receive among other considerations. Advanced preparation programs can also be multidisciplinary partnership including working with providers to sign orders, teams to obtain labs prior to patient appointments, and performing pre-check calls to assess patients for potential advanced preparation. As more institutions are challenged to reduce TAT and ensure patient satisfaction, advanced preparation programs will continue to be an important factor to consider including mechanisms to reduce waste.
Navigating changing landscape in oncology
With the rising cost of oncology care and changing reimbursement landscape, maintaining oncology infusion pharmacy services is becoming increasingly challenging.1,2 As more regulatory requirements must be met in order to ensure safe and effective oncology infusion services, it has become more financially challenging to meet these demands.29,30
There are many financial pressures impacting reimbursement in the oncology infusion pharmacy locations including: decreased reimbursement, shifts to alternative sites of care (e.g. provider based sites or homecare), required dispensing from external specialty pharmacies (e.g. white bagging) that are impacting traditional buy-and-bill models. These pressures from payers are not only impacting delivery of oncology infusions for health-system pharmacies but more importantly having an impact on patient's ability to receive timely and appropriate care. These strategies are being undertaken by many commercial payers in order to reduce costs while attempting to minimize impact on care of patients. 55 However, many oncology infusion pharmacies teams are undertaking significant administrative burden to ensure their patients continue to receive care. National oncology organizations have published position statements opposing alternative sites of care given the impact on patient safety, patient experience, and concerns over handling hazardous medications. 56 The increased demand for alternative sites of care from payers will likely impact how infusion therapies are delivered in the future. Pharmacy leaders should have ongoing discussions with institution leaders on what infusion therapies require resources at an outpatient hospital-based infusion centers and which could be appropriate for alternative sites of care (including homecare). With potential changes in healthcare reform, the future of 340B program may be limited as well. While there is expected to be an increased in uninsured patients in the United States due to a number of factors, the impact of expansion of uninsured patients on the 340B program is not abundantly clear. 6
In order to combat the ongoing reimbursement landscape changes, oncology pharmacy leaders must identify areas to reduce expense while also maintaining high-level of patient care and safety. While facing ongoing staffing challenges with pharmacy technician shortages, teams must also identify strategies to maximize effiency. 31 There were several strategies identified within this survey to consider for improving efficiency including advanced preparation programs and use of pharmacy technologies to augment sterile compounding amongst others. In addition to productivity metrics reviewed in this survey (e.g. order verification and compounding volumes), financial stewardship metrics will continue to be an important factor in oncology infusion pharmacy practice. Pharmacy staff oversight of oncology stewardship programs including ensuring cost-effective therapies will become an increasing important part of care to maintain patient outcomes while reducing costs. Pharmacy staff involvement in revenue cycle activities (e.g. prior authorization and denials management) are also a target to ensure financial viability. The advancement of pharmacy personal in these critical areas will continue to expand the role of pharmacy team members while also ensuring the viability of oncology infusion pharmacy practice in the future.
Limitations
While this survey was able to provide a wide representation of sites that provide oncology infusion-based services at academic medical centers nationwide, our survey had several limitations. One of the limitations is that the survey was only sent to pharmacy leaders at academic medical centers who are part of the Vizient Pharmacy Network. Thus, the responses did not include the data from community hospitals or nonhospital-based infusion centers. Another limitation is that the survey was sent electronically which provided limited opportunity for interactive dialogue prior to respondents submitting responses. Survey responses were captured and analyzed but not all respondents completed all questions. In addition, the survey did not provide definitions of terms such HD or TAT. Respondents answered the survey questions based on their institutional definition.
Recommendations
Based on the review of the available data in the survey, there are a number of recommendations developed that health-system pharmacy leaders overseeing oncology infusion practices should consider:
National professional organizations should facilitate the creation of expert panels to standardize the evaluation of oncology infusion pharmacy productivity
o Expert panels should describe the core metrics that should be used in this evaluation, including measures related to patient quality & safety and financial stewardship in addition to operational metrics
Health-system leaders should evaluate utilization of IV technologies (e.g. IV workflow system, gravimetrics, robotic use) in preparation of high-risk chemotherapy preparations including measuring outcomes associated with implementation of these systems
Health-system leaders should evaluate infusion compounding facilities to ensure these areas align with requirements of standard-setting organizations (e.g. Joint Commission, State Boards of Pharmacy) and include required infrastructure to support future changes in oncology practice (e.g. investigational agents, cellular and gene therapies)
National professional organizations should facilitate development of standardized definition of TAT incorporating multidisciplinary processes steps and impact on patient wait time
o Health-system leaders should work toward development of mechanism to routinely measure TAT based the on relevant data within electronic health record.
Health-system leaders should consider implementation of advance preparation programs for chemotherapy and other oncology infusion agents where appropriate with emphasis on strategies to minimize waste (e.g. labs, patient reliability)
Conclusion
There was variability among oncology infusion pharmacies in regard to number of key metrics impacting practice across pharmacy staffing, compounding area infrastructure and technologies, productivity metrics, and workflow. The survey results highlight the need for standardization of established productivity metrics across oncology infusion pharmacies which will be increasingly critical in order to improve efficiency and contain costs given the evolving oncology landscape. The survey provides insight into oncology infusion pharmacy practices nationwide and provides insight for pharmacy leaders to help guide their practices.
Footnotes
Author contributions
AMB, ME designed study; YK collected the data; AMB, CS, AK, BV, HS, SS, VP, BS, CB, MJ performed the analysis and interpreted the results; AMB, CS, AK, BV, HS, SS, VP, BS, CB, MJ drafted the manuscript. All authors reviewed and approved the final version of the manuscript.
Declaration of Conflicting Interests
The author(s) declared no potential conflicts of interest with respect to the research, authorship, and/or publication of this article.
Funding
The author(s) received no financial support for the research, authorship, and/or publication of this article.
Appendix 1: Utilization of technologies in infusion pharmacy (breakdown by vendor).
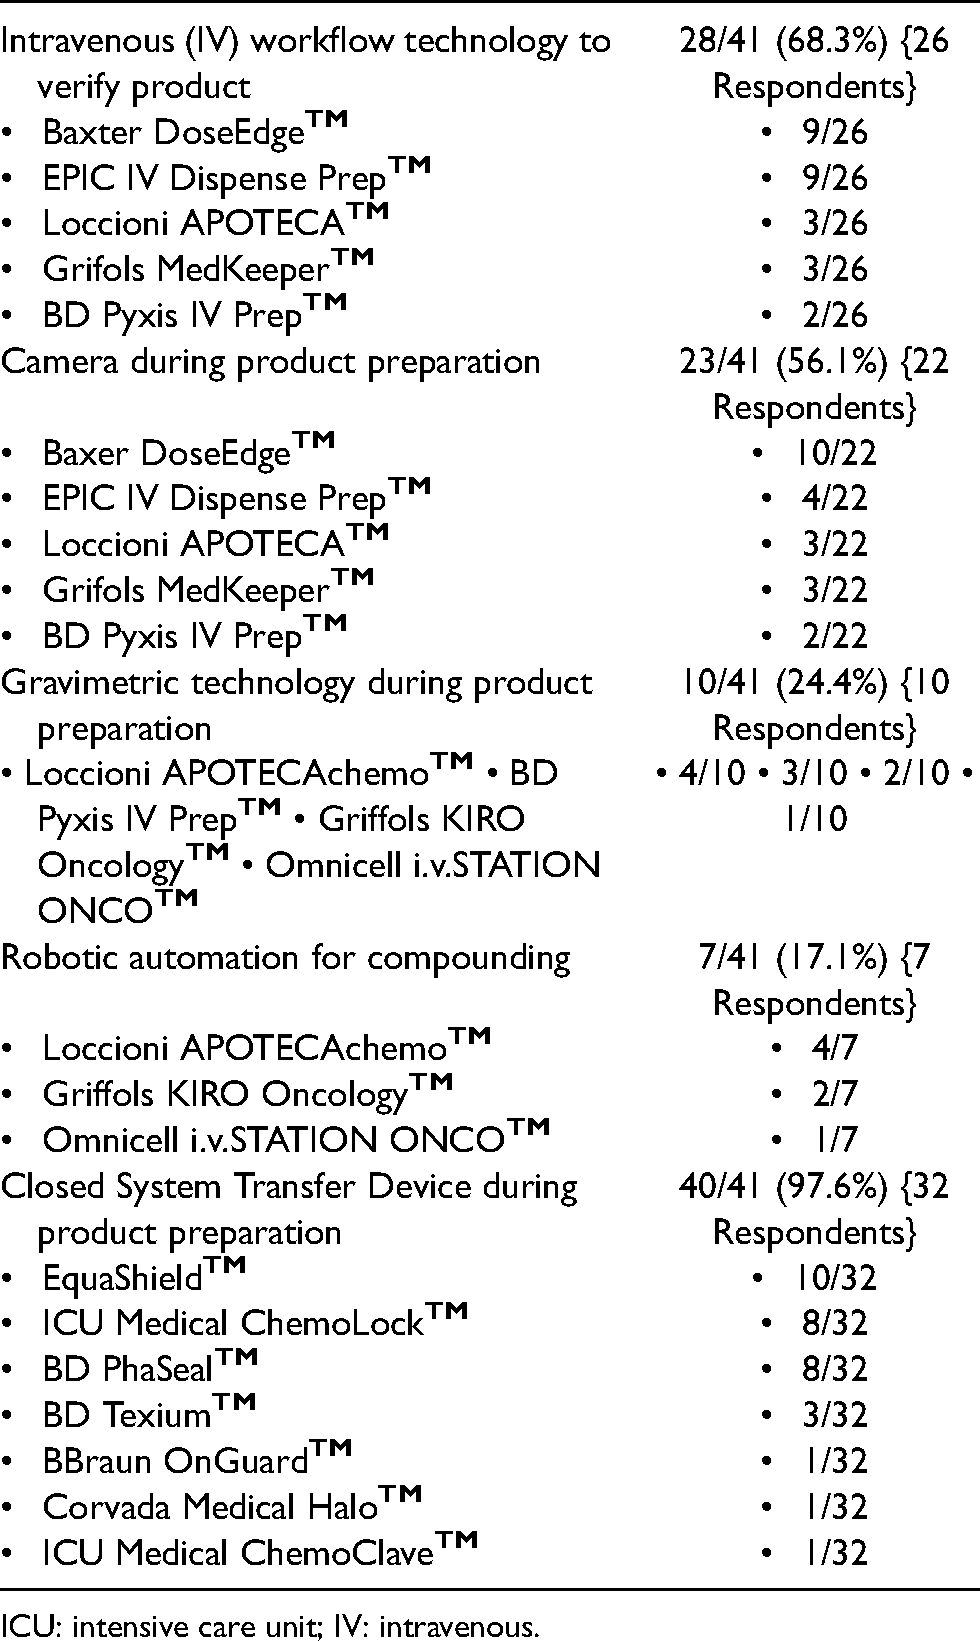
| Intravenous (IV) workflow technology to verify product | 28/41 (68.3%) {26 Respondents} |
|
Baxter DoseEdge EPIC IV Dispense Prep Loccioni APOTECA Grifols MedKeeper BD Pyxis IV Prep |
9/26 9/26 3/26 3/26 2/26 |
| Camera during product preparation | 23/41 (56.1%) {22 Respondents} |
|
Baxer DoseEdge EPIC IV Dispense Prep Loccioni APOTECA Grifols MedKeeper BD Pyxis IV Prep |
10/22 4/22 3/22 3/22 2/22 |
| Gravimetric technology during product preparation | 10/41 (24.4%) {10 Respondents} |
| • Loccioni APOTECAchemo |
• 4/10 • 3/10 • 2/10 • 1/10 |
| Robotic automation for compounding | 7/41 (17.1%) {7 Respondents} |
|
Loccioni APOTECAchemo Griffols KIRO Oncology Omnicell i.v.STATION ONCO |
4/7 2/7 1/7 |
| Closed System Transfer Device during product preparation | 40/41 (97.6%) {32 Respondents} |
|
EquaShield ICU Medical ChemoLock BD PhaSeal BD Texium BBraun OnGuard Corvada Medical Halo ICU Medical ChemoClave |
10/32 8/32 8/32 3/32 1/32 1/32 1/32 |
ICU: intensive care unit; IV: intravenous.
Appendix 2: Proposed infusion pharmacy productivity metrics.
|
|
|
Drug cost per dose dispensed Waste (%) of total doses dispensed Labor expense per dose dispensed |
|
|
|
Number (#) of preparations/hood per hour of operation Number (#) of compounded sterile preparation/pharmacy technician Number (#) of order verifications per pharmacist by drug type FTE hours worked/ambulatory patient visits Turnaround time |
|
|
|
Number (#) of intercepted errors (with the presence of IV workflow technologies) Number (#) of sterile product dispenses rejected/total preparations Number (#) of clinical interventions during order verification |
FTE: full-time equivalent; IV: intravenous.