
Abstract
There is general agreement that high housing costs in transit-oriented developments (TODs) largely stem from housing supply shortages. However, the debate persists on whether supply-side efforts could reduce housing costs in TODs. This paper contributes to this debate by examining the impacts of TOD housing stock and built environments on housing costs. The block groups of twenty-six U.S. metropolitan areas were classified into six categories based on proximity to rail, housing density, and walkability. The studied metropolitan areas were grouped into three clusters based on housing and transit characteristics. Results from multilevel regressions partly support supply-side efforts, including “missing-middle” housing, showing that in two of the clusters, a larger share of metropolitan TOD housing units is associated with lower TOD rents. However, the results also show the limits of supply-side efforts to lower costs in metropolitan areas where housing in TODs is more expensive than the metropolitan average.
Introduction
Housing scholars and professionals commonly argue that insufficient housing supply is a major factor driving high housing costs in large U.S. metropolitan areas and elsewhere (Gyourko, Mayer, and Sinai 2013; Been, Gould Ellen, and O’Regan 2019; Wetzstein 2021; Been, Gould Ellen and O’Regan 2023). Housing cost pressures are especially a problem in compact transit-rich environments in large metropolitan areas that have been experiencing demand growth (Urban Land Institute 2015; Yan 2020) that is difficult to meet in the short term (Been, Gould Ellen, and O’Regan 2019). On the other hand, restrictive land-use regulations constrain new housing development, including in high-demand neighborhoods (Gabbe 2019). The demand for housing in compact mixed-use development, coupled with the scarcity of these neighborhoods in most U.S. metropolitan areas (Levine, Inam, and Torng 2005; Levine and Frank 2007; Yan 2020), leads to higher prices, especially in high-demand locations (Gyourko, Mayer, and Sinai 2013; Murray 2021).
Despite general agreement over the role of housing supply in shaping housing costs, there is still a debate on whether supply-side solutions can also alleviate housing cost pressures (Been, Gould Ellen, and O’Regan 2019; Wetzstein 2021). Supply-side advocates call for increasing housing densities, especially in transit-oriented developments (TODs), characterized by compact pedestrian-friendly built environments served by transit, citing evidence linking greater housing supplies with lower housing costs (Mayer and Somerville 2000). However, the majority of research on housing supply and housing costs examines this relationship at the city or metropolitan level (Glaeser, Gyourko, and Saks 2006; Gyourko, Mayer and Sinai 2013). Much less is known about housing supply and costs at smaller scales (Been, Gould Ellen, and O’Regan 2019; Anenberg and Kung 2020) or the types of built environments in which their supply may alleviate cost pressures. Thus, a question remains whether a larger housing stock in transit-oriented built environments could alleviate housing cost pressures.
This study contributes to this debate by examining the relationships between metropolitan housing stock in compact transit-rich block groups and block group rent in twenty-six U.S. metropolitan areas with intra-urban light, heavy, or commuter rail service. Specifically, the study asks whether a larger share of metropolitan housing units in compact transit-rich block groups is associated with lower block-group rent. To the extent that housing in compact transit-rich block groups is expensive due to its scarcity regionwide (Murray 2021), rent in these environments is expected to be lower in metropolitan areas with a larger share of housing units in similar built environments regionwide (Fingleton, Fuerst, and Szumilo 2019). Such evidence will lend support to supply-side efforts to alleviate housing cost pressures. Conversely, outcomes showing that the share metropolitan housing units in TODs are associated with higher rents would suggest that supply-side efforts might not be enough to alleviate housing costs where these built environments are scarce or where there is large intranational and international demand for housing (McAllister and Nanda 2015; Devaney, Scofield, and Zhang 2019).
The analysis employs multilevel regressions with cross-level interactions between three metropolitan housing stock measures and six block-group types. The twenty-six studied metropolitan areas are grouped into three clusters based on housing and transit characteristics. Block groups are classified into six types based on their housing-unit density, walkability, and proximity to a rail station (Renne et al. 2016): three rail-proximate block-group types and their three non-rail equivalents. This classification enables examining how metropolitan housing stock in TODs is associated with rent in different block-group types. While causal relationships are not examined, the outcomes suggest that housing practitioners could help alleviate housing cost pressures by promoting development in a diversity of built-environment combinations near and away from rail stations rather than focusing supply efforts on the most transit-rich TODs. Yet, these efforts might not be effective in metropolitan areas where the most compact transit-rich block groups are valued more than the average block group.
The article is organized as follows. The next section reviews the literatures on the relationships between housing supply, built environments, transportation benefits, and housing costs. The third section describes the research approach, including data and variables. Section four presents the results. The paper concludes with implications for housing theory and policy.
Literature Review
Hedonic models and geographically weighted regressions are commonly used to explain residential housing costs as a function of demand- and supply-side factors (Can 1992; Basu and Thibodeau 1998; Bowen, Mikelbank, and Prestegaard 2001; Aquaro, Bailey, and Hashem Pesaran 2021). On the demand side, housing costs are a factor of physical unit characteristics like size, age, number of rooms, construction quality, and amenities (e.g., a pool, gym). Other studies examine costs as a function of locational characteristics like access to transport services (Higgins and Kanaroglou 2016), pedestrian-friendly built environments (Song and Knaap 2004), proximity to parks (Troy and Grove 2008), school quality (Nguyen-Hoang and Yinger 2011), and crime (Troy and Grove 2008). On the supply side, housing costs are affected by a wide range of regional characteristics (Paciorek 2013), namely housing supply and constraints on supply, including geographic conditions (Saiz 2010) and land-use regulations (Mayer and Somerville 2000; Molloy, Nathanson, and Paciorek 2022). This paper focuses on three policy-relevant factors—locational amenities (built environment and transportation benefits) on the demand side and metropolitan housing stock on the supply side—to explain block-group rent.
Locational Amenities and Housing Costs
The demand-side literature has identified a wide range of physical, locational, and environmental housing characteristics that are associated with housing costs, including access to transport services, pedestrian-friendly built environments, and mixed land uses. This literature primarily focuses on the factors that shape single-family housing prices, with less work on multifamily units. Nonetheless, research on price-rent ratios suggests that both costs are affected by similar characteristics, yet the magnitude of their effect might vary across metropolitan areas and over time (Kishor and Morley 2015; Hill and Syed 2016).
Research on the association between transportation characteristics and housing costs has primarily confirmed that the latter tend to be higher near transport services and especially rail stations (Cervero 2004; Chatman, Tulach, and Kim 2012; Higgins and Kanaroglou 2016). And this relationship is stronger in lower-income neighborhoods (Bohman and Nilsson 2016). Conversely, for higher-income neighborhoods, the presence of rail is often associated with lower prices (Chatman, Tulach, and Kim 2012) due to increased traffic, noise, or crime (Bowes and Ihlanfeldt 2001; Golub, Guhathakurta, and Sollapuram 2012).
The effect of rail service on housing cost appreciation might depend on the interaction between housing type and rail-corridor built-environment characteristics. Studies have found that the housing costs of rail-oriented multifamily units, especially in dense and pedestrian-friendly environments, appreciate more than the housing costs of single-family units located near rail service (Cervero 2004; Duncan 2008; Atkinson-Palombo 2010; Golub, Guhathakurta, and Sollapuram 2012; Kay, Noland and DiPetrillo 2014). These studies suggest that the cost premium near rail stations might stem partly from the pedestrian-friendly environment and access to rail service (Cao and Lou 2018).
The cost premiums associated with different pedestrian-friendly built-environment elements are further confirmed in studies on housing costs in compact and mixed land-use development (Song and Knaap 2003; Song and Knaap 2004; Park, Huang, and Newman 2016). Again, housing type and neighborhood built environment might mediate the relationship between mixed land uses and housing costs (Park, Huang, and Newman 2016). Specifically, land use mix is positively associated with the cost of multifamily housing in pedestrian-friendly neighborhoods but has no association (Diao and Ferreira 2010) or a negative association with the value of single-family units in auto-oriented environments (Matthews and Turnbull 2007; Sohn, Vernez Moudon, and Lee 2012). Similarly, walkability measures that account for the presence of pedestrian-friendly street designs, as well as commercial and retail destinations, largely show a positive association with housing costs in already walkable or dense neighborhoods but a negative effect on single-family housing costs, especially in auto-dependent neighborhoods (Li et al. 2014; Li et al. 2015). Other studies, however, have found that after controlling for neighborhood fixed effects, walkability does not significantly affect single-family house prices (Boyle, Barrilleaux, and Scheller 2014).
Combined, the literature suggests that the association between access to rail service and built-environment characteristics and housing costs is stronger where multiple factors are simultaneously present. Specifically, pedestrian-friendly built environments are valued more in compact locations with access to a rail station but are considered a disutility in low-density suburban locations. However, the interactions between rail access, pedestrian-friendly built environments, and housing costs are typically not studied explicitly. Moreover, studies tend to focus on a single metropolitan area, thus limiting the ability to generalize across metropolitan areas with different population, urban form, housing, and transportation characteristics.
Housing Stock and Housing Costs
The literature on housing supply and housing costs suggests that the price elasticity of housing supply varies spatially and temporally depending on the interactions between (land use) regulation, supply constraints, housing demand, and specific locational characteristics (Bowen, Mikelbank, and Prestegaard 2001; Dubé and Legros 2014; Wu, Li, and Huang 2014). For example, regulatory requirements like mandates on developing affordable housing units are associated with higher housing costs (Hamilton 2021; Ortiz-Villavicencio, Sánchez, and Fernández 2024). Such outcomes might be due to slower housing development in general or the diversion of construction efforts to smaller unregulated developments (Li and Guo 2022).
A more prominent regulatory factor includes land-use regulations that constrain housing supply, in part through increasing permit application and housing construction times, especially outside of single-family areas (Glaeser, Gyourko, and Saks 2006; Molloy, Nathanson and Paciorek 2022). Since density is often restricted in the U.S. (Levine 2010), central cities and denser locations are less responsive to demand shocks (Fingleton 2008; Goodman and Thibodeau 2008). Even when restrictive zoning is removed, this does not necessarily lead to new housing construction, at least in the short term (Anenberg and Kung 2020; Freemark 2020). The result is lower supply elasticities and more pronounced cost appreciations in denser metropolitan areas (Green, Malpezzi, and Mayo 2005), while developers often prefer shifting development to suburban locations with available low-cost land (Mohamed 2009).
Restricting the development of compact pedestrian-friendly environments across large portions of U.S. metropolitan areas, coupled with an increased demand for these built environments (Urban Land Institute 2015; Yan 2020), further increases housing costs in highly demanded locations. Gyourko, Mayer, and Sinai (2013), for example, show that an increase in demand at the national level disproportionately affects prices in a small number of U.S. metropolitan areas. In these metropolitan areas, high housing demand is coupled with inelastic housing supply, leading to persistent price appreciation over time. The limited supply of housing in highly demanded locations leads to increased competition over scarce built environments, thus further pushing up housing costs (Murray 2021).
Moreover, housing costs are not only a function of local supply and demand conditions but also a function of these dynamics in neighboring districts with comparable housing characteristics (Fingleton, Fuerst, and Szumilo 2019). Consequently, increases in housing costs in one location often spillover into neighboring locations (DeFusco et al. 2018; González-Pampillón 2022). However, housing cost spillovers are not spatially or temporally homogeneous. Rather, housing cost spillovers occur more frequently where neighboring regions experience increases in housing costs (Pijnenburg 2017). Spillover effects may also occur on smaller scales, with new developments positively affecting the housing costs of nearby housing units (Ooi and Le 2013; Wu and Deng 2024).
In the context of the current study, the supply-side literature suggests that rents in compact transit-rich built environments might be high, partly due to competition over a limited housing stock in these environments regionwide. While some research studied this relationship at the metropolitan and municipal levels (Gyourko, Mayer, and Sinai 2013), the effect that competition has on costs also occurs in smaller geographies (Murray 2021).
Methods
A Multilevel Approach for Grouped Metropolitan Areas
The paper adopts a multilevel regression approach to examine the relationships between metropolitan housing stock in compact transit-rich block-groups and block-group rent. Classic supply-demand dynamics suggest that rent in compact transit-rich block groups is expected to be lower in metropolitan areas with a larger share of housing units in such block groups regionwide, ceteris paribus. Evidence of an inverse relationship between the share of metropolitan housing units in compact transit-rich block groups and block-group rent would suggest some degree of unmet demand for compact transit-rich built environments.
Two characteristics of multilevel models make them appropriate for answering the research question. First, they allow estimating within-group (Level-1) outcomes (e.g., block-group rent) while controlling for variations across (Level-2) groups (e.g., metropolitan areas). Second, multilevel regressions allow for the estimation of cross-level interactions, i.e., an interaction term between Level-2 and Level-1 variables (Raudenbush and Bryk 2002). In the context of this study, three metropolitan housing stock measures (Level-2 variables) are interacted separately with six block-group types (Level-1 variable) to examine their joint relationship on block-group rent.
The twenty-six studied metropolitan areas were grouped into three clusters of 8–9 Level-2 groups using k-means cluster analysis, and a separate regression model was estimated for each cluster and metropolitan housing stock measure (nine regression models overall). This was done to ensure, as much as possible, that the factors explaining block-group rent are evaluated across relatively similar housing markets. Indeed, such small Level-2 sample sizes (i.e., ≤ 10) are typically considered problematic, particularly for producing unbiased standard errors of the Level-2 variances (Maas and Hox 2005). However, later studies have found that using restricted maximum likelihood (RML) estimation and applying a Kenward–Roger adjustment, an adjustment to the denominator degrees of freedom and covariance matrix, allow producing unbiased coefficients and standard errors even with ten or fewer Level-2 groups (Ferron et al. 2009; Baldwin and Fellingham 2013; Bell et al. 2014; McNeish and Stapleton 2016). Accordingly, all regression models were estimated using the Stata “mixed” command with restricted maximum likelihood and a Kenward–Roger adjustment.
The clustering was based on four characteristics: metropolitan median gross rent was used to capture the strength of the rental market; metropolitan rail VRM captures rail level service; share of metropolitan housing units in auto-oriented development was used to account for the dominance of single-family suburban housing; and the difference in rent between median gross rent in rail-oriented intensive block groups and metropolitan median gross rent was used to capture the rent premiums associated with housing in the most compact transit-rich block-group type.
The interclass correlation (ICC) from the unconditional random intercept model using all studied metropolitan areas is .283, suggesting that 28.3 percent of the variance in block-group median gross rent is explained by variations between metropolitan areas. This relatively high ICC value justifies controlling for unobserved variations across metropolitan areas through multilevel regression (Raudenbush and Bryk 2002). Grouping metropolitan areas into clusters resulted in considerably lower ICC values for the unconditional random intercept models by cluster: .167 for Cluster 1, .148 for Cluster 2, and .067 for Cluster 3. This means that between 6.7 percent and 16.7 percent of the variance in median gross rent across block groups within each cluster is explained by variations between the metropolitan areas in that cluster. The lower ICC values for the clusters suggest that the clustering reduced some group-level variance, resulting in the analysis of block groups from relatively similar markets. Nonetheless, the observed ICC values and observed variations in rent and theoretical considerations justify the multilevel regression approach (Raudenbush and Bryk 2002).
The characteristics of each metropolitan area on the clustering variables and the magnitude and direction of the relationships between the clustering variables varied by cluster (Figure 1; Table 3). This provides further evidence that the metropolitan areas grouped within each cluster behave as a separate market from those in the other clusters. The metropolitan areas in Cluster 1 are characterized by low median gross rent, low rail VRM (except Philadelphia and Minneapolis), and a moderate-high share of housing units in auto-oriented development. These metropolitan areas also show a negative moderate-large rent gap (except Pittsburgh), meaning rent in rail-oriented intensive development is lower than the metropolitan median gross rent. Moreover, Cluster 1 is characterized by a moderate positive correlation between metropolitan rail VRM and median gross rent (r = .46; Figure 1a) and a stronger negative correlation between the rent gap between rail-oriented intensive development and metropolitan median rent (r = −.53; Figure 1c). Cluster 1 is also characterized by a weak negative correlation between the share of auto-oriented housing units and median gross rent (r = −.19; Figure 1b) alongside a moderate positive correlation between the share of rail-oriented intensive housing units and median gross rent (r = .36; Figure 1d).
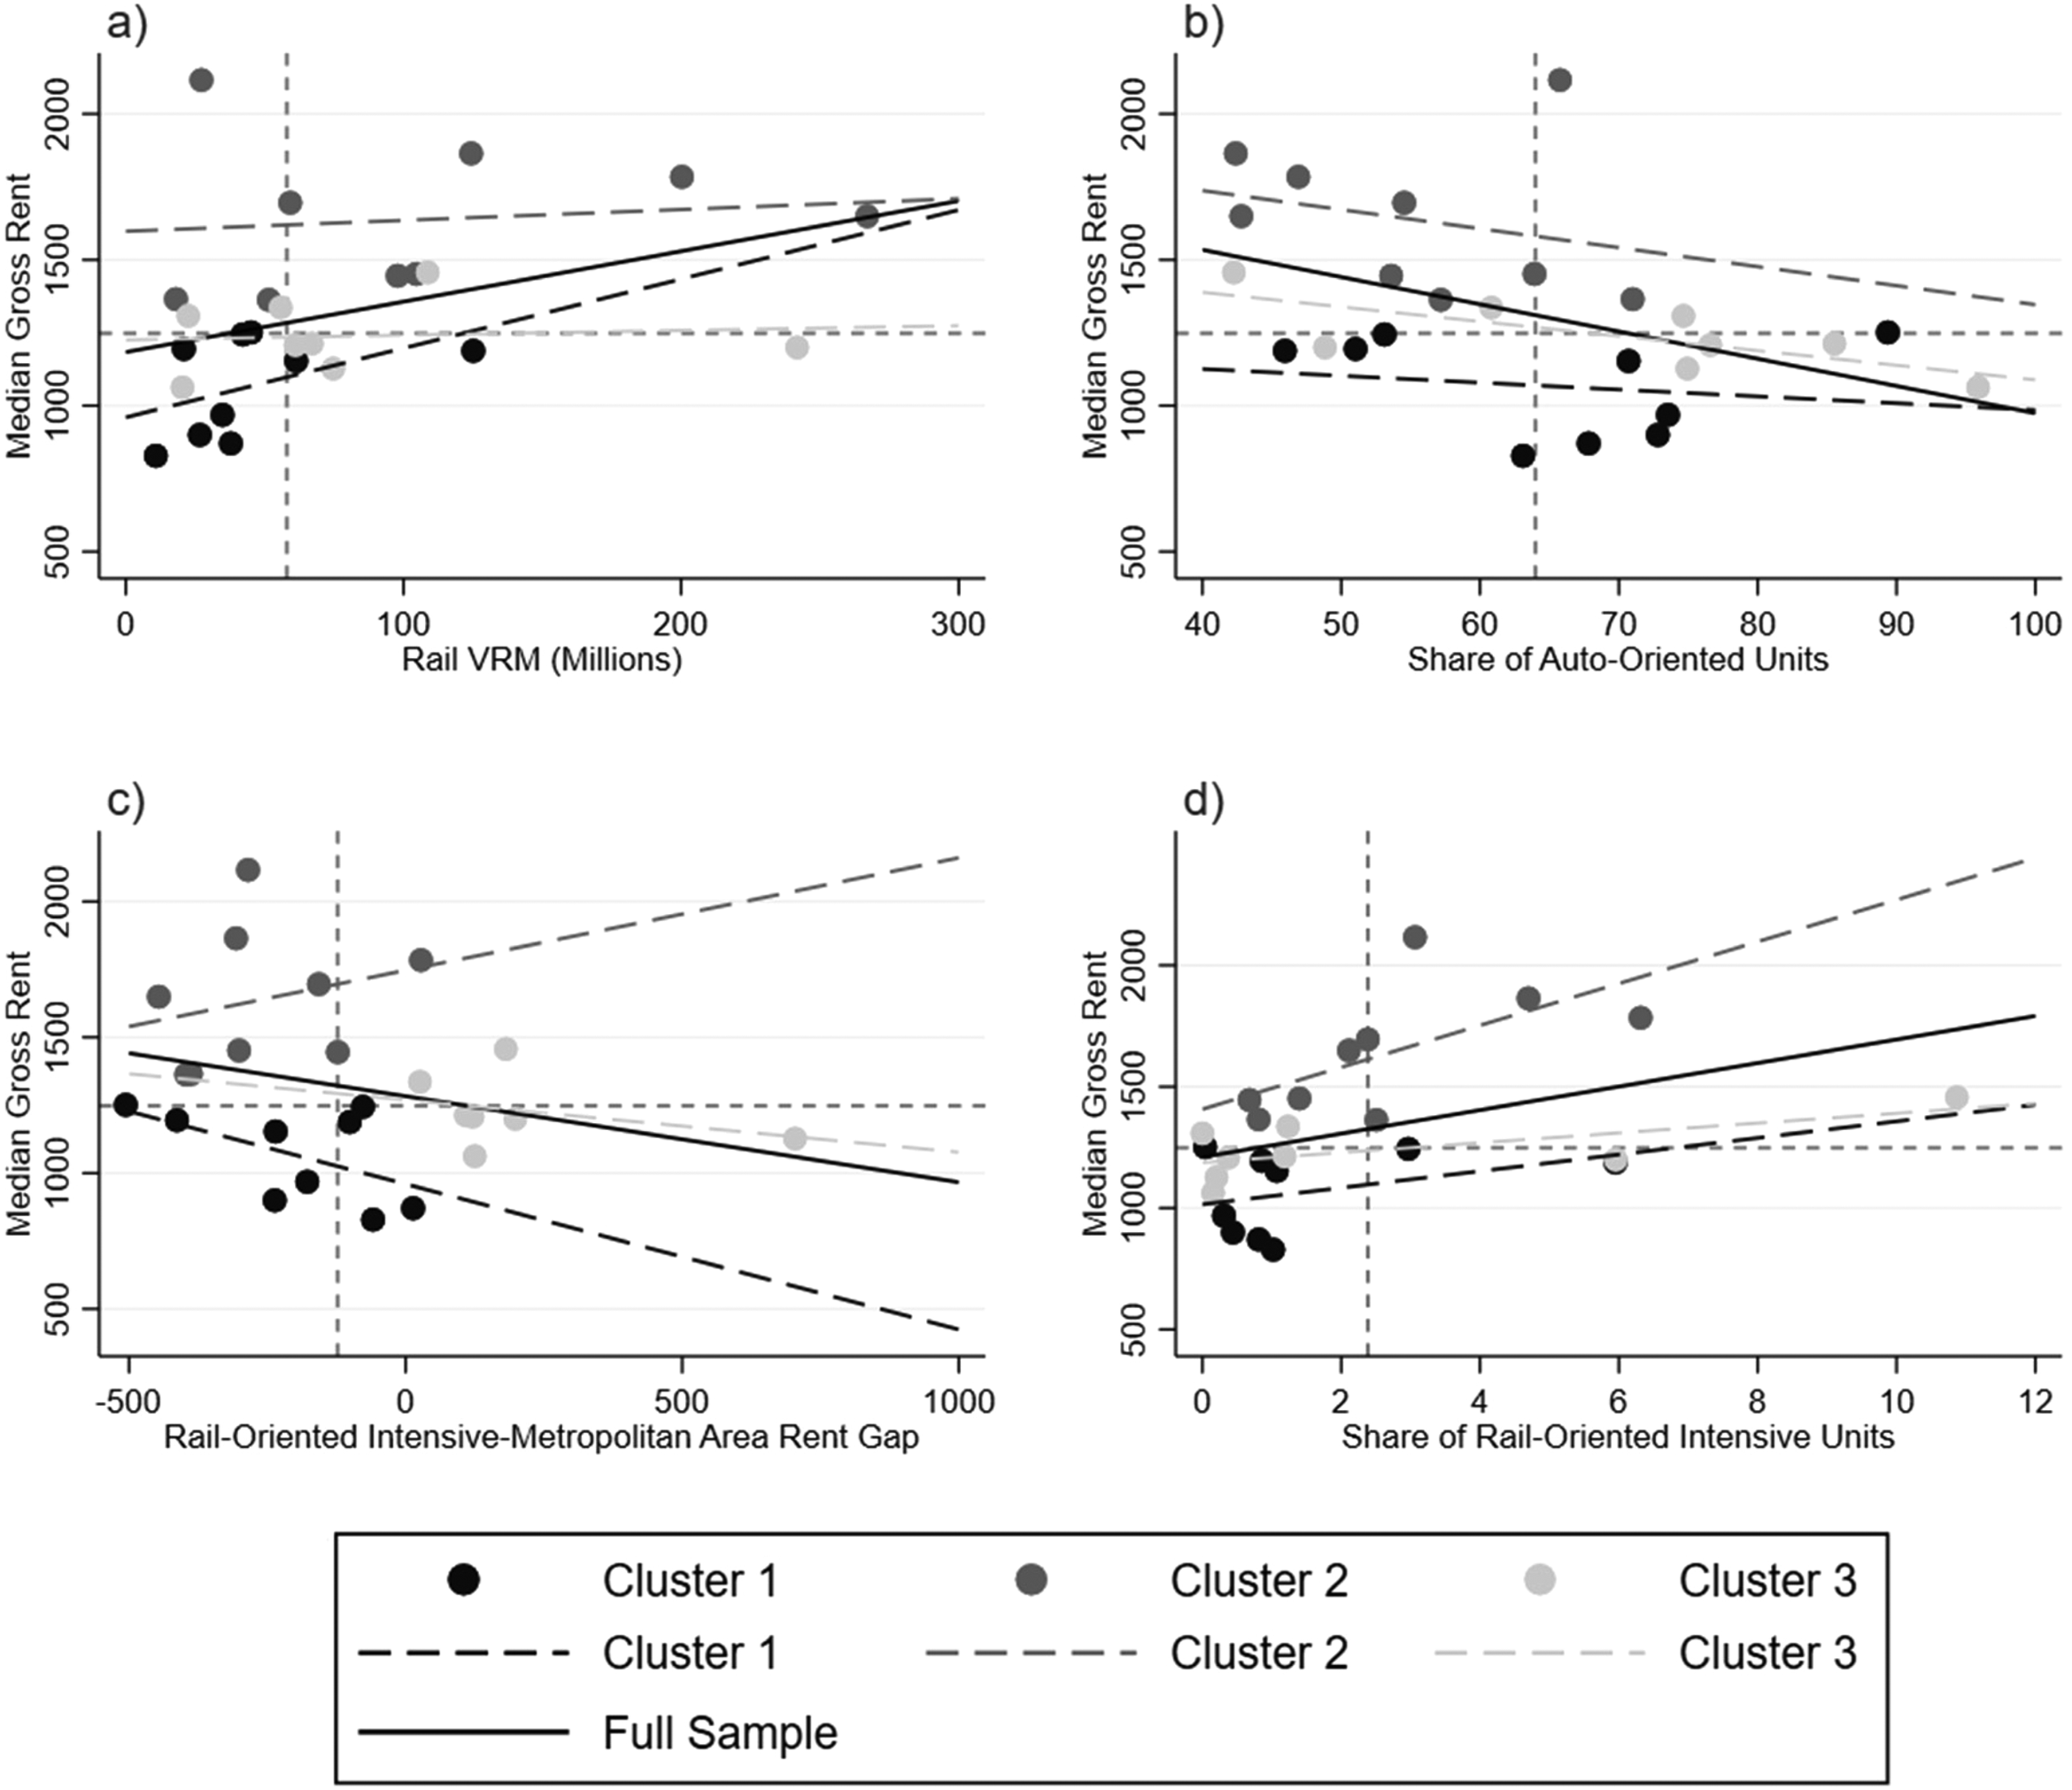
(a) Metropolitan median gross rent by metropolitan rail vehicle revenue miles (VRM); (b) metropolitan median gross rent by metropolitan share of auto-oriented housing units; (c) metropolitan median gross rent by metropolitan area-rail-oriented intensive rent gap; and (d) metropolitan median gross rent by metropolitan share of rail-oriented intensive housing units.
Cluster 2 includes metropolitan areas with high median gross rent and rail VRM (except for Sacramento and San Jose). Additionally, these metropolitan areas have a relatively low share of housing units in auto-oriented development alongside higher shares of housing units in the other block-group types, including rail-oriented intermediate and non-rail intensive development. These metropolitan areas also exhibit a large negative rent gap between rail-oriented intensive development and metropolitan median gross rent. Additionally, Cluster 2 is characterized by a weak positive correlation between metropolitan rail VRM and median gross rent (r = .12; Figure 1a) and a weak negative correlation between the share of auto-oriented housing units and median gross rent (r = −.26; Figure 1b). Cluster 2 also shows a weak positive correlation between the rent gap between rail-oriented intensive development and metropolitan median rent (r = .25; Figure 1c) alongside a strong positive correlation between the share of rail-oriented intensive housing units and median gross rent (r = .62; Figure 1d).
Finally, Cluster 3 includes metropolitan areas with moderate median gross rent, moderate-high rail VRM (except for Austin and Charlotte), and a relatively high share of housing units in auto-oriented development (except Boston and Chicago). In contrast to metropolitan areas in Clusters 1 and 2, the metropolitan areas in Cluster 3 are characterized by a positive rent gap, suggesting that housing in the most compact transit-rich development is valued more than housing in other block-group types. Additionally, Cluster 3 is characterized by a weak positive correlation between metropolitan rail VRM and median gross rent (r = .09; Figure 1a), a strong negative correlation between the share of auto-oriented housing units and median gross rent (r = −.73; Figure 1b). Cluster 3 also has a moderate-weak negative correlation between the rent gap between rail-oriented intensive development and metropolitan median rent (r = −.33; Figure 1c) alongside a strong positive correlation between the share of rail-oriented intensive housing units and median gross rent (r = .64; Figure 1d).
Multilevel random-intercept regressions with cross-level interactions were calculated for each cluster separately in Stata 17.0 using the “mixed” command with metropolitan area groupings to control for variations across metropolitan areas (Raudenbush and Bryk 2002). Random slopes models were explored but these attempts were not statistically significant and did not improve model fit.
Data and Variables
The analysis is conducted on data from 26 metropolitan areas in the United States that had intra-urban light, heavy, or commuter rail service in 2015. 2015 data were preferred over more recent periods to align with the transit accessibility and Walk Index data, which were only available for 2015. Renne et al. (2016) identified 39 U.S. regions with fixed-route transit. Of these, 28 had heavy, light, or commuter intra-urban rail systems during 2015, while the remainder relied on streetcars, monorail, or bus rapid transit (BRT). Metropolitan areas relying only on streetcars, monorail, or BRT systems were not included since these modes typically do not attract the same development as more extensive rail modes (Higgins and Kanaroglou 2016). Nashville, TN, was also excluded since its commuter rail stations are primarily suburban or rural without meaningful development around them. Austin, TX, is the only studied metropolitan area with only commuter rail service, while the other metropolitan areas may include commuter rail alongside other rail modes.
Sensitivity analyses led to the further exclusion of the New York metropolitan area from the final regressions since its inclusion considerably impacted the direction and magnitude of the results in a way that does not represent the remaining metropolitan areas. Similar sensitivity tests were conducted on other legacy-rail metropolitan areas (Boston, Chicago, Philadelphia, San Francisco, and Washington D.C.), metropolitan areas with a considerable variation in block-group types (i.e., Boston, Chicago, and Philadelphia), and the metropolitan areas with the largest share of auto-oriented block groups (i.e., Atlanta, Dallas, Houston, and Austin). These tests did not substantially affect the overall results. Hence, the final analyses are based on data from twenty-six metropolitan areas. The analyses are limited to the urbanized areas within each metropolitan area.
Data were collected from various sources at the block-group and metropolitan levels (Table 1). The dependent variable in the analysis is monthly median gross rent at the block-group level. Indeed, a household's housing costs may include mortgage payments or rent, home insurance, property taxes, utilities, or some combination of these factors. Nonetheless, the analysis focuses on median gross rent because of its relevance for understanding the situation of lower-income groups and the subsequent use of this dependent variable in the affordability literature. Lower-income households are more likely to be renters than homeowners and suffer more from housing affordability problems (Joint Center for Housing Studies 2021) and housing instability issues (Kang 2021). Hence, low-income renters are the main target population of policy measures to alleviate housing cost pressures.
Variable Description and Source.
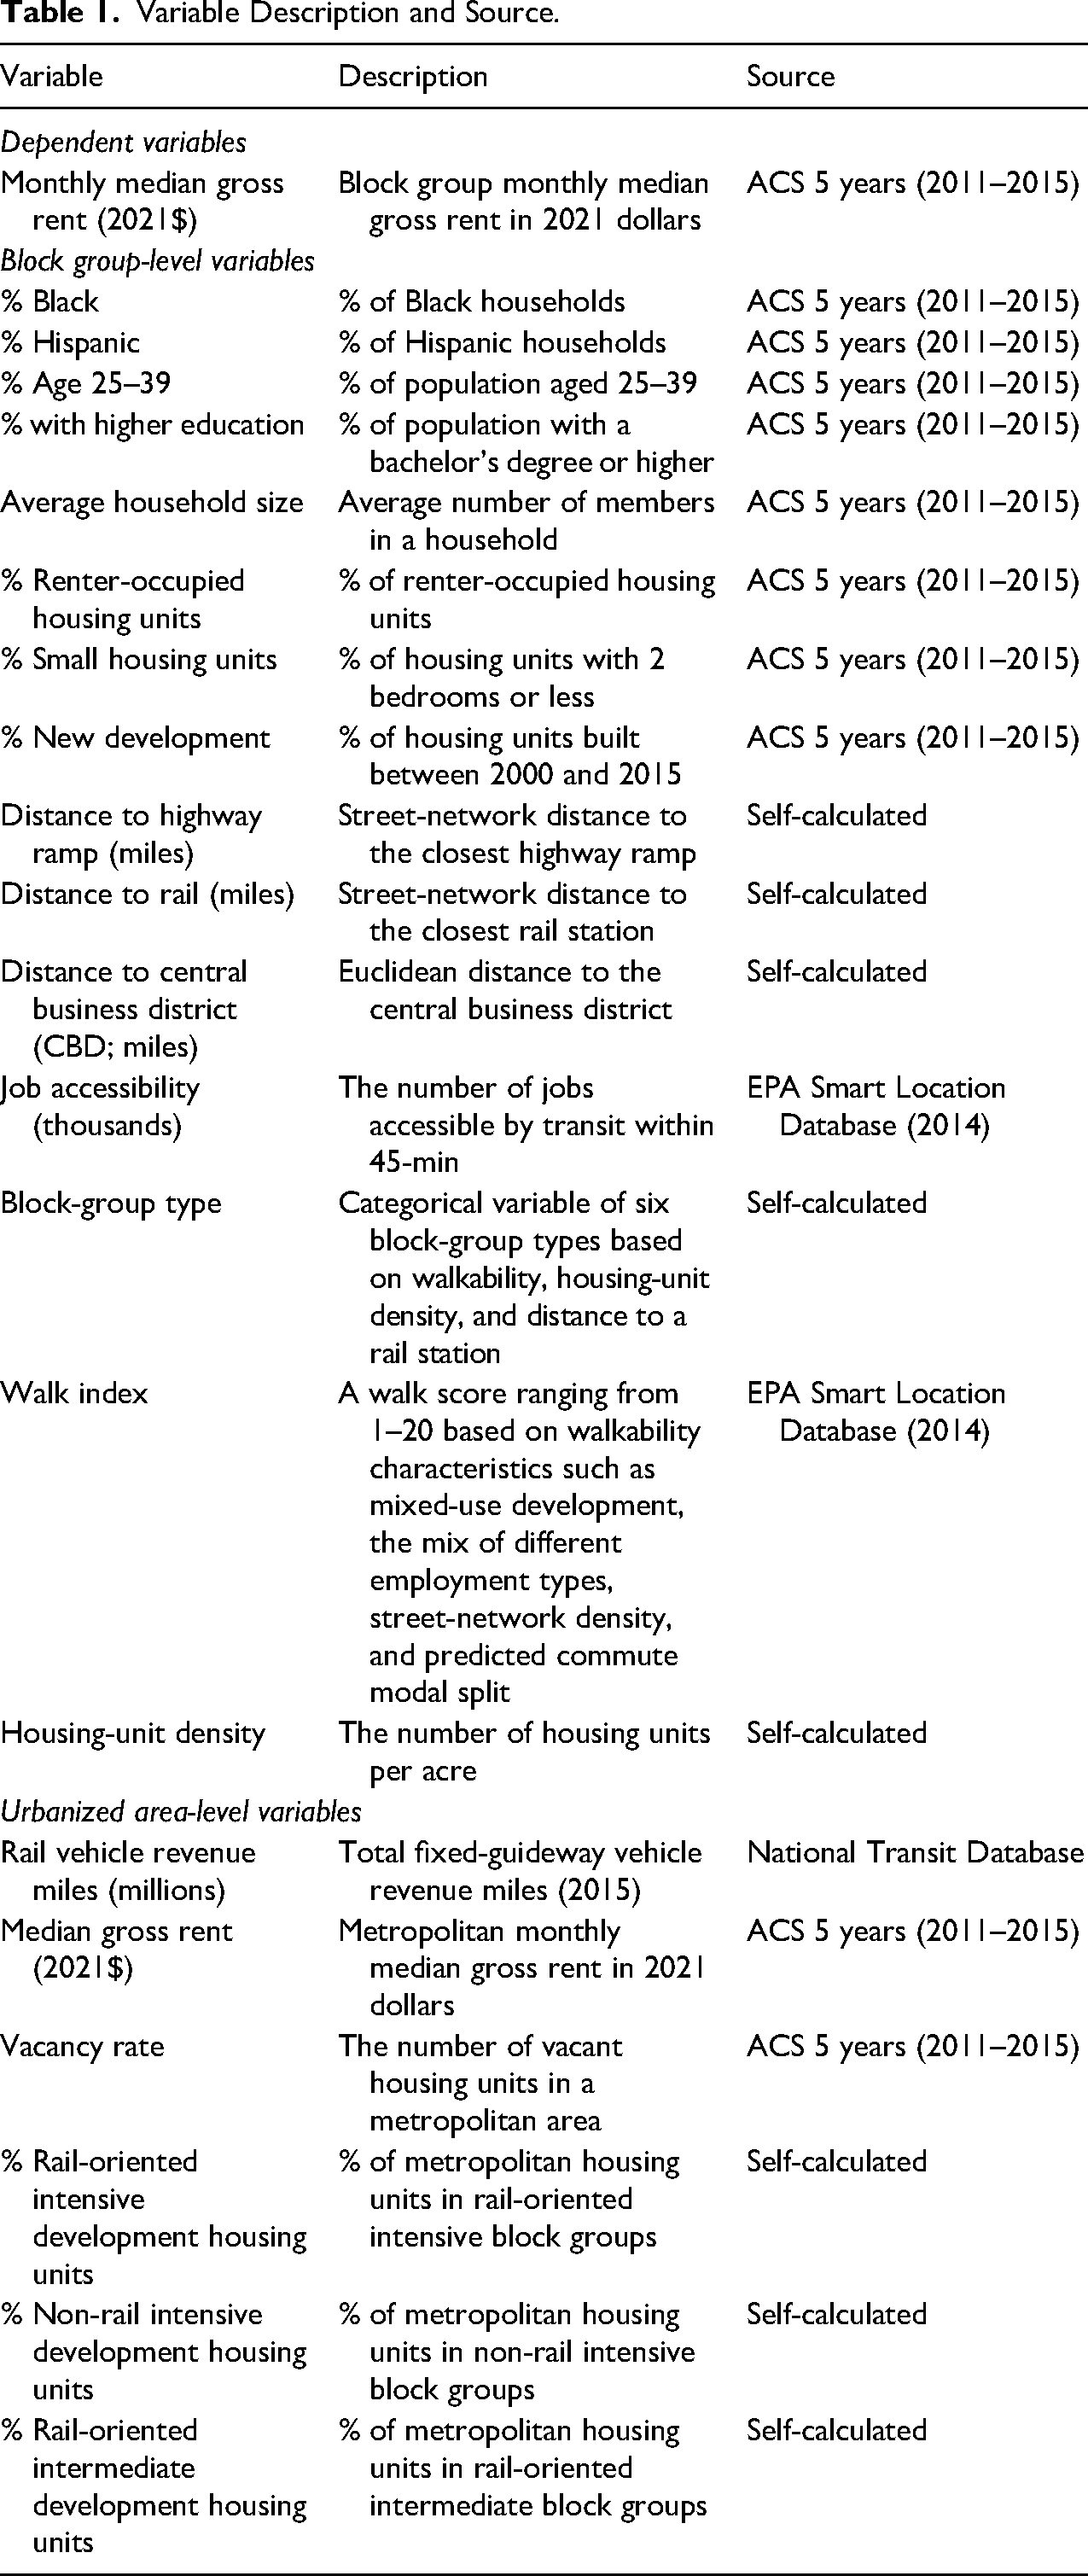
Data on block-group housing characteristics, including rent and socio-demographic characteristics, were obtained from the American Community Survey 2011–2015 5-year estimates. These data capture the end of the Great Recession and the beginning of the economic recovery in subsequent years, including in housing markets (Joint Center for Housing Studies 2015). The share of small housing units in a block group controls for lower rents expected for small units, while the share of new housing units controls for the higher rents expected for new units. Metropolitan median gross rent controls for variations across rental markets. All cost data were updated to 2021$ using the Bureau of Statistics’ CPI calculator.
Information on rail station locations was obtained from state, metropolitan, and municipal sources and General Transit Feed Specification (GTFS) from TransitFeeds (http://transitfeeds.com/) when other sources were unavailable. Distances to the nearest rail station and highway ramp were calculated, using GIS, as the street network distance from the centroid of each block group based on road data obtained from the Census Bureau TIGER/Line Shapefiles portal.
Data for transit job accessibility and block-group walkability were obtained from the Environmental Protection Agency's (EPA) Smart Location Mapping portal. Despite its limitations (Ganning 2017), the Smart Location data were preferred over alternative sources as they are publicly available, are provided at the block group level, and are consistent across metropolitan areas. Transit accessibility measures the number of jobs accessible within 45 min using transit. The Walk Index ranges between 1 and 20, where 20 represents block groups with maximum walkability characteristics such as mixed-use development, the mix of different employment types, street-network density, and predicted commute modal split. Rail vehicle revenue miles (VRM) in 2015, a measure of metropolitan-wide rail service, was obtained from the National Transit Database.
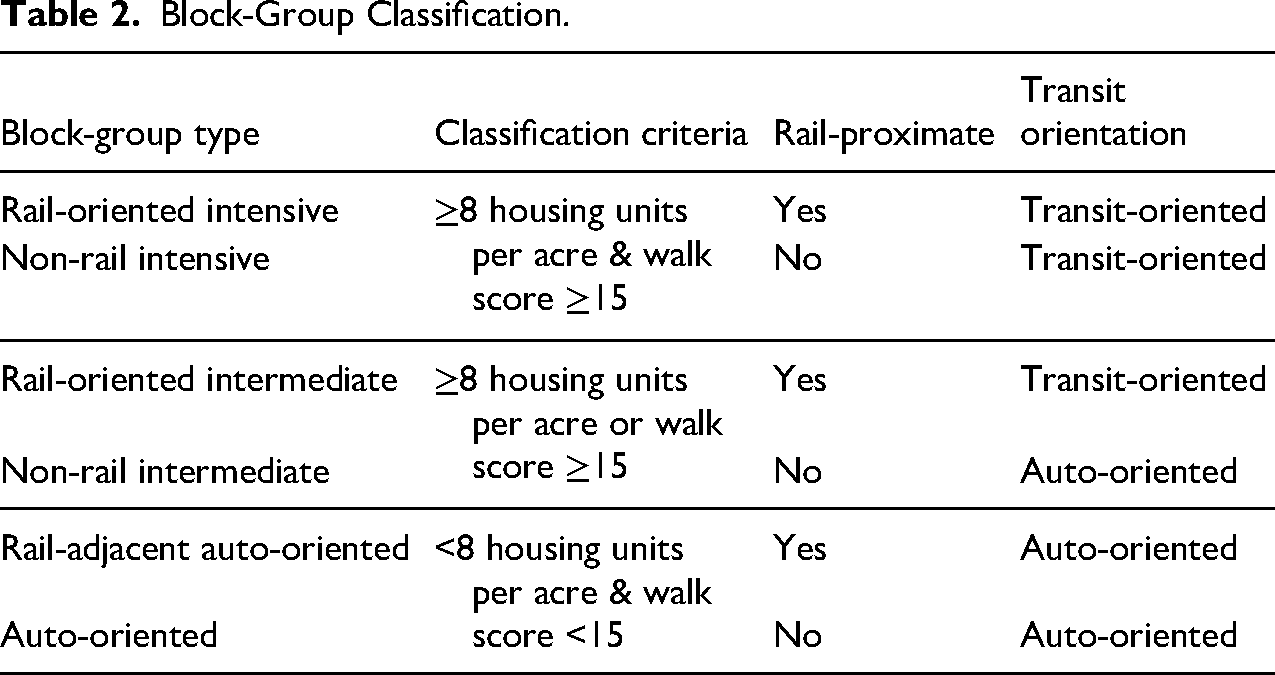
To examine how rent varies by block groups with different environments and transit characteristics, block groups were classified into six types based on their combination of housing-unit density, walkability, and proximity to a rail station (Table 2; Renne et al. 2016; Singer 2021). Following Renne et al. (2016), the cutoff for high-density block groups was eight or more housing units per acre, and the cutoff for high walkability was a Walk Index of 15 or higher (maximum of 20). Block groups within a 750-m street network distance of a rail station were considered within walking distance of a station. A 200-m buffer complemented this to capture block groups near a rail station that were not identified by the street network criterion, perhaps due to the shape of the block group or the roads in the area.
Block-Group Classification.
Metropolitan Summary Statistics, by Cluster.
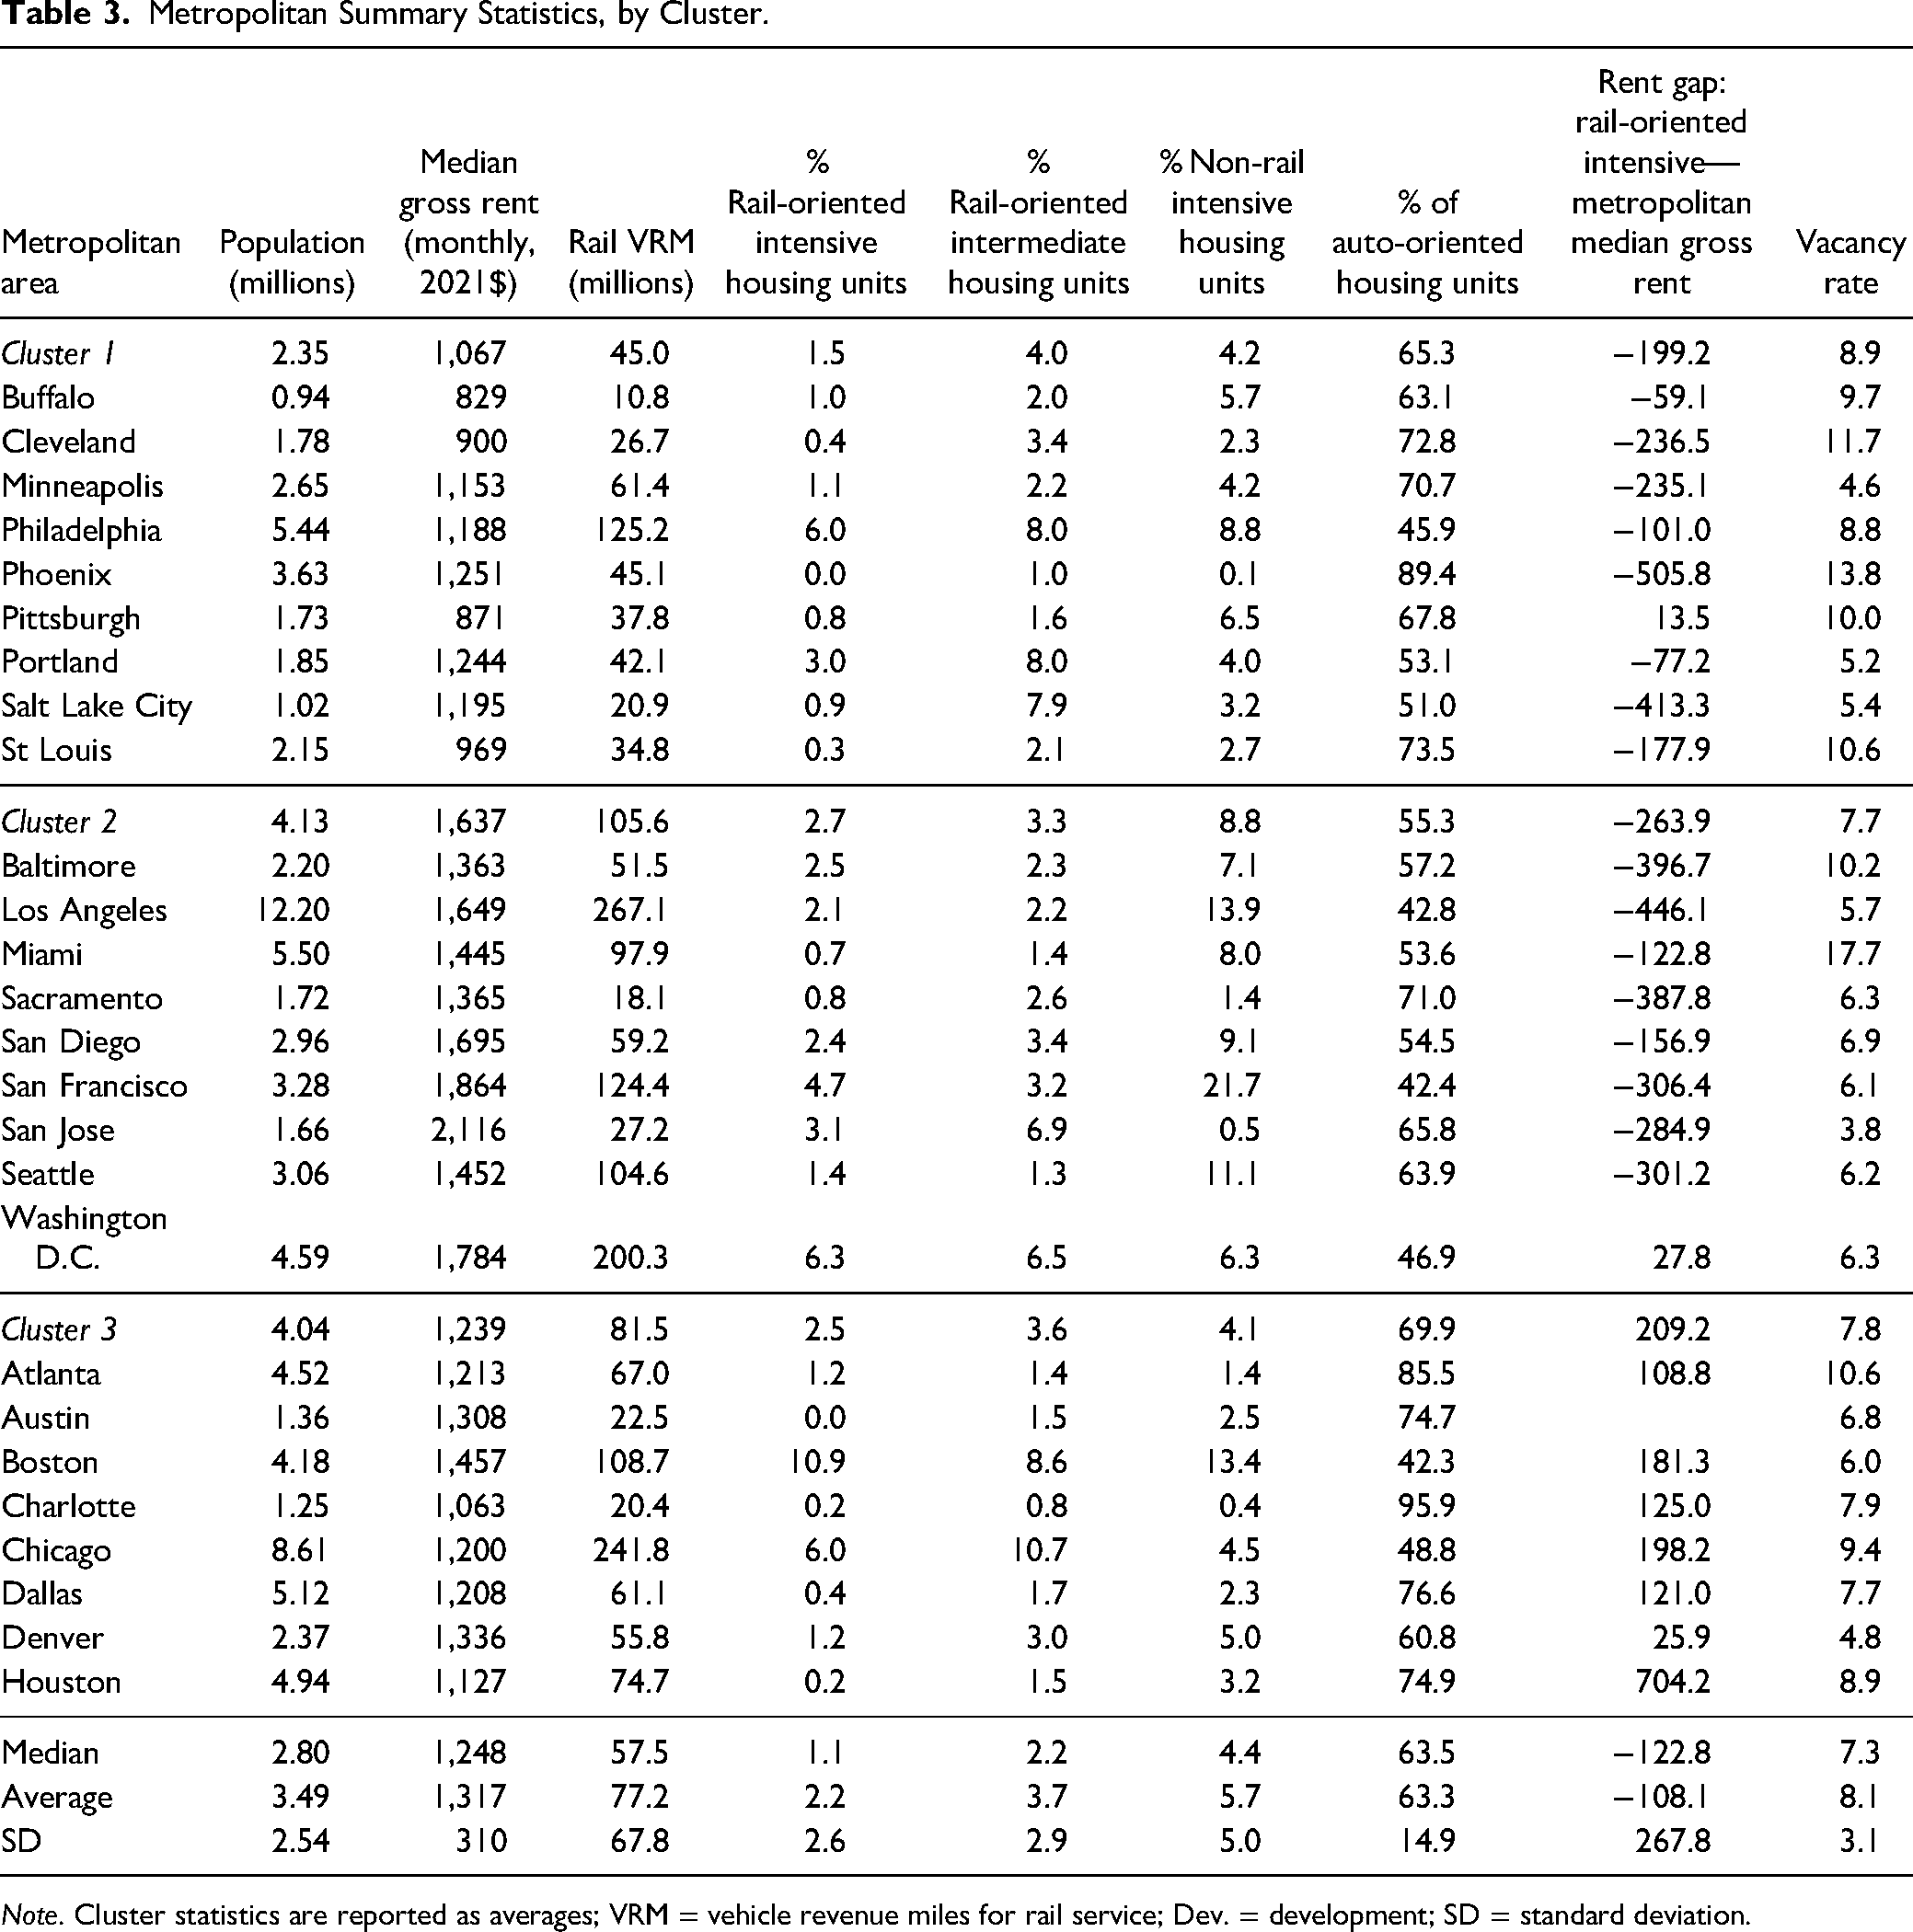
Note. Cluster statistics are reported as averages; VRM = vehicle revenue miles for rail service; Dev. = development; SD = standard deviation.
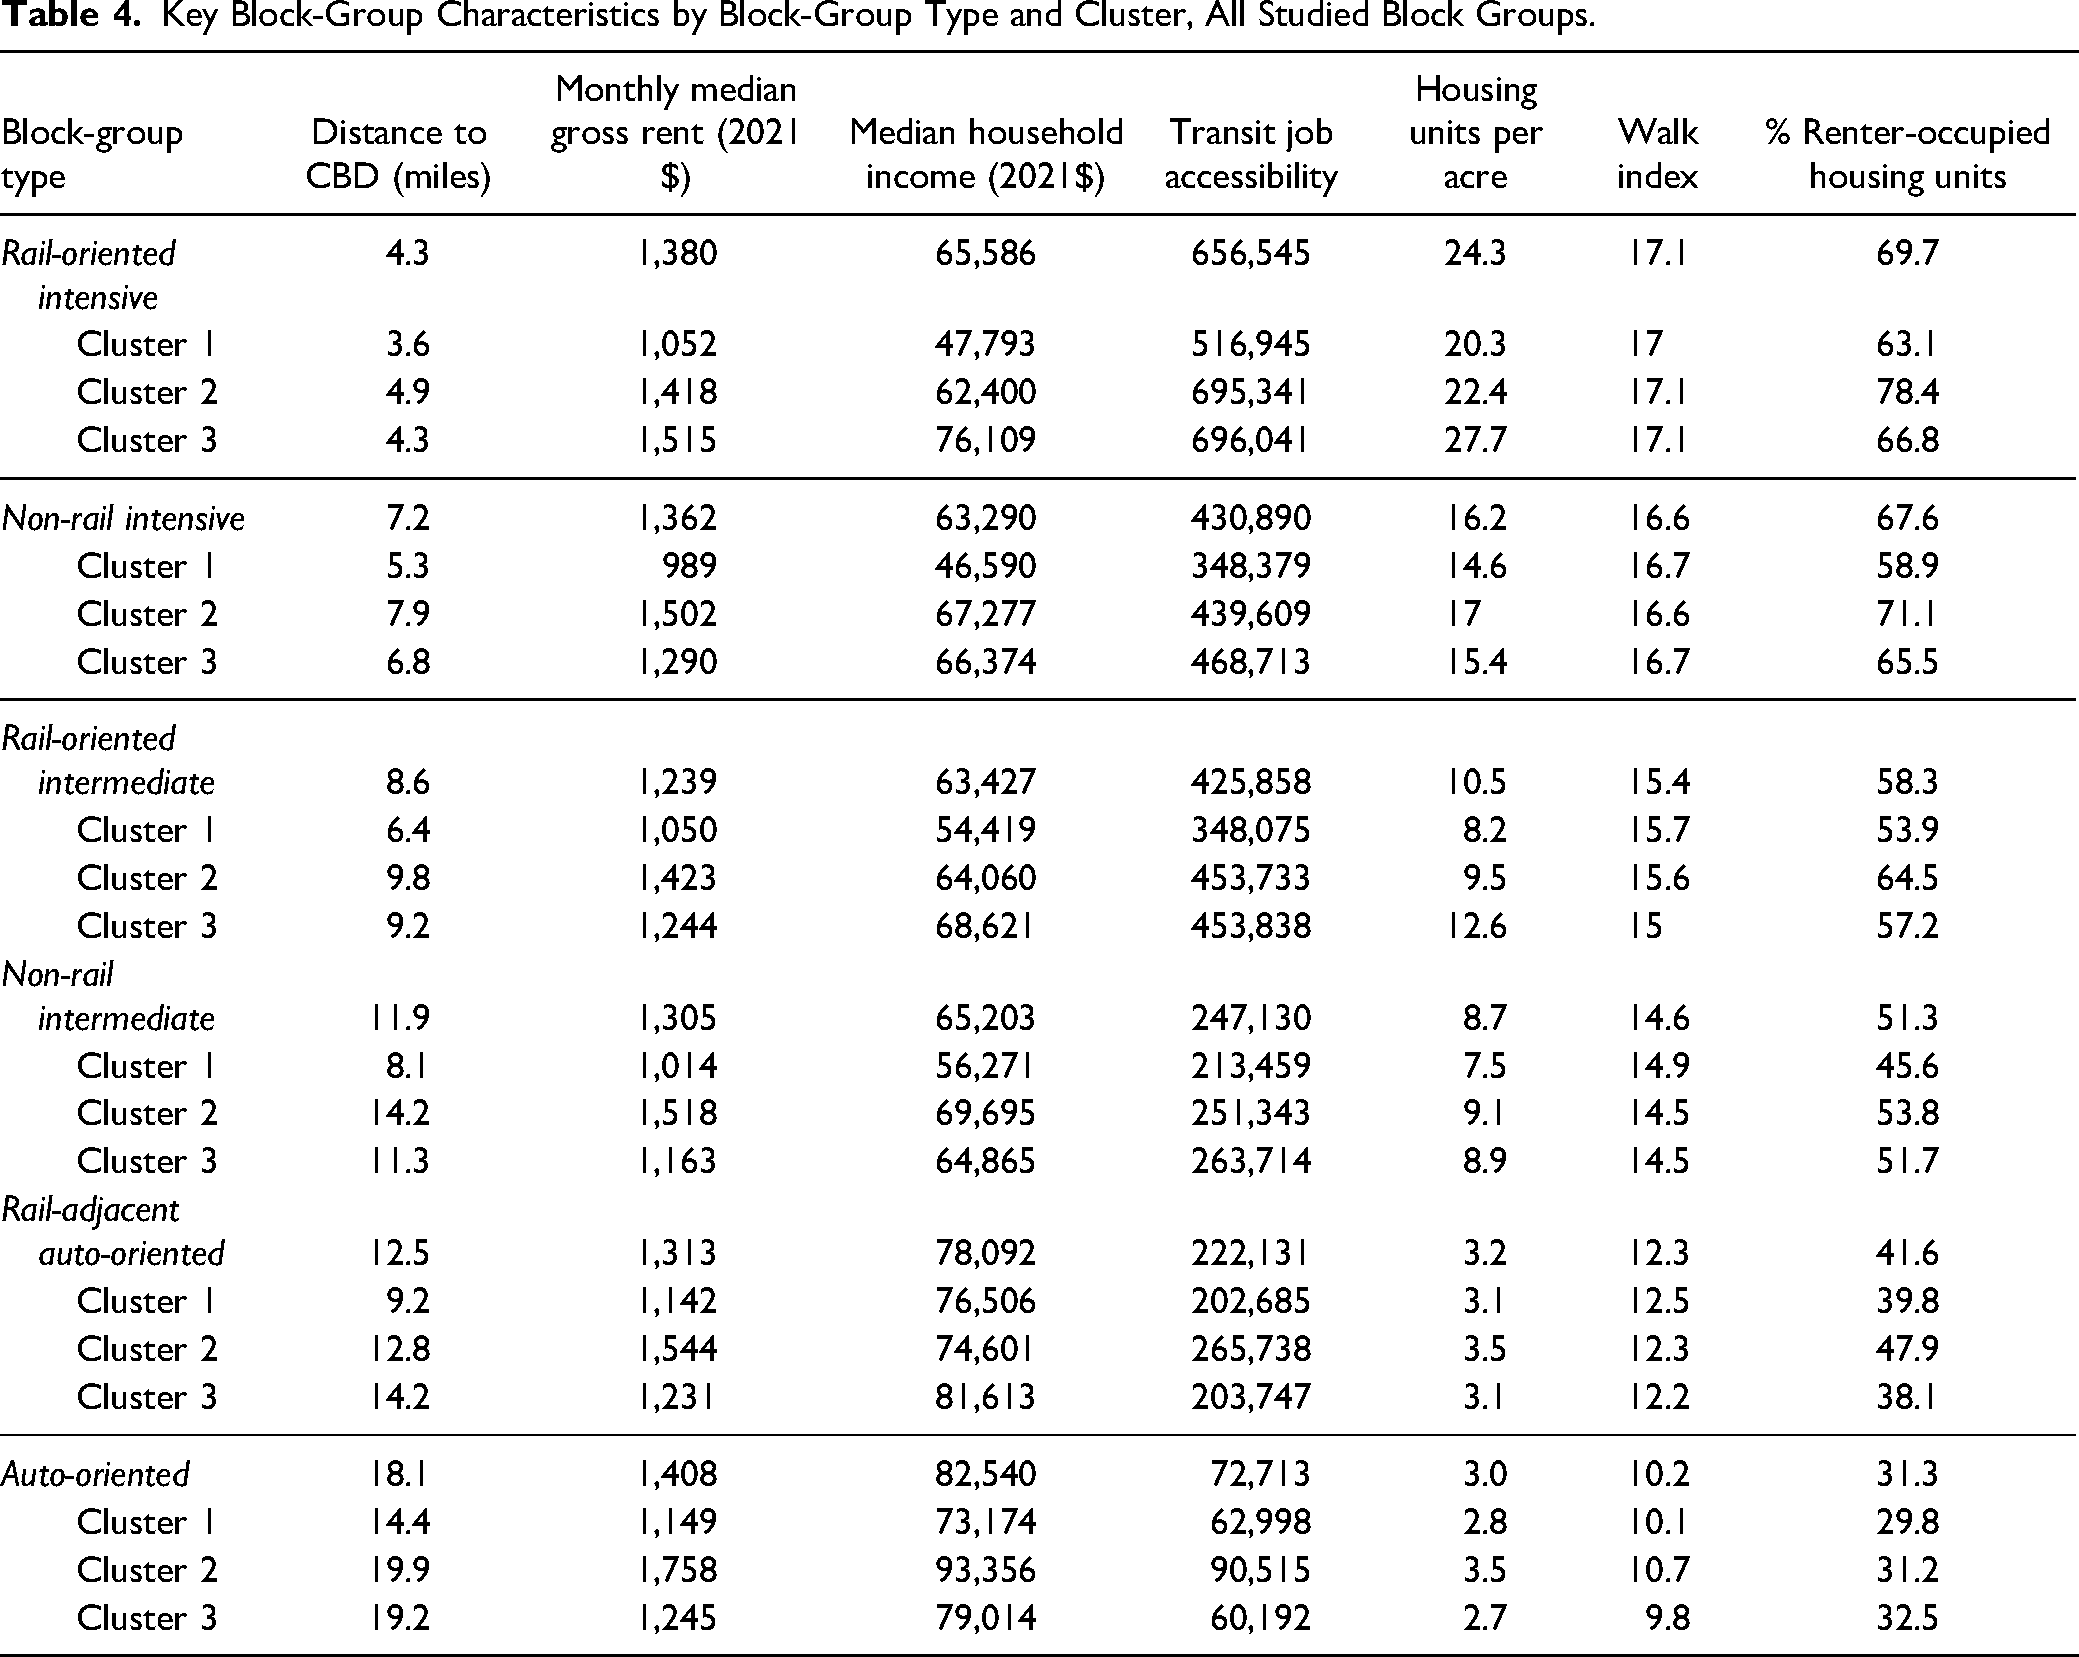
The classification produced four types of transit-oriented block groups: rail-oriented intensive development, non-rail intensive development, rail-oriented intermediate development, and rail-adjacent auto-oriented development. However, only the first three types are considered compact transit-rich, i.e., have relatively high densities and transit accessibility (Table 4). Accordingly, the analyses focus separately on the share of metropolitan housing units in the three most compact transit-rich block-group types to examine the interactions between metropolitan housing stock in compact transit-rich block groups and block-group rent.
Key Block-Group Characteristics by Block-Group Type and Cluster, All Studied Block Groups.
Results
Characterizing Clusters of Metropolitan Areas
Low-density auto-oriented block groups dominate U.S. metropolitan areas (Figure 2; Table 3). Auto-oriented development accounts, on average, for sixty-three percent of housing units in the studied metropolitan areas and more than fifty percent in twenty metropolitan areas. The greatest diversity of housing units among block group types is found in East Coast and Midwest metropolitan areas like New York, Boston, Philadelphia, Washington D.C., and Chicago. These metropolitan areas, which have among the oldest and most expansive rail systems in the United States, have historically developed around transit service. Other metropolitan areas with relatively expansive rail systems, like San Francisco, Los Angeles, and Portland, also have higher shares of housing units in non-rail intensive development and rail-oriented intermediate development. In contrast, auto-oriented metropolitan areas are dominated by low-density single-family housing. Development around rail stations in these areas tends to be rail-oriented intermediate development with only low shares of rail-oriented intensive development.
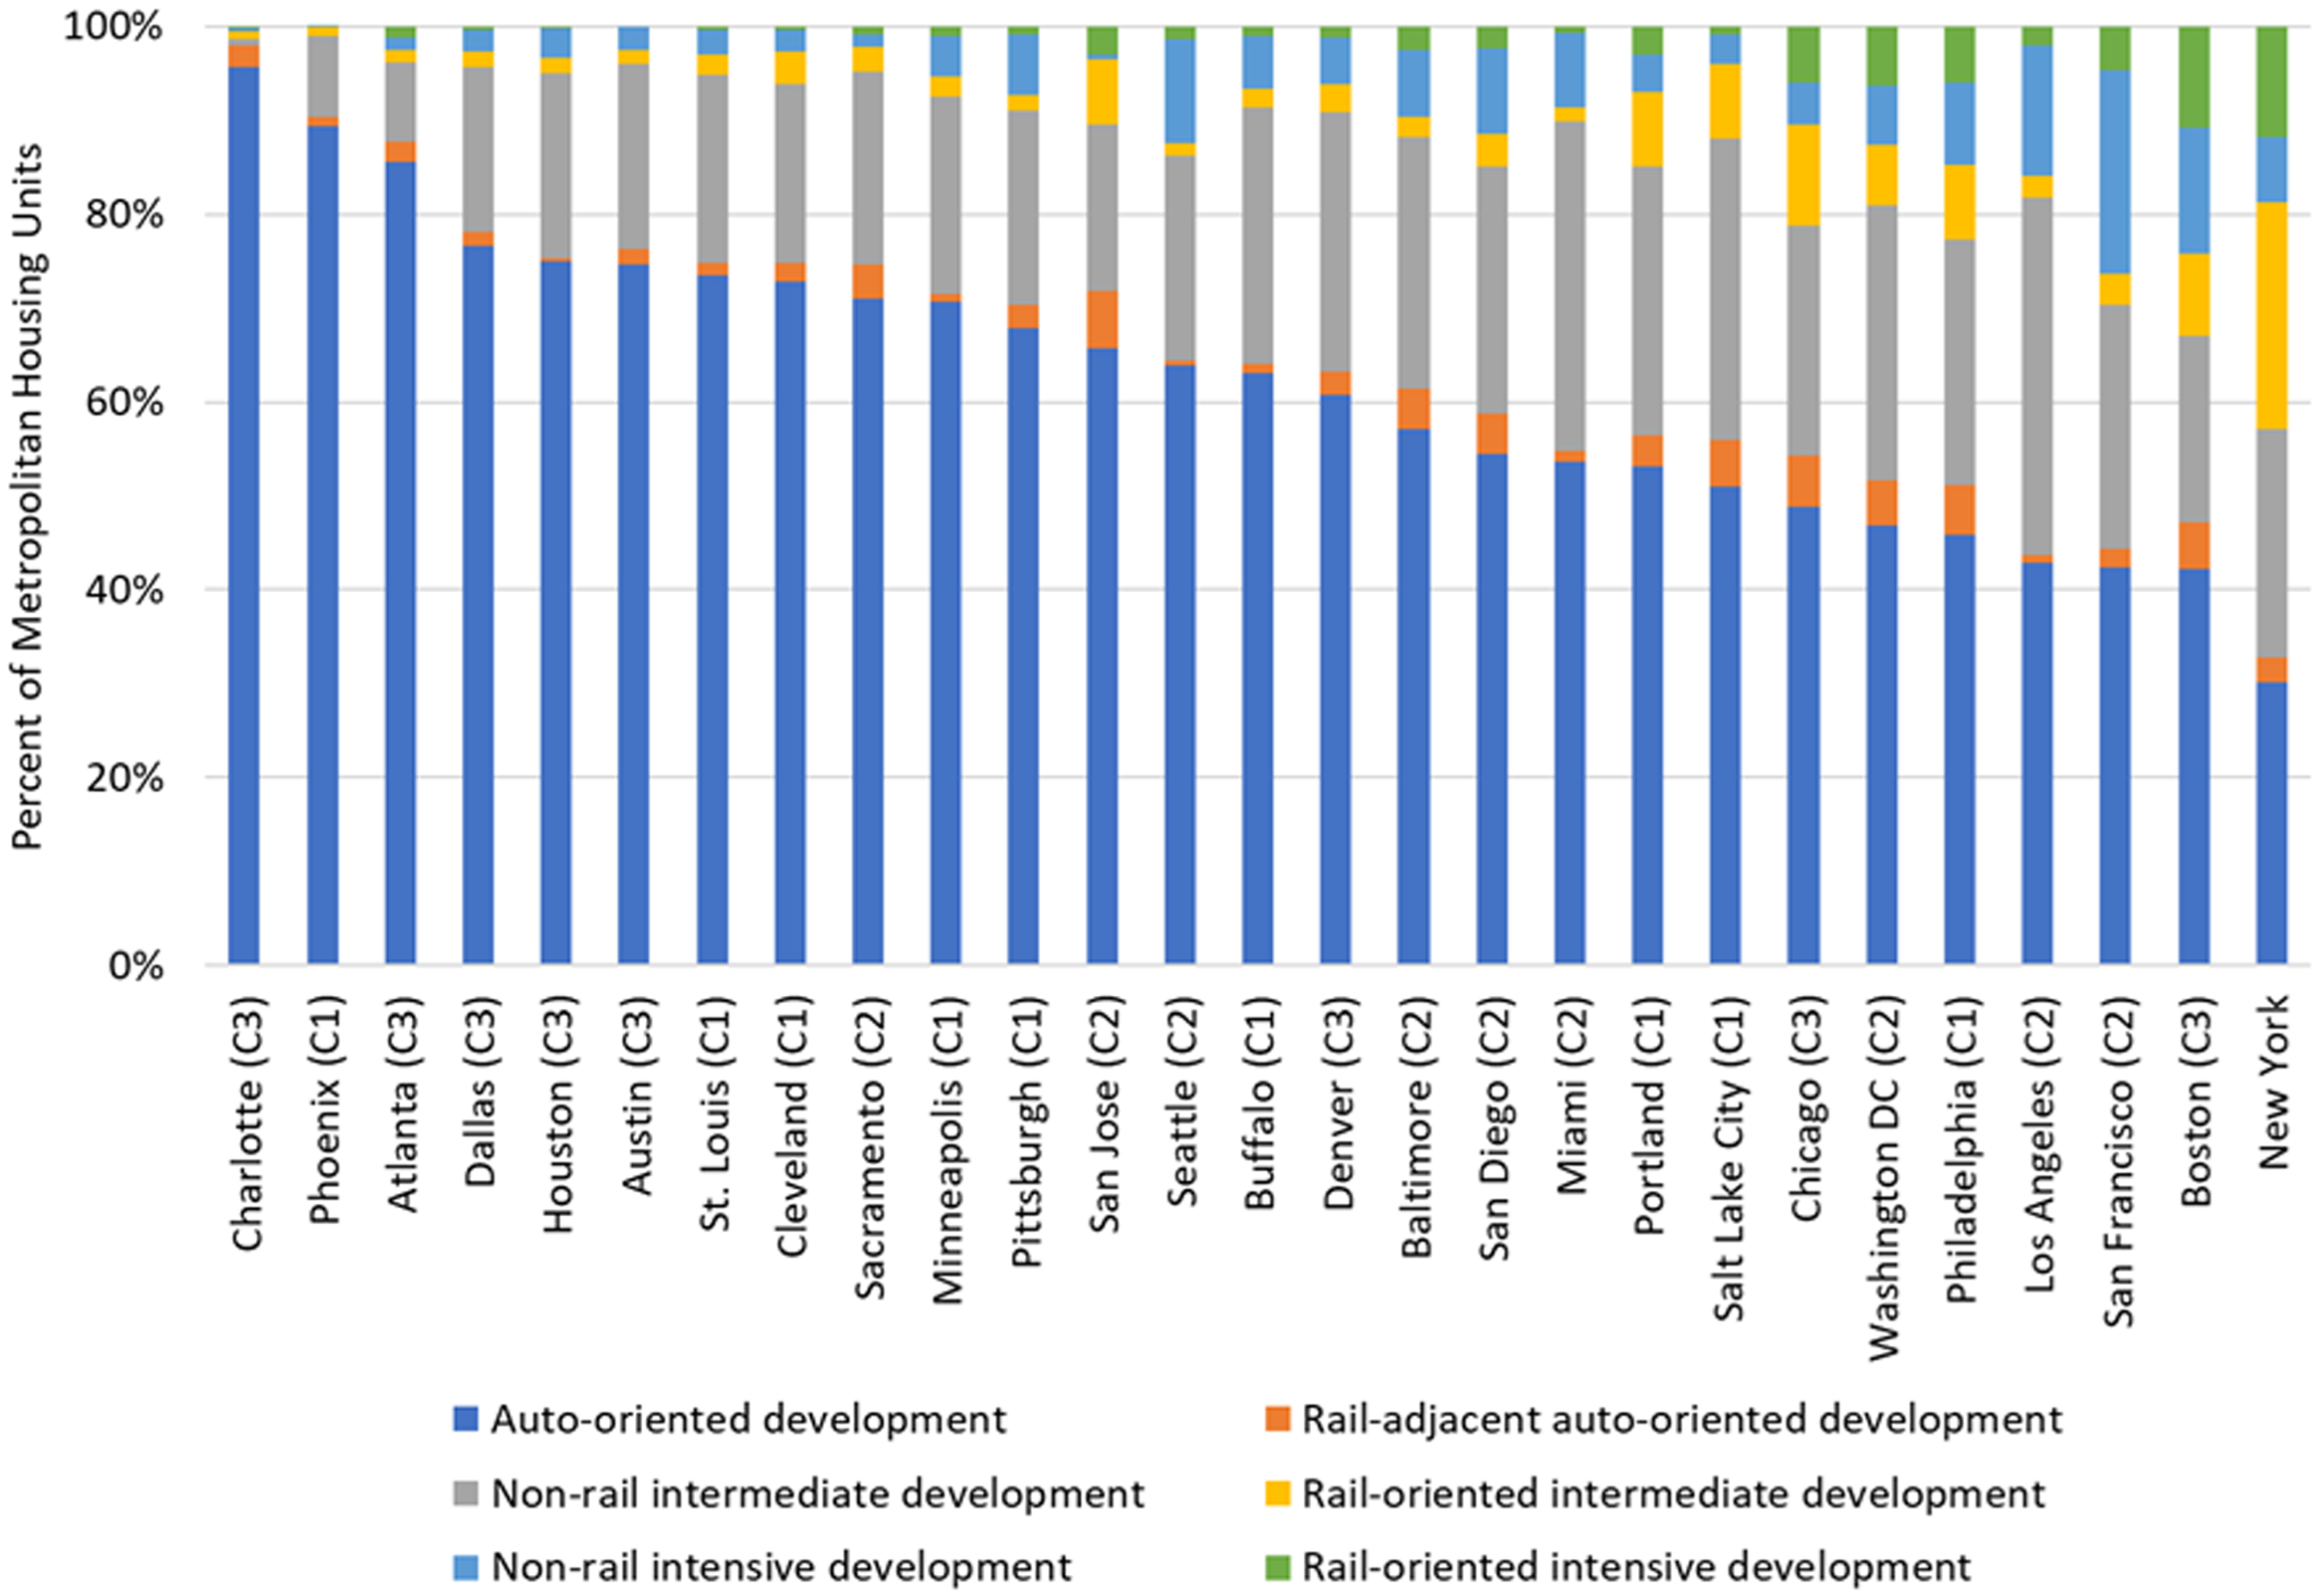
Share of metropolitan housing units by block-group type—all studied metropolitan areas.
The metropolitan areas in Cluster 1 are characterized by low rent and rail VRM (except Philadelphia and Minneapolis), a negative moderate-large rent gap (except Pittsburgh), and a moderate-high share of housing units in auto-oriented development. These metropolitan areas include a relatively low share of housing units in rail-oriented intensive development (exception for Philadelphia) alongside low-moderate shares of housing units in rail-oriented intermediate and non-rail intensive development. Finally, vacancy rates in these metropolitan areas are mostly above average.
Cluster 2 includes metropolitan areas with high rent and rail VRM (except for Sacramento and San Jose) alongside a relatively low share of housing units in auto-oriented development and a large negative rent gap. These metropolitan areas include relatively low shares of housing units in rail-oriented intensive and rail-oriented intermediate development (exception for Washington D.C.) alongside moderate-high shares of housing units in non-rail intensive development. Finally, vacancy rates in these metropolitan areas are mostly below average.
Cluster 3 includes metropolitan areas with moderate rent, moderate-high rail VRM (except for Austin and Charlotte), a relatively high share of housing units in auto-oriented development (except Boston and Chicago), and a positive rent gap. These metropolitan areas include relatively low shares of housing units in rail-oriented intensive, low-moderate shares of housing units in rail-oriented intermediate, and non-rail intensive development (except for Boston and Chicago). Finally, vacancy rates in these metropolitan areas are mainly around the average.
Characterizing Block-Group Types
Summarizing key built-environment and sociodemographic characteristics highlights several differences across the six block-group types alongside similarities across clusters (Table 4). Within each cluster, the three most compact transit-rich block-group types are rail-oriented intensive, non-rail intensive, and rail-oriented intermediate development. These block-group types are located closer to the CBD and have high transit job accessibility, housing-unit densities, and walk scores. In all three clusters, housing density and walkability are highest in rail-oriented intensive development, followed by non-rail intensive and rail-oriented intermediate development. Transit job accessibility is also highest in rail-oriented intensive development but is relatively similar between non-rail intensive and rail-oriented intermediate development. The high levels of transit accessibility, housing density, and walk scores in non-rail intensive developments suggest that compact transit-rich built environments are not limited to areas around rail stations.
The socio-demographic characteristics of the block-group population also vary across the six block-group types, especially between compact transit-rich and auto-oriented development. In Clusters 1 and 2, block-group rent and income are highest in the suburban auto-oriented and rail-adjacent auto-oriented types and lowest in rail-oriented and non-rail intensive block groups. While household income in Cluster 3 shows a similar trend across block-group types, rent is highest in rail-oriented intensive development and lowest in non-rail intermediate development. Finally, the highest shares of renter-occupied housing units within each cluster are found in rail-oriented and non-rail intensive development while the lowest shares are in the suburban auto-oriented and rail-adjacent auto-oriented types. The differences between compact transit-rich and auto-oriented development suggest they represent somewhat separate housing markets.
Metropolitan Housing Stock and Block-Group Rent
This section tests the main argument advanced in the paper, that housing in compact transit-rich block groups is expensive, in part due to the scarcity of units in similar block groups regionwide (Murray 2021). The analysis focuses on the metropolitan housing stock in each of the three most compact transit-rich block-group types (Rail-Oriented Intensive, None-Rail Intensive, and Rail-Oriented Intermediate) and its joint relationship with block-group type on block-group rent. This relationship is modeled separately for each cluster using an interaction term between the metropolitan housing stock measure and the six block-group types (overall, nine regression models; Table 5).
Metropolitan Housing Stock on Block Group Rent; Dependent Variable: Block Group Monthly Median Gross Rent (2021$).
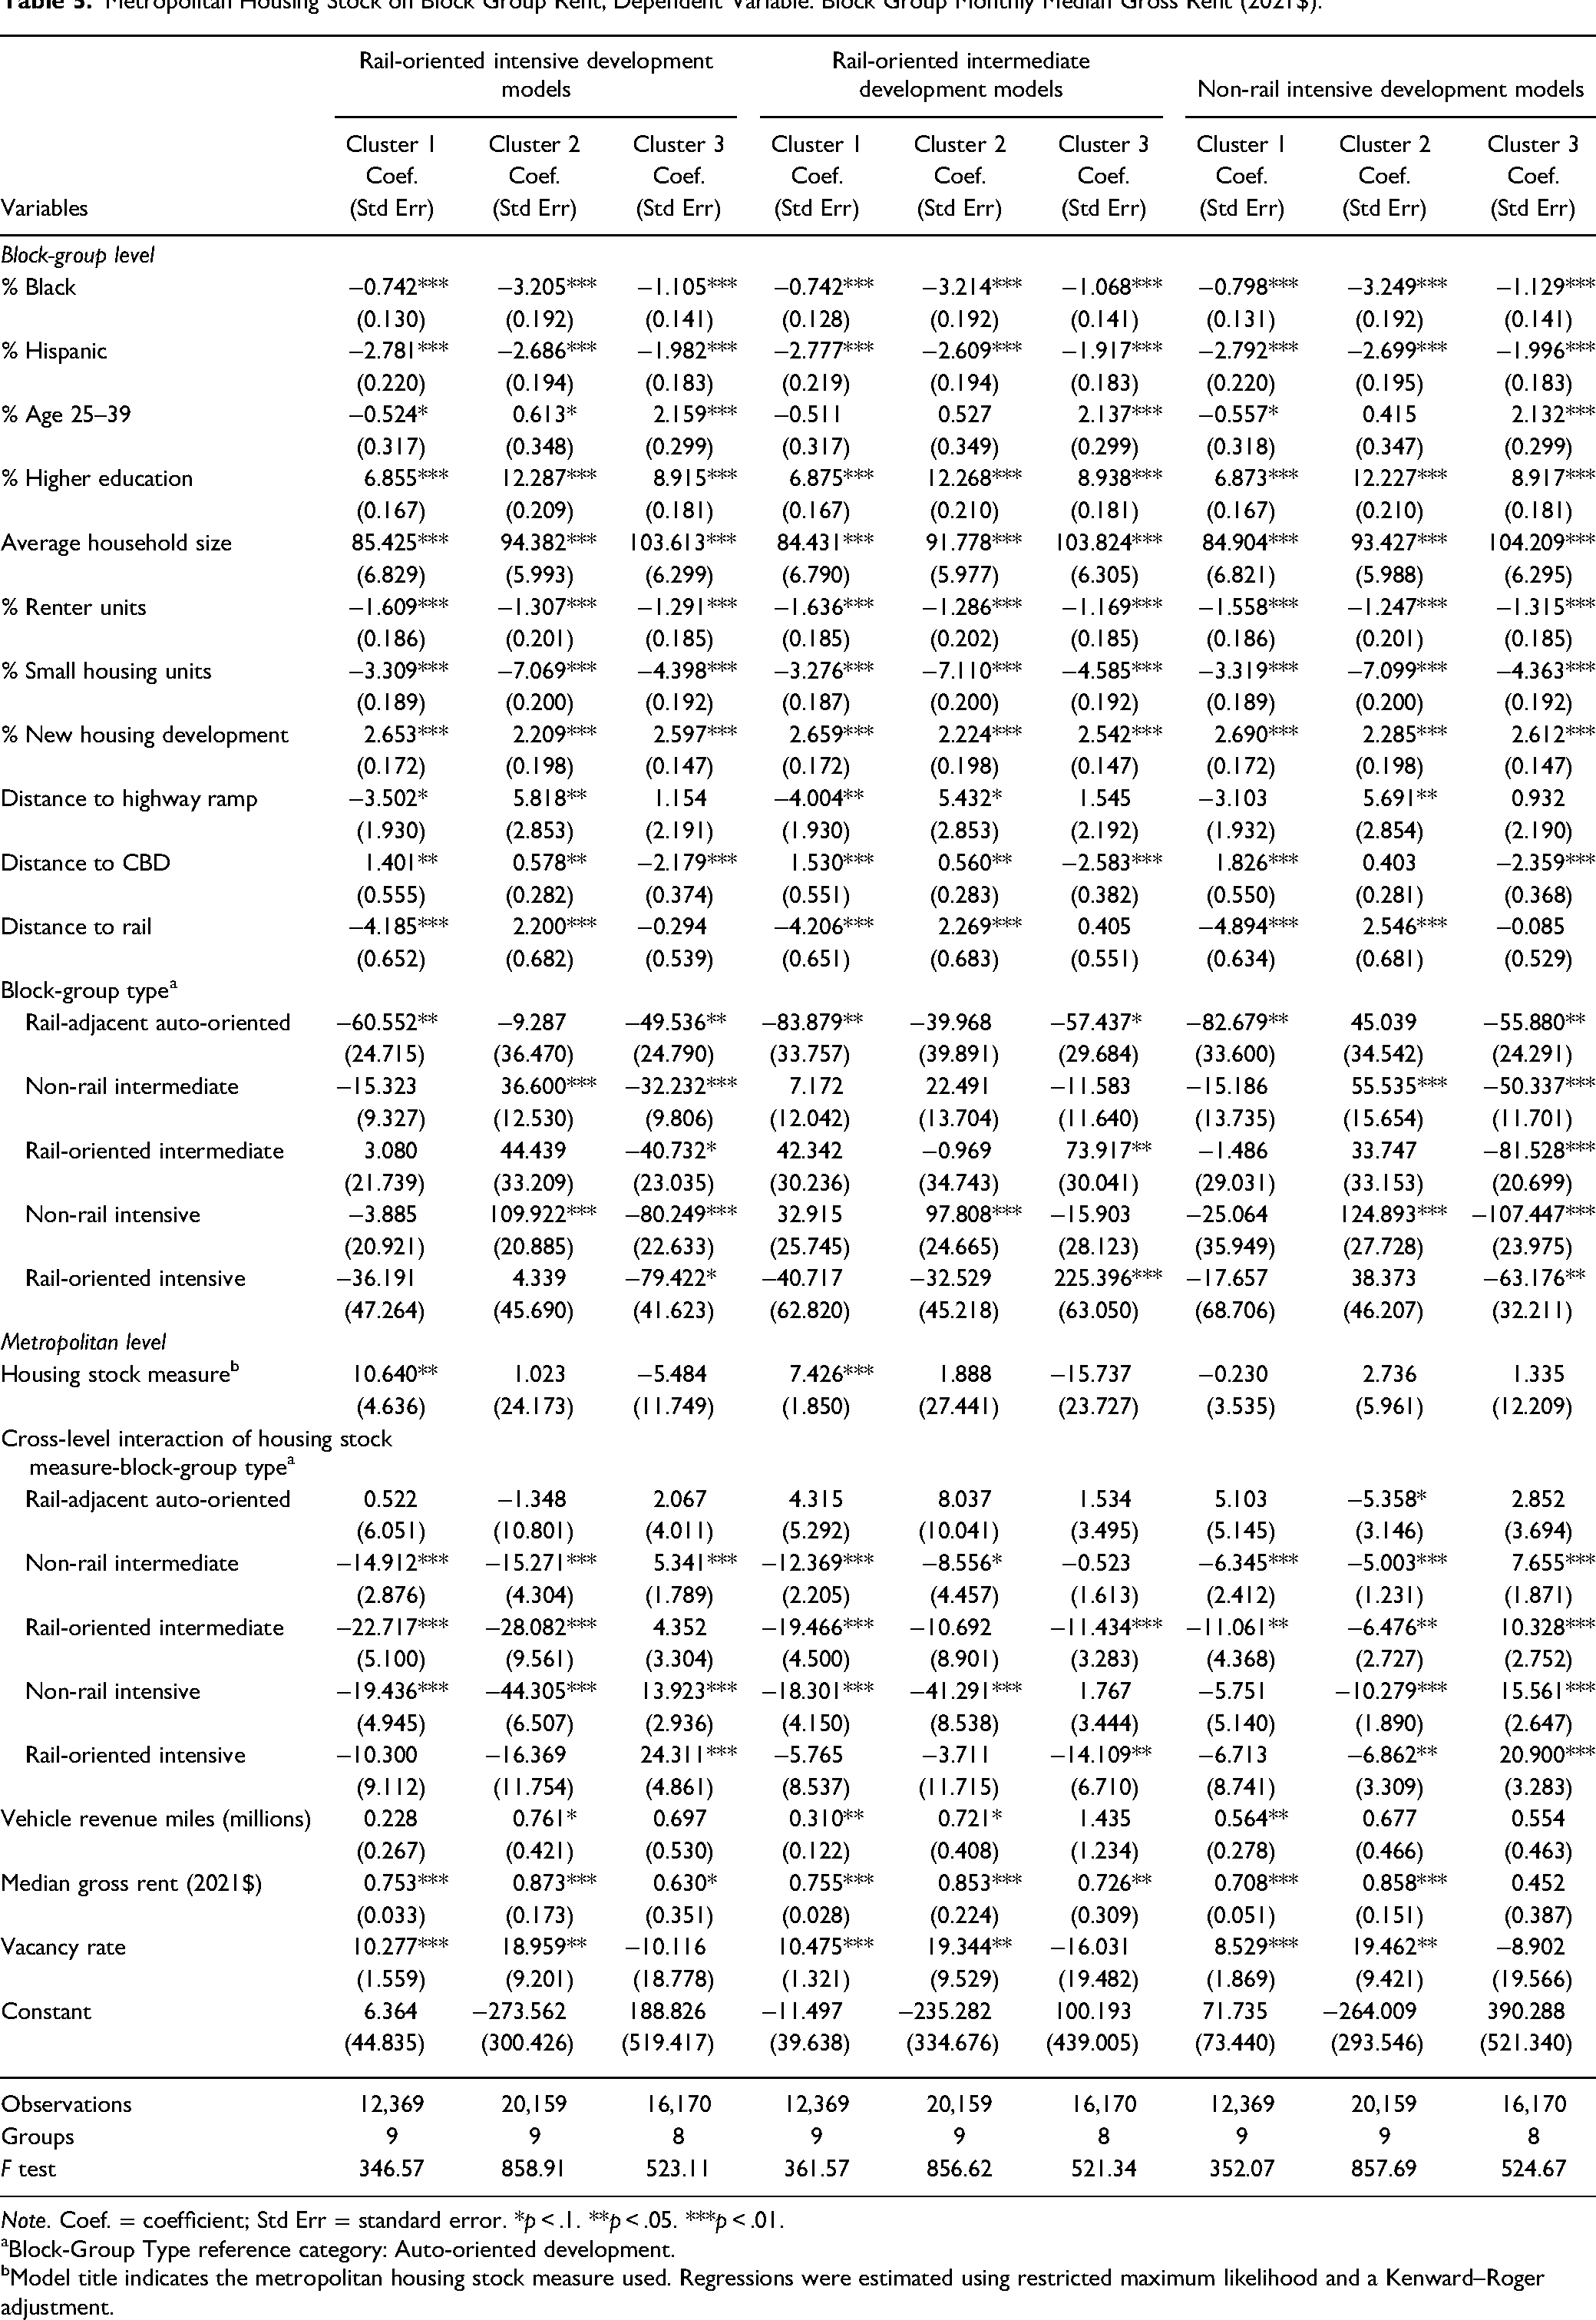
Note. Coef. = coefficient; Std Err = standard error. *p < .1. **p < .05. ***p < .01.
Block-Group Type reference category: Auto-oriented development.
Model title indicates the metropolitan housing stock measure used. Regressions were estimated using restricted maximum likelihood and a Kenward–Roger adjustment.
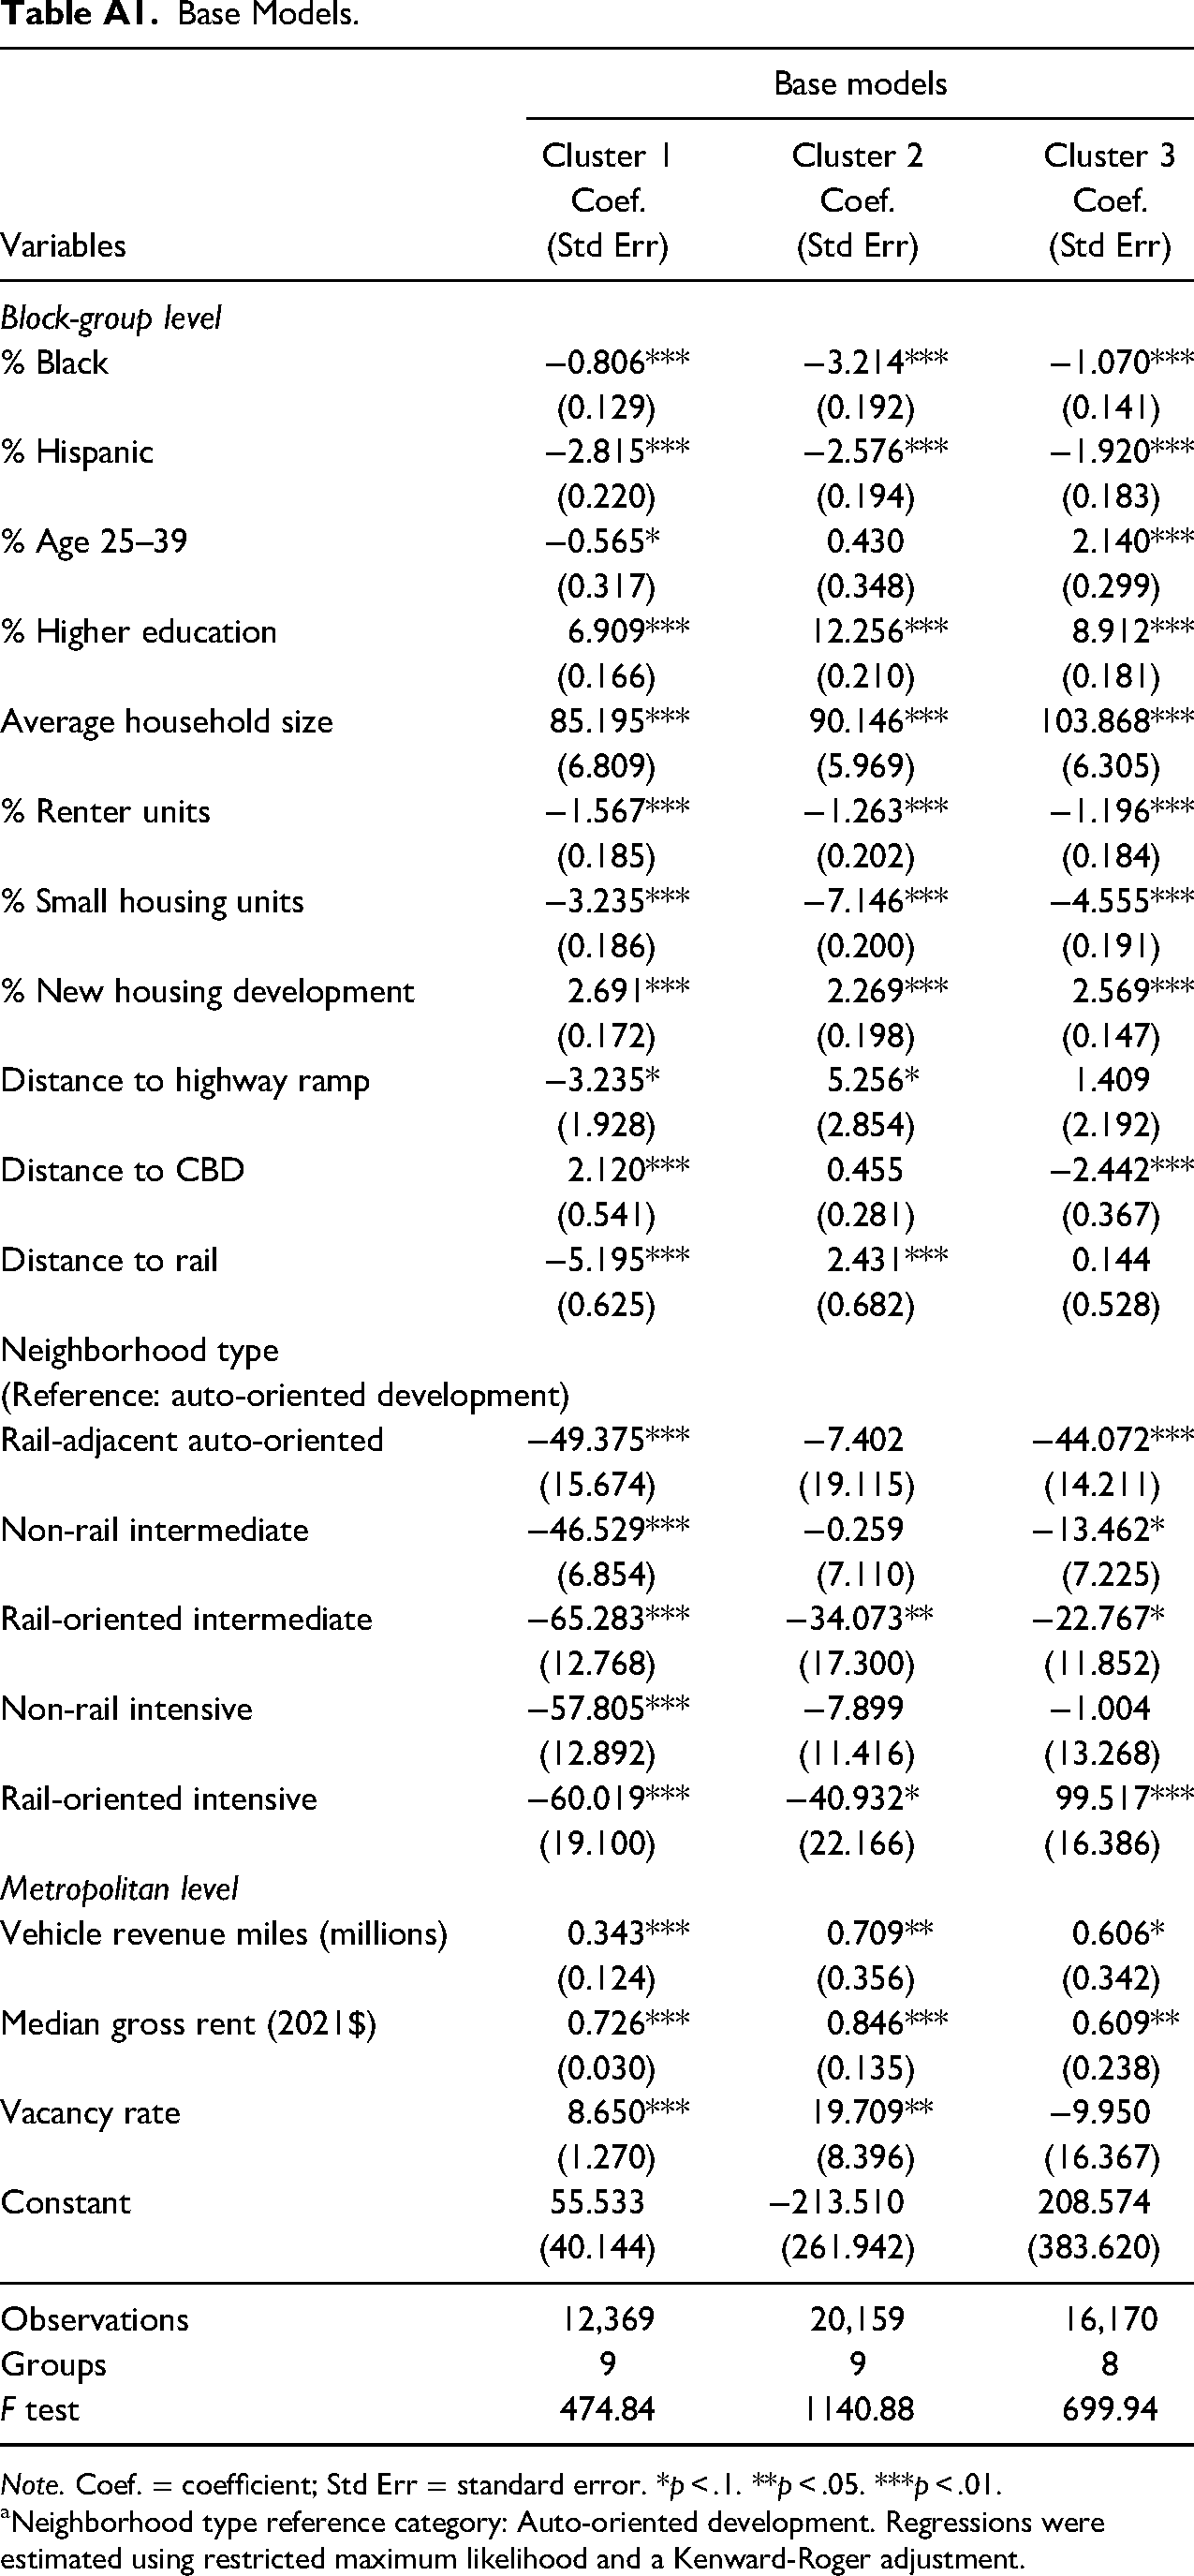
“Base Models” were constructed for each cluster to estimate block group median gross rent without the metropolitan housing stock-block-group type interaction (Table A1). The results for each cluster are mostly in line with expectations, and the direction, magnitude, and statistical significance of the control variables’ coefficients are relatively consistent across the other models. For all three clusters, the share of Black and Hispanic households, the share of renter-occupied housing units, and the share of small housing units are associated with lower monthly block group median gross rent, ceteris paribus. For example, the coefficient for small housing units suggests that a 10% increase in the share of small housing units in a block group is associated with monthly median gross rent decreasing by between $32.35 in Cluster 1 and $71.46 in Cluster 2. In contrast, the population with a university degree, average household size, and the share of new housing units have a positive association with block-group rent. The share of young adults aged 25–39 has a negative association with block-group rent in Cluster 1 but a positive relationship with a larger magnitude in Cluster 3 and no statistically significant association with rent in Cluster 2.
At the metropolitan level, metropolitan median gross rent has a positive association with block-group median gross rent for all three clusters. This suggests block-group rent is higher in metropolitan areas with more expensive rental markets. Metropolitan vacancy rate also has a positive association with rent for Clusters 1 and 2 but negative and not statistically significant for Cluster 3. This outcome might be a result of the Great Recession, during which households relocated away from more expensive metropolitan areas.
The association that transportation characteristics have with block-group rent varies by cluster. After controlling for other block group characteristics, distance to the CBD has a positive association with rent in Cluster 1 but a negative association in Cluster 3. This suggests that the CBDs of the metropolitan areas in Cluster 3 are more attractive, while those in Cluster 1 are viewed as a disutility. At the same time, distance to a rail station has a positive association with rent for Cluster 2 but a negative association for Cluster 1. This suggests that rail stations are valued more in Cluster 1, while in Cluster 2, they are viewed as a disutility. Distance to a highway ramp is only marginally significant for Clusters 1 and 2 and not statistically significant for Cluster 3. Finally, metropolitan VRM has a positive association with rent for all three clusters. This suggests that the transit service that rail systems provide are valued positively in all three clusters.
Lastly, the “Base Models” show for each cluster the rent differences associated with each block-group type relative to auto-oriented development, the reference category. Rail-oriented intensive development in Cluster 3 is the only block-group type with higher rent than auto-oriented development. For Cluster 3, housing in rail-oriented intensive development has a $99.52 monthly rent premium over housing in auto-oriented development. In contrast, rail-oriented intensive development in Clusters 1 and 2, as well as non-rail intensive development in Cluster 1 and rail-oriented intermediate development for all three clusters, are associated with lower rent than in auto-oriented development. This suggests that rail-oriented intensive development captures a built-environment premium only in the metropolitan areas in Cluster 3, while the built environments of the other compact transit-rich block group and other clusters are viewed as a disutility.
Rail-Oriented Intensive Development Models
The “Rail-Oriented Intensive Development Models” examine the argument that a larger share of metropolitan housing units in the most compact transit-rich block-group type is associated with lower rents in compact transit-rich block groups. The models produce mixed results across clusters and block-group types. The results for Cluster 2 (high-rent, negative rent gap, metropolitan areas) suggest that higher shares of metropolitan housing units in rail-oriented intensive development are associated with lower rents in compact transit-rich block groups, yet not in the most compact transit-rich block-group type. For the high-rent metropolitan areas in Cluster 2, a 10% increase in the share of metropolitan housing units in rail-oriented intensive development is associated with monthly rents in non-rail intensive development and rail-oriented intermediate development being $443 and $281 lower than in auto-oriented development, respectively. The interaction between housing stock in rail-oriented intensive development and the rail-oriented intensive block-group type is not statistically significant.
A somewhat more complicated relationship is found for the low-rent metropolitan areas in Cluster 1. The coefficient for the housing stock measure is positive and significant, suggesting that a 10% increase in the share of metropolitan housing units in rail-oriented intensive development is associated with block-group rent being $106 higher, regardless of block-group type. However, the interaction between the share of metropolitan housing units in rail-oriented intensive development and block-group type suggests that this positive relationship does not apply to non-rail intensive and rail-oriented intermediate development (as well as non-rail intermediate development). According to the interaction term, a 10% increase in the share of metropolitan housing units in rail-oriented intensive development is associated with rents being $194 and $227 lower in non-rail intensive and rail-oriented intermediate development, respectively. Hence, for these two block-group types, a larger share of metropolitan housing units in rail-oriented intensive development is associated with lower overall rent. Since the interaction between housing stock in rail-oriented intensive development and the rail-oriented intensive block-group type is not statistically significant, a larger share of metropolitan housing units in rail-oriented intensive development is associated with higher rent in the most compact transit-rich block-group type.
Finally, for metropolitan areas with a positive rent gap between rail-oriented intensive development and median rent (Cluster 3), the interaction between the share of metropolitan housing units in rail-oriented intensive development and block-group type has a positive relationship with rent. Specifically, a 10% increase in the share of metropolitan housing units in rail-oriented intensive development is associated with rent in rail-oriented intensive and non-rail intensive development being $243 and $139 higher, respectively. These results suggest that where compact transit-rich block groups are highly valued (as indicated by the positive rent gap), focusing development on the most compact transit-rich block groups might not be enough to alleviate housing cost pressures in these block groups regionwide.
Rail-Oriented Intermediate Development Models
The “Rail-Oriented Intermediate Development Models” test the “missing middle” argument that a larger share of metropolitan housing units in rail-oriented compact transit-rich environments, yet not the most compact and transit-rich, is associated with lower rents. The results for all three clusters provide partial support for this argument. However, the magnitude of the relationship and the affected block-group types vary by cluster. As in the Cluster 2 Rail-Oriented Intensive Model, the results for Cluster 2 (high-rent metropolitan areas) suggest that a 10% increase in the share of metropolitan housing units in rail-oriented intermediate development is associated with rents in non-rail intensive development being $413 lower. However, a similar relationship is not found for rail-oriented intensive or intermediate developments.
The results for Cluster 1 (low-rent metropolitan areas) also follow the results for the Rail-Oriented Intensive Models, suggesting that a larger metropolitan share of housing units in Rail-oriented intensive development is associated with lower rents in rail-oriented intermediate and non-rail intensive development but higher rents in Rail-oriented intensive development. On the one hand, the results for the housing stock measure without the interaction term suggest that a 10% increase in the share of metropolitan housing units in rail-oriented intermediate development is associated with a $74.3 increase in rent regardless of block-group type. Since the interaction between the housing stock measure and rail-oriented intensive development is not statistically significant, the Cluster 1 model, therefore, implies a positive relationship with rents in rail-oriented intensive development. On the other hand, the interaction terms with non-rail intensive and rail-oriented intermediate development are negative and statistically significant, suggesting that a 10% increase in the share of metropolitan housing units in rail-oriented intermediate development is associated with rents being $183 and $195 lower, respectively. Hence, for these two block-group types, a larger share of metropolitan housing units in rail-oriented intensive development is associated with lower rent overall.
As opposed to the Rail-Oriented Intensive Models, the Cluster 3 model suggests that in metropolitan areas with a positive rent gap, a larger share of metropolitan housing units in rail-oriented intermediate development is associated with lower rents in the two most compact transit-rich block-group types. Specifically, per the Cluster 3 model, a 10% increase in the share of metropolitan housing units in rail-oriented intermediate development is associated with rents being $141 lower in rail-oriented intensive development and $114 lower in rail-oriented intermediate development.
Non-Rail Intensive Development Models
The final set of models (“Non-Rail Intensive Development Models”) test a second “missing middle” argument, that a larger housing stock in moderately compact transit-rich non-rail development regionwide, and not just rail-oriented compact transit-rich development, could alleviate housing costs pressures (An et al. 2020). The results suggest that this argument might hold in high-rent metropolitan areas (Cluster 2) but not where the most compact transit-rich block groups are valued more than the average block group (Cluster 3). According to the Cluster 2 model, a 10% increase in the share of metropolitan housing units in non-rail intensive development is associated with rent being $68.6 lower in rail-oriented intensive development, $103 lower in non-rail intensive development, and $65 lower in rail-oriented intermediate development. A similar trend is found in the Cluster 1 model, yet the results are only statistically significant for the interaction with rail-oriented intermediate development.
In contrast, the Cluster 3 model suggests that in metropolitan areas with a positive rent gap, a larger share of metropolitan housing units in non-rail intensive development is associated with higher rents across the three compact transit-rich block-group types. According to the Cluster 3 model, a 10% increase in the share of metropolitan housing units in non-rail intensive development is associated with rents being $209 higher in rail-oriented intensive development, $156 higher in non-rail intensive development, and $103 higher in rail-oriented intermediate development.
Conclusions
There is general agreement that the roots of the housing affordability crisis are, to a large degree, in the undersupply of housing (Been, Gould Ellen and O’Regan 2019; Wetzstein 2021). Constraining land-use regulations create a mismatch between supply and demand regarding the amount of housing supplied and the types of built environments in which it is supplied (Levine, Inam, and Torng 2005; Levine and Frank 2007; Yan 2020). The result is higher housing costs in high-demand metropolitan areas (Gyourko, Mayer, and Sinai 2013) and neighborhoods (Leinberger and Rodriguez 2016). Yet the debate over the solutions to the housing affordability crisis is still open, revolving around several, often conflicting, perspectives (Been, Gould Ellen and O’Regan 2019). Thus, more evidence is needed on the multiple relationships between housing supply, costs, and affordability (Monkkonen 2019).
This paper contributes to the debates on housing supply efforts, and the “missing middle” argument in particular, to alleviating housing cost pressures by examining the relationships between metropolitan housing stock, in compact transit-rich built environments, and rent in six block-group types. Partial support for supply-side efforts is provided by the results showing that across most of the studied metropolitan areas (i.e., Clusters 1 and 2), a larger share of metropolitan housing units in the most compact transit-rich block-groups is associated with lower block-group rent in rail-oriented intermediate development and/or non-rail intensive development. These results suggest that increasing housing supply in the most compact transit-rich built environments might reduce the demand for housing in moderately compact transit-rich block groups, resulting in lower rents.
Within this context, the results provide particular support for the “missing middle” argument that increasing housing supply in moderately dense environments could help alleviate housing cost pressures (An et al. 2020). A larger share of metropolitan housing units in non-rail intensive development is associated with lower rents in rail-oriented intermediate development in low-rent metropolitan areas (Cluster 1) and all three compact transit-rich block-group types in high-rent metropolitan areas (Cluster 2). And somewhat similar relationships are found for the share of metropolitan housing units in rail-oriented intermediate development. Moreover, the share of metropolitan housing units in rail-oriented intermediate development is the only block-group type associated with lower rents in compact transit-rich block-group types in metropolitan areas with a positive rent gap (Cluster 3). These results suggest that housing in block groups with moderate transit accessibility, housing densities, and walkability expands the housing options in compact and transit-rich developments regionally, thus resulting in lower rents. Hence, housing practitioners and advocates could alleviate housing cost pressures by broadening supply-side efforts from the most compact transit-rich developments to moderately compact rail-oriented and non-rail environments.
At the same time, the outcomes also show the limitation of supply-side efforts to alleviate cost pressures in metropolitan areas where housing in compact transit-rich environments is valued more than the average block group (Cluster 3). In these metropolitan areas, larger shares of metropolitan housing units in rail-oriented intensive and non-rail intensive developments are associated with higher rents in compact transit-rich block groups. These outcomes suggest that there is pent-up demand for housing in these metropolitan areas in rail-oriented intensive development (Leinberger and Rodriguez 2016; Murray 2021). Consequently, rents remain high even as more housing is provided in these and alternative block groups.
The study has several limitations, which provide opportunities for future research. The data on rent and other variables are aggregated to the block-group level. Hence, it is difficult to differentiate between housing units based on their unique characteristics. An effort was made to control for different unit elements (e.g., small housing units or new development) and block group socio-demographic and built-environment factors. Yet future research could apply a similar methodology to rent or prices at the unit level to produce more disaggregate analyses. Moreover, the census data used come from the 2011–2015 5-year estimates, which capture the end of the Great Recession and the beginning of the recovery from it. Hence, the results should be understood within this recession-recovery context. While such recession-recovery events are not unique (e.g., the COVID bust and boom), future research could evaluate similar relationships in non-recessionary periods or examine the effect of recession on the studied relationship. The study also used proximity to rail as its transportation level of service measures but did not account for other important factors like job accessibility or service frequency. However, these omissions seem reasonable considering that distance to rail and metropolitan rail VRM capture much of the benefits that accessibility and frequency provide.
Footnotes
Acknowledgments
I would like to thank Jonathan Levine, Joe Grengs, Lan Deng, and David Thacher for their support and comments on previous versions of this research. I would also like to thank the anonymous reviewers. Their comments and suggestions helped to greatly improve the paper.
Declaration of Conflicting Interests
The author declared no potential conflicts of interest with respect to the research, authorship, and/or publication of this article.
Funding
The author received no financial support for the research, authorship, and/or publication of this article.
Author Biography
Appendix
Base Models.
| Base models | |||
|---|---|---|---|
| Cluster 1 | Cluster 2 | Cluster 3 | |
| Coef. | Coef. | Coef. | |
| Variables | (Std Err) | (Std Err) | (Std Err) |
| Block-group level | |||
| % Black | −0.806*** | −3.214*** | −1.070*** |
| (0.129) | (0.192) | (0.141) | |
| % Hispanic | −2.815*** | −2.576*** | −1.920*** |
| (0.220) | (0.194) | (0.183) | |
| % Age 25–39 | −0.565* | 0.430 | 2.140*** |
| (0.317) | (0.348) | (0.299) | |
| % Higher education | 6.909*** | 12.256*** | 8.912*** |
| (0.166) | (0.210) | (0.181) | |
| Average household size | 85.195*** | 90.146*** | 103.868*** |
| (6.809) | (5.969) | (6.305) | |
| % Renter units | −1.567*** | −1.263*** | −1.196*** |
| (0.185) | (0.202) | (0.184) | |
| % Small housing units | −3.235*** | −7.146*** | −4.555*** |
| (0.186) | (0.200) | (0.191) | |
| % New housing development | 2.691*** | 2.269*** | 2.569*** |
| (0.172) | (0.198) | (0.147) | |
| Distance to highway ramp | −3.235* | 5.256* | 1.409 |
| (1.928) | (2.854) | (2.192) | |
| Distance to CBD | 2.120*** | 0.455 | −2.442*** |
| (0.541) | (0.281) | (0.367) | |
| Distance to rail | −5.195*** | 2.431*** | 0.144 |
| (0.625) | (0.682) | (0.528) | |
| Neighborhood type | |||
| (Reference: auto-oriented development) | |||
| Rail-adjacent auto-oriented | −49.375*** | −7.402 | −44.072*** |
| (15.674) | (19.115) | (14.211) | |
| Non-rail intermediate | −46.529*** | −0.259 | −13.462* |
| (6.854) | (7.110) | (7.225) | |
| Rail-oriented intermediate | −65.283*** | −34.073** | −22.767* |
| (12.768) | (17.300) | (11.852) | |
| Non-rail intensive | −57.805*** | −7.899 | −1.004 |
| (12.892) | (11.416) | (13.268) | |
| Rail-oriented intensive | −60.019*** | −40.932* | 99.517*** |
| (19.100) | (22.166) | (16.386) | |
| Metropolitan level | |||
| Vehicle revenue miles (millions) | 0.343*** | 0.709** | 0.606* |
| (0.124) | (0.356) | (0.342) | |
| Median gross rent (2021$) | 0.726*** | 0.846*** | 0.609** |
| (0.030) | (0.135) | (0.238) | |
| Vacancy rate | 8.650*** | 19.709** | −9.950 |
| (1.270) | (8.396) | (16.367) | |
| Constant | 55.533 | −213.510 | 208.574 |
| (40.144) | (261.942) | (383.620) | |
| Observations | 12,369 | 20,159 | 16,170 |
| Groups | 9 | 9 | 8 |
| F test | 474.84 | 1140.88 | 699.94 |
Note. Coef. = coefficient; Std Err = standard error. *p < .1. **p < .05. ***p < .01.
aNeighborhood type reference category: Auto-oriented development. Regressions were estimated using restricted maximum likelihood and a Kenward-Roger adjustment.