
Abstract
People receiving government assistance have personal stakes in the political process and intimate knowledge of policy implementation. However, data limitations have made it hard to measure voting among those receiving assistance across various programs. Using linked administrative data from a large county in Pennsylvania, merged with the Pennsylvania voter file, we calculate voting rates among benefits recipients. We find that people receiving means-tested benefits (cash assistance, food assistance, health insurance, disability benefits, childcare, and housing) vote at just over half the rate of other county residents (45% compared with 84% in 2020). In the 2020 election, public benefits recipients comprised over 20% of the voting-eligible population but only 12% of voters. To the extent that benefits recipients are more supportive of generous welfare policy than nonrecipients and more familiar with administrative burdens programs impose, this underrepresentation may obscure popular preferences for social welfare provision and shape politicians’ attentiveness to program design.
Introduction
For many people in the United States, government is not an abstract concept but a high-profile and consequential part of everyday life. Government policy delimits the resources low-income people have to provide for their families, from housing to healthcare to food to childcare, and dictates whether and how they can access this assistance. Indeed, one of the most important jobs of elected officials is to determine the scope and operation of the social safety net. Those receiving government benefits are important stakeholders in this process.
Moreover, for public benefits recipients, the government takes the shape of specific forms that must be filled out, phone calls that must be made to caseworkers, or eligibility tests that must be met in order to access benefits or services (Herd and Moynihan 2019). These street-level experiences with government can range from the empowering to the punitive, but in any form they generate intimate knowledge of government policy implementation (Bruch, Ferree, and Soss 2010; Michener 2018; Weaver, Prowse, and Piston 2019). Is this knowledge being incorporated into the political process? Are people with direct, personal experiences with food assistance, healthcare, and other benefits programs voting to elect officials that determine policy related to these programs?
Scholars have long argued that variation in rates of political participation yields “turnout bias,” wherein policy tends towards the preferences of those who turn out to vote more often (Lijphart 1997). Existing empirical and theoretical work suggests that low-income people enrolled in means-tested benefits programs are likely disadvantaged by such turnout bias (Soss 1999; Lawless and Fox 2001), given the well-documented positive relationship between income and voter turnout (Rosenstone 1982; Brady, Verba, and Schlozman 1995; Denny 2016). Yet new research finds distinct attitudes about social welfare policy among means-tested benefits recipients, even accounting for demographic characteristics like age, gender, race, education, and income (Halling, Herd, and Moynihan 2022). Moreover, survey and interview-based measures have made it difficult to quantify differential voting among public benefits recipients. Although surveys of political participation may ask about income, they rarely ask detailed questions about enrollment in government programs. Even when surveys collect this information, analysis is complicated by the reliability of self-reports of benefits receipt (Swartz et al. 2009; Mettler and Stonecash 2008) and relatively small sample sizes (Lawless and Fox 2001). To address these limitations, scholars have turned to administrative data, but these data have typically been restricted to single programs in isolation, limiting our ability to examine political behavior more broadly across public benefits recipients (Corman, Dave, and Reichman 2017).
This note uses linked administrative data from one large county, Allegheny County, Pennsylvania, which covers the city of Pittsburgh and its suburbs, with a population of over 1.2 million. 1 These data allow us to observe nearly the entire universe of people enrolled in a range of means-tested benefits programs in the county, including Temporary Assistance to Needy Families (TANF), the Supplemental Nutrition Assistance Program (SNAP), Medicaid, Supplemental Security Income (SSI), childcare assistance, and housing assistance. We link these data to state voter registration records to see whether people were registered or voted in specific elections. Relying on administrative records allows us to fairly accurately pinpoint who is eligible to vote and thus calculate accurate turnout rates among eligible people. It also allows us to calculate the share of benefits recipients among all eligible voters in the county, and to compare the representation of benefits recipients with nonrecipients.
We find that people enrolled in targeted government programs register and vote much less often than nonrecipients: In the 2020 general election, 45% of program recipients voted, compared with 84% of nonrecipients. Public benefits recipients were thus over 20% of the voting-eligible population but only 12% of voters. This is consistent with the benefit recipient population being poorer, less white, and younger than the nonrecipient population, characteristics underrepresented in the electorate. Our analysis does not aim to isolate the relationship between benefits receipt and voting but rather to describe the scope of underrepresentation among public benefits recipients in a populous U.S. county. To the extent that benefits recipients have different policy preferences than nonrecipients, such as with respect to social welfare generosity or program design, their underrepresentation could have important public policy consequences.
Voting Among Program Beneficiaries
We look at voting among benefits recipients by combining two administrative datasets. We begin with records of program enrollment from the Allegheny County Data Warehouse, focusing on people enrolled in the large, means-tested benefits programs listed in Figure 1: TANF, SSI, public housing, Medicaid, SNAP, “Section 8” (including Housing Choice Vouchers and property-based subsidies), and childcare subsidies in the form of Child Care and Development Fund (CCDF) benefits. We observe approximately 200,000 Allegheny County residents who were enrolled in at least one of these programs between January and October 2020 and were of voting age during the 2020 general election. 2 Section 1 of the Supplemental Online Appendix provides additional information about the Data Warehouse and the completeness of these records. Then, we join these individual program records with several snapshots of the Pennsylvania voter file to observe whether people are currently registered, were registered in previous years, and whether they have voted in recent elections. We conducted this merge based on names, dates of birth, and gender. Section 2 of the Supplemental Online Appendix discusses the merge approach and validation in more detail.
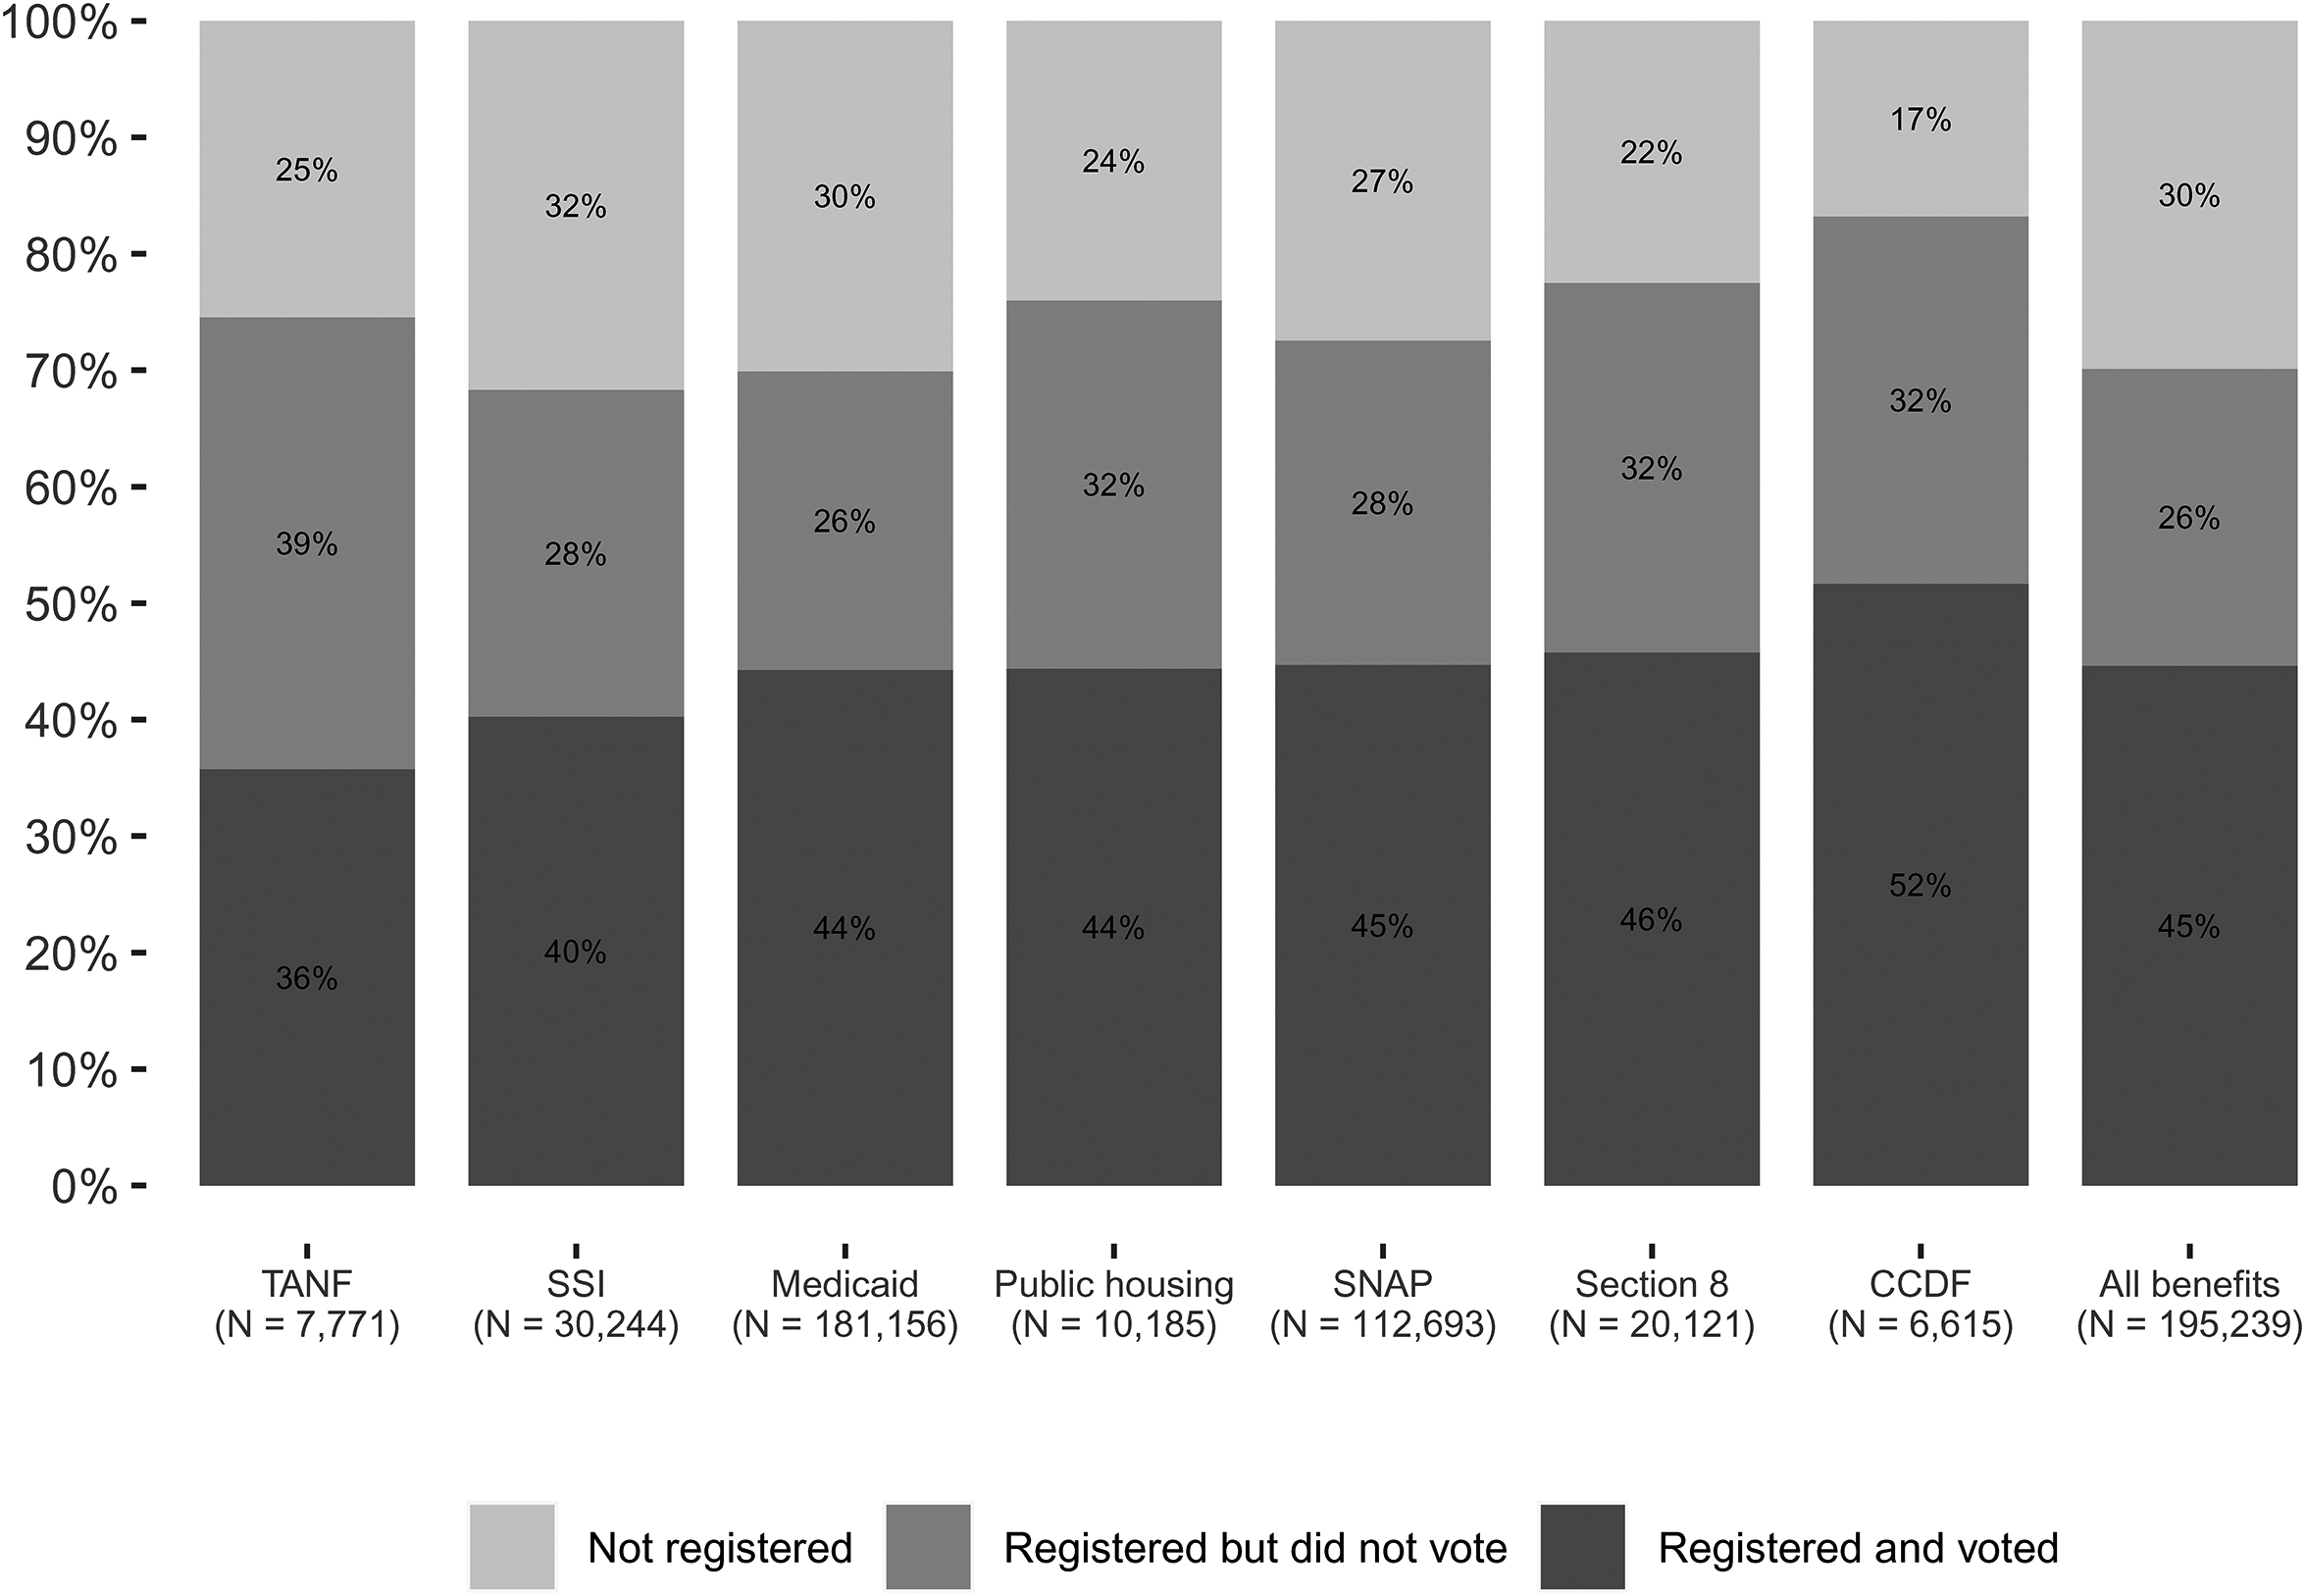
Registration and turnout in the 2020 general election among age-eligible Allegheny County residents who received public benefits between January 1, 2020 and October 31, 2020.
Using this linked dataset, we calculate rates of voter registration and turnout in 2020 for recipients of specific benefits as well as for all program beneficiaries, as shown in Figure 1. 3 (Our analysis focuses on voting-age people receiving various means-tested benefits; our dataset does not consistently include information about citizenship status, although Allegheny County has relatively few non-citizen residents (3%). Overall, about 70% of voting-age people who were enrolled in one of these benefits programs were registered to vote as of the 2020 election, and about 45% of them voted (unconditional on registration). These rates vary substantially across programs, with TANF recipients showing particularly low rates of participation and CCDF recipients registering and turning out at relatively high rates.
Table 1 explores program beneficiaries’ representation within the electorate. About one in five voting-eligible Allegheny County residents receives benefits through at least one of the programs we study (the “Total” row does not represent the sum of all program-specific rows because some people are enrolled in multiple programs). 4 But benefits recipients are under-represented among voters: Despite being over 20% of the voting-eligible population, they comprise less than 15% of the registered voters in the county and only about 12% of the people who cast ballots in the 2020 general election. People enrolled in these benefits programs register and vote at much lower rates than other county residents.
Representation of Age-eligible Program Recipients Among Allegheny County Electorate in 2020.
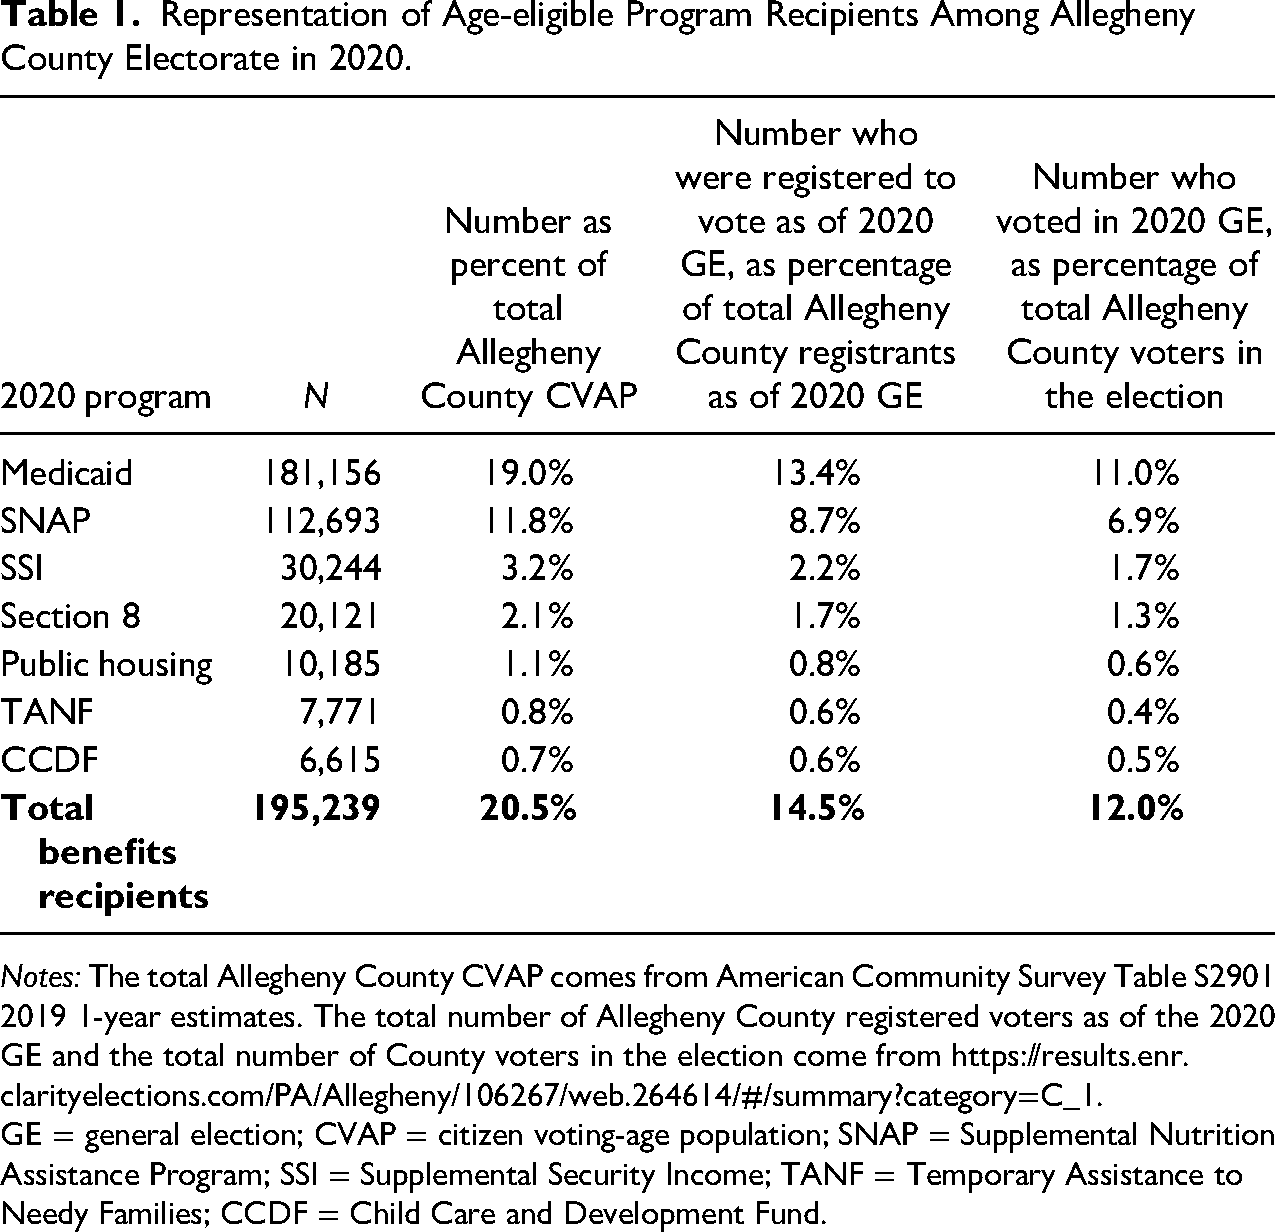
Notes: The total Allegheny County CVAP comes from American Community Survey Table S2901 2019 1-year estimates. The total number of Allegheny County registered voters as of the 2020 GE and the total number of County voters in the election come from https://results.enr.clarityelections.com/PA/Allegheny/106267/web.264614/#/summary?category=C_1. GE = general election; CVAP = citizen voting-age population; SNAP = Supplemental Nutrition Assistance Program; SSI = Supplemental Security Income; TANF = Temporary Assistance to Needy Families; CCDF = Child Care and Development Fund.
Put another way, there was a nearly forty-percentage-point gap in turnout between benefits recipients and other residents in the 2020 general election. 5 If people enrolled in the programs we study had registered and turned out to vote at the same rate as the rest of the county, Allegheny County would have seen more than 75,000 additional ballots cast in November 2020, roughly 10% of the county’s actual observed vote total.
Who Receives Benefits?
Table 2 shows the demographic composition of Allegheny County’s public benefits recipients and its overall citizen voting-age population (CVAP). The estimates in Table 2 suggest that benefits recipients are demographically different from the county population as a whole, and are drawn from groups that are more likely to support generous welfare programs. Individuals aged 18–29 are 20% of the Allegheny County CVAP, but 27% of its voting-eligible benefits recipients, while individuals aged 65 or older are 25% of the CVAP but only 15% of its voting-eligible benefits recipients. Benefits recipients are also disproportionately women, racial minorities, and low-income: Women are 53% of the CVAP but 57% of the recipients, while Black residents compose 12% of the county CVAP but over one-third (37%) of benefits recipients. Similarly, and unsurprisingly given the means-tested nature of these programs, the mean twelve-month income for eligible voters in the county was over $38,000, while it was just under $7,000 among benefits recipients.
Comparison of Allegheny County Citizen Voting-age Population (CVAP) With Voting-age Public Benefits Recipients.
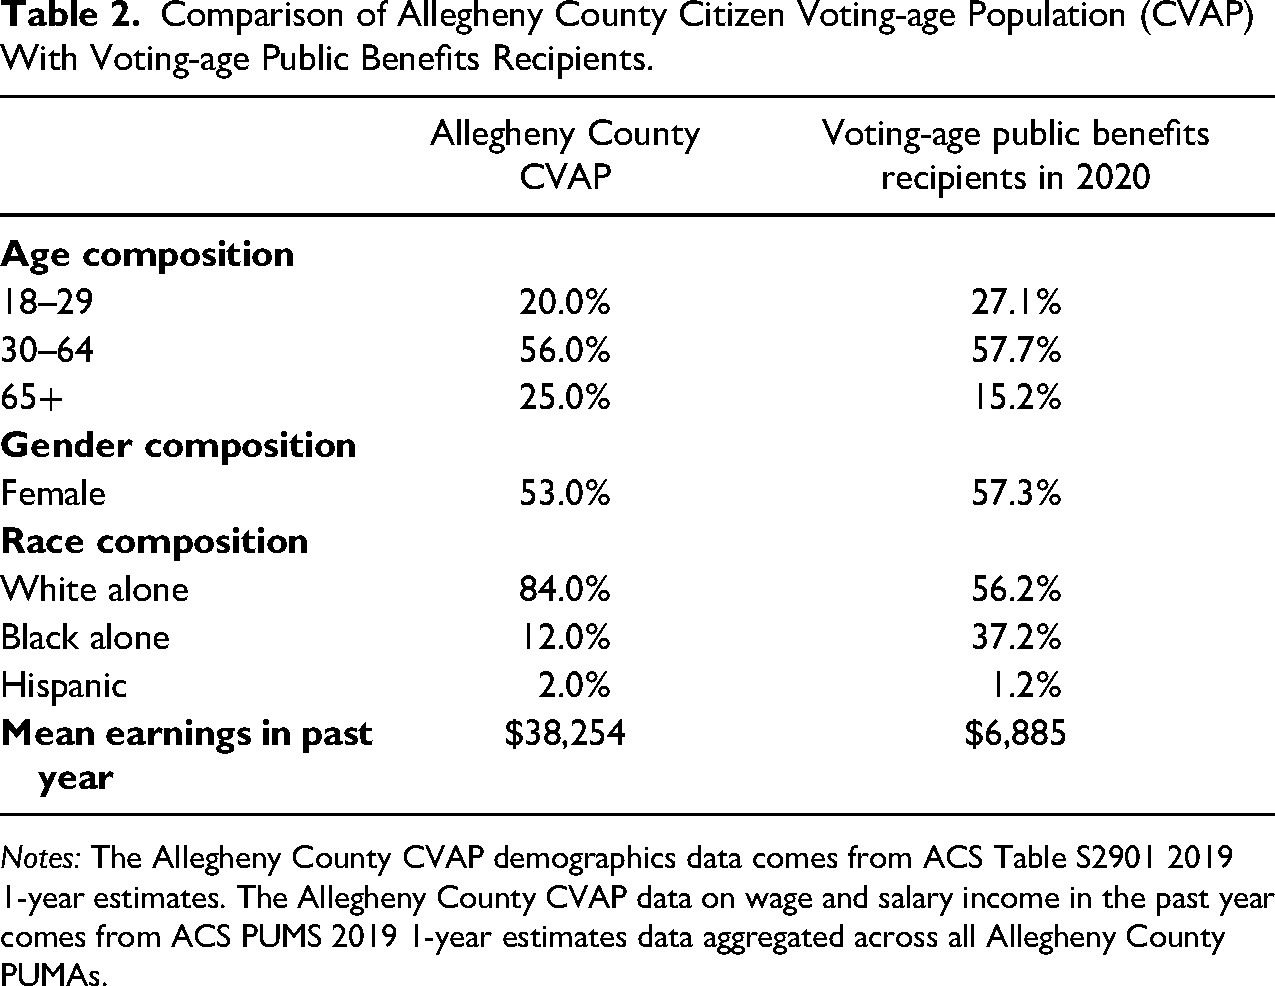
Notes: The Allegheny County CVAP demographics data comes from ACS Table S2901 2019 1-year estimates. The Allegheny County CVAP data on wage and salary income in the past year comes from ACS PUMS 2019 1-year estimates data aggregated across all Allegheny County PUMAs.
These figures depict a benefit-recipient population that, based on prior research on preferences for government spending among different subgroups of Americans, is likely to be supportive of generous welfare policy. Younger Americans are reliably more supportive of redistribution than older Americans, and younger Americans’ support has only grown in recent years (Ashok, Kuziemko, and Washington 2015). Black Americans tend to be more supportive of generous welfare policy, on average, than white Americans are (Garand, Xu, and Davis 2017), women tend to be more supportive than men, and lower-income people tend to be more supportive than higher-income people (Pew Research Center 2011). These groups—younger people, Blacks, women, and the poor—are all disproportionately represented among Allegheny County’s voting-eligible benefits recipients compared to their shares of the county’s voting-age population. 6
Discussion
Our analysis focuses on the representation of public benefits recipients among voters. The extent to which receipt of these public benefits causes gaps in political participation—either by encouraging or discouraging voting—is beyond the scope of this note. Theoretically, enrollment in benefits programs could shape participation in a number of ways. Public benefits receipt might increase resources for prospective voters in ways that facilitate voting (Corman, Dave, and Reichman 2017; Baicker and Finkelstein 2018) and/or mobilize voters seeking to maintain their benefits (Campbell 2012). Research on a Medicaid expansion lottery in Oregon finds that access to Medicaid increased voter turnout (Baicker and Finkelstein 2018). Additionally, or instead, experiences with public benefits may suppress participation by fostering a sense of cynicism about or exclusion from government institutions (Soss 2002; Bruch, Ferree, and Soss 2010). Housing benefits that induce residential mobility may also disrupt social and community ties, lowering turnout (Gay 2012). Moreover, the relationship between public benefits receipt and political participation may vary based on characteristics such as attention to politics (Sugie and Conner 2020) and the structure of the specific public benefit program (Campbell 2002, 2003; Soss 2002; Swartz et al. 2009; Bruch, Ferree, and Soss 2010; Mettler 2010). We do not seek to make claims about such causal effects; we begin by presenting descriptive patterns across multiple benefits programs, which has been challenging to do with past data sources.
We find that people enrolled in means-tested public benefits programs in Allegheny County are less likely to register and vote than other residents. Are these relationships likely to hold outside of Allegheny County as well? While no single county in the U.S. would perfectly represent the nation, Allegheny County is reasonably representative of the nation as a whole on many relevant dimensions. Allegheny County is large: Despite being just one county, with 1.2 million residents it is more populous than eight states and the District of Columbia. Consequently, it contains both urban and rural areas, and a variety of different and differently-resourced agencies administer social programs there. Further, its benefits and eligibility rules are neither much more nor much less strict than rules elsewhere in the US; the Pennsylvania maximum TANF benefit level in July 2020 for a parent and two children was $421, slightly lower than the median benefit level ($489) across the 50 states and D.C. (Safawi and Floyd 2020). Finally, program recipients look, in many ways, similar to recipients in the nation as a whole (for example, 23.5 percent of the county receives Medicaid compared to 19.5 percent of the US). The county labor force participation rate, poverty rate, and median household income mirror national rates. The most prominent difference between Allegheny County and the entire U.S. is the county’s racial composition and the racial structure of poverty there: Allegheny County is predominantly non-Hispanic White and non-Hispanic Black, with relatively few Hispanic/Latino residents, and Black residents compose a disproportionately large share of means-tested program enrollees. We encourage additional research in other demographic and policy contexts, such as areas with greater Hispanic/Latino populations, with different racial disparities in the experience of poverty, and states with higher and lower benefit levels (Michener 2019). Finally, Pennsylvania was a swing state in 2020, which helps to explain the very high overall levels of turnout seen in Allegheny County. To the extent that other places received less campaign attention and mobilization effort, it is possible that participation among benefits recipients could be even lower, and the gap between program enrollees and other residents even larger, elsewhere.
Benefits receipt and voting might also vary based on the extent of criminal legal system involvement in a particular area. Allegheny County’s incarceration rate is somewhat lower than that of the U.S. as a whole, with 778 per 100,000 adults aged 15–64 incarcerated compared to 978 per 100,000 nationally in 2019 (Vera Institute of Justice 2023). This translates to approximately 9,500 individuals incarcerated in Allegheny County, absent from the ranks of eligible voters, and ineligible for most public benefits programs. People who have completed their sentences after a felony conviction are eligible to vote in Pennsylvania, so a felony record alone should not exclude someone from voting as it would in some states. Pennsylvania also does not impose welfare bans or restrictions on those with felony records, except for those convicted of drug trafficking. 7 If anything, these contextual factors suggest that the negative association between benefits receipt and political participation might be even larger in jurisdictions where there are more formal restrictions on voting for those who have felony criminal records and/or higher rates of returnees from prison. It is less clear how to generalize these estimates to places with both felony disenfranchisement and welfare bans, where people ineligible to vote due to past convictions may also find themselves excluded from benefits.
These descriptive findings are important because the underrepresentation of benefits recipients among Allegheny County’s voters likely yields an electorate with different political views than would be seen under participatory parity. National survey data finds means-tested benefits recipients are more likely to see the government as responsible for assisting those in need (Morin, Taylor, and Patten 2012). This may reflect the demographic composition of the population of benefits recipients—in Allegheny County, recipients are younger, less white, more female, poorer, and more Democratic than the county’s voters as a whole, characteristics associated with more liberal policy preferences. Moreover, some research suggests that benefits receipt itself might induce greater support for public benefits. 8 Thus, preferences for generous welfare policy are likely under-represented among Allegheny County voters relative to eligible voters. In other words, in Allegheny County, the median voter is likely less supportive of generous welfare policy than the median voting-eligible individual. 9
Beyond overall levels of support for welfare spending, the underrepresentation of benefits recipients could also translate into different incentives for politicians considering program design and implementation. The design and application of eligibility policies such as work requirements, income verification, and “recertification” requirements can make the difference between eligible families accessing these programs or being shut out of them (Herd and Moynihan 2019). People who directly interact with these programs understand the importance of such program details in ways that many other voters and politicians may not. Indeed, two recent studies, drawing on a nationally representative U.S. sample as well as a sample of Danish politicians, find that those with personal experience of the welfare system are more strongly opposed to placing administrative burdens on applicants (Baekgaard, Moynihan, and Thomsen 2021; Halling, Herd, and Moynihan 2022). The relative absence of program recipients in the electorate could mean that politicians are less likely to see program design and administrative burden as issues of concern for their constituents, potentially making them more attentive to other concerns (such as fears of fraud) and less attentive to the hurdles faced by program applicants. Indeed, political science research finds some evidence that groups with high voter turnout rates have their policy preferences better represented than groups with lower voter turnout rates—especially when the group has homogeneous policy preferences, is loyal to a particular party, and/or is voting in a subnational election where smaller groups can sometimes be decisive (Hajnal and Trounstine 2005; Griffin and Newman 2013; Schlozman, Verba, and Brady 2013; Anzia 2019; Goldstein et al. 2021). Additional research would be helpful, though, to examine the specific implications of benefit recipient underrepresentation on policymakers’ priorities.
By analyzing administrative data from one large and varied county, we have been able to describe the scale of turnout bias in a way that clearly illustrates the resulting political landscape. Our findings demonstrate that the life experiences, demographic characteristics, and likely policy preferences of participants in the political process differ from the experiences, demographics, and preferences of non-participants. We hope that these new descriptive findings will be generative for future research. Future causal research could exploit changes in benefits over time; for example, increased SNAP benefits due to the Covid-19 pandemic ended on March 1, 2023, and it should be possible to compare political participation before and after this change if pre-2023 participation trends are parallel (either in Allegheny County or elsewhere) among public benefits recipients and nonrecipients. Future qualitative research could use in-depth interviews with benefits program recipients, such as those carried out in Fong (2019), to generate data that helps adjudicate between competing hypotheses of whether program receipt is politically mobilizing or demobilizing. And studies of the effects of under-representation on policy outcomes could investigate whether informing representatives about benefits recipients’ preferences changes representatives’ positions (Pereira 2021). In short, these findings should spark further discussion of both the causes and the consequences of the underrepresentation we describe.
Supplemental Material
sj-pdf-1-uar-10.1177_10780874231191703 - Supplemental material for Political Underrepresentation Among Public Benefits Recipients: Evidence from Linked Administrative Data
Supplemental material, sj-pdf-1-uar-10.1177_10780874231191703 for Political Underrepresentation Among Public Benefits Recipients: Evidence from Linked Administrative Data by Seth Chizeck, Kelley Fong, Rebecca Goldstein and Ariel R. White in Urban Affairs Review
Footnotes
Acknowledgments
The authors thank Angelica Lee for research assistance, and Katy Collins, Jamila Michener, Kris-Stella Trump, and participants in the APSA Women's Mentoring Workshop for helpful comments on the project.
Declaration of Conflicting Interests
The authors declared no potential conflicts of interest with respect to the research, authorship, and/or publication of this article.
Funding
The authors received no financial support for the research, authorship and/or publication of this article.
Supplemental material
Supplemental material for this article is available online.
Notes
Author Biographies
References
Supplementary Material
Please find the following supplemental material available below.
For Open Access articles published under a Creative Commons License, all supplemental material carries the same license as the article it is associated with.
For non-Open Access articles published, all supplemental material carries a non-exclusive license, and permission requests for re-use of supplemental material or any part of supplemental material shall be sent directly to the copyright owner as specified in the copyright notice associated with the article.