
Abstract
In this research note, we investigate the degree to which local governments reduced or expanded the budgets of police departments in the aftermath of the nation-wide protests organized by the Black Lives Matter movement during the summer of 2020. We also consider the political and social factors that might explain local councils’ decisions on the budget. In analyzing an original dataset of about 100 of the most populous U.S. cities, we do not find strong evidence of government efforts to “defund” the police. However, across various specifications of potential responsiveness to the movement's demands, we do find that mayoral partisanship may be associated with local government decisions to meaningfully reduce their police budgets or abstain from increasing them, but even this relationship may not be sustained in the longer term. Thus, we encourage more research on barriers that potentially inhibit local government responsiveness to social movements like Black Lives Matter.
Introduction
In the summer of 2020, the murder of George Floyd by Derek Chauvin, a Minneapolis police officer, along with several high-profile killings of Blacks at the hands of law enforcement, sparked a wave of protests organized by the Black Lives Matter (BLM) movement in more than 2,000 cities across the United States (Buchanan, Bui, and Patel 2020). One major aim of the protests was to direct attention to the disproportionate use of police aggression that communities of color, especially Black communities, deal with and the disparate and unequal treatment they encounter within the criminal justice system. Thus, participants within the BLM movement protests demanded significant reforms within law enforcement agencies, such as efforts to promote greater police accountability and de-militarize the police. One plea that received significant attention in the media was the call to “defund” the police—significantly reduce the budgets of police departments and redirect funds to other organizations within the city that, according to the protesters and critics, are better equipped to handle the problems police are ill-prepared to deal with.
Possible Local Government Responses
Why might we expect local governments to reduce their police budgets in efforts to respond to calls for defunding the police? For one, local government officials may respond to public opinion on an issue that has received national attention. At the time of the summer 2020 protests, at least two-thirds of Americans expressed some support for the BLM movement according to a Pew Research Center survey (Parker, Horowitz, and Anderson 2020). Research demonstrates the influential role of protests in eliciting responses from both state and national governments (Gillion 2013; Peay and McNair 2022). Furthermore, officials are more likely to respond to protest activities of marginalized groups than those of more privileged groups because such political participation is costly for the former and thus signals to officials the importance of the issues raised by the protests (Gause 2022).
However, local government officials may refrain from reducing or even increase the budgets of police departments for various other reasons. They may be troubled by the property destruction associated with some of the protests that have been highlighted in the media. Furthermore, elected officials may view public sympathy for the protests as temporary and hence not a sufficient motivating factor in significantly altering police budgets. In fact, research has supported the expectation of reduced support—while public support for the BLM movement at the height of the protests was significant, support among non-Black Americans has notably declined a year later (Horowitz 2021). Additionally, research has pointed to some challenging implications associated with defunding the police—many of the service calls that police departments take on might not be readily transferable to other organizations (Lum, Koper, and Wu 2021).
Perhaps then, it is not surprising that a recent study conducted by the Bloomberg CityLab found that the protests had minimal effects on the budgetary decisions of local councils (Akinnibi, Holder, and Cannon 2021). Specifically, the study concluded that major cities did not “defund” police departments as the Trump administration had claimed but instead maintained or expanded police budgets in the aftermath of the summer 2020 protests. While this is an important finding, the study only reported budget analyses of the 50 largest American cities. Further, the study did not consider additional factors that might have contributed to local governments’ decisions to decrease or increase police budgets. Thus, in this research note, we seek to answer two questions:
To what extent did local governments reduce or expand the budgets of police departments in the aftermath of the summer 2020 protests? What political and social factors explain local councils’ decision to do so?
Potential Factors Affecting Budgetary Decisions
While it makes sense to determine the degree to which an association exists between the protests themselves and the government's subsequent action on the budget, we do not undertake this analysis because at least one protest took place in all but three cities in our sample. Additionally, the three cities whose local media did not report a protest are located near major cities where protests did occur. Furthermore, given the significant national attention devoted to these protests, we assume that local government officials within our sample of cities were well-aware of the protests and the demands to defund the police. Thus, our analysis centers on other relevant factors that might be associated with government decisions on police budgets amidst a backdrop of heightened attention to the social unrest that was unfolding.
Partisan characteristics of elected officials may influence local government decisions, especially when responding to race-related concerns about policy. Despite increasing ideological diversity, Blacks are overwhelmingly more likely to identify with or lean toward the Democratic Party than the Republican Party (White and Laird 2020; Igielnik and Budiman 2020). Latin(x) constituents are also more likely to support Democrats than Republicans although to a lesser degree than are Blacks (Igielnik and Budiman 2020). Thus, elected Democratic officials, compared to their Republican counterparts, may be more receptive to the concerns of participants within the BLM movement. We, therefore, look at whether the partisanship of elected officials, particularly the
Descriptive representation matters for the substantive responsiveness of local government officials to the political interests of constituents of color (Browning, Marshall, and Tabb 1984; Marschall and Shah 2007). The number of women on the council also needs to meet a certain threshold before we expect gender to matter as well (Holman 2015). While we know that under certain conditions, city councils do not respond to Black and Brown residents as well as they do to White residents (Hoang 2019), we still account for the racial and gender composition of the local legislative body as well as the race and gender of the mayor as potential variables affecting decisions about police budgets. Additionally, minority and female police chiefs, along with rank-and-file minority and female police officers might support programs that address discrimination in police practices as they pertain to women and communities of color. This advocacy might influence local governments to provide more funding to police departments for these programs. On the other hand, research suggests that female police officers are less likely than their male counterparts to search drivers and hence more likely to reduce instances of negative interactions between police and civilians without sacrificing effective policing (Shoub, Stauffer, and Song 2021). Additionally, research suggests that the appointment of Black police chiefs under circumstances of mandates for reform also lessens the probability of searches and hence reduces negative policing outcomes (Shoub and Christiani 2022). Finally, some studies have found that a more diverse police force in terms of race and ethnicity is associated with fewer stops/arrests, and a more gender-diverse police force is associated with less use of force (Ba et al. 2021). While these findings might insinuate reduced police effort in some lines of work, the implications of these findings for police budgets are not entirely clear. Thus, we also consider the police chief's race and gender and the police force's racial and gender composition as factors potentially shaping local budgetary decisions.
We also investigate how other factors might influence decisions about local expenditures on the police. The structure of local government might matter for responsiveness to the demands of social movements. Specifically, compared to strong mayor systems, reform-style governments may be less responsive to the political demands of protest movements due to the original aims of reform governments to promote organizational efficiency and political neutrality (Hinze and Judd 2018). Thus, we control for local government structure—strong-mayor, council-manager, or other systems (e.g., commissioner, hybrid, etc.). Local elected officials may be inclined to take seriously the demands of the BLM movement if the city contains a large share of Black residents. Therefore, we also consider a potential relationship between the percent of the city's residents that are Black and council budgetary decisions. Furthermore, relying on Warshaw and Tausanovitch's (2022) dataset on subnational ideology scores, we control for the ideological predisposition of each city as liberal cities may be more receptive to the demands of the BLM movement than cities with more politically conservative residents. Additionally, we consider how changes in crime rates from 2018 to 2019 may induce city governments to provide more or less funding to the police. Finally, we look at how changes in police budgets from fiscal year 2019 to fiscal year 2020 (FY2019 to FY2020) might affect increases or decreases in police budgets from FY2020 to FY2021.
Measuring Budgetary Action
We employ several dependent variables in our analyses. Municipal budget documents usually report year-to-year changes in law enforcement budget as changes in absolute terms—by subtracting the dollar amount of the police budget in the previous year from the dollar amount in the current year and then dividing the resulting difference by the previous year's dollar amount. However, a disadvantage in relying on this change as a measure of “responsiveness” to the BLM protests is that if a significant number of councils had decreased their police budgets in absolute terms in FY2021, many of these reductions may have been attributed to the stress that the COVID pandemic had caused to their budgets. Additionally, even if the absolute dollar amount of a given city's police budget decreased in FY2021, this decrease may not be satisfactory for critics if local governments were also slashing in absolute terms the budgets of many other departments and especially if, despite an absolute decrease, the proportion of the budget reserved for law enforcement agencies remained constant or even increased.
Thus, instead of relying on a measure captured by police budget changes in absolute dollar terms, we consider police budget increases or decreases relative to the overall city budget. Specifically, our first dependent variable reflects the change from FY2020 to FY2021 in the percent of the city's total budget that is dedicated to the police department. Because this measure accounts for how councils prioritize police budgets relative to other departmental budgets, it is better suited than the previously mentioned one to capture potential council responsiveness to the BLM protests, which was occurring alongside a pandemic that further strained municipal budgets. For the city's total budget, we report the amount that is given as the city's official overall budget/expenditures/appropriations on its public budget document—in most cases, this amount also corresponds to reports in the local media.
2
The value for the dependent variable is calculated simply by subtracting the percent of the budget allocated to police departments in FY2020 from the percent of the budget dedicated to the police in FY2021. The following information from Boise, Idaho demonstrates how we calculated the change in the police share of the total budget from FY2020 to FY2021.
FY2020 budget information Police budget: $70,006,493 Total operating budget: $764,680,965 FY2021 budget information Police budget: $71,179,598 Total operating budget: $730,492,755
Thus, the change in Boise ID police portion of the total budget would be an increase of 0.589% from FY2020 to FY2021.

While this measure may have virtues over the previous one discussed, some disadvantages still exist. First, the implication of this variable is that because City A reduced the police portion of the budget more than City B did, City A might be characterized as being more “responsive” than City B to the demands of the protesters. However, can City A be characterized as “responsive” if City A merely reduced the police share of the budget by a value of 0.02%? It may depend on the average or median decrease imposed by other cities as well. Furthermore, for City A, decreasing the police share of the budget may not necessarily reflect action based on sympathetic concerns for the issues raised by BLM but merely remaining on a trajectory toward the continuous decrease of the police budget that was initiated years before.
Therefore, our second dependent variable is a categorical variable that incorporates information about appropriations in past fiscal years. This dependent variable not only focuses on the police budget as a proportion of the overall budget but also changes in the police share of the budget from year to year. Because the dollar amount of police and overall budgets rarely stays constant from year to year and because we are considering budget changes over three transition periods, FY2018–FY2019, FY2019–FY2020, and FY2020–FY2021, changes in the police budget as a percent of the overall budget will reflect one of eight possible outcomes: (1) increase, increase, increase; (2) increase, decrease, increase; (3) decrease, decrease, increase; (4) decrease, increase, increase; (5) increase, increase, decrease; (6) decrease, increase, decrease; (7) increase, decrease, decrease; (8) decrease, decrease, decrease.
The categories of this variable capture increases or decreases in the police share of the budget that might reflect potential types of responsiveness to the demands of the BLM movement: negative, neutral, or positive. What might be considered a meaningful or significant change in the budget that reflects a potentially negative response? An increase in the police portion of the budget from FY2020 to FY2021 may not necessarily reflect a negative response to the protests but rather a trajectory toward providing more funding to law enforcement agencies, normal trends in budget cycles, and so on. However, we can make a reasonable argument that perhaps a trend toward decreasing the police portion of the budget from FY2018 to FY2020 that is reversed in 2021 (outcome 3) might reflect a meaningful increase. On the other hand, while it is more difficult to defend outcomes 1, 2, and 4 as strong cases of negative responsiveness, we should not discount the possibility that, for example, a continuous trend of increases might still suggest a negative response to the protests. While most year-to-year changes that cities made to the police share of the budget were not substantial—the median increase or decrease was less than 0.50% across the years—some local governments increased the police share of the budget in FY2021 that resulted in the share being 1% more than in the previous year. Furthermore, in almost all instances in which the increase from FY2020 to FY2021 was more than 1%, this increase was significantly larger than the increase in previous transitions from one budget year to another. We, therefore, take an increase of over 1% from FY2020 to FY2021 to be relevant and consider this increase as a potential negative response to the protests. 3 Thus, we operationalize potential negative responsiveness as reversals in the trend toward continuous budget decreases OR as circumstances in which the police share of the budget is 1% more than in FY2020 (e.g., the police share increases from 7% of the total budget to 8%).
Similarly, a potentially positive response would not capture all circumstances of decreases in the police share of the FY2021 budget because some decreases may simply reflect a path toward decreasing the police budget or usual trends in budget changes. However, again we can make a reasonable argument that a trend toward increasing the police portion of the budget that is reversed in FY2021 (outcome 5) might suggest a positive reaction to the protests. Additionally, since the median and mean decrease was less than 1% across the fiscal years, we also categorize as potentially positive responses instances in which the police percent of the budget was 1% less than in FY2020. All other outcomes (1, 2, 4, 6, 7, and 8) are coded as potentially “neutral” responses.
Again, using data from the city of Boise, Idaho, we illustrate how categories in this variable are determined. The city of Boise decreased the police budget share by a value of 1.232% from FY2018 to FY2019, increased this share by a value of 0.273% from FY2019 to FY2020, and increased this share by a value of 0.589% from FY2020 to FY2021. This trajectory did not experience an increase in funding during FY2021 after a period of decreases occurring over two consecutive transitions. Also, the change in the police portion of the budget in the transition to the FY2021 budget year was not substantial (less than 1%). Thus, the responsiveness of the city of Boise would be categorized as neutral (neither positive nor negative).
Dataset and Analysis
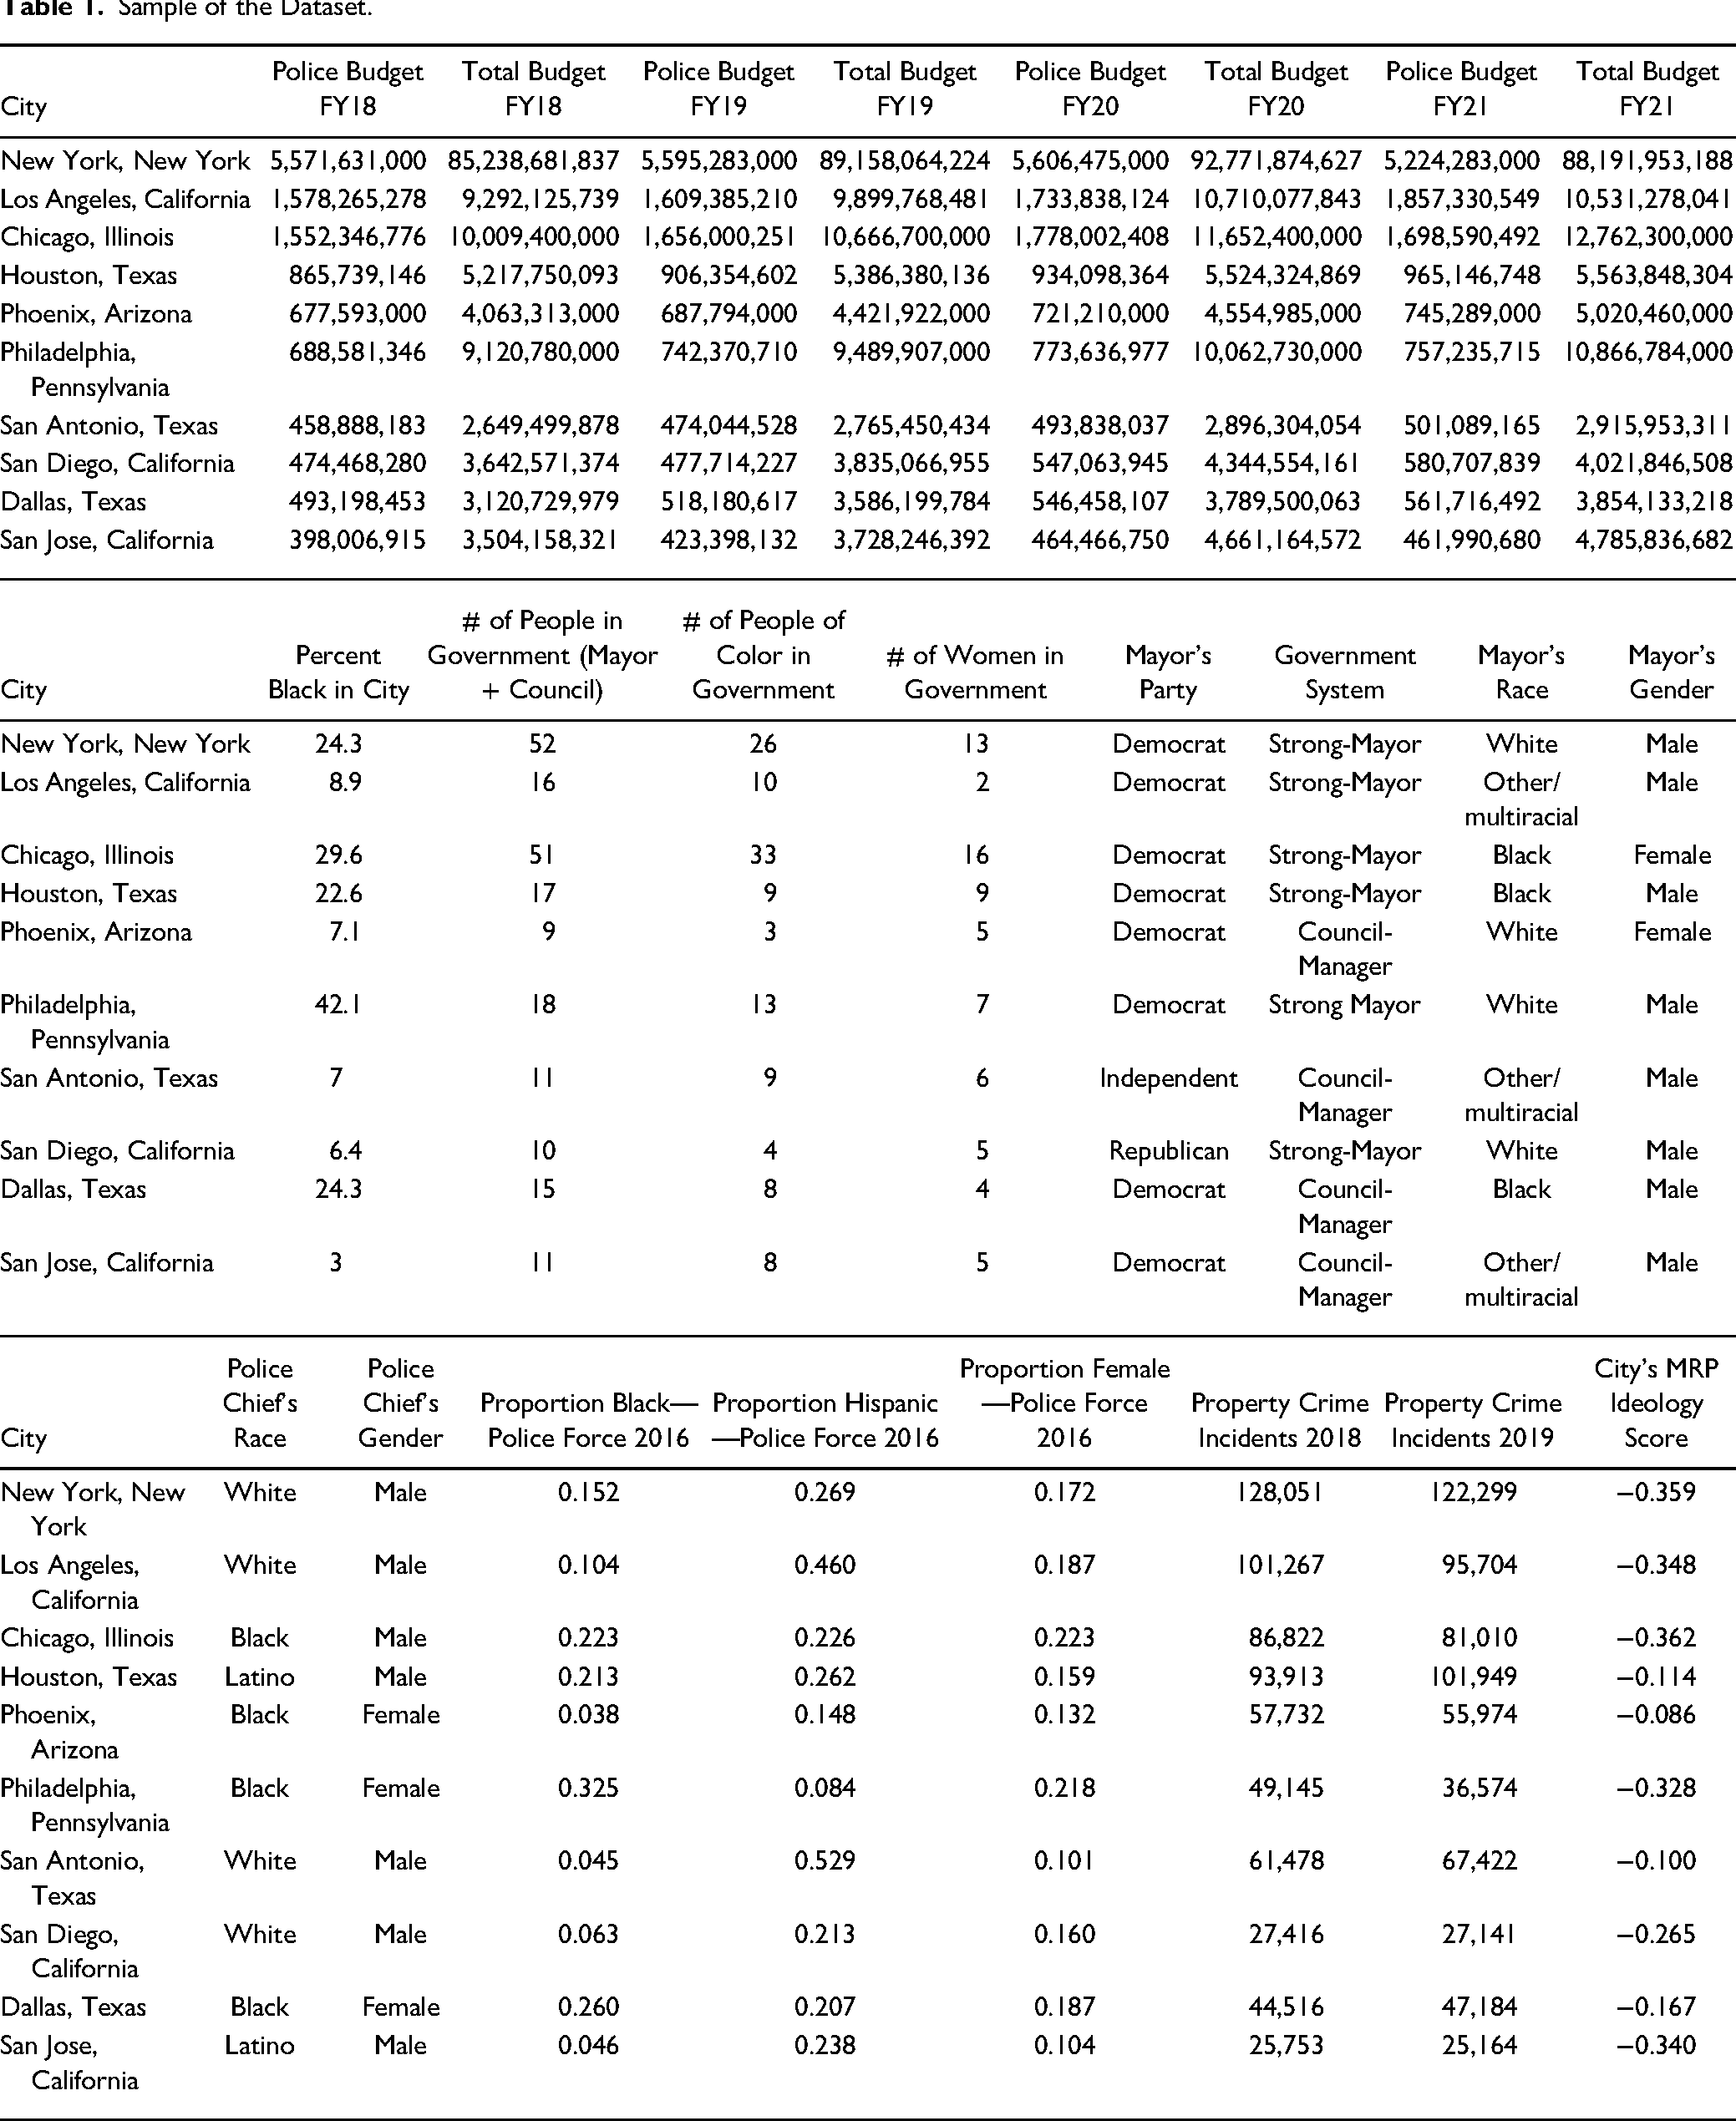
We constructed an original dataset containing information compiled from various sources on 102 of the most populous U.S. cities. We searched through each city's official government website and collected information on police budgets as well as total expenditures/appropriations for each fiscal year from 2018 to 2021. Most of the budget documents also contained information about the elected officials in that given fiscal year, so we were able to gather information about the race and gender of the local legislators and mayors. 4 We also collected demographic information about police chiefs from each city government's website. We gathered information about the mayoral partisanship from the website, Ballotpedia, a digital encyclopedia of American politics and elections that also compiles and updates information about the mayoral partisanship of the 100 most populous American cities. Population statistics and racial composition of each city were compiled from the United States Census Bureau's website (United States Census Bureau City and Town Population Total: 2010–2019; United States Census Bureau QuickFacts). We computed the racial and gender composition of each city's police force from data provided by the most recent Law Enforcement Management and Administrative Statistics (United States Department of Justice LEMAS 2016), a dataset that houses information on the demographic characteristics of personnel in local and county law enforcement agencies across the country. We compiled information about crime statistics for each city from 2016 to 2019 utilizing the Federal Bureau of Investigation's Crime Data Explorer (United States Federal Bureau of Investigation 2016–2020). Finally, after collecting the information above, we merged our dataset with the dataset on subnational ideology compiled by Warshaw and Tausanovitch (2022). 5 Table 1 provides a preview of our dataset by displaying some of the pertinent information on the ten largest cities. 6
Sample of the Dataset.
We used linear regression (OLS) models to estimate the association between the independent variables and the percent change in the police share of the budget from FY2020 to FY2021. We used a multinomial logit regression to estimate the association between the covariates and various categories of potential government responsiveness (positive, negative, or neutral) over the FY2018–FY2021 period.
Results
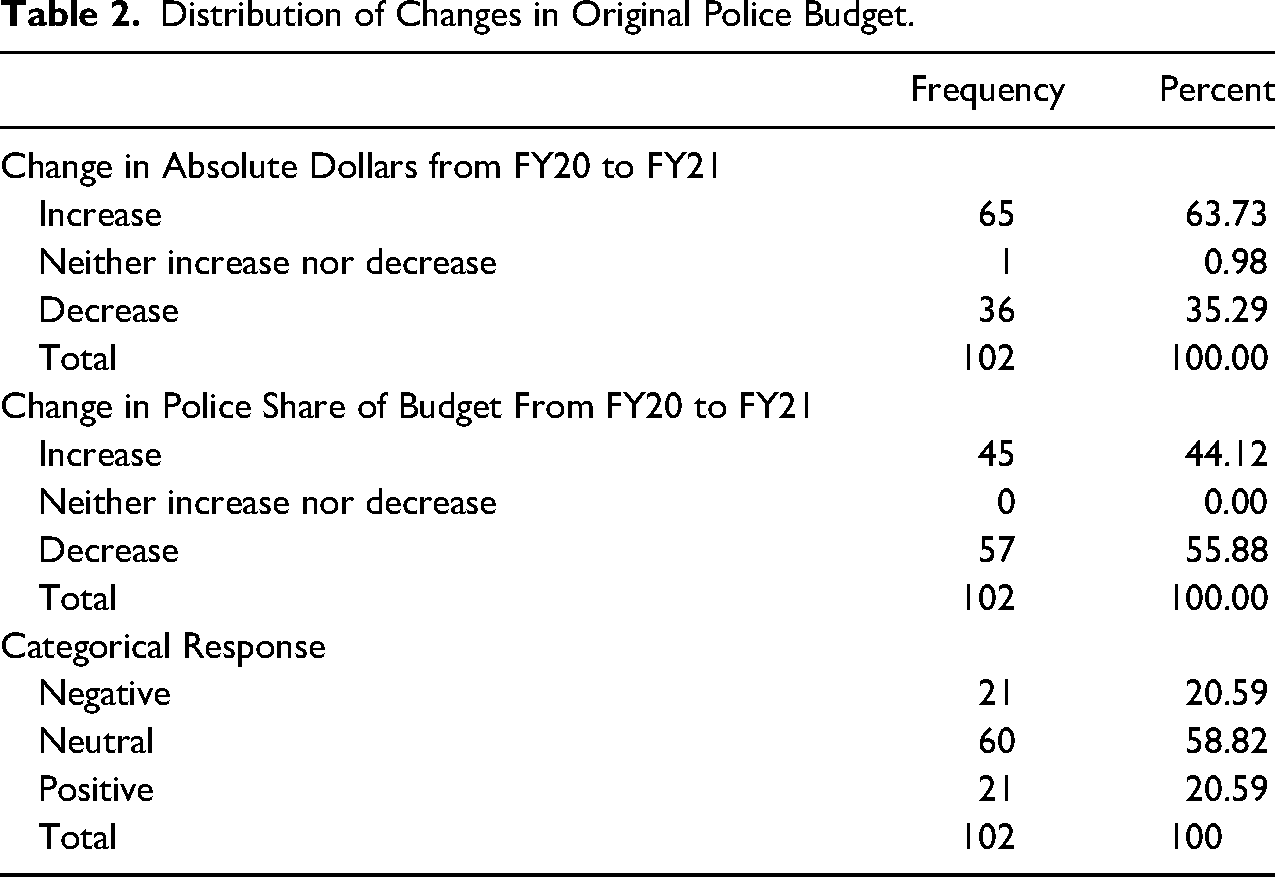
Table 2 shows the extent to which local governments reduced or expanded the police budgets according to different criteria for budget changes. In terms of budget changes in absolute dollars, about 35% of the cities in the sample reduced their police budgets in FY2021. In terms of changes in the police share of the total budget, about 57% of the cities in the sample reduced their police budgets. While this percent may seem large, these reductions were not substantial as only fifteen cities decreased the police share of the budget by a value of more than 1% (the average and median decrease was 0.876% and 0.720%, respectively). When a meaningful budget reduction is defined as either a decrease in the police share of the FY2021 budget following a trajectory of increases OR a reduction of the share by a value of over 1% during the FY20/FY21 transition period, only 21% of cities fit this criterion. The results from Table 2 support previous research findings that many of the largest American cities did not alter their police budgets in ways that would have been satisfactory to the protesters and critics of police spending within the BLM movement (Akinnibi, Holder, and Cannon 2021).
Distribution of Changes in Original Police Budget.
Although many cities were not “defunding” the police, certain factors are associated with reductions in the police budget, depending on which of our dependent variable is being considered. Under Model 1 in Table 3, mayoral partisanship and changes in the police share of the budget from FY2019 to FY2020 has a statistically significant effect on the dependent variable, measured by FY2020–FY2021 changes in the police share of the city budget. In general, when cities increase the police share of the budget, cities with Democrat mayors increase this share less by a value of 1.281% than do cities with non-Democrat mayors. When cities decrease the portion of the budget dedicated to law enforcement, cities with Democrat mayors decrease this share more by a value of 1.281% than do cities with non-Democrat mayors. Also, cities that experienced an increase (or decrease) in the police share of the budget from FY2019 to FY2020 experienced a lesser increase (or larger decrease) in their police budgets from FY2020 to FY2021.
Linear Models Predicting Change in Police Share of Budget From FY2020 to FY2021.
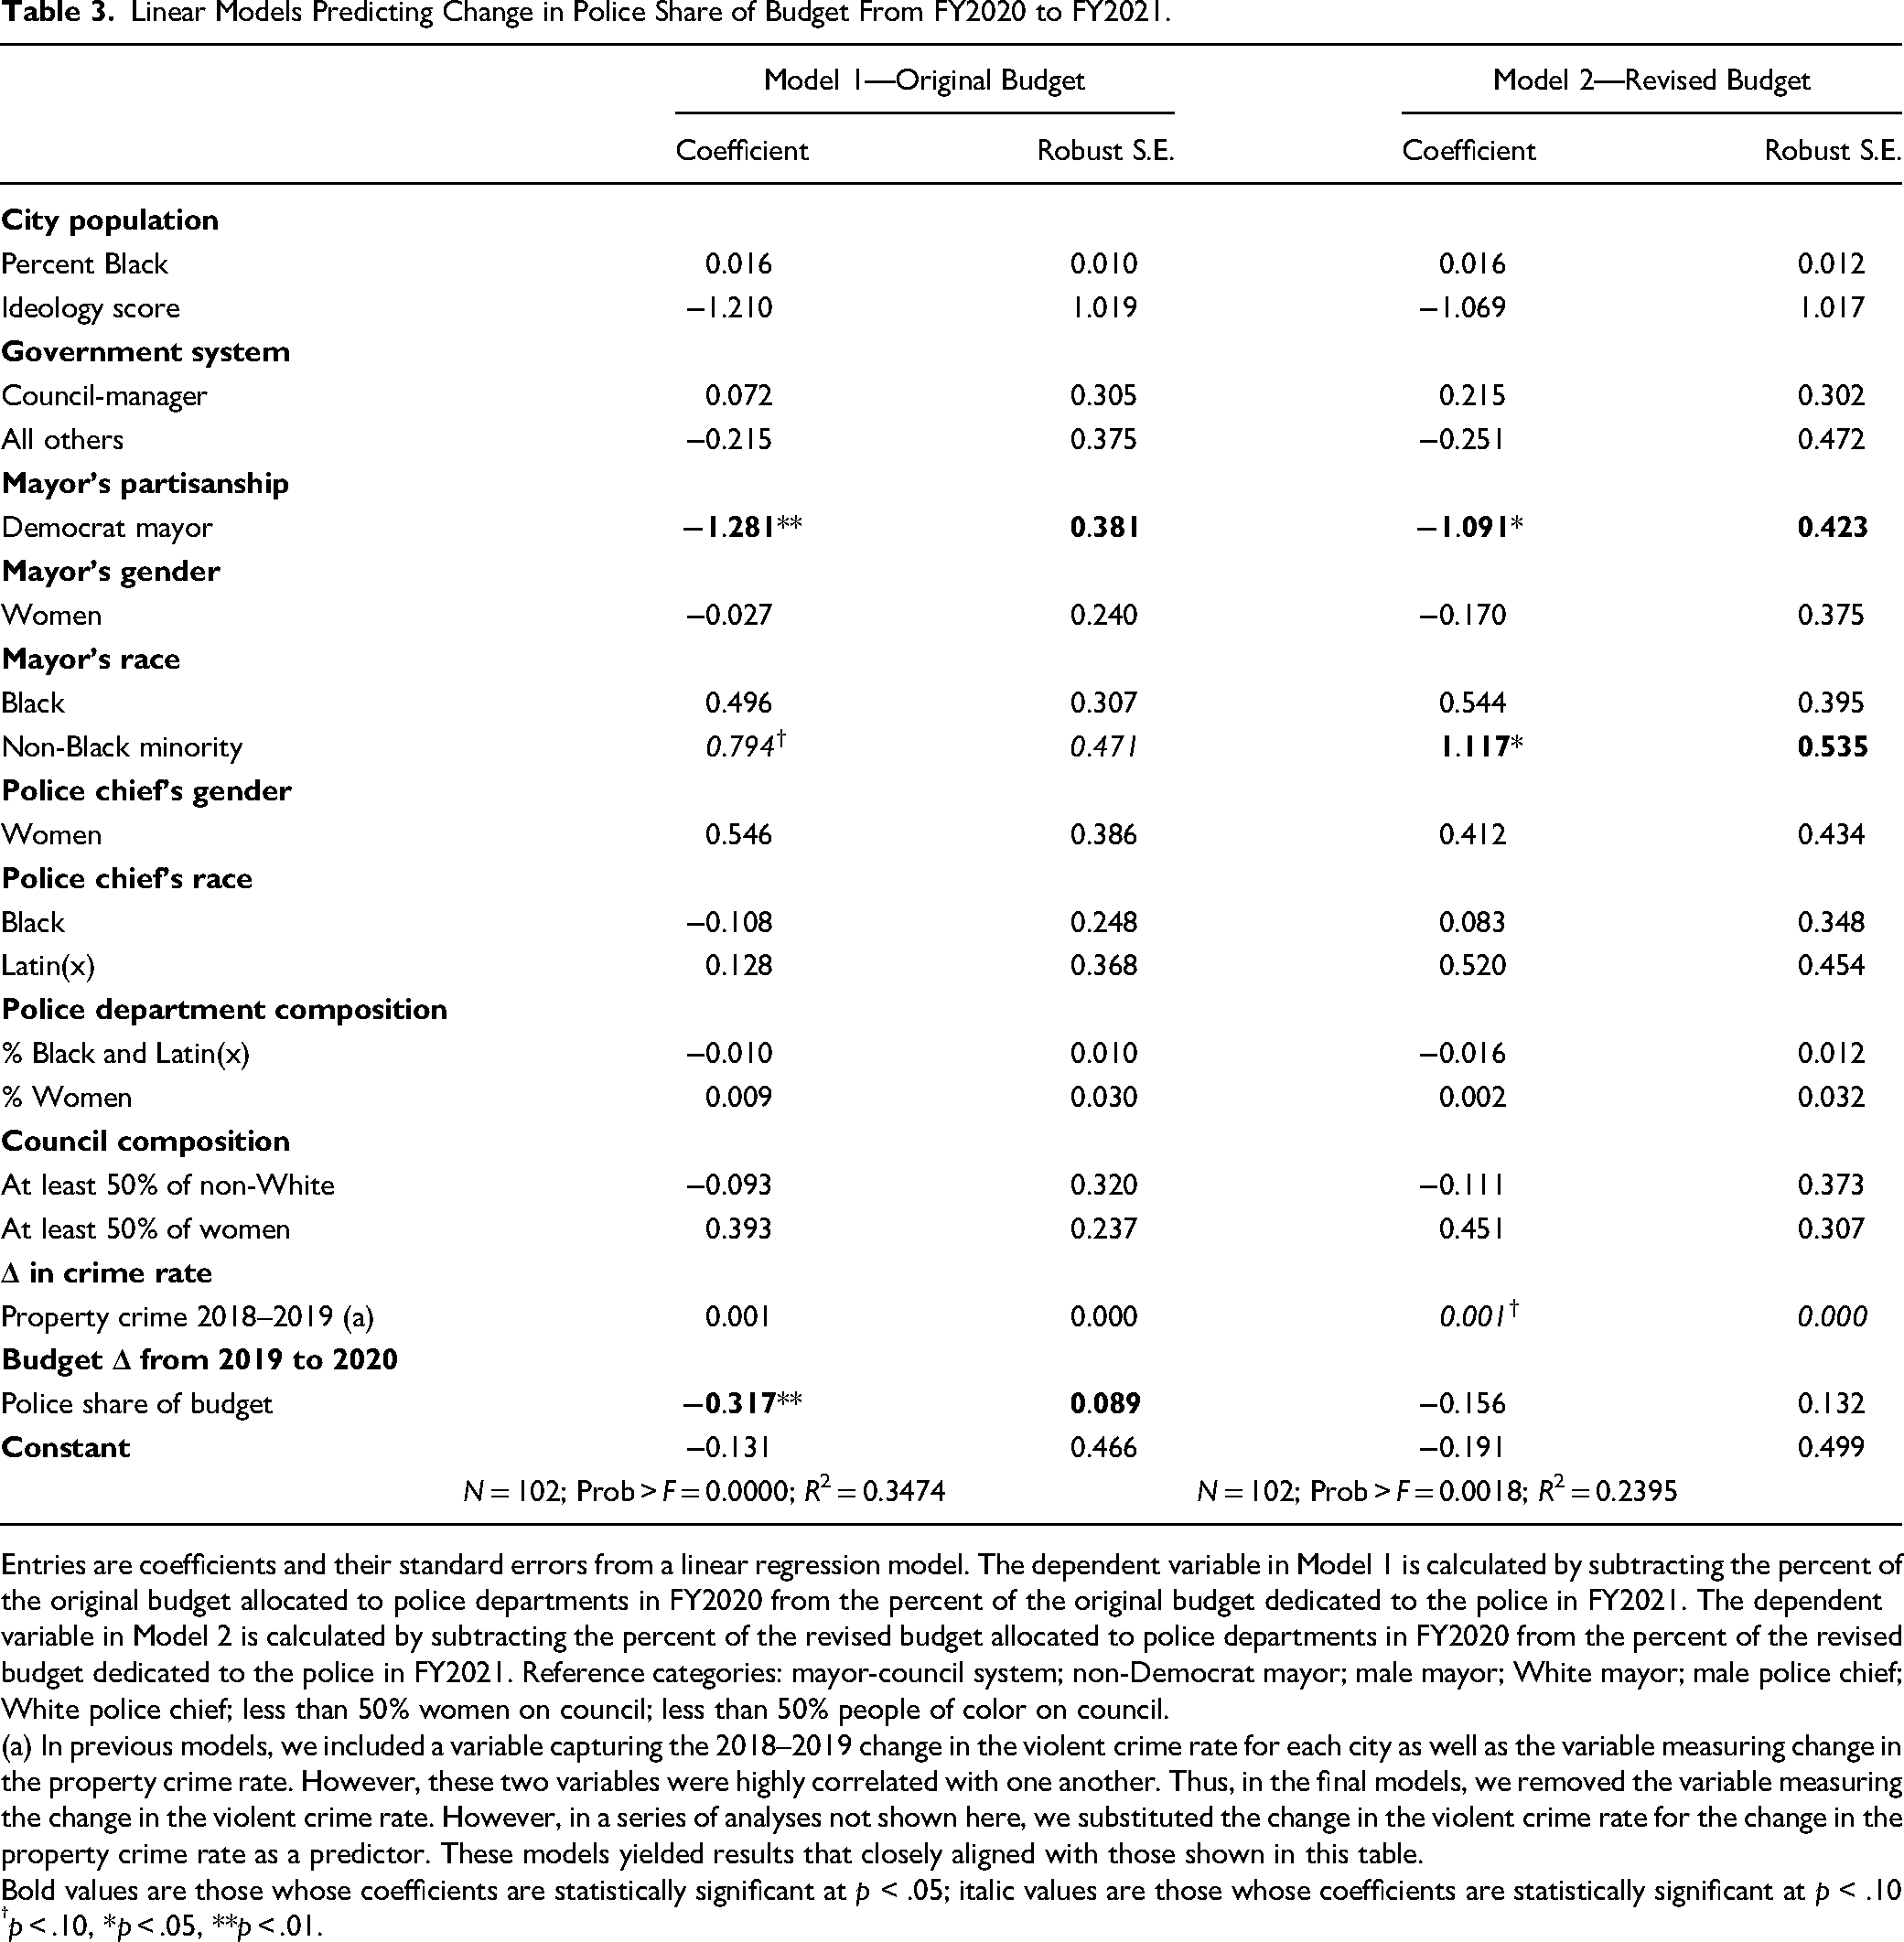
Entries are coefficients and their standard errors from a linear regression model. The dependent variable in Model 1 is calculated by subtracting the percent of the original budget allocated to police departments in FY2020 from the percent of the original budget dedicated to the police in FY2021. The dependent variable in Model 2 is calculated by subtracting the percent of the revised budget allocated to police departments in FY2020 from the percent of the revised budget dedicated to the police in FY2021. Reference categories: mayor-council system; non-Democrat mayor; male mayor; White mayor; male police chief; White police chief; less than 50% women on council; less than 50% people of color on council.
(a) In previous models, we included a variable capturing the 2018–2019 change in the violent crime rate for each city as well as the variable measuring change in the property crime rate. However, these two variables were highly correlated with one another. Thus, in the final models, we removed the variable measuring the change in the violent crime rate. However, in a series of analyses not shown here, we substituted the change in the violent crime rate for the change in the property crime rate as a predictor. These models yielded results that closely aligned with those shown in this table.
Bold values are those whose coefficients are statistically significant at p < .05; italic values are those whose coefficients are statistically significant at p < .10
p < .10, *p < .05, **p < .01.
When budgetary changes are conceptualized as possible categories of responsiveness, several factors are significantly associated with the likelihood of a potentially negative, neutral, or positive response. The coefficients of multinomial logit models are less intuitive to interpret—the coefficients convey the log odds of responding negatively or neutrally relative to responding positively for each variable in the model. However, marginal effects relay the differences among the various categories of each variable in their absolute probabilities of responding negatively, positively, or neutrally.
Again, the partisanship of the mayor matters, as shown in Model 1 of Table 4. The coefficient reveals that compared to cities without Democrat mayors, those led by Democrat mayors are less likely to respond negatively than positively. More specifically, according to Figure 1, the probability of a potentially negative response (substantive increases in the police budget) is 0.149 for cities led by Democrat mayors but increases to 0.302 for cities without such mayors (although this difference is marginally significant at p < .10). On the other hand, the probability of a potentially positive response—a meaningful reduction in the police budget—is 0.303 for cities led by Democrat mayors but decreases to 0.088 for cities with non-Democrat mayors.
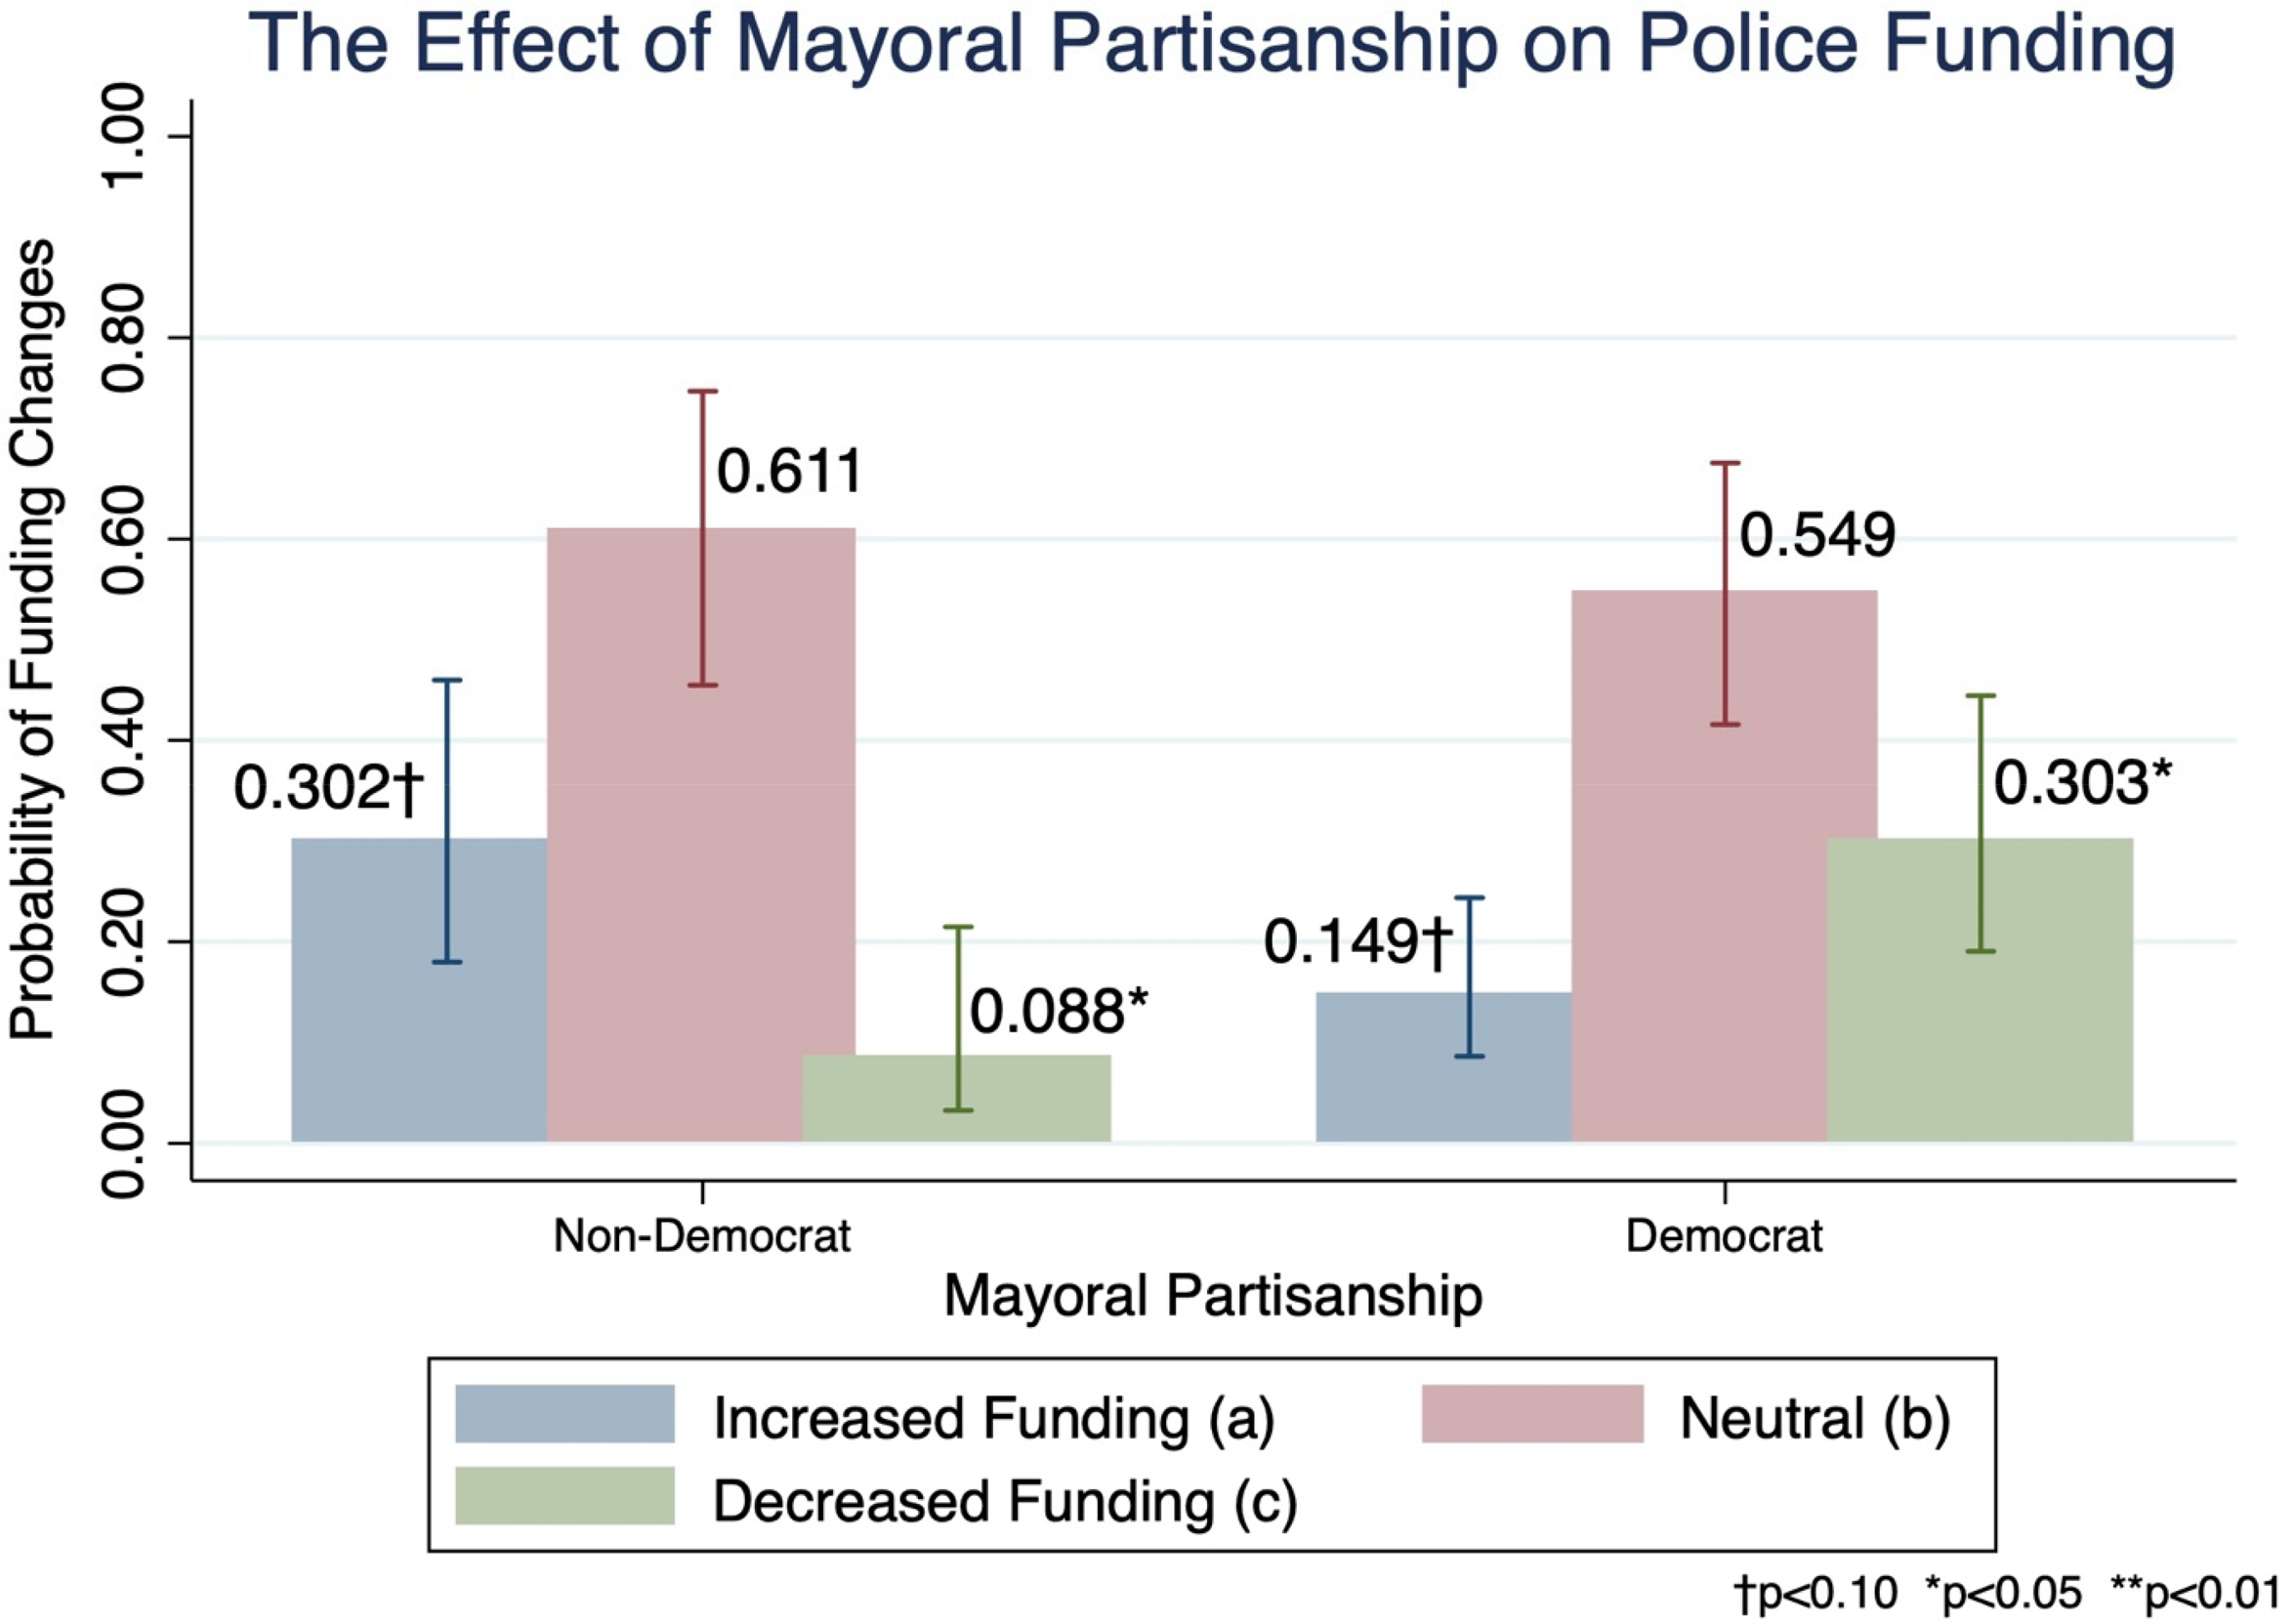
(a) Increased funding (potentially negative response)—police share of the budget followed a trajectory of decreased funding (FY2018–FY2019), decreased funding (FY2019–FY2020), increased funding (FY2020–FY2021) OR police share of the budget increased by a value of more than 1% from FY2020 to FY2021. The difference between cities with non-Democrat mayors and those with Democrat mayors is marginally significant at p < .10. (b) Neutral funding—police share of the budget did NOT follow a trajectory in (a) or (c) and police share of the budget did NOT increase or decrease substantially from FY2020 to FY2021. (c) Decreased funding (potentially positive response)—police share of the budget followed a trajectory of increased funding (FY2018–FY2019), increased funding (FY2019–FY2020), decreased funding (FY2020–FY2021) OR police share of budget decreased by a value of more than 1% from FY2020 to FY2021. The difference between cities with non-Democrat mayors and those with Democrat mayors is significant at p < .015.
Multinomial Regression on Budgetary Decisions.
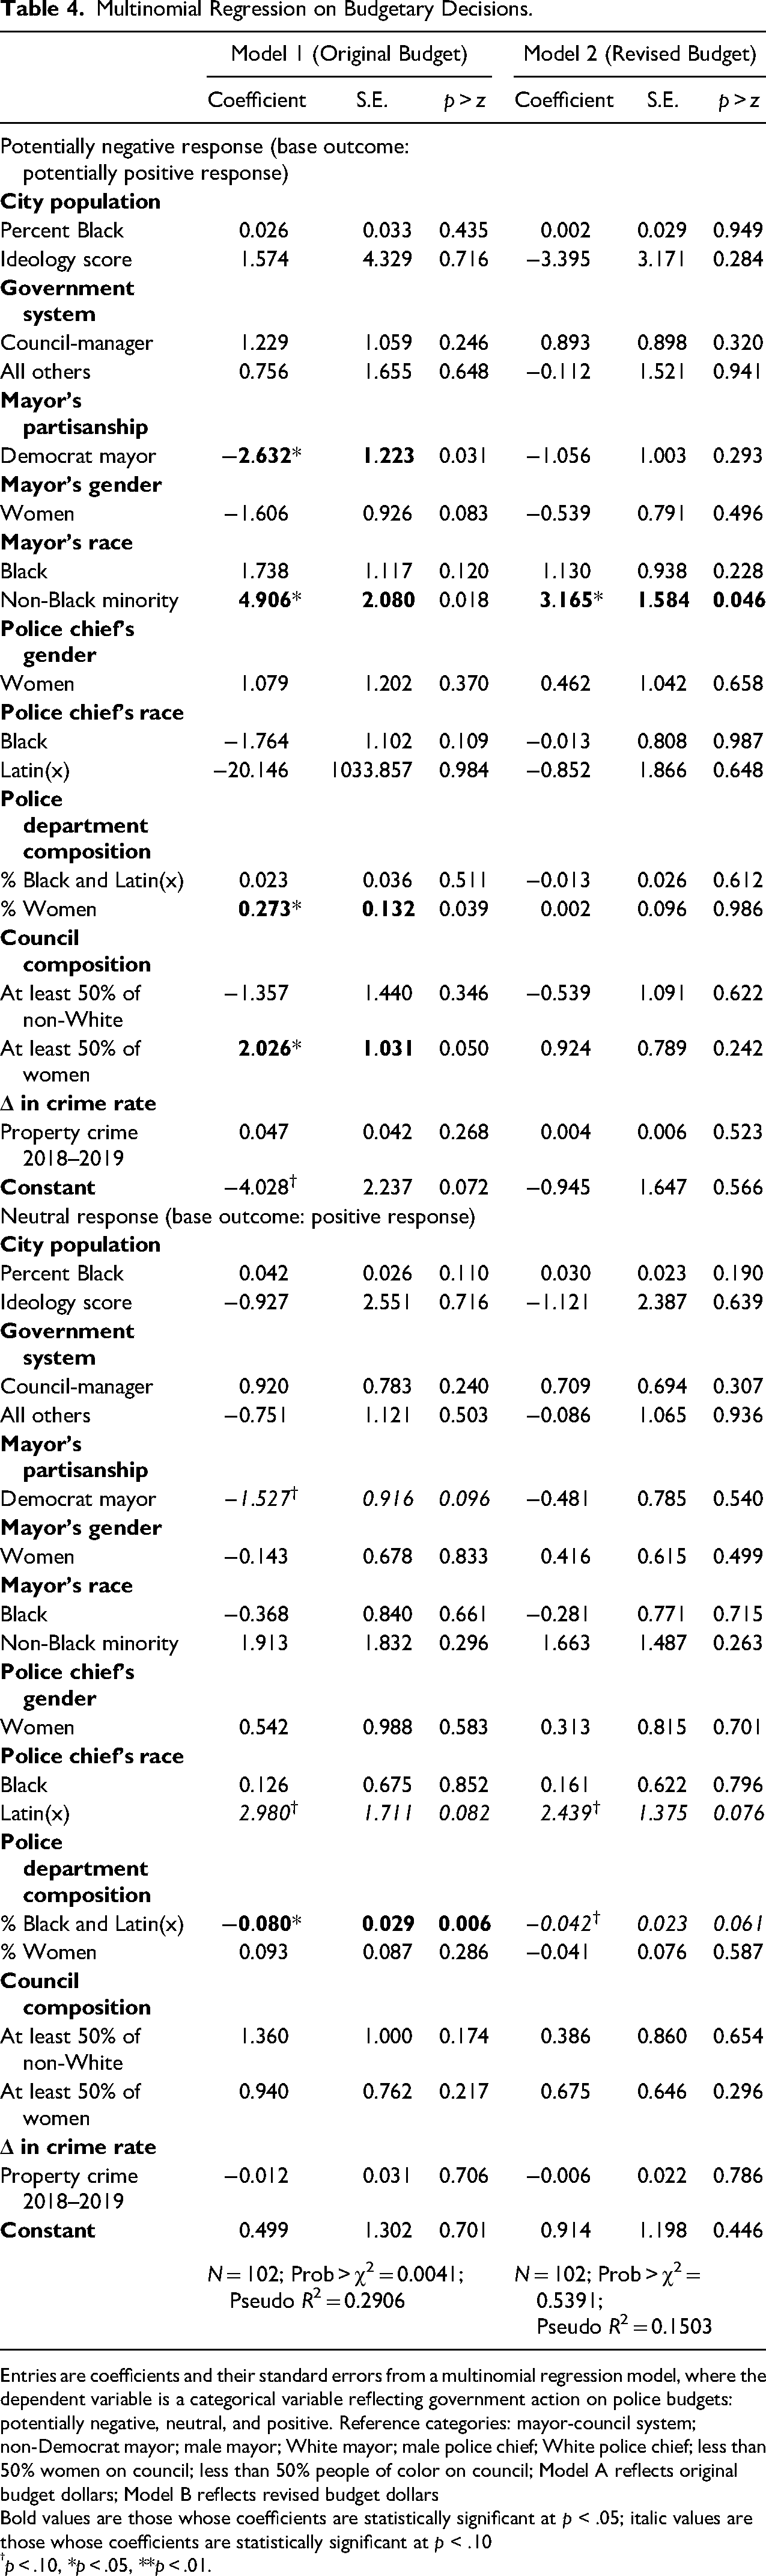
Entries are coefficients and their standard errors from a multinomial regression model, where the dependent variable is a categorical variable reflecting government action on police budgets: potentially negative, neutral, and positive. Reference categories: mayor-council system; non-Democrat mayor; male mayor; White mayor; male police chief; White police chief; less than 50% women on council; less than 50% people of color on council; Model A reflects original budget dollars; Model B reflects revised budget dollars
Bold values are those whose coefficients are statistically significant at p < .05; italic values are those whose coefficients are statistically significant at p < .10
p < .10, *p < .05, **p < .01.
Model 1 in Table 4 also shows that cities with non-Black minority mayors are more likely than cities led by White mayors to respond negatively rather than positively. However, cities led by non-Black minority mayors constitute approximately 15% of the sample (fifteen cities). While this number is not exceptionally small, generalizing from results associated with non-Black mayors is difficult because these mayors do not share the same race or ethnicity—some identify as Asian while others identify as Hispanic or multiracial. Thus, the results here should be interpreted with caution.
Figure 2 reveals differences in the council's gender composition: cities with less than 50% women on the council (minority-female council) are more likely than cities with majority-female councils to respond positively. The probability of substantively decreasing the police budget share is 0.259 for minority-female councils but decreases to 0.114 for majority-female councils. On the other hand, there are no statistically significant differences between minority-female and majority-female councils in the propensity to respond neutrally or negatively.
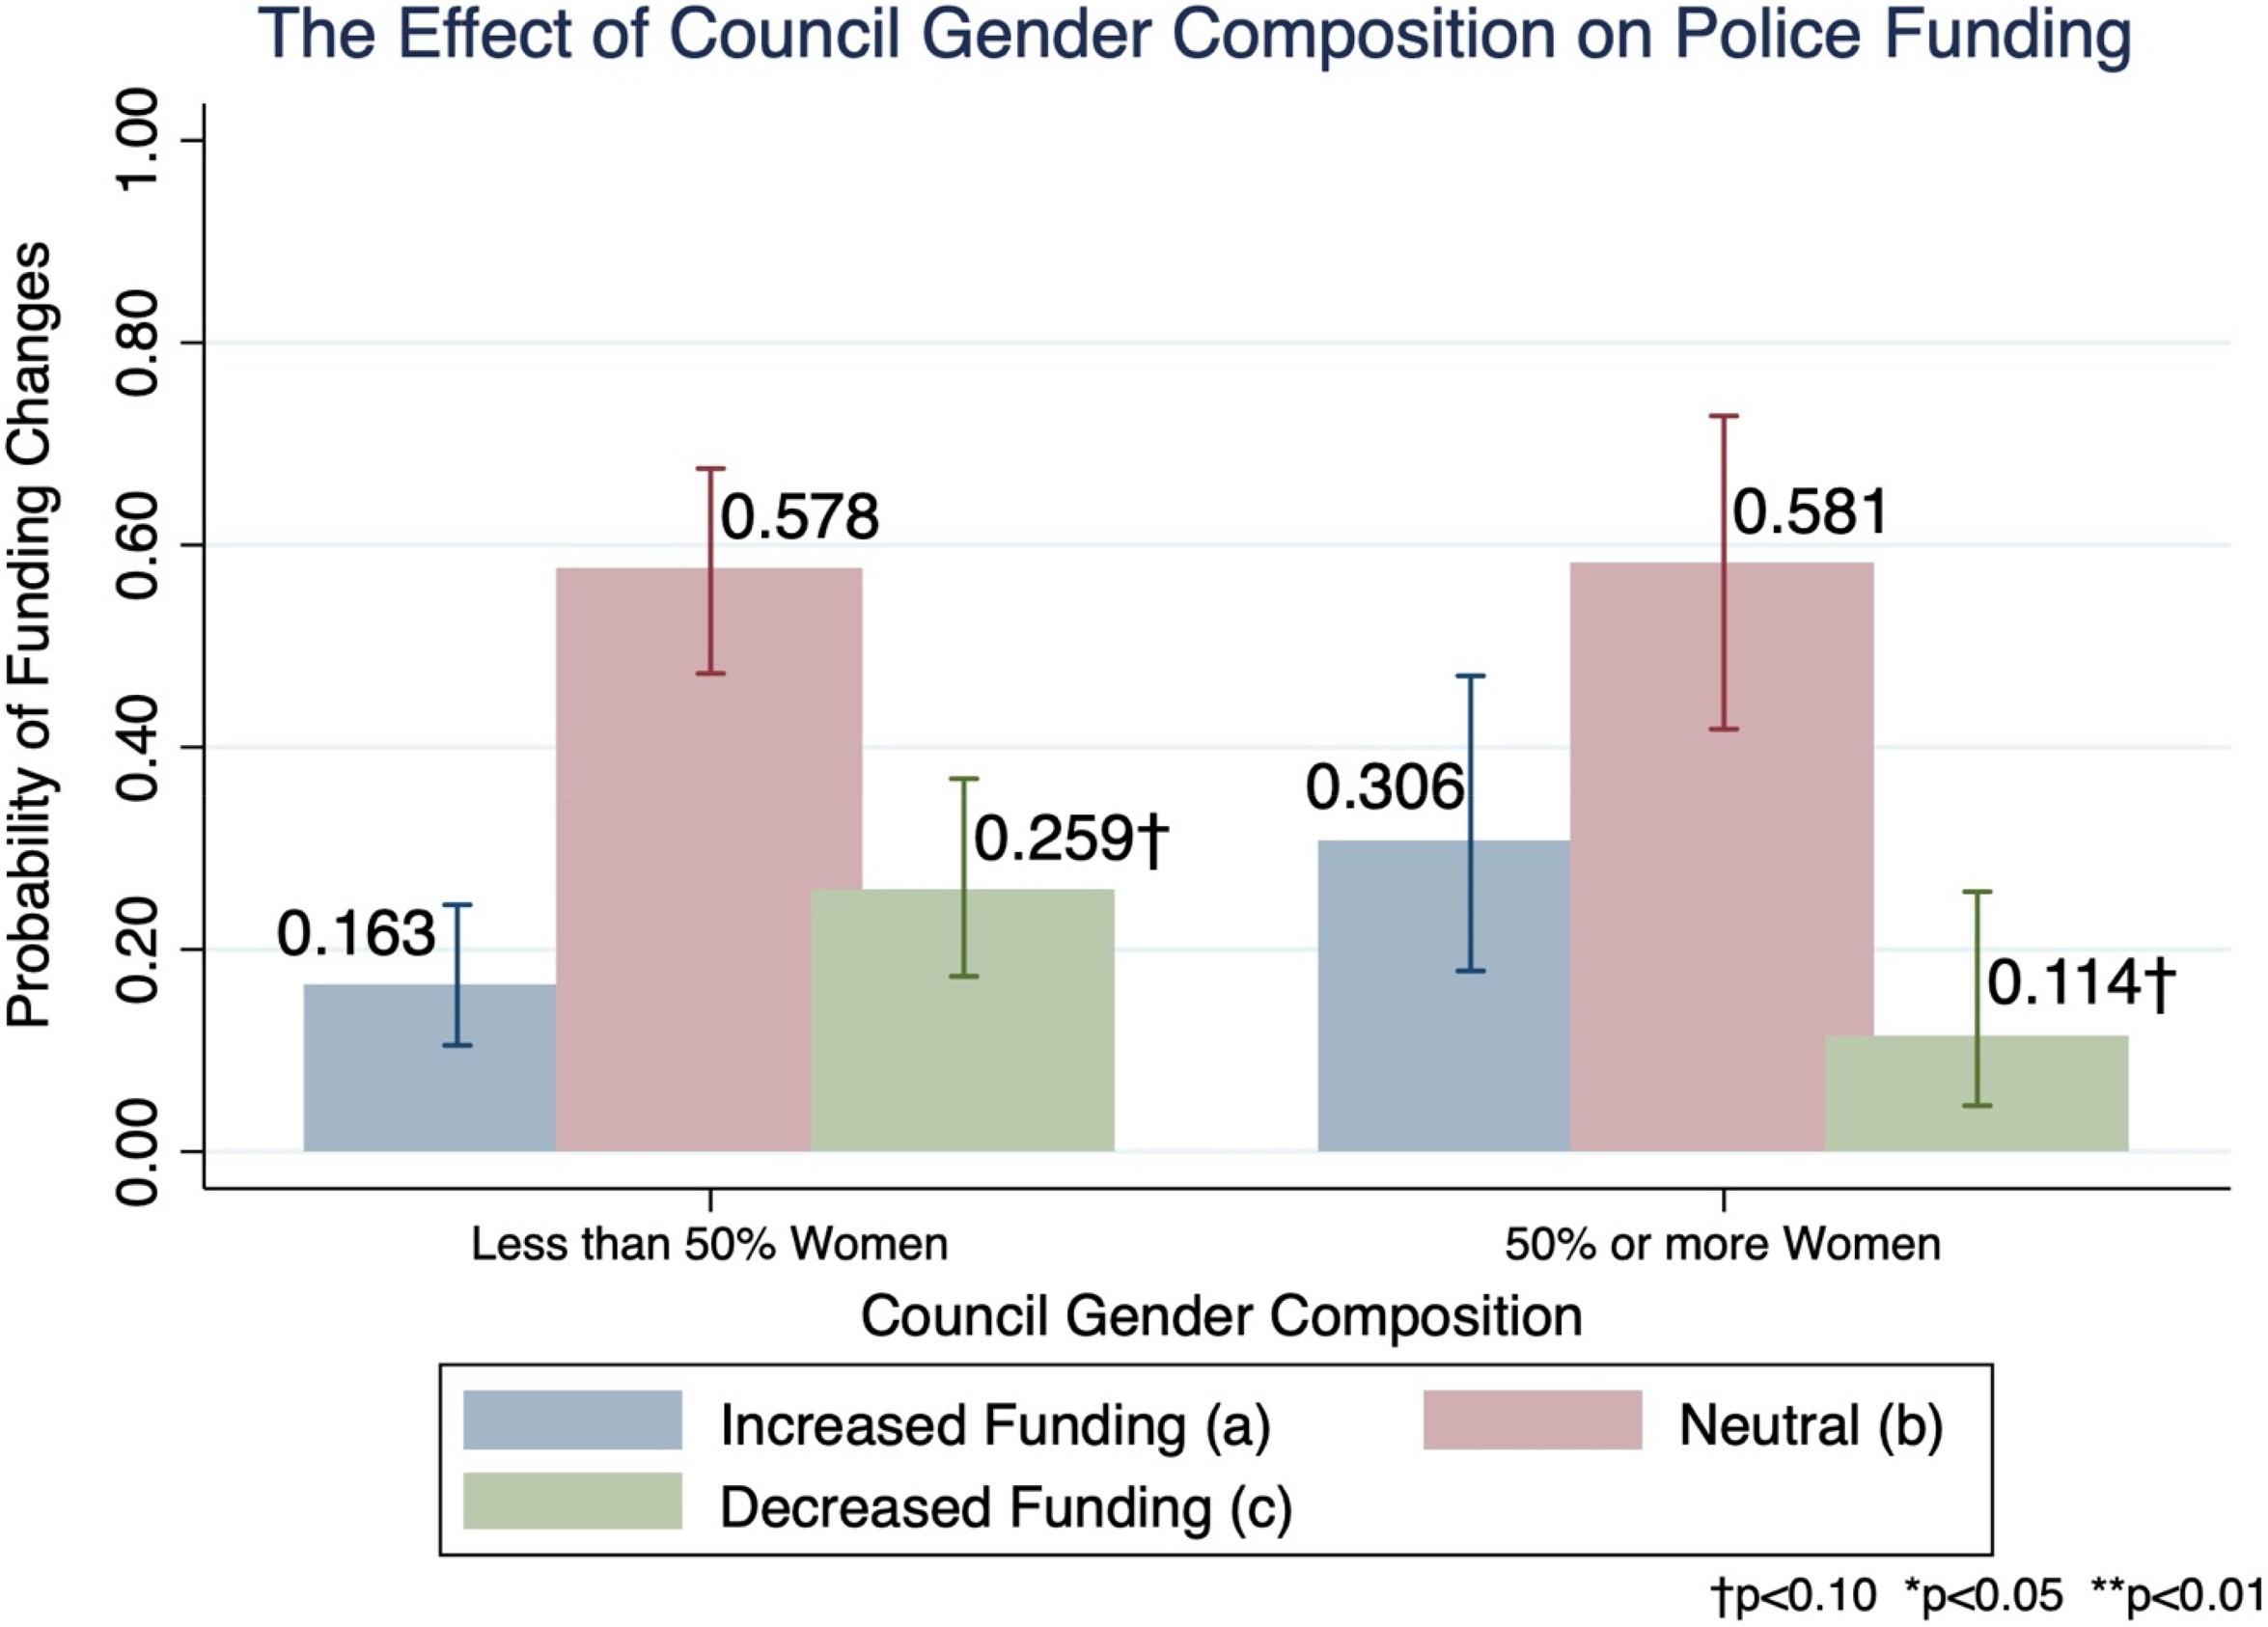
(a) Increased funding (potentially negative response)—police share of the budget followed a trajectory of decreased funding (FY2018–FY2019), decreased funding (FY2019–FY2020), increased funding (FY2020–FY2021) OR police share of the budget increased by a value of more than 1% from FY2020 to FY2021. (b) Neutral funding—police share of the budget did NOT follow a trajectory in (a) or (c) and police share of the budget did NOT increase or decrease substantially from FY2020 to FY2021. (c) Decreased funding (potentially positive response)—police share of the budget followed a trajectory of increased funding (FY2018–FY2019), increased funding (FY2019–FY2020), decreased funding (FY2020–FY2021) OR police share of budget decreased by a value of more than 1% from FY2020 to FY2021. The difference between non-majority female councils and majority female councils is significant at p < .055.
The racial and gender composition of the police force also matter for substantive increases or decreases in the police share of the budget. The coefficient in Table 4 Model 1 shows that as the female composition of the police force increases, the likelihood of a negative response relative to a positive one also increases. Figure 3 demonstrates that as the female share of the police force increases by one %, the probability of a potentially negative response increases by a value of 0.021. However, in cities where women constitute 10% or less of police officers, a change in the gender composition of the police force has no statistically significant effect on police funding (as evidenced by the significantly overlapping confidence intervals). Similarly, in cities where female officers constitute at least 20% of the force, increasing the proportion of female officers does not increase the probability of more police funding. Rather the notable difference is between police departments with less than 10% female officers and those with at least 20% female officers—the probability of increased police funding (negative response) is 0.137 for cities where women constitute 10% of police officers but increases to 0.338 for cities with female officers comprising at least 20% of the department.
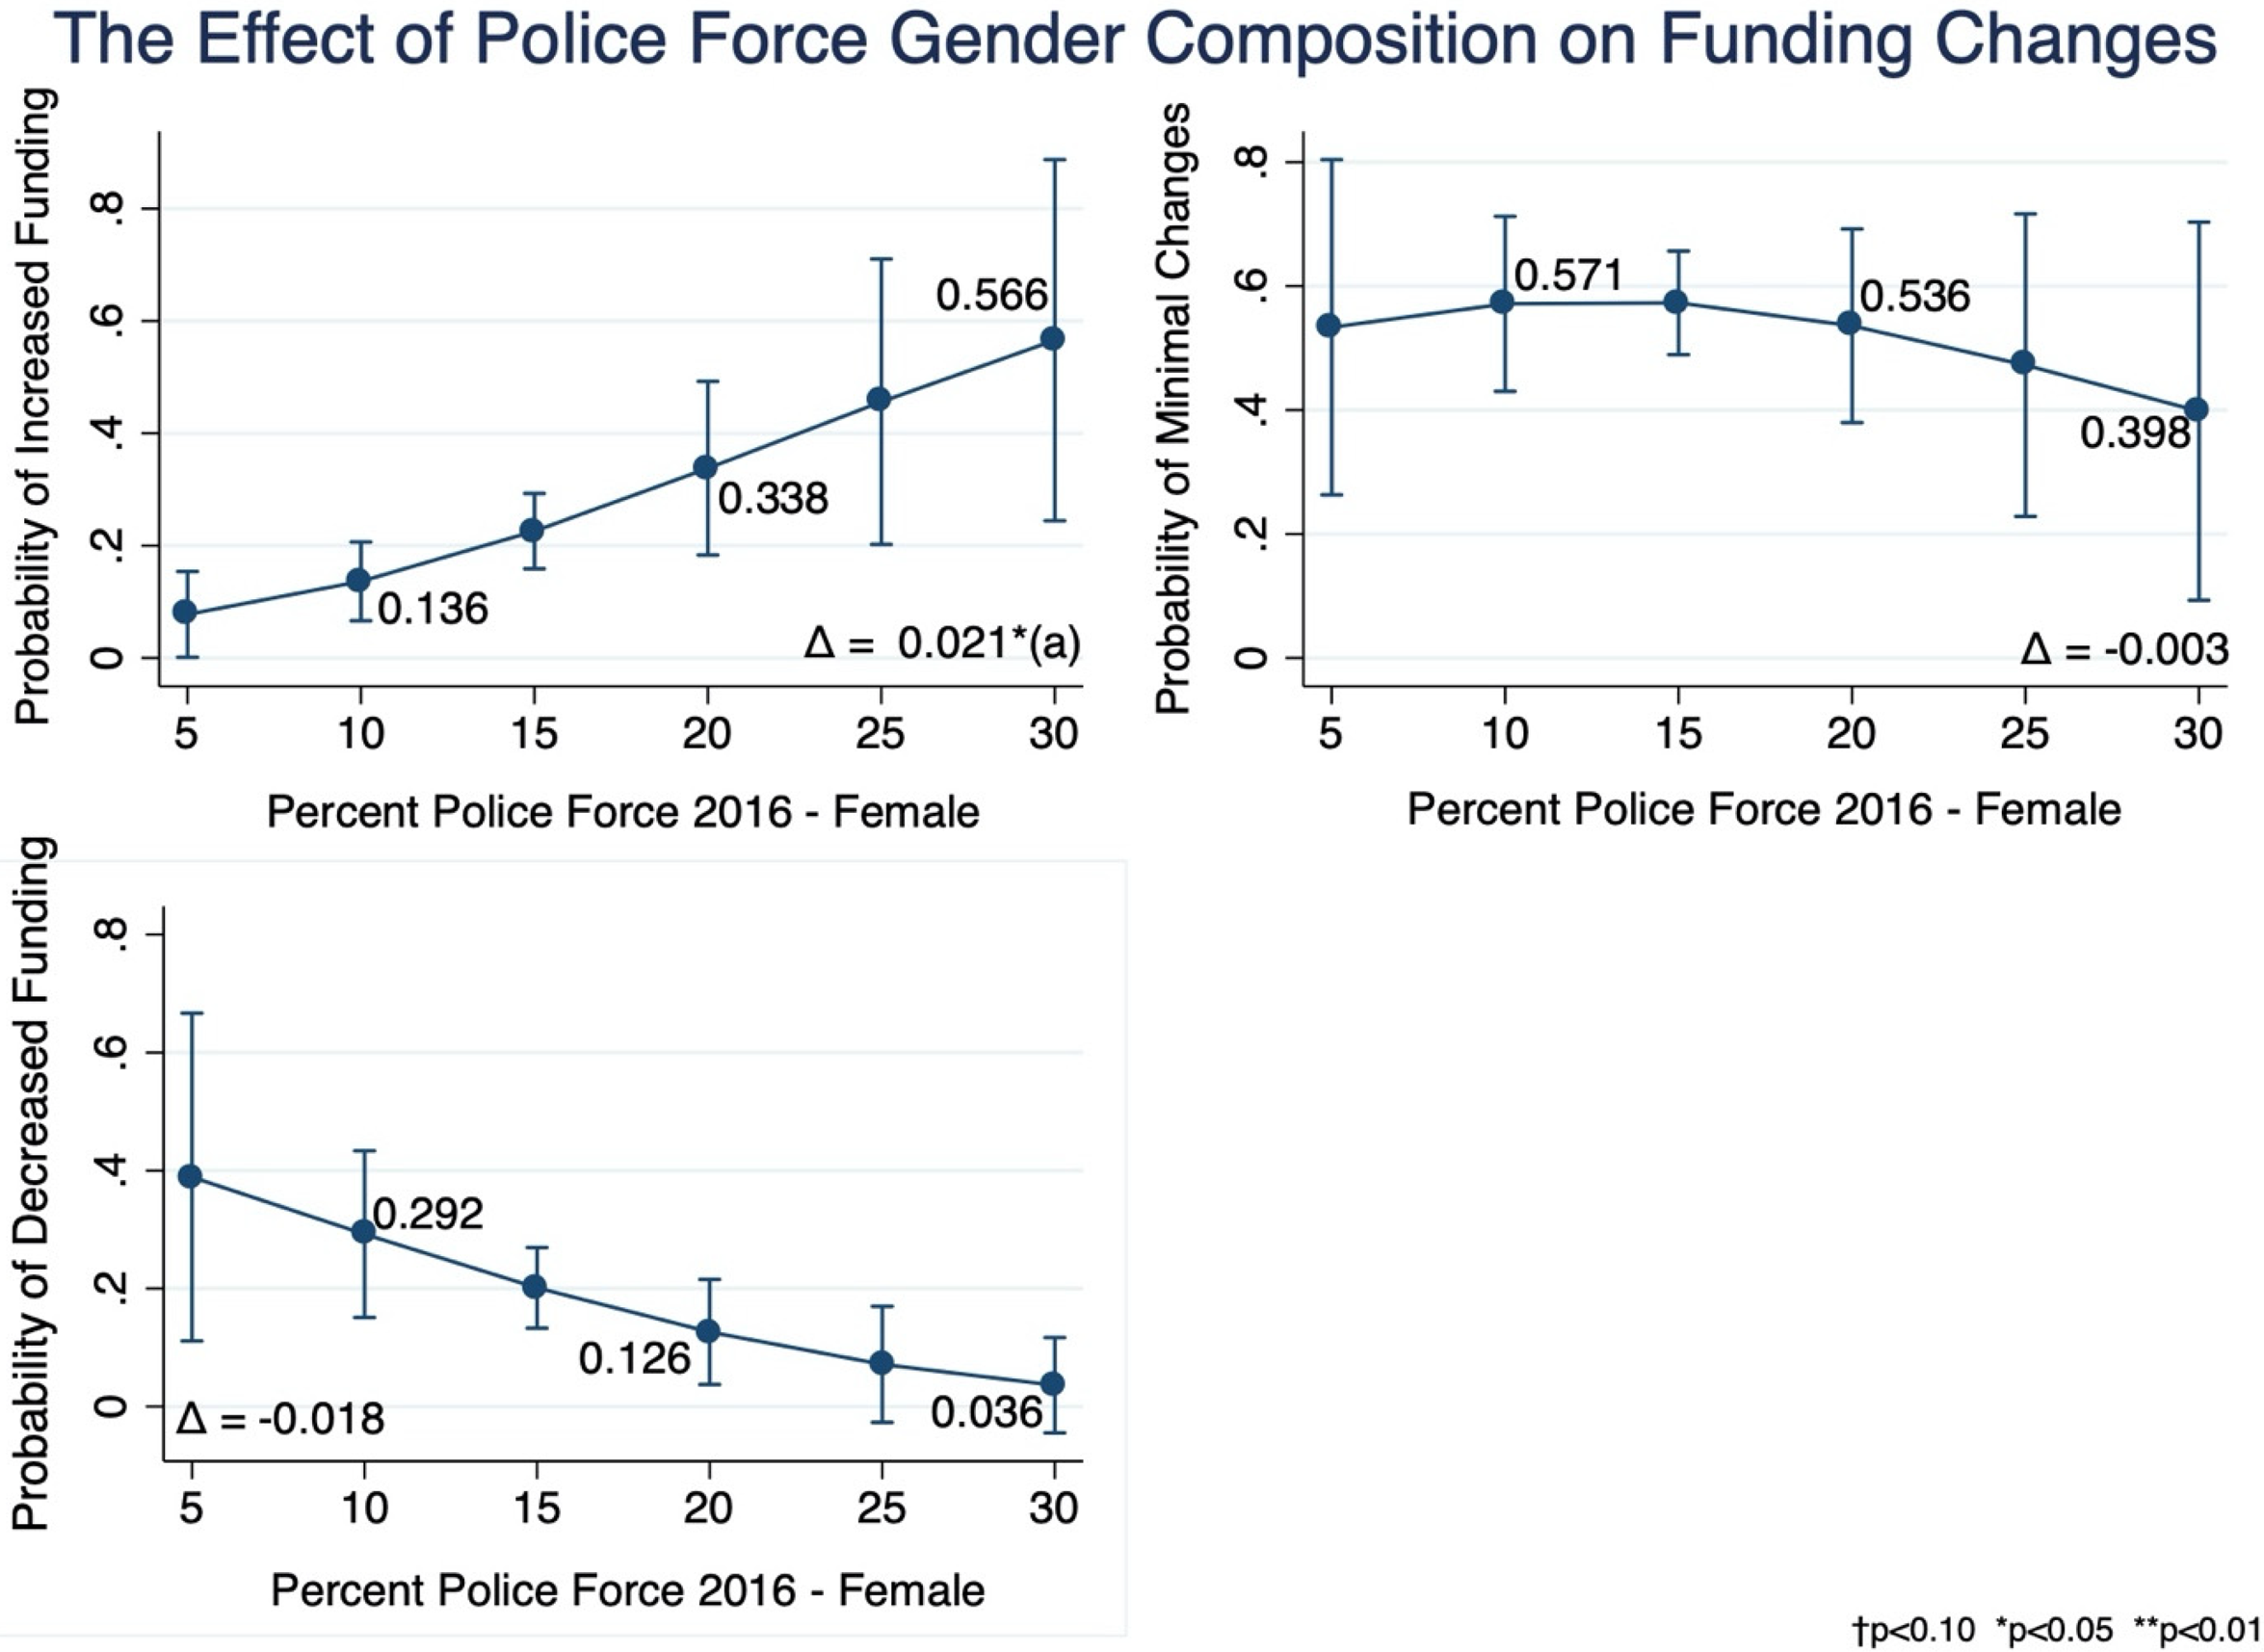
(a) On average, for every 1% increase in the number of female members of the city's police force, the probability of increased funding (potentially negative response) goes up by a value of 0.021. The difference is statistically significant at p < .052.
On the other hand, the minority composition of the police force does not significantly shape the likelihood of a potentially positive response over a negative one or vice versa. Rather, the significant negative coefficient associated with the% of the police force that is Black or Latin(x) in Model 1 shows that an increase in the Black or Latin(x) % of the police force is associated with a lower likelihood of a neutral response (minimal increases or decreases in police funding) over a potentially positive response. Specifying different base outcomes for the multinomial logit model also reveals that an increase in the Black or Latin(x) % of the police force is associated with a lower likelihood of a neutral response relative to a negative one. In terms of absolute probabilities, Figure 4 shows that a 1% increase in the Black or Latin(x) share of the police force is associated with an increase in the probability of a potentially negative (by 0.008) or positive response (by 0.008). Meanwhile, as the Black or Latin(x) share of the police force increases by 1%, the probability of a neutral response decreases by a value of 0.016. Figure 4 essentially demonstrates that increasing the Black and Latin(x) share of the police force increases the likelihood of substantive changes to the police funding, but this does not necessarily mean that the potential responsiveness will be more positive than negative (or vice versa) as evidenced by the closeness in probabilities between increased and decreased police funding at various levels of the Black/Latin(x) share of the police force (15%, 35%, and 50%).
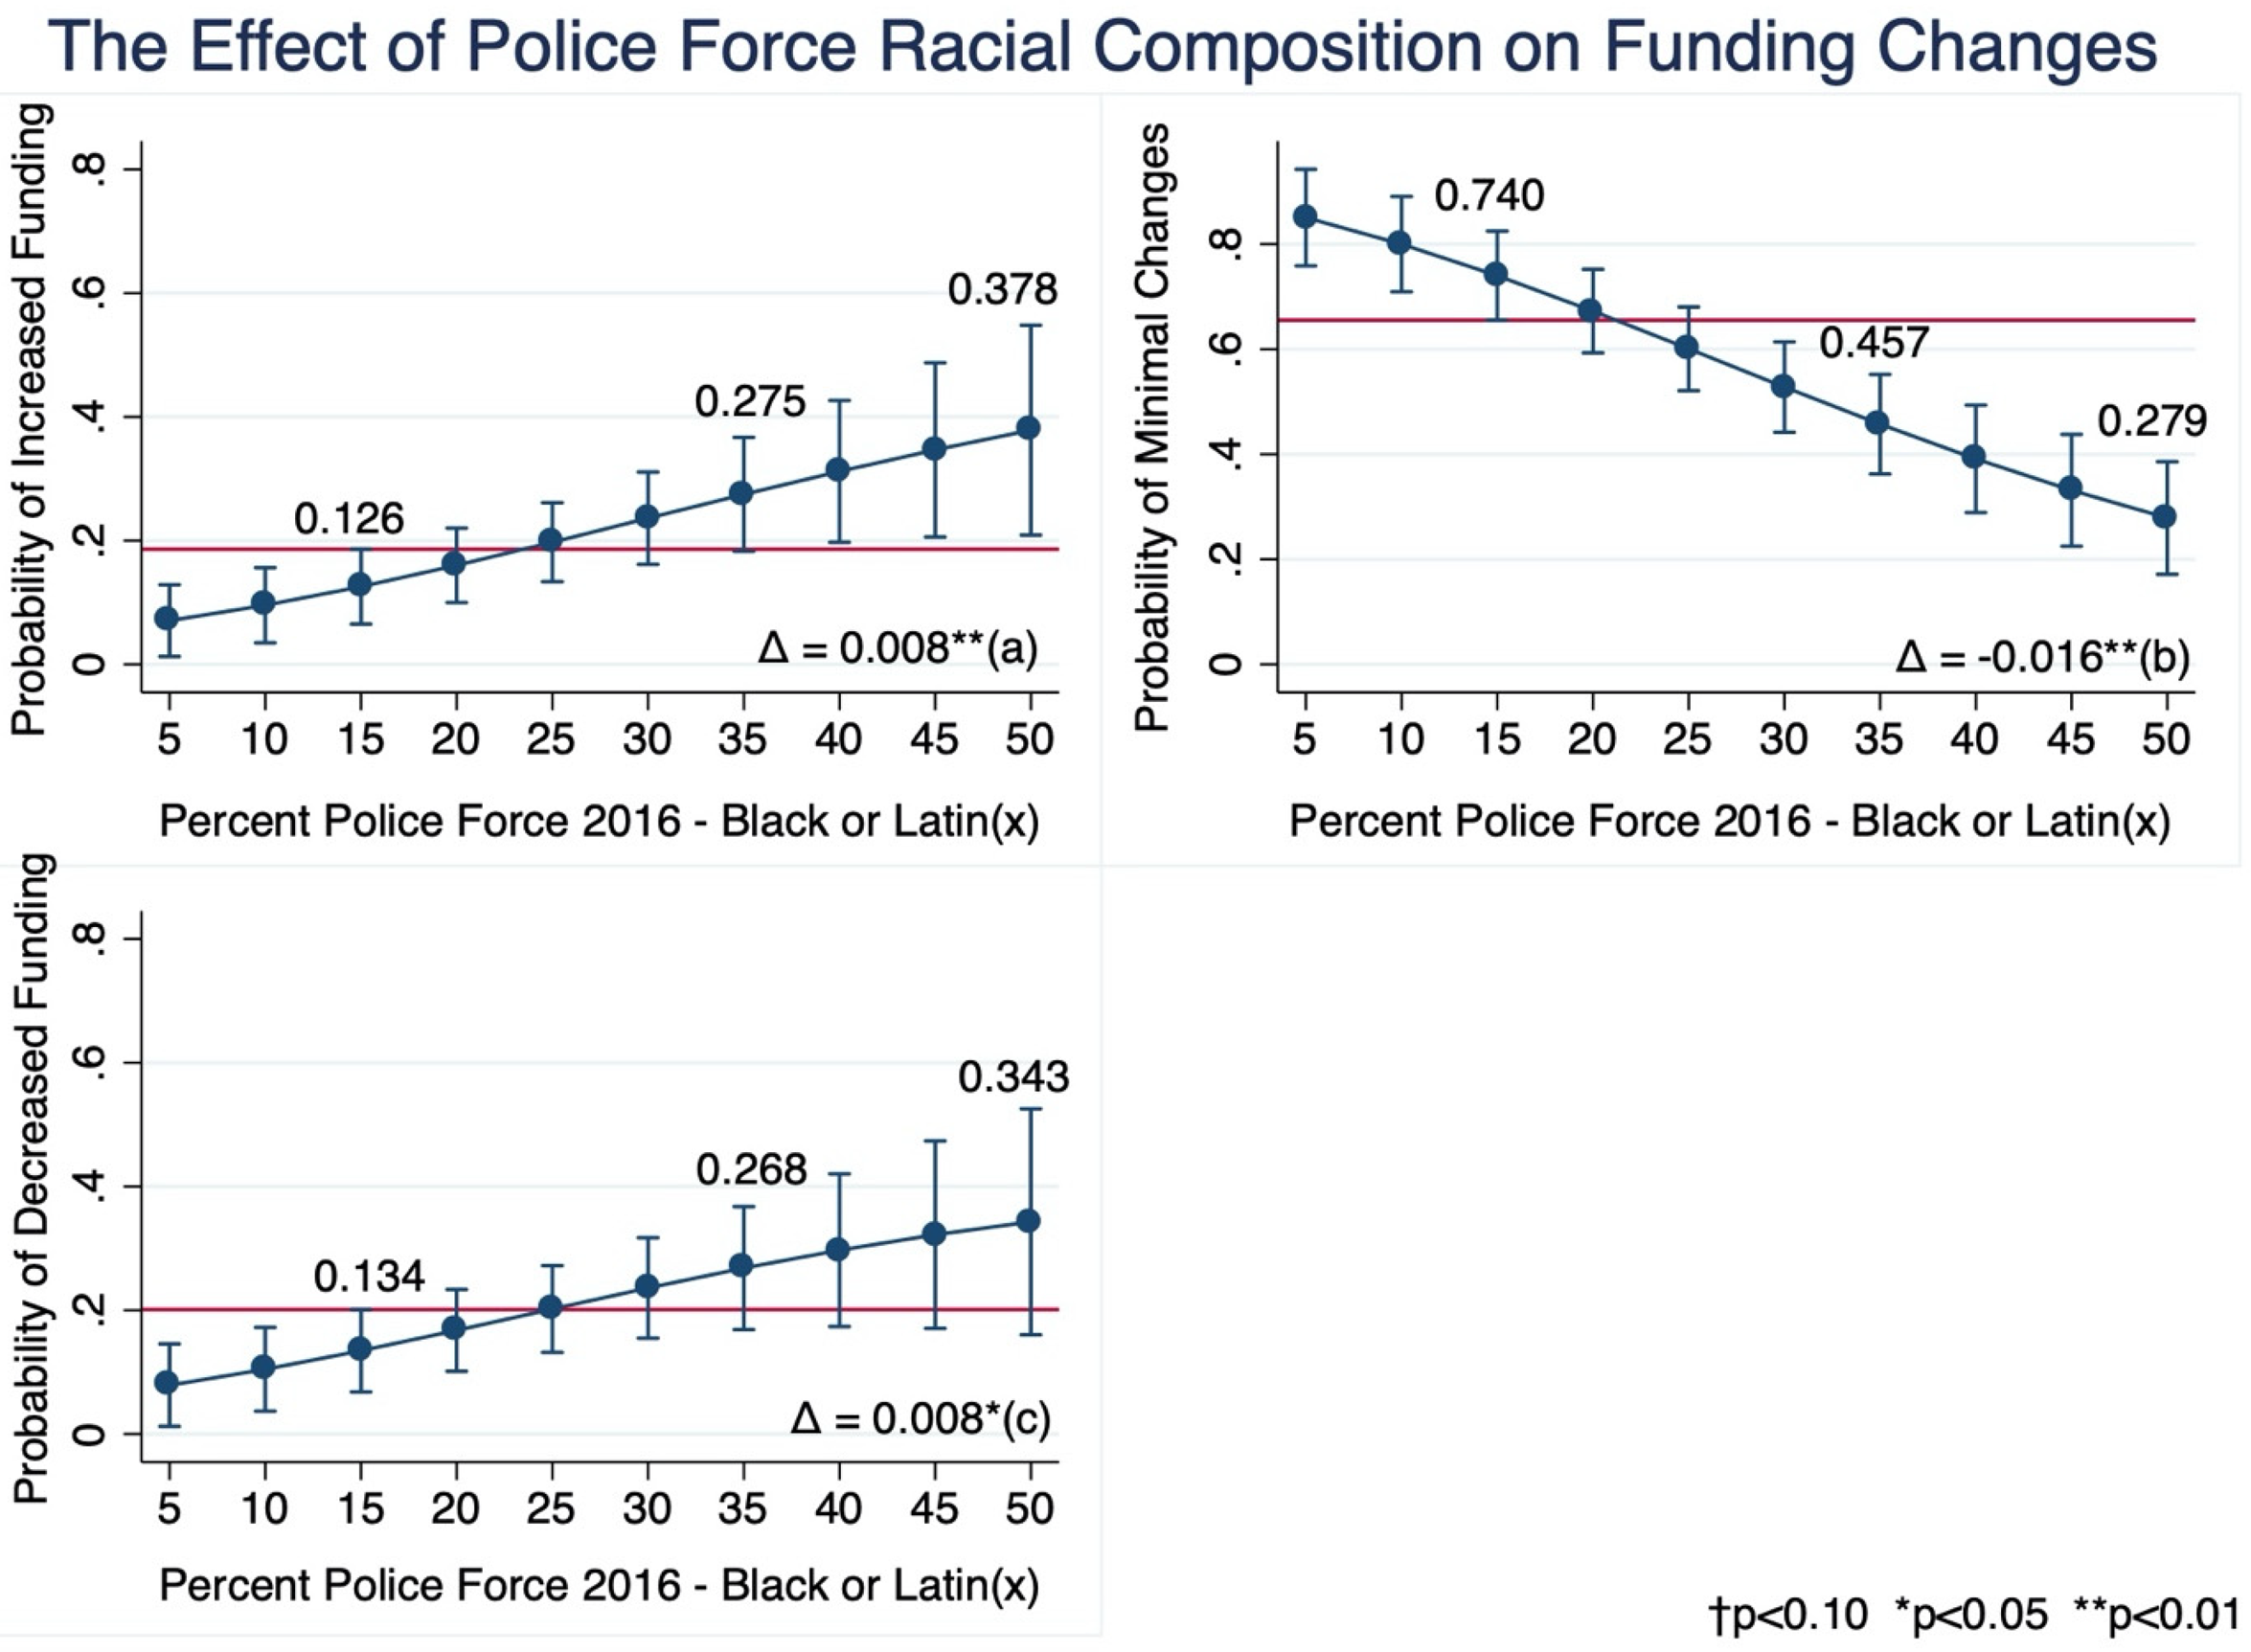
(a) On average, for every 1% increase in the Black or Latin(x) members of the city's police force, the probability of increased funding (potentially negative response) goes up by a value of 0.008. (b) On average, for every 1% increase in the Black or Latin(x) members of the city's police force, the probability of minimal changes in funding (potentially neutral response) goes down by a value of 0.016. (c) On average, for every 1% increase in the Black or Latin(x) members of the city's police force, the probability of decreased funding (potentially positive response) goes up by a value of 0.008.
Budget Adoption Timing
Thus far, we have not considered how differences across cities in the timing of their budget approvals might affect responsiveness. More than half of the cities in the sample were required to present and adopt their budgets before July 2020. Therefore, given the short duration between the start of the protests and the adoption of the budget, these cities perhaps had limited opportunities to respond to the BLM protests. To account for this concern, we also collected data on each council's revised policy and overall budgets (if any) for FY2021 as well as for FY2020, FY2019, and FY2018. Perhaps councils that could not consider the demands of the protests because of timing issues might revise their budgets during the fiscal year to accommodate these demands.
On the other hand, councils may revise their police budgets to allow for the possibility that, based on actual departmental expenditures at a given point in time during the fiscal year, police departments may underspend or overspend their original budgets. This means that perhaps even cities that initially adopted their budgets to reflect support for the aims of BLM might later revise their budgets to align with police departmental over-expenditures. According to a Supplemental Analysis (see Supplemental Table B1), which considers as a dependent variable the difference between actual expenditures and the original police budget, departments under Democrat mayors overspent their budgets more (or underspent less) than departments with non-Democrat mayors did, but this difference was not statistically significant.
While this difference was not statistically significant, we incorporate in our analyses dependent variables accounting for data on any revised budgets (if cities did not alter or revise their budgets, their original budgets were incorporated in the revised models). 7 Model 2 of Table 3 displays the results of one of the models. While the substantive effect is decreased, there remains a statistically significant relationship between mayoral partisanship and changes in police funding from FY2020 to FY2021—when cities increase their police budget share, cities with Democrat mayors increase this share less by 1.091% than do cities with non-Democrat mayors. On the other hand, when revised budgets are reflected in the measure of categorical responsiveness, the significant effect of mayoral partisanship diminishes, as shown in Model 2 of Table 4. These results suggest that even if cities with Democrat mayors are initially responsive to the concerns of BLM protesters, this responsiveness may not be sustained over the long term.
Additional Considerations
While the second dependent variable measures potential responsiveness by considering past budgets, alternative specifications for modeling responsiveness that account for past budgets are also considered. One such variable might capture the changes in the police share of the budget averaged across FY2018–FY2021. A virtue of averaging across different fiscal periods is that comparing the change averaged across FY2018–FY2021 to the change during FY2020–FY2021 can reveal the relative size of police funding increases/decreases during FY2020–FY2021. For example, if the change in the police share of the budget from 2020 to 2021 is substantially larger than the change averaged across a longer time span, then this difference might suggest government responsiveness to the demands of the protests. However, this measure of average change may not reveal nuances that potentially capture other instances of responsiveness (such as the trajectory of police budget changes).
Nonetheless, in a Supplemental Analysis, we consider a model in which the dependent variable captures the increases/decreases in the police share of the budget averaged across FY2018–FY2019, FY2019–FY2020, and FY2020–FY2021 (see Supplemental Table D1 for the results and for information on how the average change was calculated). Mayoral partisanship remains significant. However, although mayoral partisanship maintains a statistically significant association with the average change in the police share of the budget, the absolute value of this relationship is smaller than that of the relationship when only funding changes from the FY2020 to FY2021 period are considered (−0.770% vs. −1.281%). This reduced association tells us that compared to previous years, cities with Democrat mayors were making larger reductions to the police budget share from FY2020 to FY2021 than were cities with non-Democrat mayors, bolstering the possibility that cities with Democrat mayors were more responsive to the demands of the protests than were cities with non-Democrat mayors. The mayoral partisanship coefficient also remains significant when revised budgets are accounted for (see Model 2 of Supplemental Table D1).
Additionally, certain local demographic characteristics and the police chief's gender were associated with the increase or decrease in the police share of the budget averaged across the FY2018–FY2021 period. Surprisingly, compared to less conservative cities, more conservative cities, on average, increased the police share of the budget less or decreased it more over the FY2018–FY2021 period (see Models 1 and 2 of Supplemental Table D1). Over the same period, cities with a larger Black population increased (on average) the police share of the budget more (or decreased it less) than did cities with a smaller Black population. On average, cities with female police chiefs increased the police budget more or decreased it less than did cities with male police chiefs, but this difference only applies to the original budget.
In other Supplemental Analyses, we also controlled for the presence of police unions and Dillon versus home rule status (see Supplemental Tables E1 and E2). Perhaps cities with police unions may be less likely to heed to the calls for funding reductions than cities without police unions. Additionally, the extent to which cities are controlled by the state legislature may render them less able to be responsive to the demands of local protests. However, even when we account for these factors, we find no statistically significant relationship between police budget changes and the presence of police unions or between police budget changes and the extent of state control over local matters. Furthermore, the coefficients associated with police unions are in the unexpected direction. For example, the coefficients in Supplemental Table E1 demonstrate that, from FY2020 to FY2021, cities with police unions increased their original and revised police share of the budget less or decreased it more than did cities without such unions. As for state control, the coefficient that appears to be in the unexpected direction is in Model 1 of Supplemental Table E2, showing that compared to Dillon rule cities, cities with home rule status are more likely to minimally alter the police budget share than to substantively reduce this share over the FY2018–FY2021 period. In other words, compared to their home rule counterparts, cities with Dillon rule status are more likely to substantively reduce the police share of the budget than to respond neutrally.
Discussion
Different factors are associated with law enforcement funding changes in the aftermath of the BLM movement protests depending on how budgetary reductions and expansions are defined. Considering the police share of the overall budget and how this proportion changes from year to year helps determine how local governments may prioritize the funding requests of police departments relative to other departments, especially during times of crises like the COVID-19 pandemic. Mayoral partisanship appears to be consistently influential across different specifications of budgetary changes (they are statistically significant in most models under consideration). As mentioned before, Democrats are more likely than Republicans to support the BLM movement, and mayors may exert a substantial influence over the budget, especially in cities with a strong mayor-council system. However, although cities with Democrat mayors increased the police share of the budget less or reduced it more than did cities without Democrat mayors according to the linear models, the supplemental results did not show that cities with Democrat mayors tended to underspend their original budgets more than cities without Democrat mayors did (in fact, the statistically insignificant difference was in the opposite direction—the degree of underspending is more for cities without Democrat mayors than for cities with such mayors). Furthermore, when revised budgets are considered, the substantive association between mayoral partisanship and funding changes was reduced.
On the other hand, several factors are associated with budgetary changes occurring over multiple years, as reflected in the multinomial logit model. Again, mayoral partisanship was significant, with cities led by Democrat mayors more likely to respond positively (substantively reduce the police share of the budget) than cities led by non-Democrat chief executives. However, when revised budgets were considered in the multinomial logit model, the effect of mayoral partisanship diminishes. The decrease in the substantive effect of mayoral partisanship when accounting for revised budgets in the linear model and the diminished effect when accounting for revised budgets in the multinomial model, along with the possibility that cities with Democrat mayors underspend their budget less or overspend it more than do cities without such mayors, suggest that while cities with Democrat mayors may be considered as more potentially responsive to the demands of the BLM movement than cities without such mayors may be, such responsiveness may be inconsistent and/or short-lived.
Among some of the unexpected findings associated with the multinomial logit model are the effects of gender. Compared to female minority councils, female majority councils are more likely to substantively increase the city's police budget share rather than substantively decrease it. In terms of absolute probabilities, female-majority councils are less likely than female-minority councils to substantively reduce the police share of the budget. However, this finding might be explained by the expected and actual increase in intimate partner violence or new forms of it during 2020, brought on by the pandemic, which exacerbated various stressors contributing to intimate partner violence (Evans, Lindauer, and Farrell 2020; Peitzmeier et al. 2021). Because female leaders are more likely than male leaders to prioritize issues that disproportionately concern women (Holman 2015), councils with female majorities may reason that police departments need additional resources to confront the rise or expected rise in the number of domestic violence incidents.
Another interesting result concerning gender is that an increase in the proportion of female members in the city's police force is associated with an increase in the probability of a potentially negative response—substantively increasing the police share of the budget. On the other hand, this finding may not be surprising if councils are willing to increase funding to organizations with growing female members in an effort to be more supportive of institutions with increasing percentages of women and people of color. However, when revised budgets are considered over the period from FY2018 to FY2021, the diminished effects of institutional gender composition perhaps suggest that initial reform efforts to strengthen institutional diversity may neither be consistent nor long-term.
Supplemental analyses yielded interesting and unexpected results. While neither the city's Black population nor ideological predisposition had any statistically significant associations with changes in the police percent of the budget over the FY2020–FY2021 period, more conservative cities were, on average, increasing the police share of the budget less (or decreasing it more) than less conservative cities were over the FY2018–FY2021 period. Over the same period, cities with larger Black populations were increasing, on average, the police share of the budget more (or decreasing it less) than cities with smaller Black populations were. The effects of subnational ideology and racial composition may be partially attributed to several major cities in California allocating a substantial portion of their federal COVID relief funds to law enforcement agencies and also distributing more of these funds to law enforcement initiatives than to those focused on health, housing, and food (Levin 2022). Additionally, officials from these cities justified their decisions by citing significant police involvement in COVID-19 response efforts (Levin 2022). However, this narrative does not fully explain the results since the significant effects in the average change would be attributed to larger increases or decreases in the years before FY2020–FY2021. On the other hand, this narrative might suggest that even for relatively liberal cities in states like California, reservations to “defund” the police may not only be attributed to specific needs associated with large populous cities but also to possible backlash from powerful conservative groups. Hence, the city's overall ideological orientation may have limited or unexpected effects on decisions to alter the budget to reflect the demands of the BLM protests.
As mentioned before, some factors that are expected to inhibit local capacity to significantly alter police budgets do not predict outcomes in the police budget. Furthermore, although insignificant, the police union coefficients are in the unexpected direction. Perhaps the direction of the coefficients could be explained by the disproportionate presence of unions in cities with Democrat mayors than in cities with non-Democrat mayors. In fact, in cities with police unions, about 66% of them are in cities led by Democrat mayors while 35% of them are in cities led by non-Democrat mayors. Thus, even if the coefficients were to be statistically significant in this study, the association between union presence and funding changes may be capturing more of an association between mayoral partisanship and funding changes.
While we might expect police unions to prevent cities from significantly reducing police budgets, we might also conjecture that Dillon rule cities possess less capacity than home rule cities to make significant changes to their budgets. However, the degree of state control over municipal policies does not appear to be significantly associated with changes in police funding. Although the direction of most of the Dillon/home rule coefficients in Supplemental Tables E1 and E2 are unsurprising, the direction of the coefficient in the multinomial logit model (Model 1 of Supplemental Table E2) is unexpected. Although statistically insignificant, this coefficient indicates that compared to Dillon rule cities, home rule cities are more likely to respond neutrally (minimally alter police funding from year to year) than to respond positively (substantively reduce police funding). On the other hand, one would expect Dillon rule cities to have less leeway than home rule cities in substantively decreasing (or increasing) police budgets. However, even if the effect in Model 1 of Supplemental Table E2 were to be statistically significant, it may be consistent with research concluding that relative to Dillon rule municipalities, cities with home rule charters are more likely to experience revenue stability (Zhang and Nguyen-Hoang 2023). Hence, with the increased likelihood of revenue decline, Dillon rule cities may possess less flexibility in keeping the police share of the budget intact during a pandemic, perhaps instead redirecting funds to health-related priorities.
Future Directions for Research
There are several limitations to this study. First, we cannot state with certainty that reductions in police budgets, no matter how large, reflect responsiveness to the concerns raised by the BLM movement. Rather we argue that perhaps certain outcomes, such as a reduction in the police budget after a period of increases, or a larger decrease compared to the average decrease across other cities and across prior years, might reflect potential attempts to positively respond to the movement's demands. Additionally, the last budget cycles considered in our analyses are those decided upon in the immediate aftermath of the 2020 summer protests. Thus, even if reductions in police budgets do reflect positive responses to BLM demands, they only tell us about responsiveness in the short term. Perhaps councils might strategically accede to the demands of the BLM protests, but in the years following FY2021, increase the budget of police departments to compensate for the reduced funding in FY2021. In fact, analyses based on revised budgets suggest that this speculation may not be unwarranted. Thus, future research should look into the trajectory of police budgets in the years following the BLM protests especially considering the decline in support for the BLM movement (Horowitz 2021).
In our study, we found that factors expected to deter significant decreases (or increases) in the police budget had insignificant effects on the outcomes associated with police budgets. Future research could consider the role that police unions play in the budgetary process (Anzia 2022), especially if there are interaction effects between union presence and the ideology of the city's population and/or its government. Future research should also consider the degree to which state control over municipal policy decisions shape how responsive local officials can be to the demands of social movements. For example, a year after the 2020 protests, Texas considered and passed legislation that financially punishes cities for reducing police budgets (McGlinchy 2021). Voters themselves rejected a measure that would have allowed them to replace their police department in Minneapolis, MN (Kaste 2021).
Furthermore, while we might expect people of color and women in local governments to be more responsive than their White counterparts to the concerns expressed by underprivileged groups, we must also consider certain barriers to their responsiveness. For example, women-led local governments might not want to defund the police especially if they perceive this action as having adverse consequences for the safety of women. Similarly, non-White government leaders might not want to reduce police budgets but rather increase them if they want to support police departments who have made significant gains in the recruitment and retention of minorities and women on the police force. According to Ba et al. (2021), when the police force has more women and people of color, they are associated with better treatment of minority communities. That is, a more diverse police force might not be associated with a call to reduce the police budget because those most likely to call for change are not experiencing bad policing in that locale. Additionally, while changes in crime rates were not associated with changes in police budgets, our results do suggest that future research should consider how the association between crime rates and police funding might differ according to the racial composition of the government and its residents.
Another limitation to our study is that public reports of overall budgets are not similar across cities. For example, a few cities will report only the general fund as their operating budget while some cities will include other sources excluded by other cities. We try to mitigate this problem by ensuring consistency in how we determine the official budgets across fiscal years within each city. We also acknowledge that a data set of 100 observations is not large, but our analyses were still able to yield some statistically significant findings. However, studies of the BLM movement protests would benefit from investigating its effects on smaller cities, especially in suburbs where a growing number of racial minorities are living.
Finally, we encourage other scholars to consider various ways of conceptualizing and measuring responsiveness. We recommend that future studies compare the official budget numbers with reported actual expenditures to determine the degree to which councils are committed to sustaining their initial responsiveness to the BLM protests. We also acknowledge the possibility that positive responsiveness may also include redistributions within the police budget even if police budgets are not reduced (e.g., transferring funds intended for purchasing military-style weapons to programs aimed at improving relations between communities and the police). One interesting line of research could investigate how the personal attitudes and ideologies of local law enforcement officers shape the redistribution of budgets within police departments following major social movements. For example, research has shown that sheriffs’ personal characteristics and ideologies shape their personal attitudes about immigration, which in turn, are associated with their enforcement of immigration policy (Farris and Holman 2017). However, because many budget reports are neither detailed nor transparent in the breakdown of budgets within departments, determining positive responsiveness that goes beyond a focus on police budget reductions may be difficult.
Supplemental Material
sj-docx-1-uar-10.1177_10780874231187131 - Supplemental material for “Defund” or “Refund” the Police?: City Council Responsiveness to the Black Lives Matter Protests
Supplemental material, sj-docx-1-uar-10.1177_10780874231187131 for “Defund” or “Refund” the Police?: City Council Responsiveness to the Black Lives Matter Protests by Bai Linh Hoang and Andrea Benjamin in Urban Affairs Review
Footnotes
Declaration of Conflicting Interests
The author(s) declared no potential conflicts of interest with respect to the research, authorship, and/or publication of this article.
Funding
The author(s) received no financial support for the research, authorship, and/or publication of this article.
Supplemental Material
Supplemental material for this article is available online.
Notes
Author Biographies
References
Supplementary Material
Please find the following supplemental material available below.
For Open Access articles published under a Creative Commons License, all supplemental material carries the same license as the article it is associated with.
For non-Open Access articles published, all supplemental material carries a non-exclusive license, and permission requests for re-use of supplemental material or any part of supplemental material shall be sent directly to the copyright owner as specified in the copyright notice associated with the article.