
Abstract
Gentrification has been identified as a phenomenon that involves impacts on space and place. Particularly, gentrification's social and cultural impacts involve disrupted meanings residents associate with spaces. Although space and place dynamics of gentrification have been well-documented, gentrification research has primarily involved traditional quantitative, qualitative, and mixed methods approaches. These traditional approaches have not fully captured the nuanced ways space and place dimensions of gentrification converge in their impacts on residents. Also, traditional approaches have limited most gentrification research to theory and descriptions, as opposed to action and practice. To this end, innovative, integrated methodologies are needed for a paradigm shift in how gentrification is examined and addressed. In this article, we illustrate the use of photovoice and Geographic Information Systems’ Story Map as an integrated methodological approach to examining and fostering action against gentrification's space-place impacts. We provide strengths and challenges of this approach and recommendations for future research.
Keywords
Introduction
Gentrification has been identified as having both space and place dimensions (Davidson 2009; Summers 2021; Valli 2015). However, examinations of gentrification have often been limited to traditional quantitative, qualitative, and mixed methods approaches (Chatman 2017; Choi, Van Zandt, and Matarrita-Cascante 2018; Christafore and Leguizamon 2019; Freeman and Braconi 2004; Martin and Beck 2018; Newman and Wyly 2006; Valli 2015). Although these approaches have provided valuable knowledge, they have often fallen short of capturing the nuanced ways gentrification's spatial and place dimensions converge in their impacts on residents. Furthermore, few gentrification methodologies have involved a participatory, action-oriented approach (Council et al. 2022; Smith-Cavros and Eisenhauer 2014; Thurber et al. 2019). Given the multi-dimensional ways gentrification may impact residents (Alvaré 2017; Chatman 2017; Howell 2018; Hyra 2015; Valli 2015), there is value in moving gentrification research beyond description and theory, to action and practice (Lung-Amam and Dawkins 2020; Thurber et al. 2019; Thurber and Christiano 2019). Participatory, action-oriented methods are well suited to disrupt gentrification-induced marginalization among low-income residents of color.
Methods that combine the use of Geographic Information Systems (GIS) and photovoice offer an innovative way of examining spatial and place dimensions of gentrification while also promoting action. In this research note, we illustrate how the combined use of story map (i.e., a type of GIS method) and photovoice can help to examine and promote social action against gentrification's spatial and place impacts (i.e., social and cultural displacement). Our illustration highlights how participatory, action-oriented methods can help disrupt gentrification-induced marginalization among residents of color. The illustration is based on a secondary analysis of photovoice data using story map. We begin by providing a conceptualization of space and place dynamics involved in gentrification processes. We then discuss previous photovoice and GIS-based gentrification research to provide a rationale for the need to innovate gentrification methodologies. Next, we introduce the combined use of photovoice and story map to examine and address gentrification-induced social and cultural displacement. We conclude by highlighting the strengths and challenges of this approach and provide recommendations for future research.
Space, Place, and Gentrification
It can be argued that place is not place without space (Davidson 2009). Space provides the geographic context for place to be realized. Furthermore, residents attach meaning to spaces, which constructs their sense of place (Davidson 2009; Shaw and Hagemans 2015; Valli 2015). Ujang and Zakariya (2015) note that: A place is a manifestation of human culture. Culture is a social process where people create meaning to give themselves a sense of identity. (p. 711)
Scholars have argued that gentrification is a violation of space and place (Summers 2021; Valli 2015). Ponder (2016) candidly defines gentrification as: a process that on its surface appears to be beautifying and revitalizing an impoverished urban core, but in reality, it only embraces the wants and needs of the privileged, while displacing low-income families of color. (p. 361) cultural displacement occurs when the norms, behaviours and values of the new resident cohort dominate and prevail over the tastes and preferences of long-term residents. (p. 1754)
Photovoice and GIS-Based Gentrification Research
Photovoice and Gentrification
Photovoice has been identified as a participatory action research method that utilizes photography to enable participants to represent their community's assets and needs, promote critical dialogue, and engage in social action (Wang and Burris 1997). Photovoice centers the voices and lived experiences of historically marginalized groups, which serves as a form of empowerment (Foster, Davis, and Foell 2022; Kovacic et al. 2014; Sánchez-Ledesma et al. 2020; Shah 2015; Wilson et al. 2007). Although there are other methods that use photos (i.e., photo-elicitation), Foster, Davis, and Foell (2022) note that photovoice is distinguished from photo-elicitation methods in the following ways: First, photovoice is a participatory action research method where participants drive the process. Its aim is community empowerment and advocacy through identifying community assets and needs (Tornabene, Nowak, and Vogelsang 2018). Second, photo elicitation uses images to develop interpretations of experiences while participant-taken photographs are central to the interpretive experience within photovoice. Third, photographs used in photovoice are part of the data alongside individual- and group-level interpretations. (p. 2)
Thurber and Christiano (2019) argue that creative placemaking interventions (e.g., photovoice) draw attention to the more than material losses from gentrification. This includes a lost sense of place and history. Photovoice allows residents to reflect on these impacts. Specifically, residents’ photos of neighborhood transformations and reflections of their impacts on sociocultural identity can illuminate the place impacts of gentrification. Moreover, photovoice can help move research on gentrification-related social and cultural displacement from description to action. For example, photovoice can facilitate social action (e.g., historical preservation) that helps residents remain connected to the sociocultural fabric of their neighborhoods. Given these benefits, photovoice is a noteworthy complementary method to GIS because it helps to spur action and adds the place dimension to gentrification's spatial dimensions.
GIS Methods and Gentrification
Researchers have increasingly recognized the value of using GIS to depict gentrification impacts (Hwang and Sampson 2014; Yonto and Schuch 2020; Yonto and Thill 2020). GIS is “computer-based systems for the integration and analysis of geographic data” (Cromley and McLafferty 2012, p. 15). The spatial analysis capabilities of GIS have allowed for the examination of gentrification in several ways. For instance, Yonto and Thill (2020) used GIS to examine the extent of gentrification in Charlotte Black neighborhoods. Ground-truthing processes have also been incorporated into gentrification research (Yonto and Schuch 2020). Yonto and Schuch (2020) note that ground-truthing involves “the collection of on-site reference data to gauge the validity of a model” (p. 6). Ground truthing has been used to determine the extent to which spatial analyses align with community members’ perspectives of gentrification (Yonto and Schuch 2020). Additionally, GIS methods such as Google Street View have been used to illustrate indicators of gentrification (Hwang and Sampson 2014; Ilic, Sawada, and Zarzelli 2019).
GIS approaches have been concerned typically with space as opposed to place (Cromley and McLafferty 2012). Furthermore, GIS methods previously used to examine gentrification have been limited in their ability to capture space and place dimensions. However, additional GIS features that allow for the integration of emotional mapping, video/audio effects, and the integration of photos offer new opportunities to illustrate connections between space and place Meenar and Mandarano 2021; Teixeira 2016). For example, Meenar and Mandarano (2021) utilized photovoice data and GIS methods to understand the perceptions, experiences, and emotions of residents facing neighborhood change, and how the integrated, “high-tough” community-engaged approach could inform planners and increase participants’ human capital. The photovoice component of the study helped the researchers understand place dimensions of residents’ lived experiences (e.g., the ways that residents identify with their place, the ways that residents perceive changes in their built environments), including their emotions attached to neighborhood change (e.g., joy, sadness, anger, disgust). The GIS integration (i.e., emotional mapping using hotspot analysis) illuminated the convergence of space and place in participants’ lived experiences as the emotional maps displayed residents’ neighborhood sentiments at specific geographic points within the neighborhood. (Meenar and Mandarano 2021). Meenar and Mandarano note that the study was conducted at the initial stage of the Brownfield Redevelopment-Planning project, which enabled residents to share insights from the study's findings and promote community-centered development. This approach and similar integrated approaches make it possible to examine concepts like social and cultural displacement and foster community action against place and space impacts.
Story Mapping
Another novel GIS feature that enables participants to tell their space-place stories of gentrification impacts is story mapping. When describing Story Maps, Mukherjee (2019) notes: Story Maps is a web-mapping platform that allows one to create maps that tells their stories through texts, tables, narratives, photographs, video, audio, etc. (p. 209)
Integrating Photovoice into Story Maps to Examine Social and Cultural Displacement
Since photovoice fosters social action and illuminates the place dimension of social and cultural displacement, and GIS Story Map serves as a platform for displaying the place and space dimensions, these combined methods were utilized as an integrated methodological approach to conduct gentrification research. In the following sections, we explicate the processes, findings, strengths, and challenges of this approach. We also provide recommendations for future research.
Methodology
The present study illustration is based on a secondary analysis of photovoice data from a participatory case study. That case study examined native Black residents’ place identity and their meanings of and response to gentrification-induced social and cultural displacement. The study took place in a gentrifying historically Black neighborhood in Charlotte, NC (Yonto and Thill 2020). A purposive sampling strategy was used to recruit residents (N = 8) for the study. Inclusion criteria included being a current resident of the neighborhood, residing in the neighborhood for 20 years or more, self-identifying as Black American and/or African American, and being 21 years old or older. The participants included two male and six female participants. The resident-participants’ mean age and length of residence were 71 and 64, respectively. The following were the research questions for the original study: Research questions:
RQ1: What is the meaning of place identity to longstanding Black residents in a gentrifying neighborhood?
RQ2: What does social and cultural displacement mean to longstanding Black residents in a gentrifying neighborhood?
RQ3: How do longstanding Black residents respond to social and cultural displacement threats?
RQ1 helped to understand residents’ connection to place, and how their neighborhood spaces held meaning. RQ2 helped to understand how social and cultural displacement disrupted residents’ meanings of place and impacted their claimed spaces. RQ3 helped to understand social action residents were taking and had planned to take against social and cultural displacement threats. To address the research questions, two rounds of data were collected, and residents were asked to take photos of the following: (1) things in the neighborhood that represented the historic identity of Cherry and its residents and (2) neighborhood changes that did not reflect the historic social and cultural identity of Cherry. The first set of photos were intended to explore residents’ place identity. The second set of photos were intended to capture neighborhood changes, through residents’ perspectives, that contributed to a sense of social and cultural displacement. Werremeyer et al.'s (2016) version of the SHOWeD method was adopted to stimulate critical dialogue about the photos and foster social action. Specifically, when reflecting on their photos, each resident was asked to discuss the first five questions during the first round of data collection and all six questions during the second round: “What is Seen here?” “What is really Happening here?” “How does this relate to Our lives (your life)?” “Why are things this Way?” “How could this image Educate others?” “What should be Done about this?” NVivo software was used to analyze the data. Also, an interpretative phenomenological analysis approach (Smith, Flowers, and Larkin 2009) and member checking were used for the data analysis.
Innovative Methods Integration Process
Photos from the photovoice study were geotagged using the online geotag program Geolmgr Pro. The photos were geotagged based on the locations residents provided and Google Maps. Photos were grouped in secured electronic folders based on the themes they were associated with. These were themes that emerged from the original photovoice analysis.
The overarching (primary) place identity theme that emerged from the original data was being connected to Cherry's historic identity. The secondary place identity themes were having past and present social ties with other native residents, being a part of a self-contained community, and engaging in collective action. The primary social and cultural displacement themes were changing neighborhood character, confronting changing neighborhood norms, “othering,” encroaching, losing social connections, and witnessing the erasure of what was.
Creating the Story Map
The story map was created using ESRI's ArcGIS Story Maps program. The first step in the story map creation process involved selecting the map tour layout. The guided map tour option was selected. As its name suggests, this feature guides the viewer through each location sequentially (ESRI n.d.). Figure 1 shows the selection options.
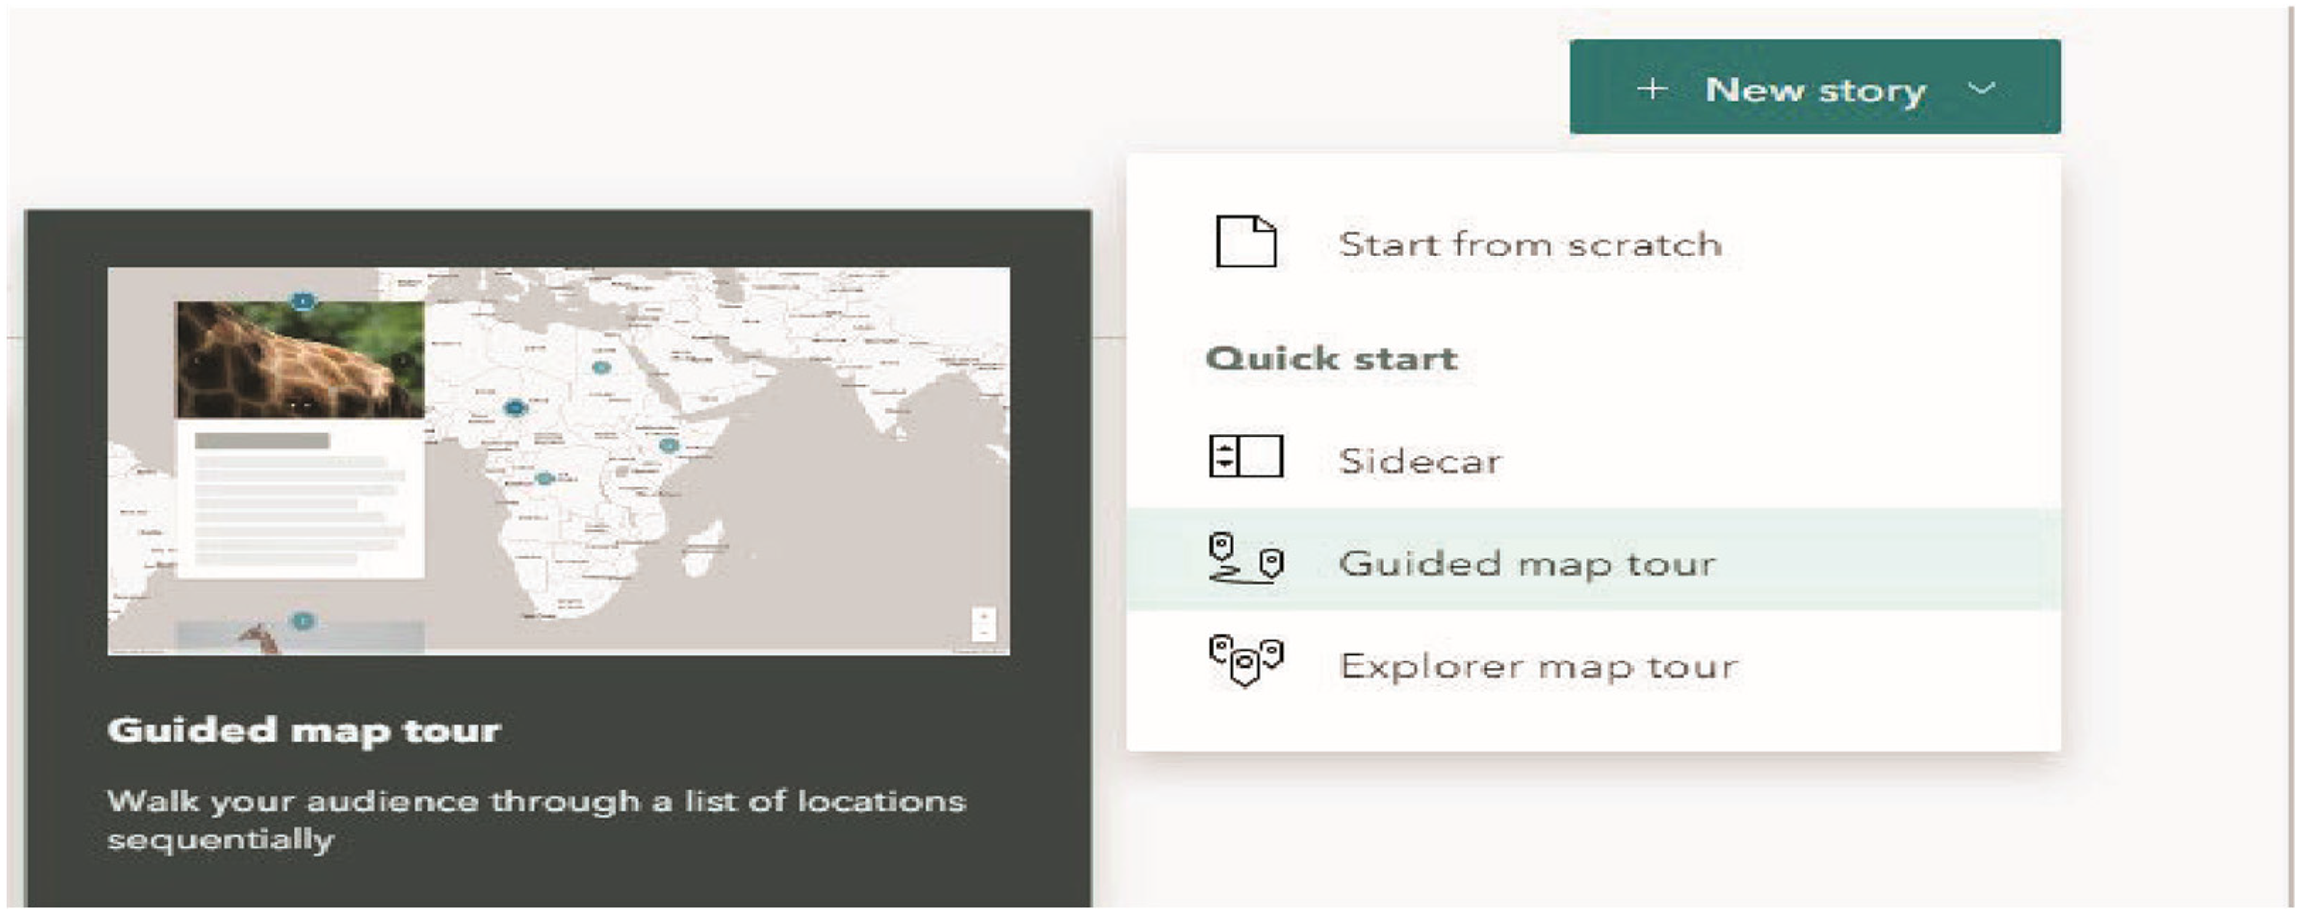
Image of map tour options with guided map tour selected. This image comes directly from ESRI's ArcGIS Story Maps story creation panel.
The next step involved choosing the map's base. The community map base was selected as depicted in Figure 2. After selecting the base map, the map was projected at the neighborhood level (i.e., including street names) and geotagged photos were inserted into the map. Figure 2 also depicts the geotagged photos as points on the map.
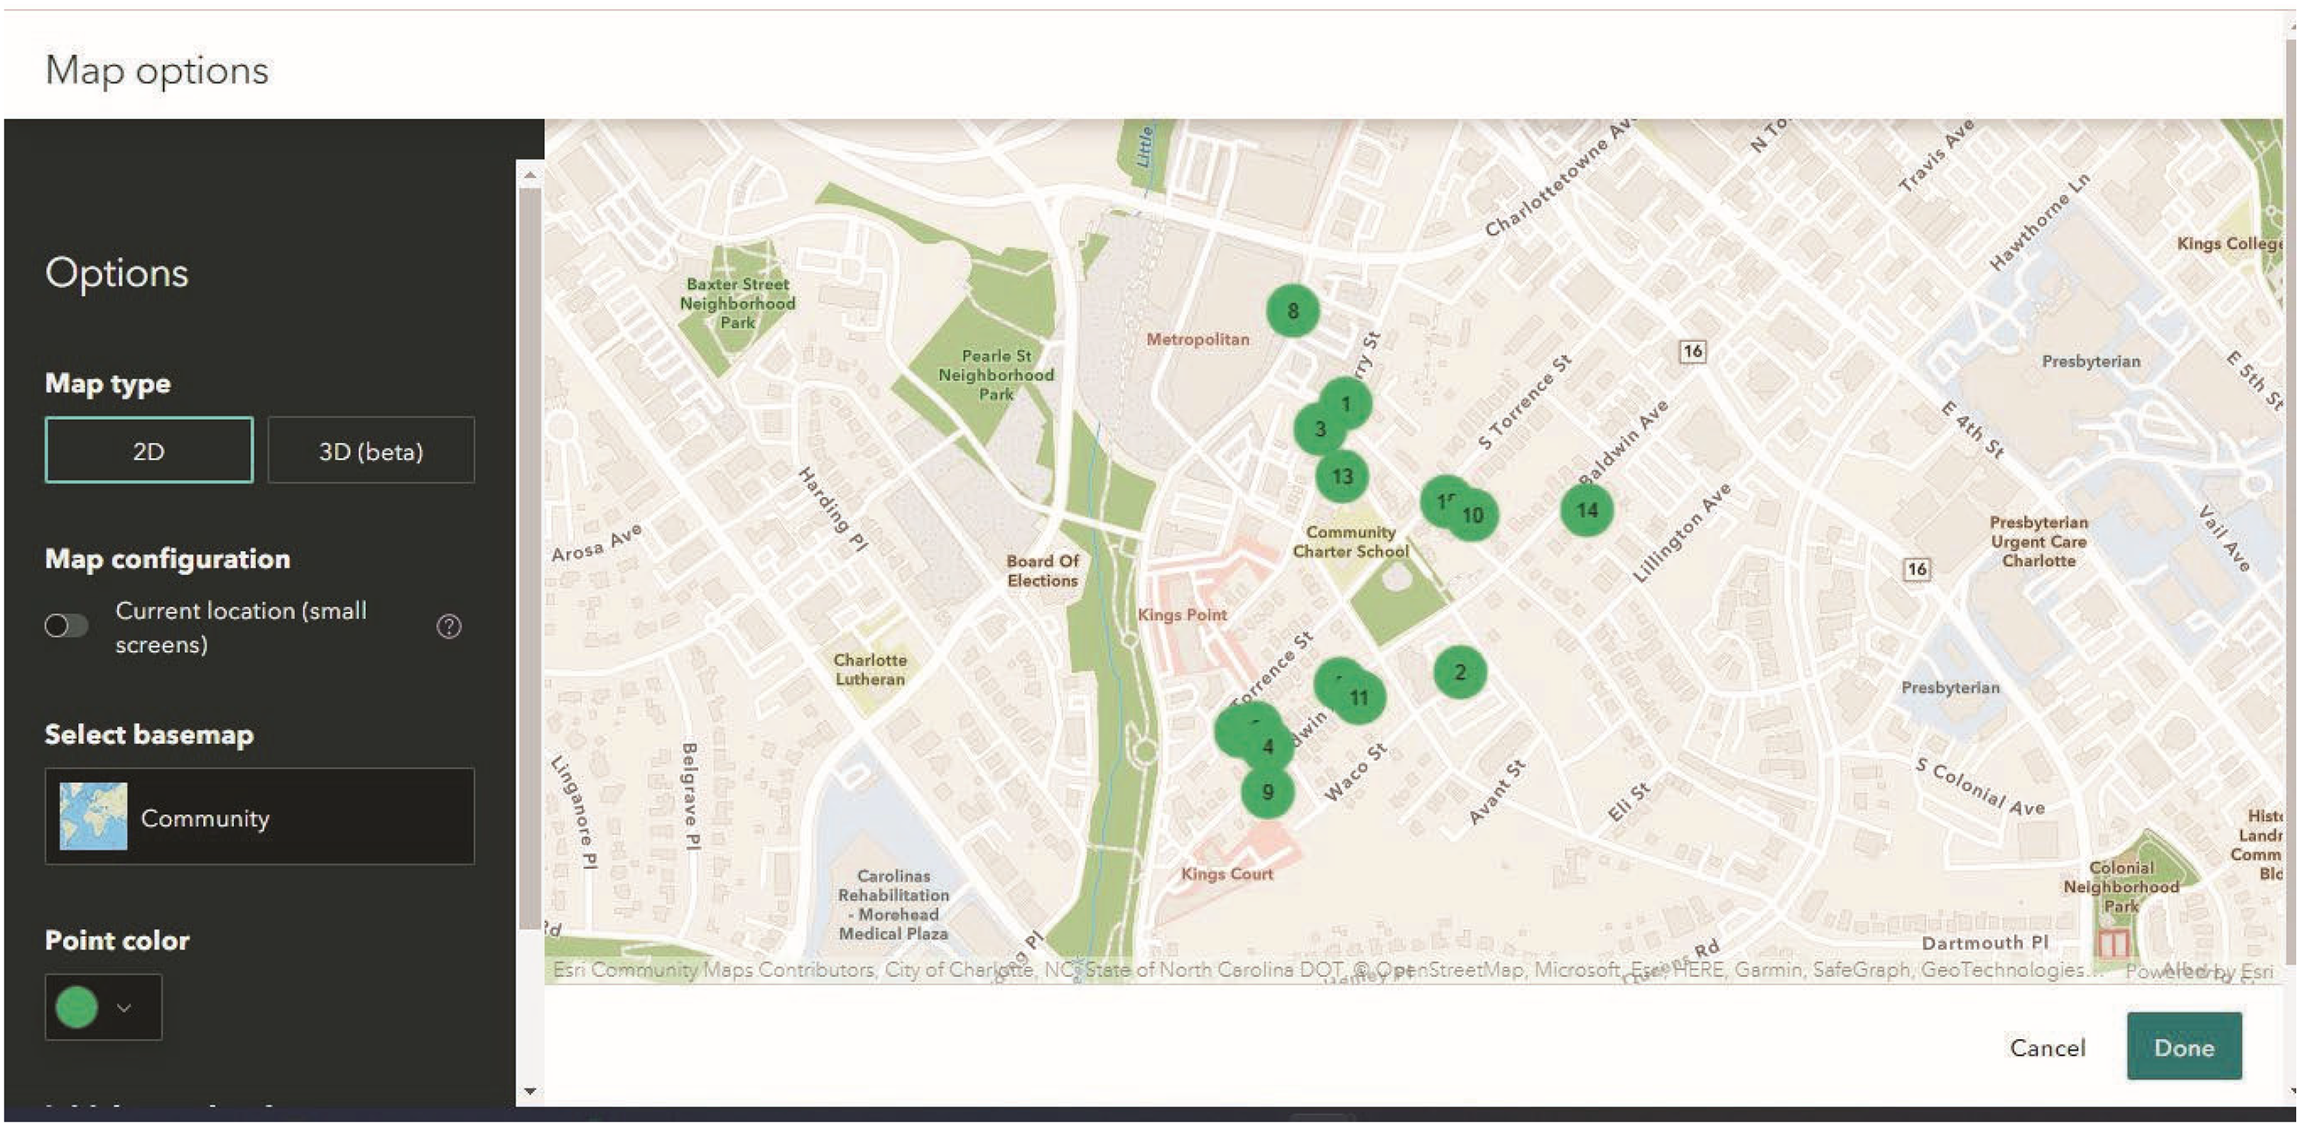
Image of map base options with community as the selected option. Image also contains the geotagged photos as points on the map.
Next, the map cover was created by adding a title—the community's slogan—and one of the frequently captured photos. Figure 3 displays the cover page. Additional text was added to give a summary of residents’ place identity based on themes. Also, text was added to narrate each photo. These narrations were obtained from the transcribed audio. Figure 4 provides an image of the residents’ place identity summary.
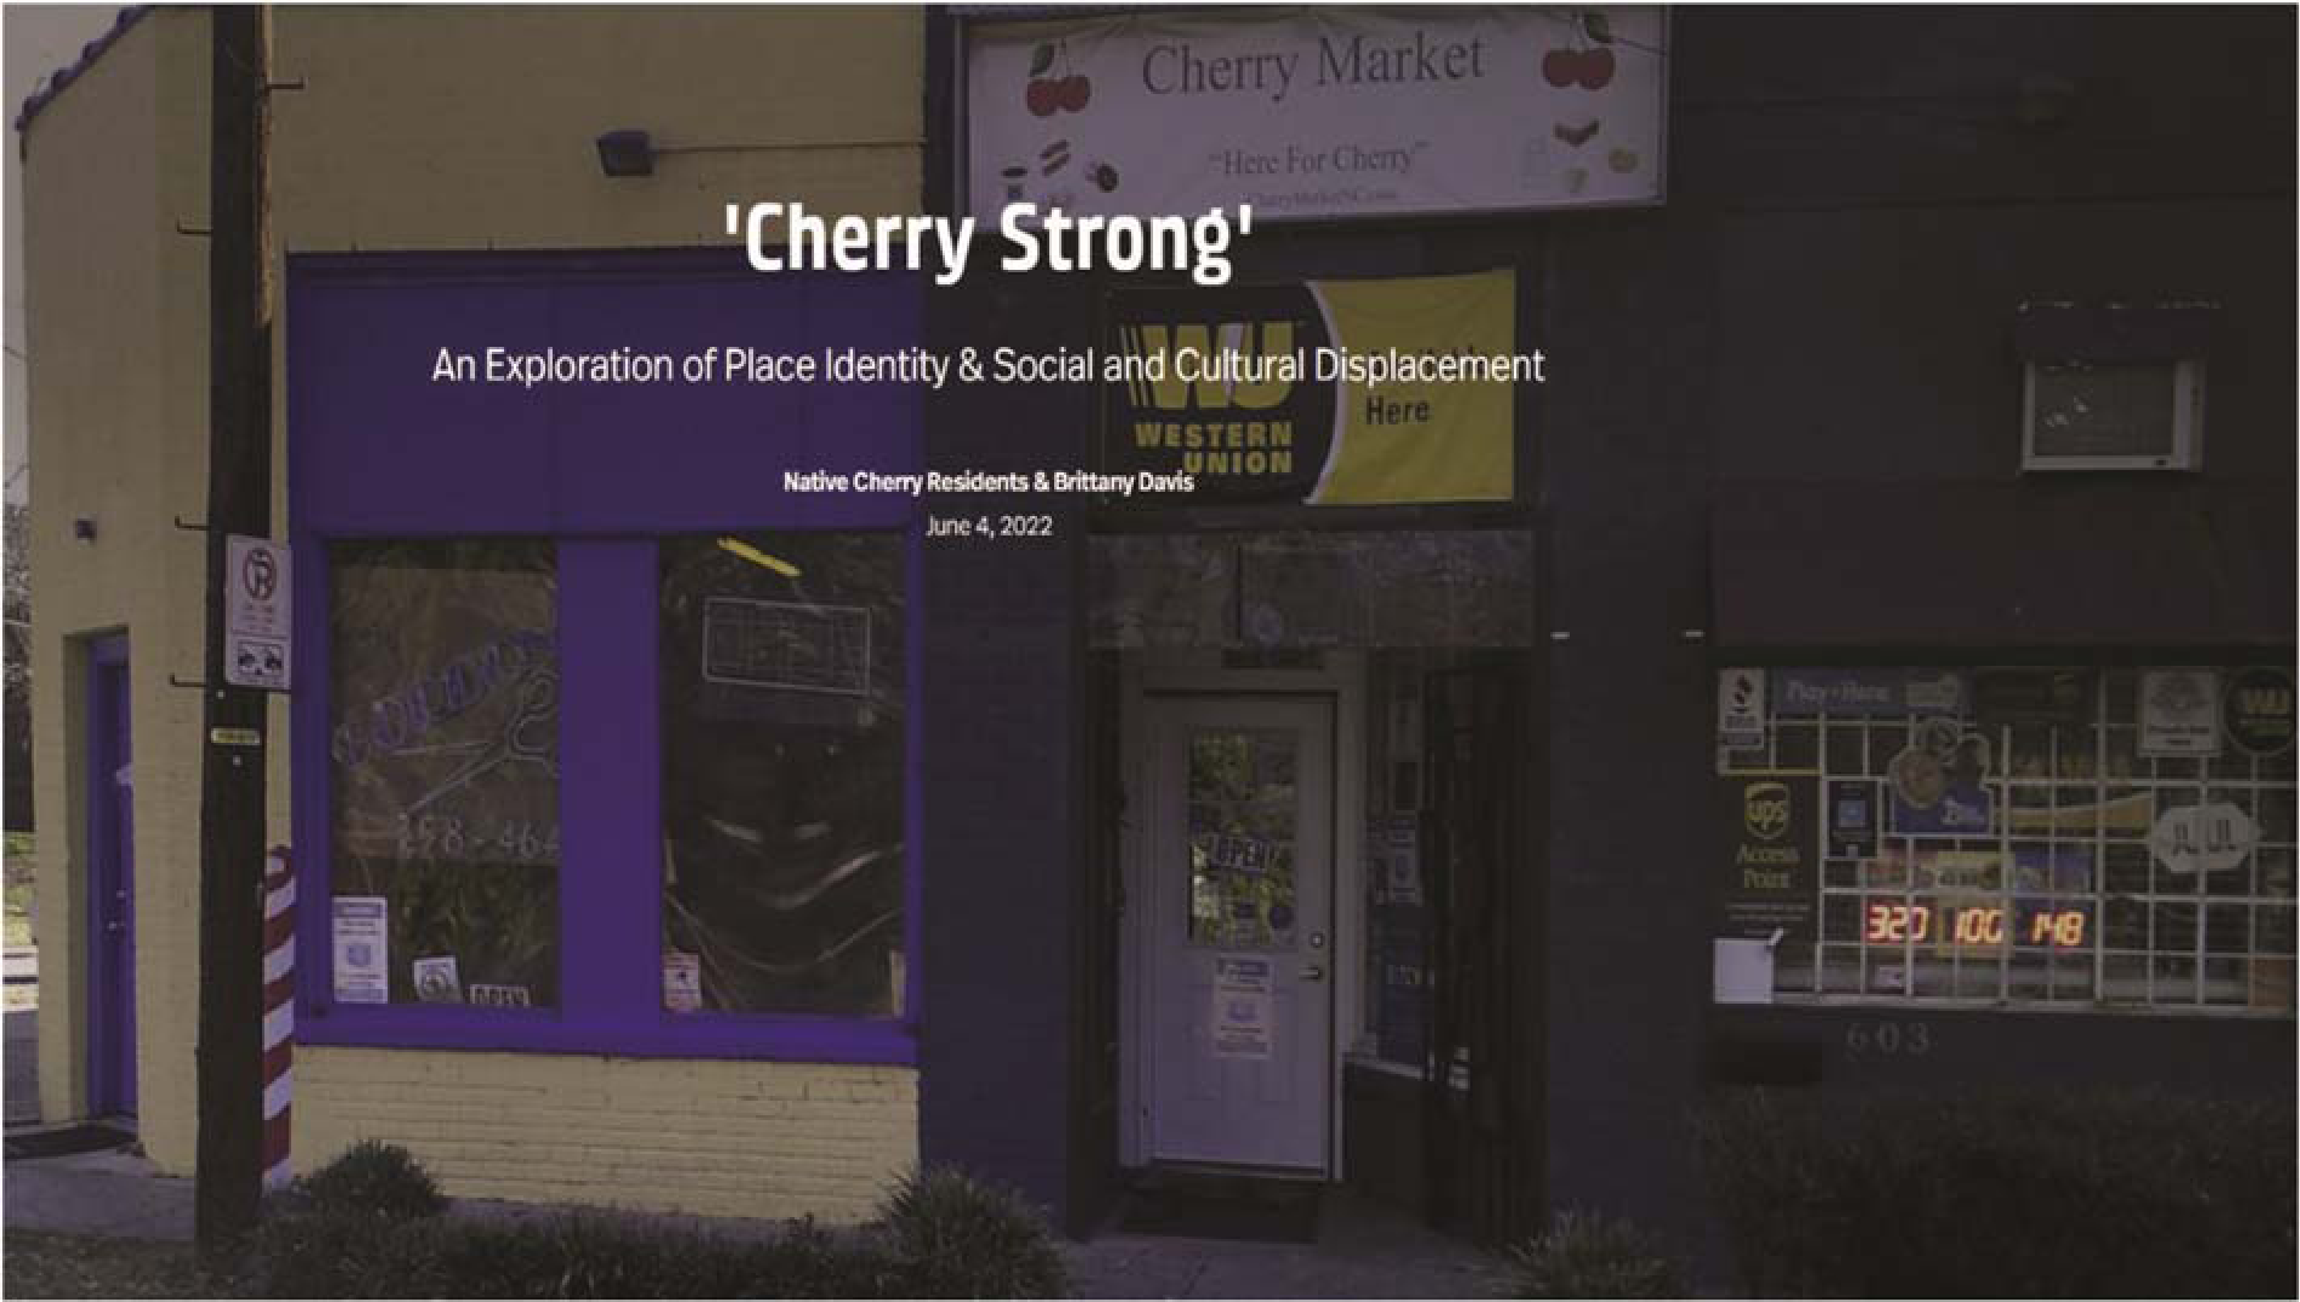
Photo of story map's cover page (removed for review).
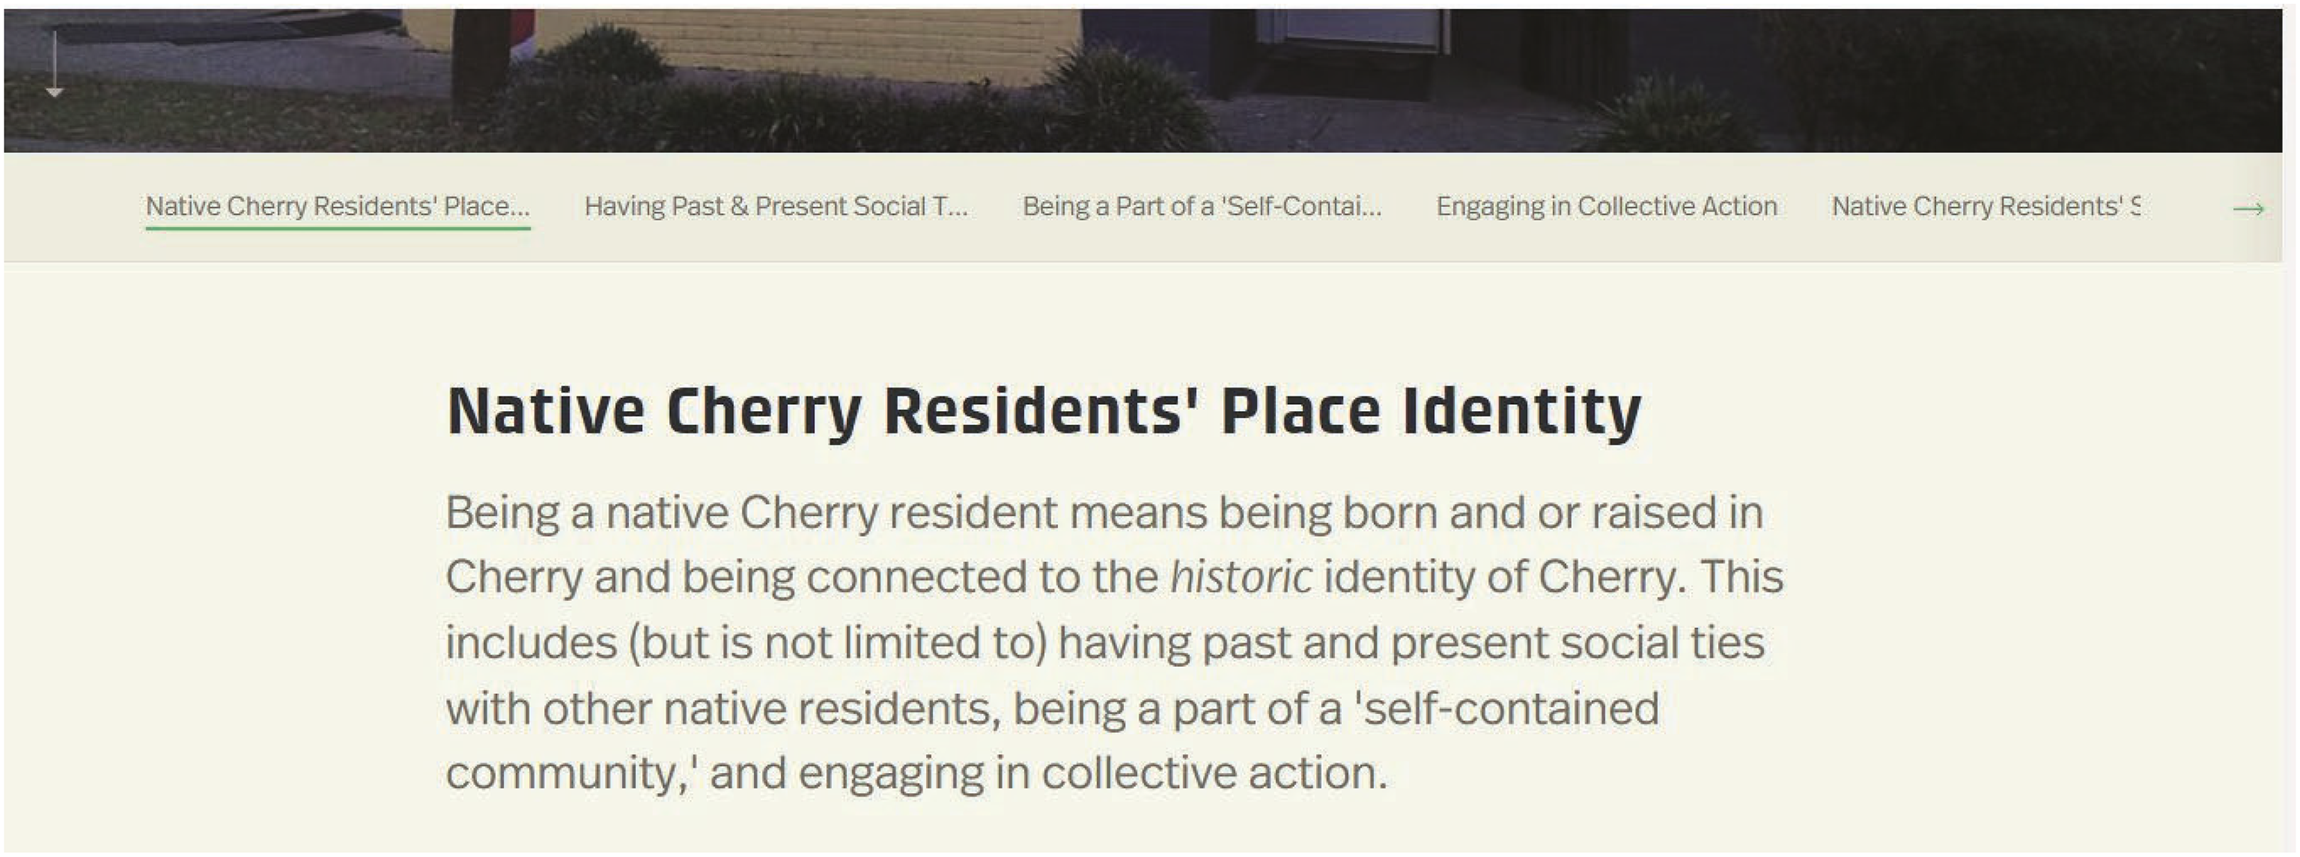
Image of residents’ place identity summary.
The photos and narrations were grouped by secondary and tertiary themes. Figure 5 displays an example of a selected data point with its corresponding photo, secondary/tertiary themes category, and narration. Some of the data points and photos included audio narrations from the audio-recorded photovoice sessions. This was identified as an even more compelling way for residents to tell their stories. Unlike photovoice alone that mainly focuses on place dynamics, the audio recordings and the geospatial reference illustrated the convergence of space and place in residents’ experiences. Since the insertion of audio clips created a breach of confidentiality risk, an additional IRB approval and an additional consent from residents were obtained. Prior to obtaining consent, the principal investigator (PI) explained the potential risks and benefits.
The social and cultural displacement data was included in a separate section of the story map. The same steps were followed to add the social and cultural displacement data. Figure 6 shows a summary of residents’ meanings of social and cultural displacement. Figure 7 provides an example of a selected data point within the social and cultural displacement section and its corresponding photo, primary/secondary themes, and narration.
Space-Place Impacts
The story map was reviewed with residents to ensure the map's accuracy. This included ensuring that the map's spatial dimensions (i.e., data points’ location on the map) were consistent with the place dimensions (i.e., residents’ photos and narrations). The map's data points illustrated that neighborhood change contributing to social and cultural displacement was widespread (i.e., data points were located on fourteen streets). Residents’ photos and narrations on those data points illuminated how the meanings they historically associated with those spaces (e.g., Black-owned land/property, childhood homes) were being disrupted by neighborhood change. Photovoice by itself only attends to the place dimension of neighborhood change by providing photos and audio narrations of photos. However, our innovative approach demonstrates how the combined use of photovoice, and story map can draw attention to the spatial and place impacts of gentrification.
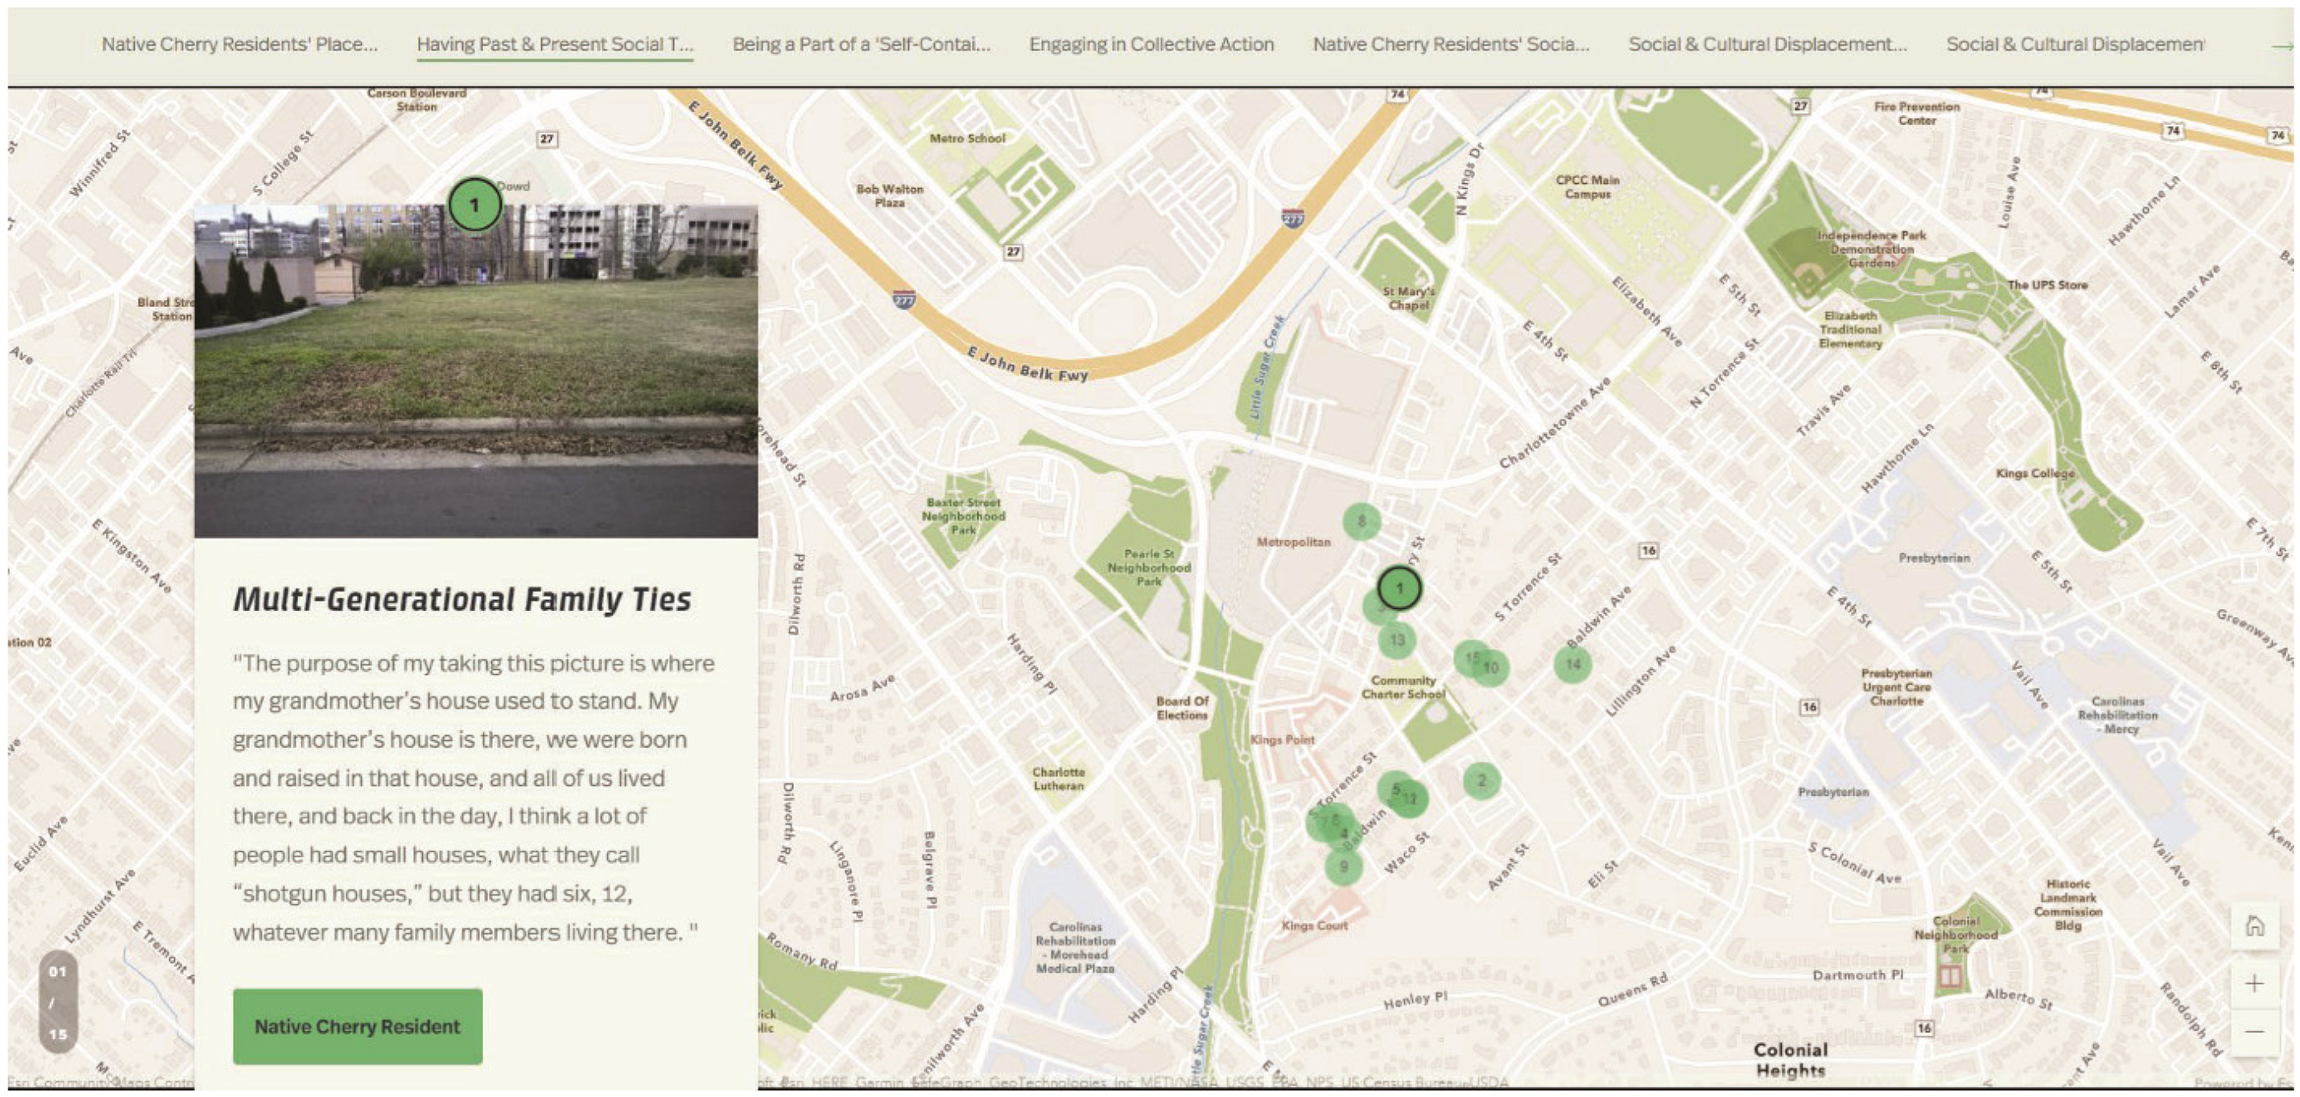
Image of a data point on the map (within the place identity theme) with the corresponding photo, secondary/tertiary themes title, and narration.
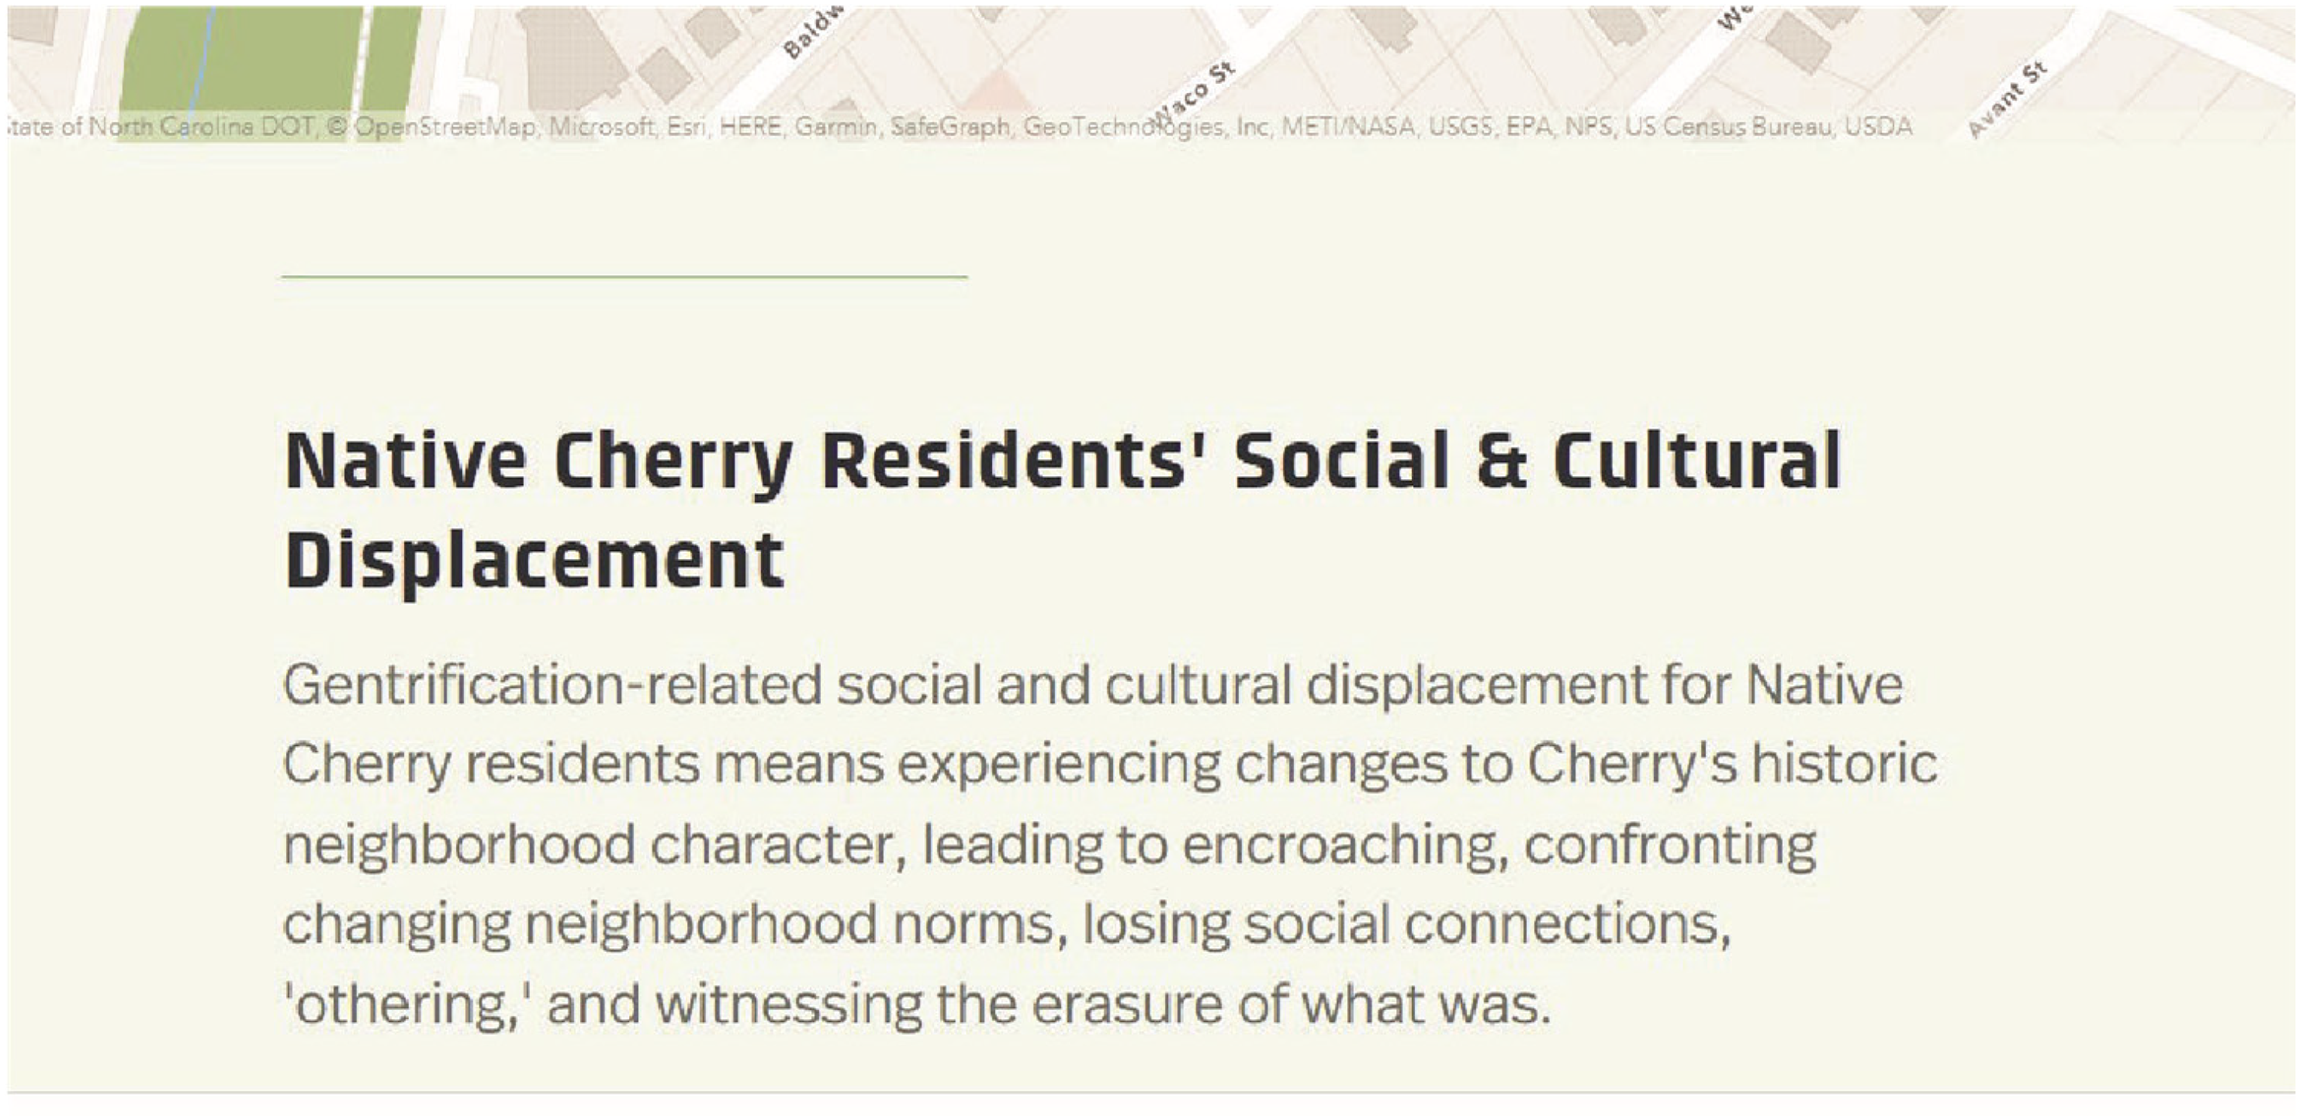
Image of residents’ social and cultural displacement summary.
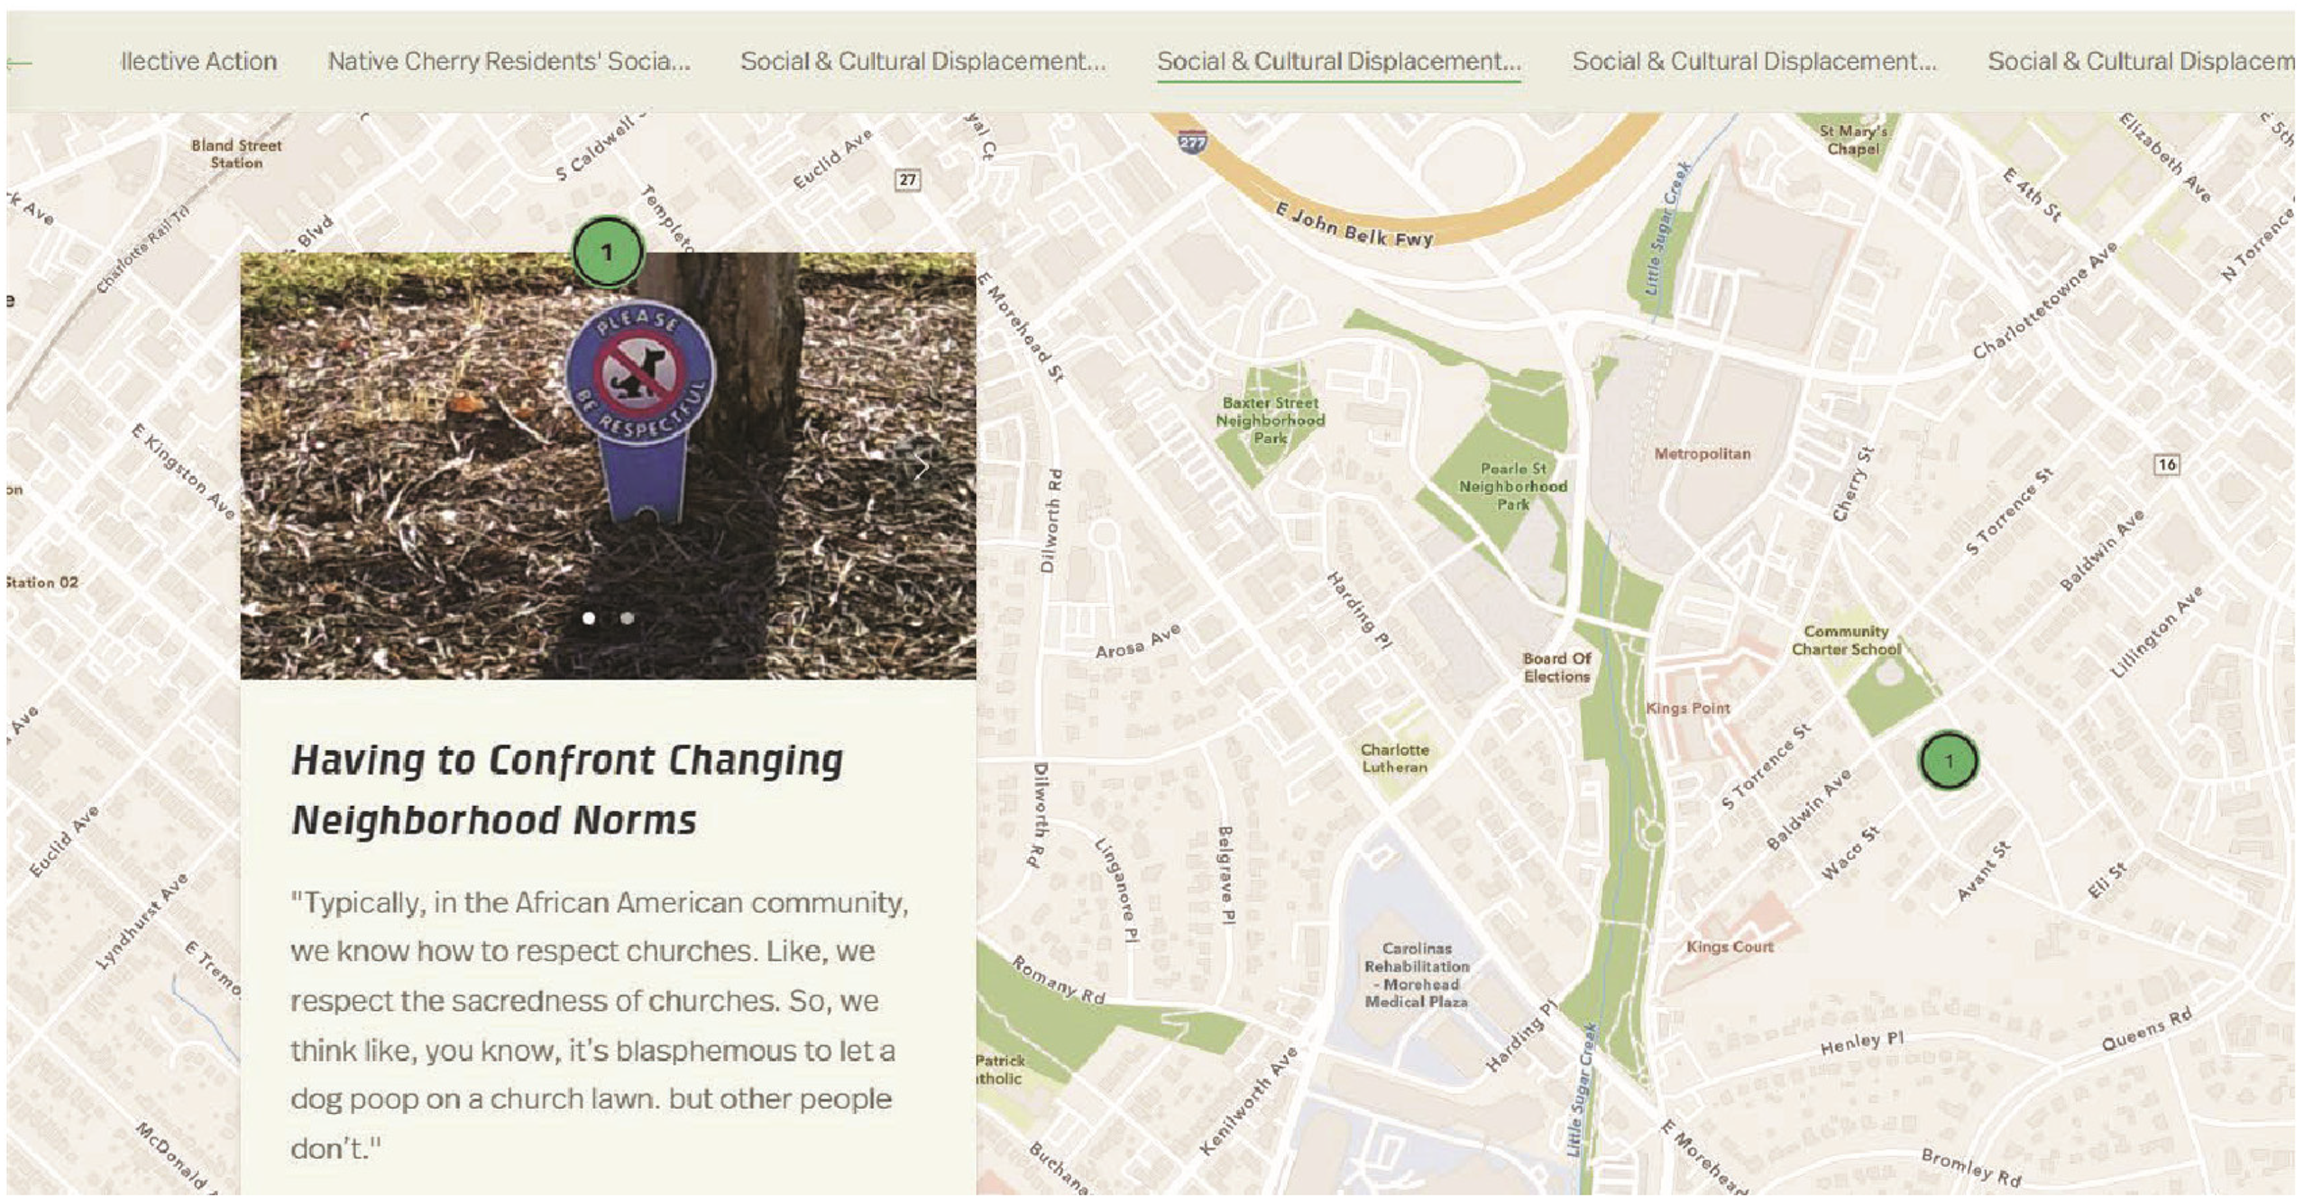
Image of a data point on the map (within the social and cultural displacement theme) with the corresponding photo, primary/secondary themes title, and narration.
Moving to Action and Practice
The map served as a practical advocacy tool for residents. Since residents were already engaging in resistance strategies against social and cultural displacement (e.g., appealing to city officials), they decided to have the map complement their efforts to reclaim their neighborhood school. The map will be used to tell the neighborhood's history to students and others at the school and provide a visualization of the interplay between space and place dynamics in that history. This will serve as a long-term strategy for preserving the neighborhood's historic identity.
The PI's and residents’ collaboration demonstrates how researchers and practitioners vested in addressing gentrification can partner with residents in meaningful ways. This includes centering their voices as experts of their neighborhoods, illuminating their lived experiences, and identifying resistance strategies that attend to space and place impacts. This methodological approach is therefore useful for fostering social action such as informing zoning policies that favor the preservation of historic features in Black neighborhoods and expanding mobilization efforts based on geographic indicators. Practitioners (e.g., community-based social workers) could also apply the methodological approach to advocate in collaboration with community members. This includes advocating and or developing proposals for equitable development that consider place and space dimensions of neighborhood change (e.g., social and cultural displacement).
Since gentrification may impact historically marginalized communities in similar and distinct ways, the integration of photovoice into story map provides an opportunity for residents to tell their own story and illustrate their unique space-place impacts. This serves as an empowerment mechanism, and avenue for fostering resident-led social action.
Strengths of the Integrated Methodological Approach
ESRI's ArcGIS Story Map program was user-friendly, which created ease in organizing the images and texts, and inserting the photos. It is also an ideal method when collaborating with participants as it does not require advanced GIS knowledge. The validity of the integrated methodological approach was a strength as it involved triangulation. This included data triangulation (i.e., text, photo, and audio data from residents), and methods triangulation (i.e., photovoice and GIS; Maxwell 2013).
Integrating photovoice data into the story map also illuminated how residents’ social and cultural displacement experiences were an interplay of space and place. The GIS mapping feature in the story map captured the spatial dimensions, while the photovoice data captured the place dimensions. The combined methodologies arguably provide greater depth to understanding residents’ meanings of social and cultural displacement. The audio feature in the story map was also a novel way to center residents’ narration of their photos. This served as a form of community empowerment and allowed residents to directly tell their stories. The story map was also an opportunity for residents to display action they had already taken against social and cultural displacement, and to strategize additional ways they could take action to combat gentrification's impacts on space and place. The integrated methodological approach's utility for fostering social action and centering the voices of longstanding Black residents makes it a practical tool for achieving racial and social justice.
Challenges and Limitations of the Integrated Methodological Approach
One of the greatest challenges experienced was the tediousness of geotagging the photos. Since the digital cameras did not have GPS built into them, all photos had to be geotagged individually with the use of resident-provided locations, Google Maps, and Geolmgr Pro. Some locations were vacant land/properties, which required these points to be approximated. Also, although worth it, integrating the audio clips was a time-consuming process that involved reviewing the audio multiple times and trimming the audio to narrate the photos. Additionally, inserting the audio created an ethical dilemma of weighing community benefits (e.g., creating an even more impactful narration) and risks (e.g., breach in confidentiality). In this case, the residents determined that the benefits outweighed the risks.
Future Research Recommendations
Future research could further enhance this approach by increasing the sample size and number of photographs (data) to support spatial analyses (e.g., Hot Spot Analysis). This could identify additional patterns within the data that show the interconnectedness between space and place. For instance, a map showing hotspots could be integrated into a story map and include participants’ photos and narrations of findings. Also, a digital camera with GPS is recommended for the collection of photos. This will save time when designing the story map. It may be helpful early on to break up group audio recordings from the critical dialogue sessions. For example, critical dialogue recordings could be broken up based on photos and or themes of focus during the sessions. It is also worth noting that ESRI's ArcGIS Story Map program may not be accessible to some community members due to purchasing and or other requirements. In our case, the PI had access through her academic affiliation. Google My Maps could potentially serve as an alternative mapping platform (Elliott 2009). Lastly, depending on the nature of action a community wants to take, a presentation of the story map could possibly be planned for the general public and or policymakers. This would be another way to help foster community action.
The integrated use of GIS Story Map and photovoice has utility for further evincing the converging impacts of space and place on longstanding residents who experience gentrification. This and similar integrated approaches have the potential for expanding gentrification research to a more action- and practice-oriented focus.
Supplemental Material
sj-docx-1-uar-10.1177_10780874231177628 - Supplemental material for Innovating Methodologies for Examining Gentrification-Induced Social and Cultural Displacement: An Illustration of Integrating Photovoice into Story Map
Supplemental material, sj-docx-1-uar-10.1177_10780874231177628 for Innovating Methodologies for Examining Gentrification-Induced Social and Cultural Displacement: An Illustration of Integrating Photovoice into Story Map by Brittany Davis, Kirk A. Foster, Ronald O. Pitner, Nikki R. Wooten and Mary L. Ohmer in Urban Affairs Review
Footnotes
Declaration of Conflicting Interests
The authors declared no potential conflicts of interest with respect to the research, authorship, and/or publication of this article.
Funding
The authors received no financial support for the research, authorship, and/or publication of this article.
Supplemental material
Supplemental material for this article is available online.
Author Biographies
References
Supplementary Material
Please find the following supplemental material available below.
For Open Access articles published under a Creative Commons License, all supplemental material carries the same license as the article it is associated with.
For non-Open Access articles published, all supplemental material carries a non-exclusive license, and permission requests for re-use of supplemental material or any part of supplemental material shall be sent directly to the copyright owner as specified in the copyright notice associated with the article.