
Abstract
Surveys are an important vehicle for advancing research on urban policy and governance. The introduction of online tools eased survey-based data collection, making it cheaper and easier to obtain data from key informants like local elected officials or public administrators. However, the utility of web-based survey administration may be diminishing. To investigate this dynamic and search for strategies to support survey research in urban studies, we perform a systematic review of survey research in urban policy and administration scholarship and conduct an original survey follow-up experiment. Our findings identify a clear downward trend in survey response rates that was accentuated during the COVID-19 pandemic. Results from our survey experiment show distinctly different costs per solicitation and per completed survey, depending on administration mode. These findings stimulate discussion on how scholars may continue to use surveys to generate high-quality, empirically rigorous research on urban affairs in light of recent trends.
Introduction
Data limitations shape empirical research on local government politics, policy, and decision-making. Although the numerosity of local governments—more than 90,000 in the United States alone (US Census 2019)—offers an extraordinary opportunity to explain variation in policy dynamics across a range of substantive issues (John 2009), it also makes it extremely difficult to gather data on the full population of local governments. There are relatively few comprehensive datasets that provide comparable data on local government policies, operations, and institutional structures. Moreover, local governments vary considerably in terms of whether and how extensively they make data about their functioning publicly available. Thus, the questions local government scholars can answer and the research designs they use are often determined by their ability to create an appropriate dataset from scratch (Sumner, Farris, and Holman 2020), frequently a laborious and time-consuming task. These challenges can push scholars toward focusing on other levels of government where data issues are less daunting (e.g., states) or toward examining a small number of local government cases at a single time point. In turn, this has contributed to urban research being considered underdeveloped relative to research on other levels of government (Sapotichne, Jones, and Wolfe 2007; Trounstine 2009). Still, urban research persists.
Scholars of urban policy and administration often investigate factors that explain local governments’ decisions to adopt new programs or policies as well as variations in their impacts and outcomes. These aims motivate empirical studies of local government decision-making around issues as diverse as environmental protection (Arnold and Nguyen Long 2019; Krause et al. 2019), gun safety (Godwin and Schroedel 2000), and immigration (Huang and Liu 2018). An important consideration when gathering the data needed to answer these questions is the tension between the often-substantial resource investment necessary to collect local government data and the aim of producing generalizable conclusions based on analysis of a large sample. 1 Two main approaches that quantitative studies use to gather local policy data are surveys and archival analysis (e.g., analysis of government documents, newspaper articles, and public social media activity). In this research note, we explore trends affecting a survey approach commonly used by urban policy scholars: querying individuals who represent cities and counties as staff members or elected or appointed officials.
Surveys are a flexible research tool that can be used to access a broad range of governance and policy data, including information about informal practices and priorities that may not be documented elsewhere. Urban scholars use surveys to collect information from diverse populations, ranging from randomly selected residents of a locality (e.g., Krause et al. 2013; Douglas, Russell, and Scott 2019), to representatives of particular community or cultural groups (e.g., Chu and Song 2008; Hinkle et al. 2022), to individuals within local governments with specific professional experiences (e.g., city planners, city council members; e.g., Arnold and Nguyen Long 2019; Krause and Hawkins 2021). Because they are targeted for their particular expertise, local government officials may be considered elite or semi-elite survey respondents. The perspectives and information these actors share about their own experiences and the governments they represent can significantly advance understanding of local government administration, policy, and decision-making. It is thus important to ensure that surveys of these actors are well-designed and yield representative, quality data. While plenty of studies and textbooks are dedicated to improving and refining survey methods, most focus on samples of the general population rather than key informants (Vis and Stolwijk 2021). Fewer still examine patterns in survey-based data collection specifically targeting local government officials.
This research note is motivated by our experiences as urban scholars who often survey local officials. Over the last 12 years, the authors have administered a total of six US nationwide surveys of local government officials and four surveys of local officials in one or multiple states. During this time we have experienced increasing challenges in eliciting responses, particularly when administering surveys online. We wondered whether our experiences are unique or shared by other scholars, and whether there are strategies which can boost falling response rates. To that end, we combine insights from a systematic analysis of the literature and a survey experiment.
We proceed by providing additional context about surveying local government officials and then assess the survey methods and response rates documented in scholarly articles on urban policy published since 2010. Next, we introduce an experiment we recently conducted as part of an effort to increase the response rate of a survey of city officials concerning their city's preparation for environmental hazards. We conclude by making recommendations for future research and discussing trends we expect in future efforts to survey local officials for scholarly research.
Surveying Local Government Officials
The practice of surveying public officials has a long history in urban research. For decades, such surveys were most typically administered via postal mail. Although mail surveys often yielded quality insights, they could be costly to print and mail, particularly for large samples, and involved time-consuming manual data entry (Andranovich and Riposa 1993). Starting in the early-2000s, the development of online survey software such as SurveyMonkey and Qualtrics ushered in a new era of speed and ease of survey administration (Field 2020). Funding was no longer required to print questionnaires, purchase stamps, and pay a team of research assistants to stuff envelopes and record results. Students and principal investigators alike could develop and administer online surveys to local officials with far fewer barriers. It was not uncommon for online surveys sent to nationwide samples of cities to yield response rates between 50% and 70% (Feiock et al. 2014). However, as response rates fall, we fear that this era of conducting (relatively) cheap and easy local government surveys may be ending.
The concerns motivating this research note are not new. Scholars have been worrying about declining response rates to online surveys since shortly after their inception (Daikeler, Bošnjak, and Manfreda 2020; Fincham 2008; Sheehan 2001). However, in addition to problems that other scholars have posited as causing declining response rates to online surveys in general, including email users’ increasing suspicion of unsolicited messages (Saleh and Bista 2017), we posit that some of the difficulties surveying local government officials are specific to this population. We suggest:
Local government officials are being over-surveyed. As the development of online survey software has made designing and administering surveys easier and less costly, their use has increased in many workplaces (Field 2020). Public sector practitioners often receive surveys from their employers, the professional associations with which they are members, partners and funding agencies, and researchers and other third parties (Leider et al. 2016). In conversations and interviews we have had with city sustainability managers, many describe experiencing survey fatigue from frequent requests from researchers and others seeking information about their work. Along these lines, Field (2020) likens modern survey practices to a tragedy of the commons dynamic, in which the collective overuse of surveys may threaten their own viability. Governmental ethics typically prohibit officials from accepting gifts, precluding survey practitioners from leveraging financial incentives. While declining response rates are a concern almost universally (Fincham 2008), practitioners polling local government officials cannot employ a key tactic for boosting those declining rates. The provision of upfront monetary incentives in the form of cash or a gift card is a well-established method of improving response rates in general population surveys (Dillman, Smyth, and Christian 2014) and surveys of elite and semi-elite populations, including physicians (Thorpe et al. 2009) and small business owners (Seshadri and Broekemier 2022). Limitations on offering monetary incentives to local government officials remove an important tool from the survey researcher's toolbox. Local governments have become a target of cybersecurity threats. Local governments are a particularly attractive target for cyber-attacks because of the sensitive information on residents they store (e.g., drivers’ license numbers), the physical infrastructure they manage (e.g., water treatment facilities), and because financial constraints often impede them from staying up to date on effective cybersecurity protections (Norris et al. 2019; Norris 2021; Preis and Susskind 2022). As cyber-attacks on local governments intensify, municipalities are increasingly investing new technology, policies, and education efforts to combat them (Hatcher, Meares, and Heslen 2020). We suspect these efforts are both reducing the portion of local officials that receive emailed surveys (due to email filters and safeguards) and making them less likely to respond when they do receive them. This is perhaps typified by a message we received from a city engineer from a small city in Michigan in response to a 2021 survey invitation: “If this is real, you are going to have a hard time getting people to ‘click’ on your links to fill out the survey. We (local governments) are all under siege with potential cyber security [threats]. Sorry. It's a tough time.” Political polarization makes some officials uneasy about going “on record” with their opinions (even in anonymous surveys). The increase in political and ideological polarization in the United States (Graham and Svolik 2020) and elsewhere (Charron, Lapuente, and Rodriguez-Pose 2022) is well-documented. Local government officials are not immune from this trend, which can manifest as increased public scrutiny around their statements and actions, especially on issues characterized by liberal-conservative divides (cf. Hansen et al. 2021). Anecdotally, we have had potential respondents express reluctance to participate in surveys for this reason, even when promised anonymity. Moreover, the rise of “fake news” which has helped create partisan and ideological echo chambers (Nguyen 2018) also appears to be making officials increasingly suspicious about the motives of survey researchers and apprehensive about how information they might offer could be used or misused. We more frequently now receive replies from potential respondents stating that they do not believe our work is unbiased or nonpartisan, or asking who is funding it and why.
Patterns in Survey Administration and Responses Rates
To our knowledge, there are no published studies that examine the administration of surveys targeting local government officials. In this section, we review patterns in scholars’ use and deployment of such surveys as part of urban policy and administration research, paying particular attention to trends in response rates. We do this via a systematic review of articles published in 13 top urban studies and public administration journals from the years 2010 to 2021. Figure 1 provides a step-by-step overview of the process used to identify journals, articles, and surveys for analysis.
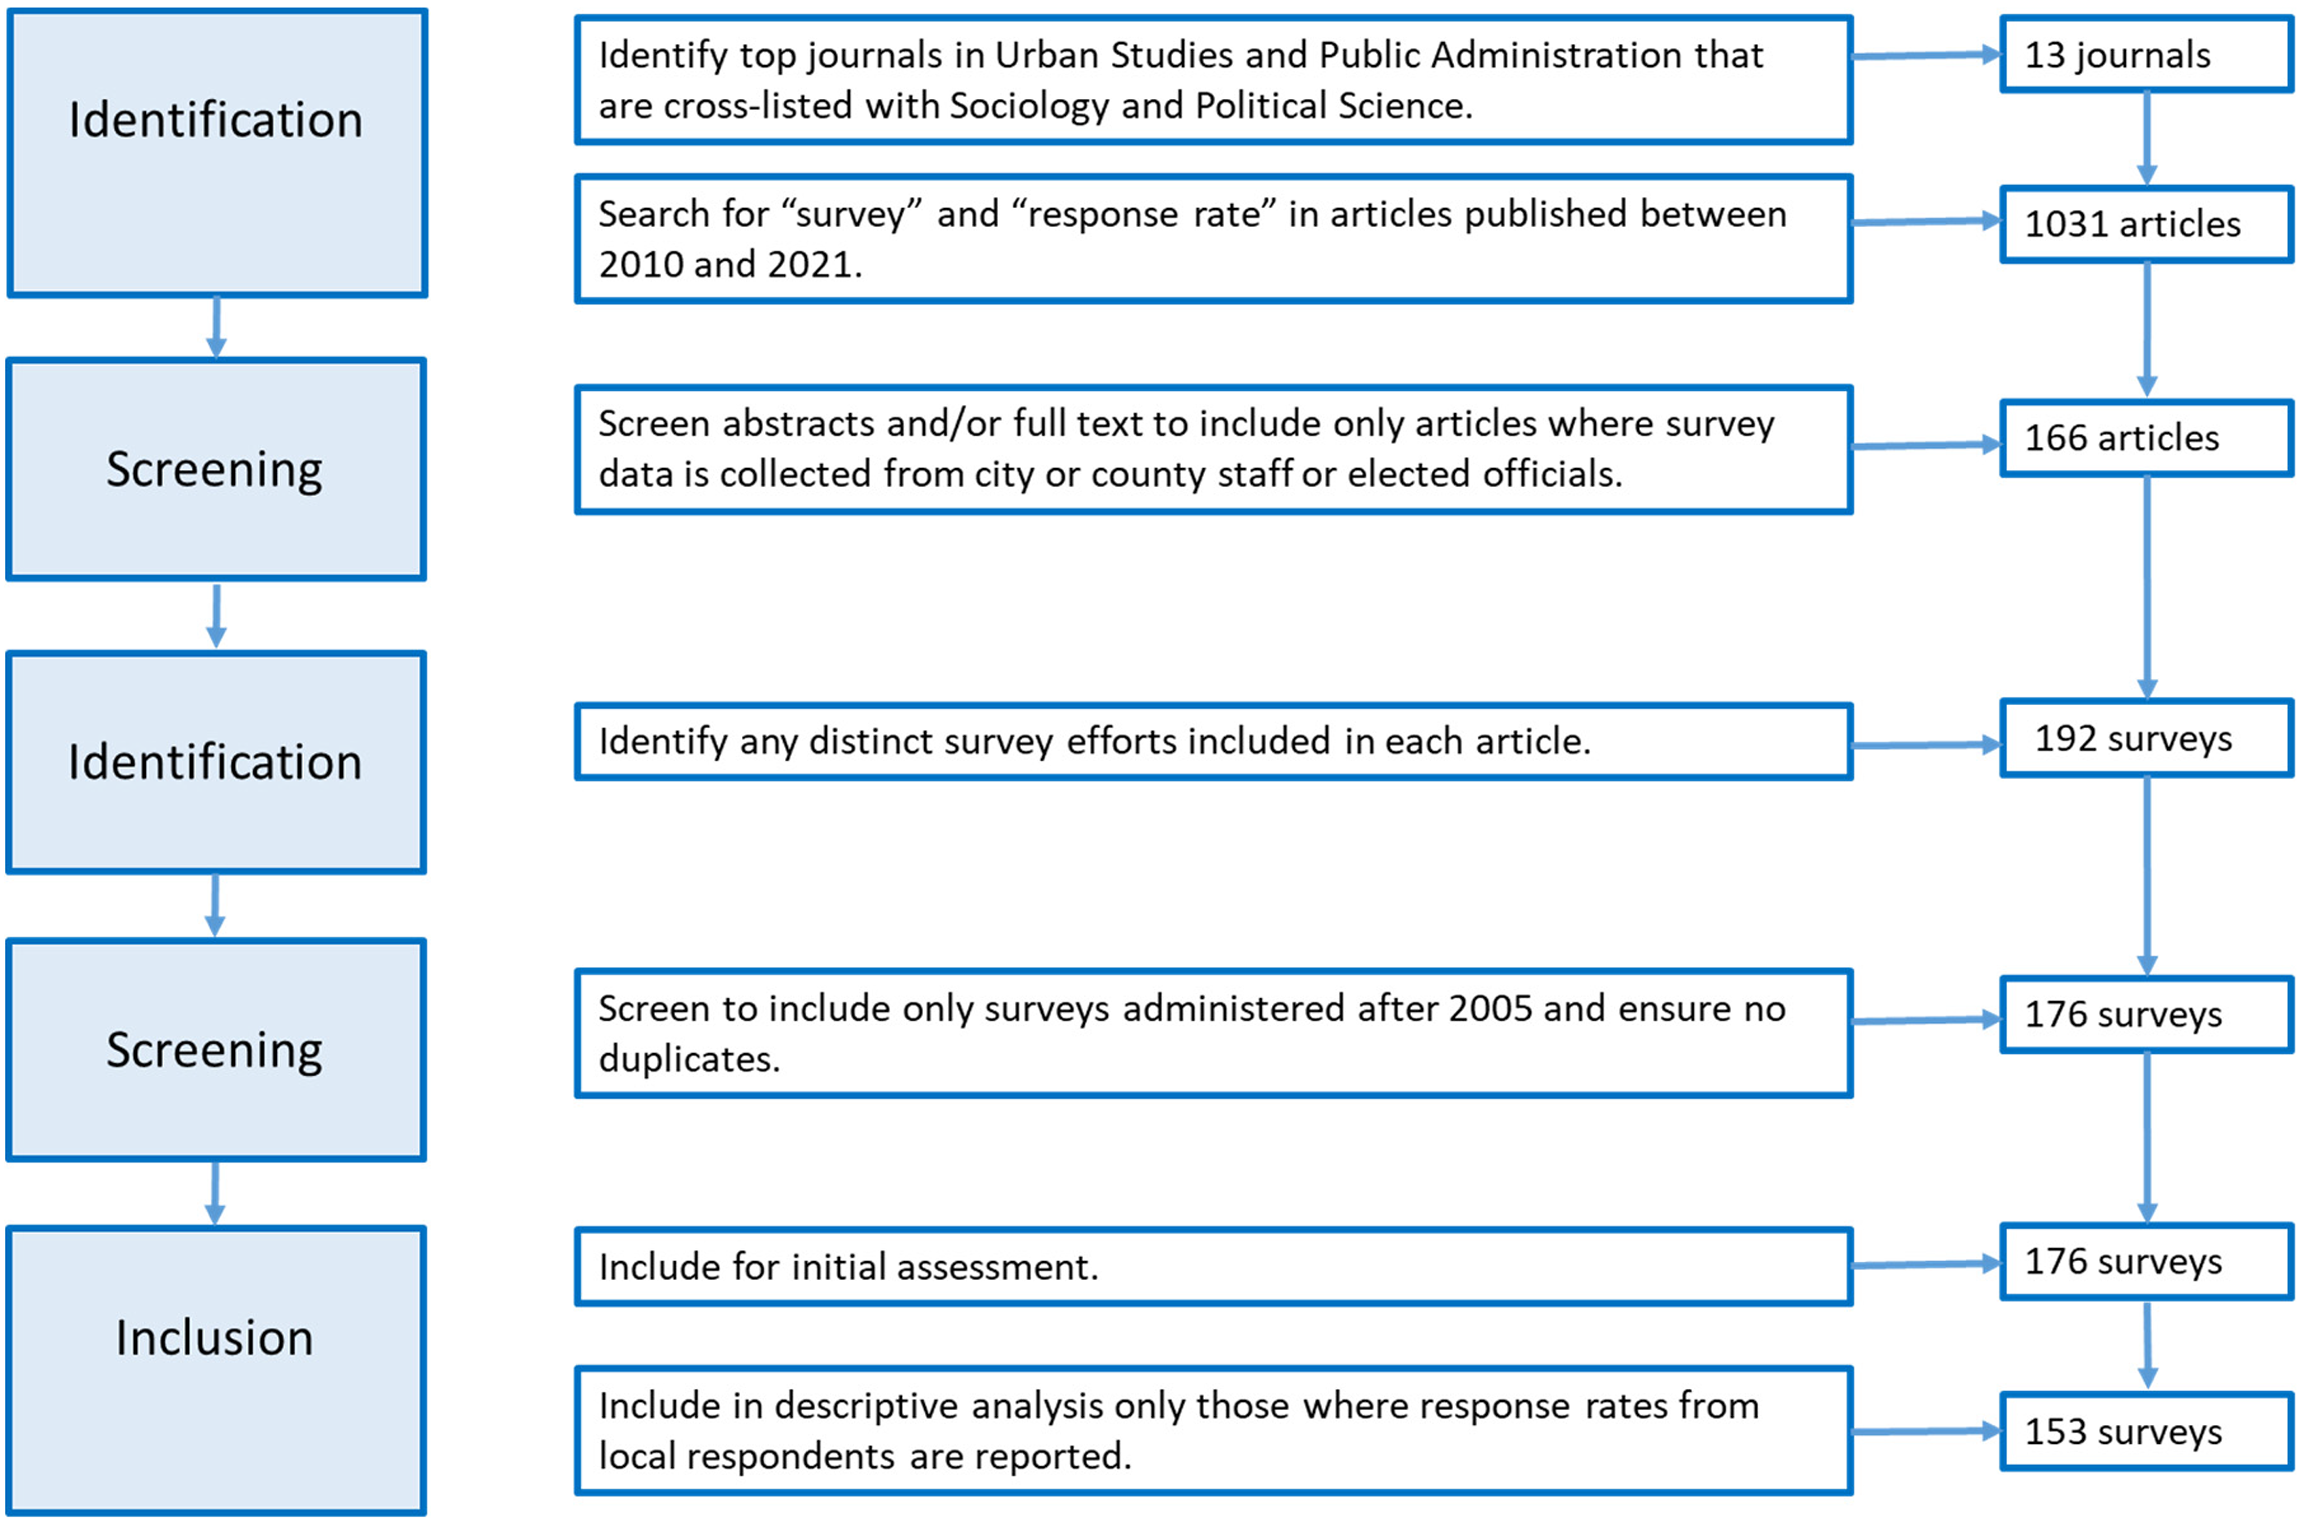
Data collection methodology. Steps adapted from Yeganeh, McCoy, and Schenk (2020) and Moher et al. (2009).
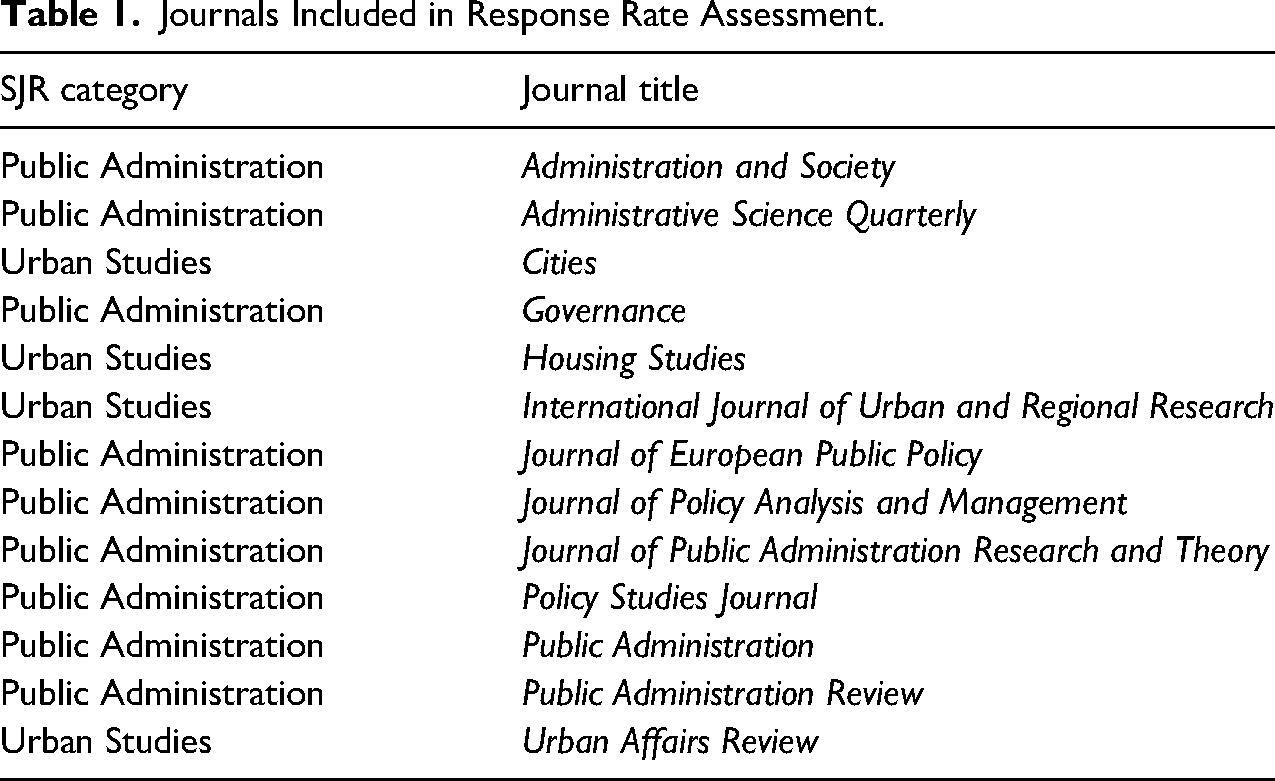
The 13 journals were determined via a two-step process. First, we identified the top 15 journals in each of the Urban Studies and Public Administration SJR subject categories according to their 2020 H-index. To ensure a policy or governance focus, we cross-listed these 30 journals with the Sociology and Political Science SJR subject category and targeted the 13 journals that are also included within it. Table 1 lists the journals covered in this review. To identify relevant articles, we searched each of these journals between the years 2010 and 2021 using the search terms “survey” AND “response rate.” This initial search yielded 1,031 articles. Members of the author team then skimmed the abstract and, as necessary, the methods section of each article to determine whether the analysis used survey data collected from local government officials. Any article for which this was not the case was removed from the sample. After this process, the dataset included 166 articles.
Journals Included in Response Rate Assessment.
The ultimate unit of analysis for this review is survey efforts. Some articles employ data from more than one survey administered to local government officials and, in several cases, data from the same survey were used across multiple articles. This resulted in a total of 176 distinct survey efforts used in research published between 2010 and 2021 in these 13 journals. 2 To the extent possible, we collected the following information about each survey effort: (1) year the survey was administered; (2) who administered it (i.e., the authors or an organization/agency); (3) the mode of administration; (4) the country in which it was administered; (5) the number of subjects surveyed; (6) the reported response rate; (7) the survey topic/subject area; and (8) whether the survey targeted elected or unelected subjects.
Analysis of Survey Practices
We divide the results of our assessment into two sections. First, we examine patterns in survey administration targeting local government officials. This assessment is based on 176 distinct surveys, which were used in 166 articles, published across 13 journals (see Figure 1). Second, we analyze patterns in response rates. We were unable to obtain sufficient information on local response rates for 23 of the 176 surveys, thus, response rate assessments are based on the remaining 153 surveys for which this information is available.
From 2010 to 2021, the journals included in the study published an average of 15 articles a year that employ survey data collected from local government officials. 3 When looking at 5-year periods, the survey efforts are relatively evenly distributed over time: 53 were administered between 2005 and 2009, 63 from 2010 to 2014, and 48 from 2015 to 2019. In addition, six surveys were administered in 2020 and 2021. Across all the surveys, more than 70% targeted unelected municipal staff and the remaining roughly 30% targeted elected local leadership or a mix of both elected and unelected officials. The surveys covered a broad range of topics with observable clusters in the areas of (1) environment, climate, and sustainability; (2) economic development and fiscal health; (3) public service motivation; (4) performance information; (5) networks and collaboration; (6) technology and smart cities; (7) service delivery; and (8) ethics and accountability.
The survey efforts in the sample were overwhelmingly conducted by individual or teams of university-based researchers, with about 20% done by or in collaboration with an organization (e.g., National League of Cities, ICMA, Max Planck Institute) or a state or federal governing agency (e.g., California Governor's Office of Planning and Research). The surveys were administered in 27 countries, with the majority targeting local government officials in the United States (n = 102). Denmark, with 12 surveys, was the second most surveyed country. Overall, 59% of surveys in the sample were administered in North America (all but one of these in the United States), 33% in Europe, 6% in Asia, and under 1% each in Australia and South America.
Determining the mode(s) by which surveys were administered (i.e., online, paper, in-person, or over the phone) proved challenging. To the degree possible, we documented the initial or primary mode(s) of survey administration. But for almost a third of the surveys in our sample, articles did not provide a description of the administration process sufficient for us to discern initial or primary mode(s). Among the survey efforts we could assess, 57% were initially and primarily administered online, whereas 28% relied on paper surveys. Eleven percent of surveys used both online and paper methods. Finally, approximately 4% of the survey efforts were conducted over the phone or used highly personal methods such as face-to-face interviews. It is worth noting that researchers may sometimes do one-off survey administrations in different modes to cater to a particular respondent's preferences (e.g., a respondent with cybersecurity concerns might request a paper survey rather than take the survey online) and that follow-ups after initial administration often heed the best practice of using a different mode than the initial survey invitation (Dillman, Smyth, and Christian 2014). Because of limited descriptions in many of the articles in our sample, we did not document the extent to which survey efforts used alternative modes in follow-up.
Analysis of Response Rates
Response rates among the surveys in the sample range from 1.4% to 96.7% with a mean of 41%. Figure 2 shows a two-way scatterplot of each survey's response rate by the year it was administered. Despite a subset of surveys that achieved response rates near or above 80% fairly consistently across the study's timeframe, 4 the trend line indicates a notable decline in response rate over time. Figure 3 shows the same set of data points and breaks them out by the continent on which surveys were administered. Trend lines are added for North America and Europe, the two continents where the vast majority of the surveys in the sample were administered. These indicators suggest that the decline in response rates is driven more by surveys in Europe than in North America (more specifically the United States, where most of the North American surveys were conducted). It warrants mention that all of the surveys in the sample that were conducted in 2020, during the height of the COVID pandemic, were administered in European countries. The relatively poor responses received during that year angles the trend line down. However, even when disregarding surveys conducted after 2019, the overtime decline in response rates from surveys administered to local government officials in European countries proceeds at a faster rate than for those in North America.
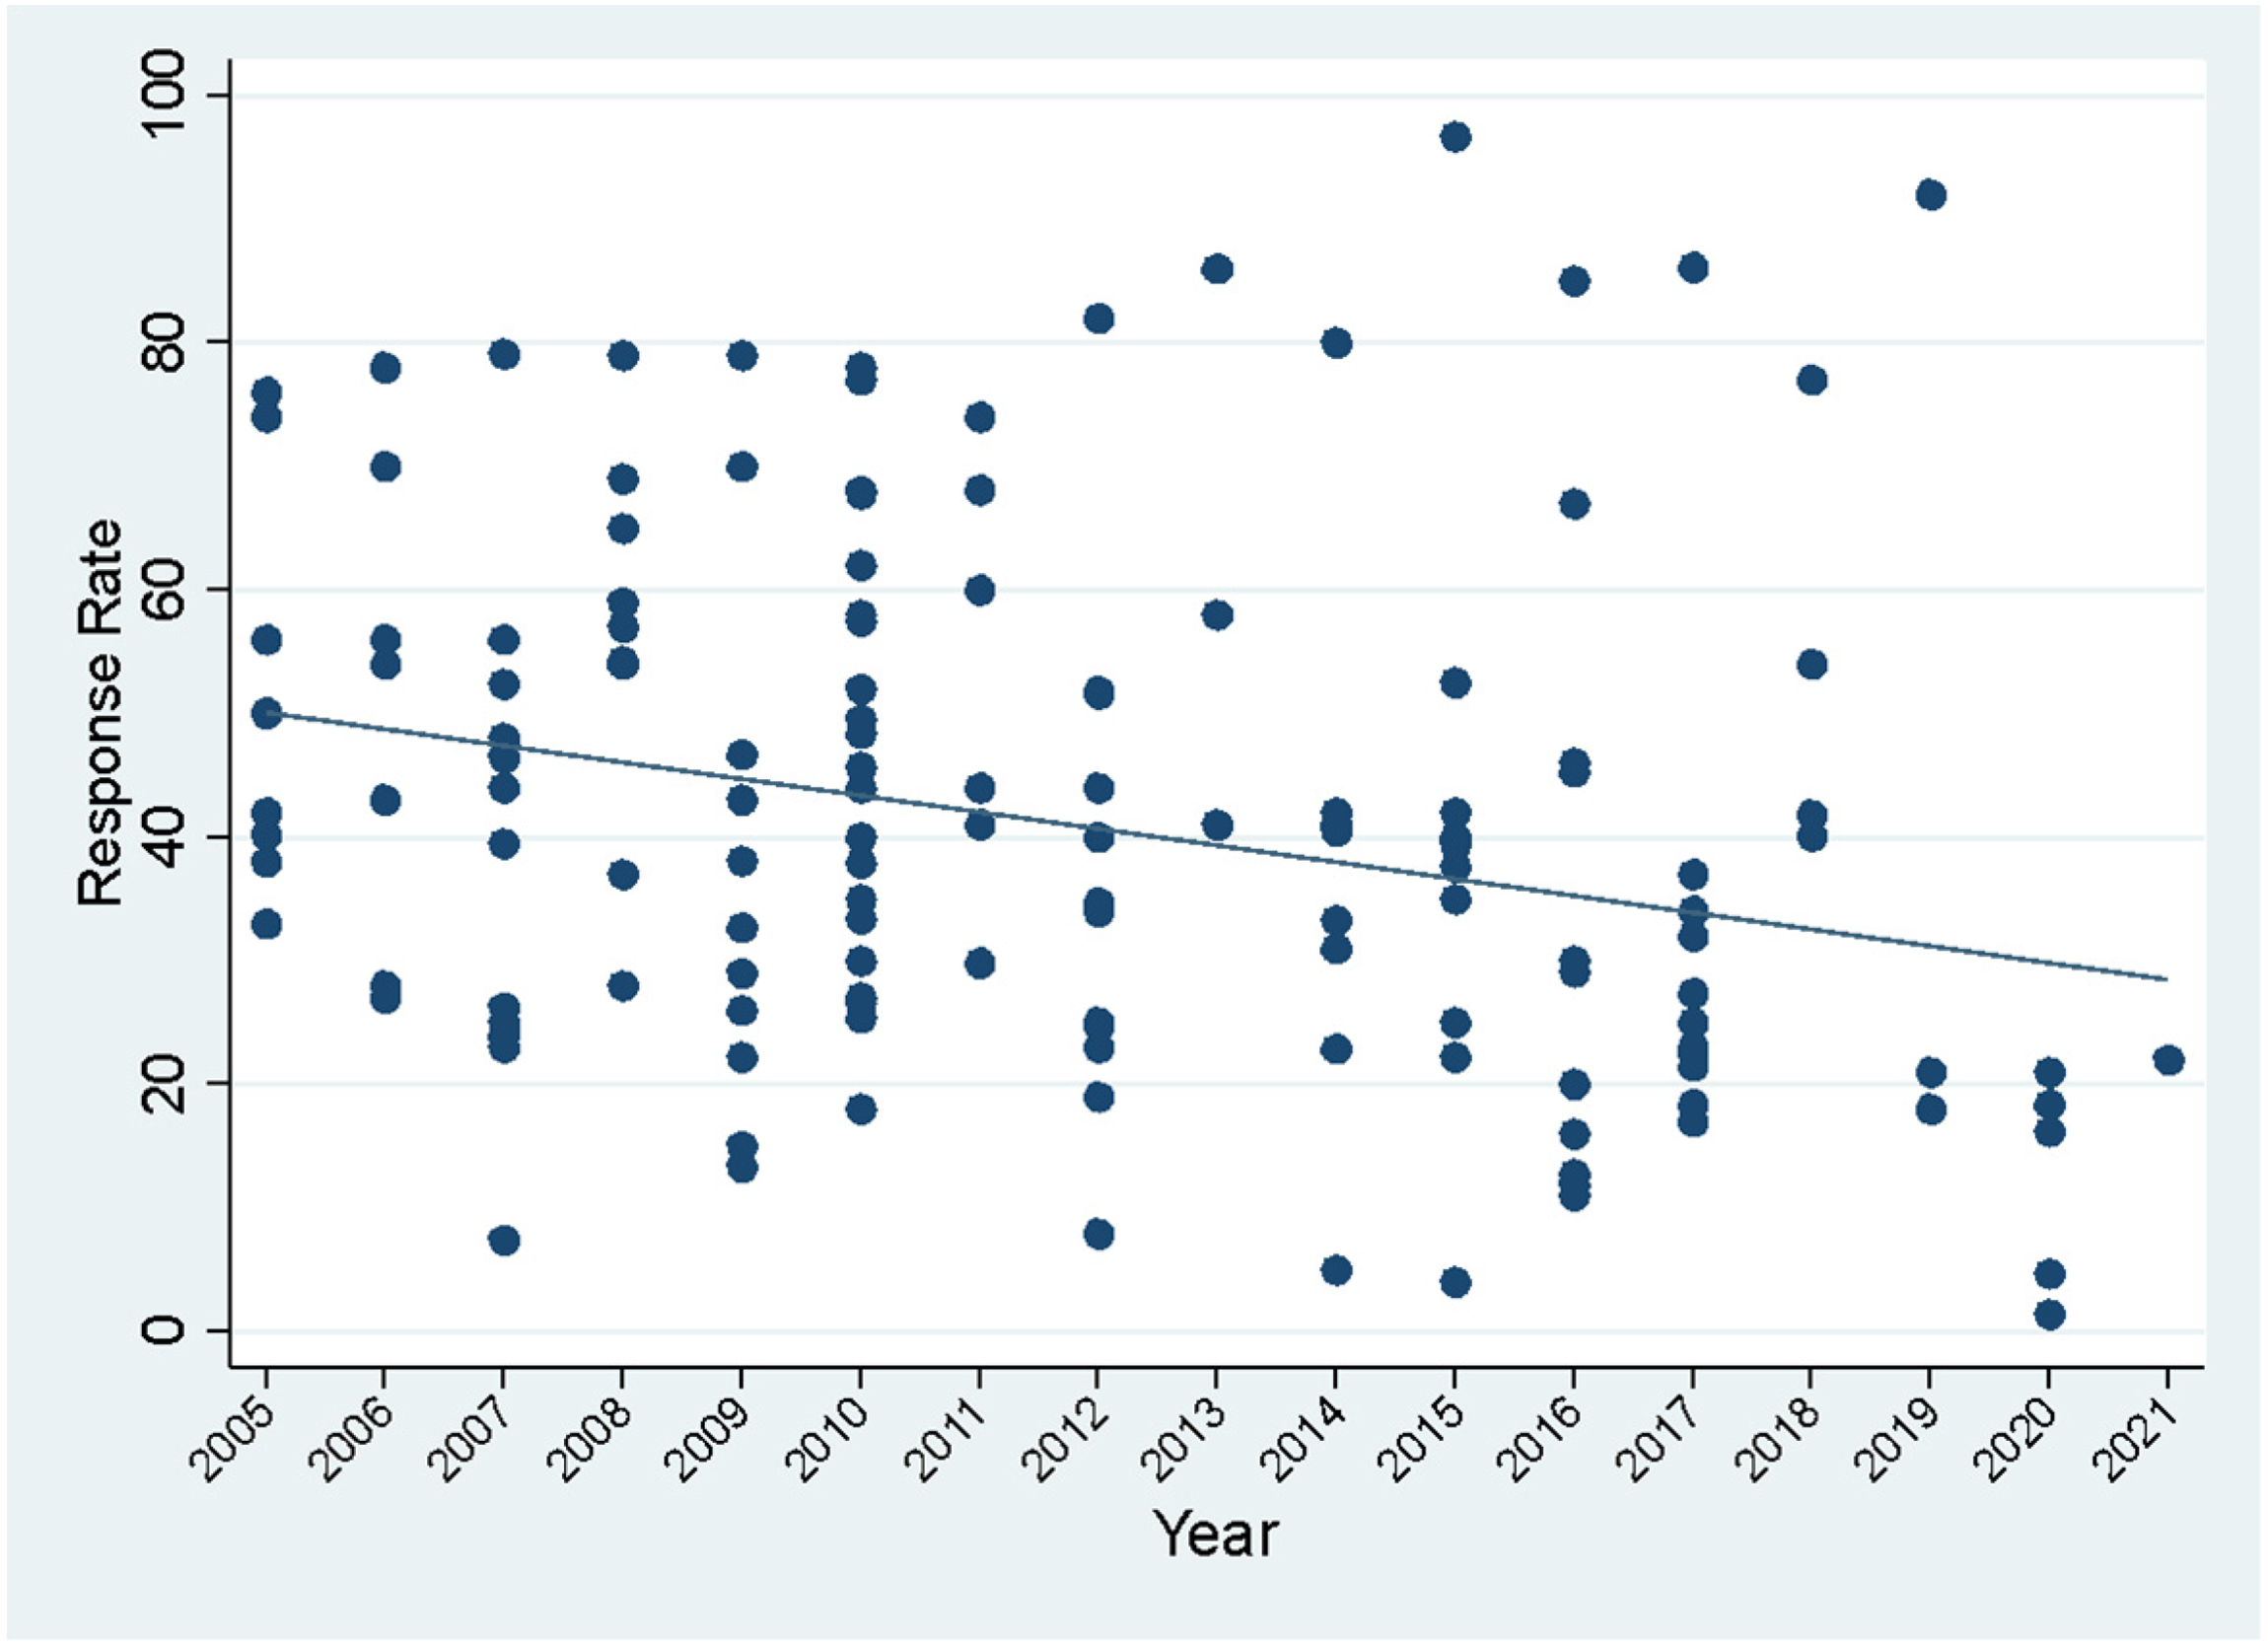
Survey response rate by year administered (n = 151).
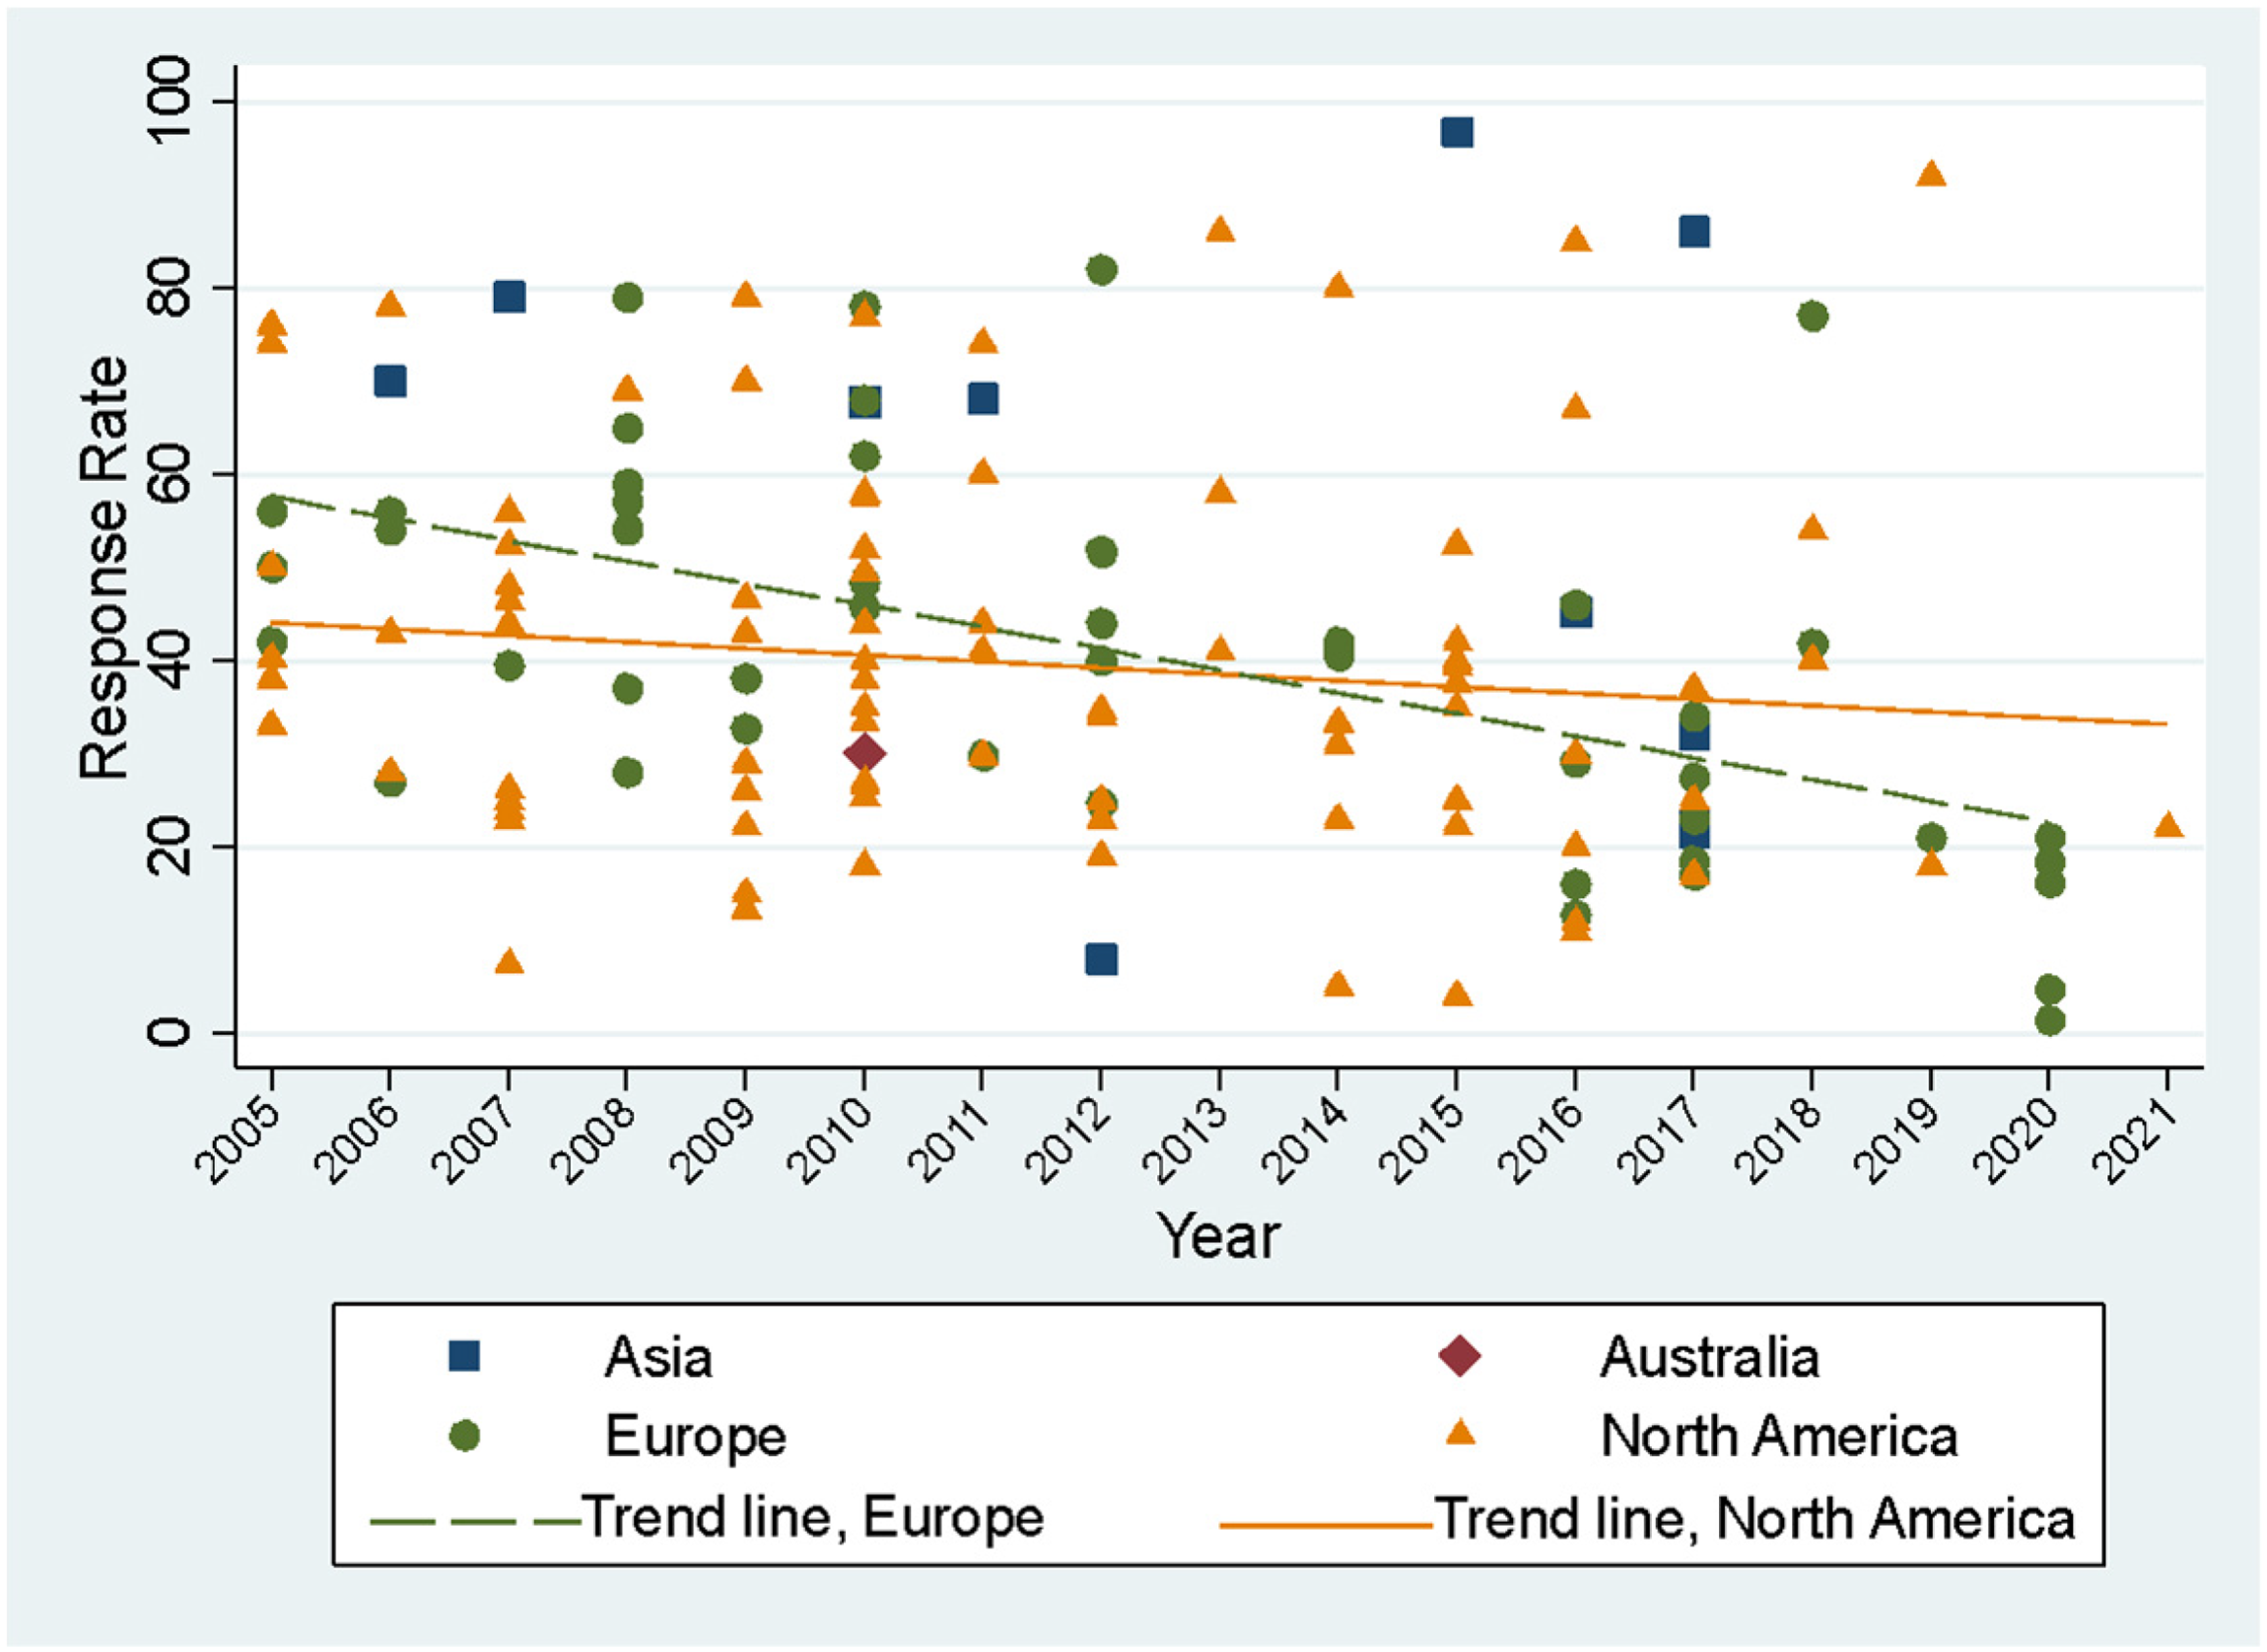
Survey response rate by year and country (n = 151).
We do not detect meaningful patterns in survey response rates across topic areas. However, the average response rate for surveys sent to local elected officials is 12 percentage points lower than for surveys sent to unelected city staff (32% vs. 44%). In addition to their location, timing, and subject area, the size and scope of the survey efforts directed toward local government officials also vary considerably. While the majority (63%) of survey efforts in our sample have a nationwide scope, some surveys target numerous officials within one or a small number of cities, while others target local governments within a particular state, province or region. The survey with the smallest scope in the sample was sent to 40 local government officials, while the survey with the largest was sent to 36,193. Across the surveys, there is a −0.37 correlation between the number of recipients and reported response rate. This dynamic may reflect challenges associated with individually following up with recipients in a larger sample or the fact that nationwide surveys cannot be as closely tailored to respondents as they could be in more delimited surveys (e.g., with locally relevant examples or specific reference to local policies or programs.).
Nationwide surveys are valuable in their ability to generate data able to support generalizable findings that can advance fields of urban policy and governance. But, all else equal, the larger sample sizes and geographic distribution of respondents in nationwide surveys make these efforts more costly and challenging to administer than their counterparts with smaller scopes. This is particularly true if researchers use non-web-based administration modes. Figure 4 displays the subset of surveys in our sample that have a national sample and were administered by university-based researchers (i.e., not a government agency or other institution) for which we could determine the primary survey administration mode. The solid trend line represents the change over time in response rates for nationwide surveys to local government officials conducted primarily online. The dashed lines represent the trend in survey responses for similar surveys that used any other mode of administration. The over-time declines observed are steepest for online surveys and represent a challenge for urban policy and administration scholars. We next describe our attempts to mitigate this decline in one survey effort, and offer a comparison of the cost-efficacy of different follow-up modes.
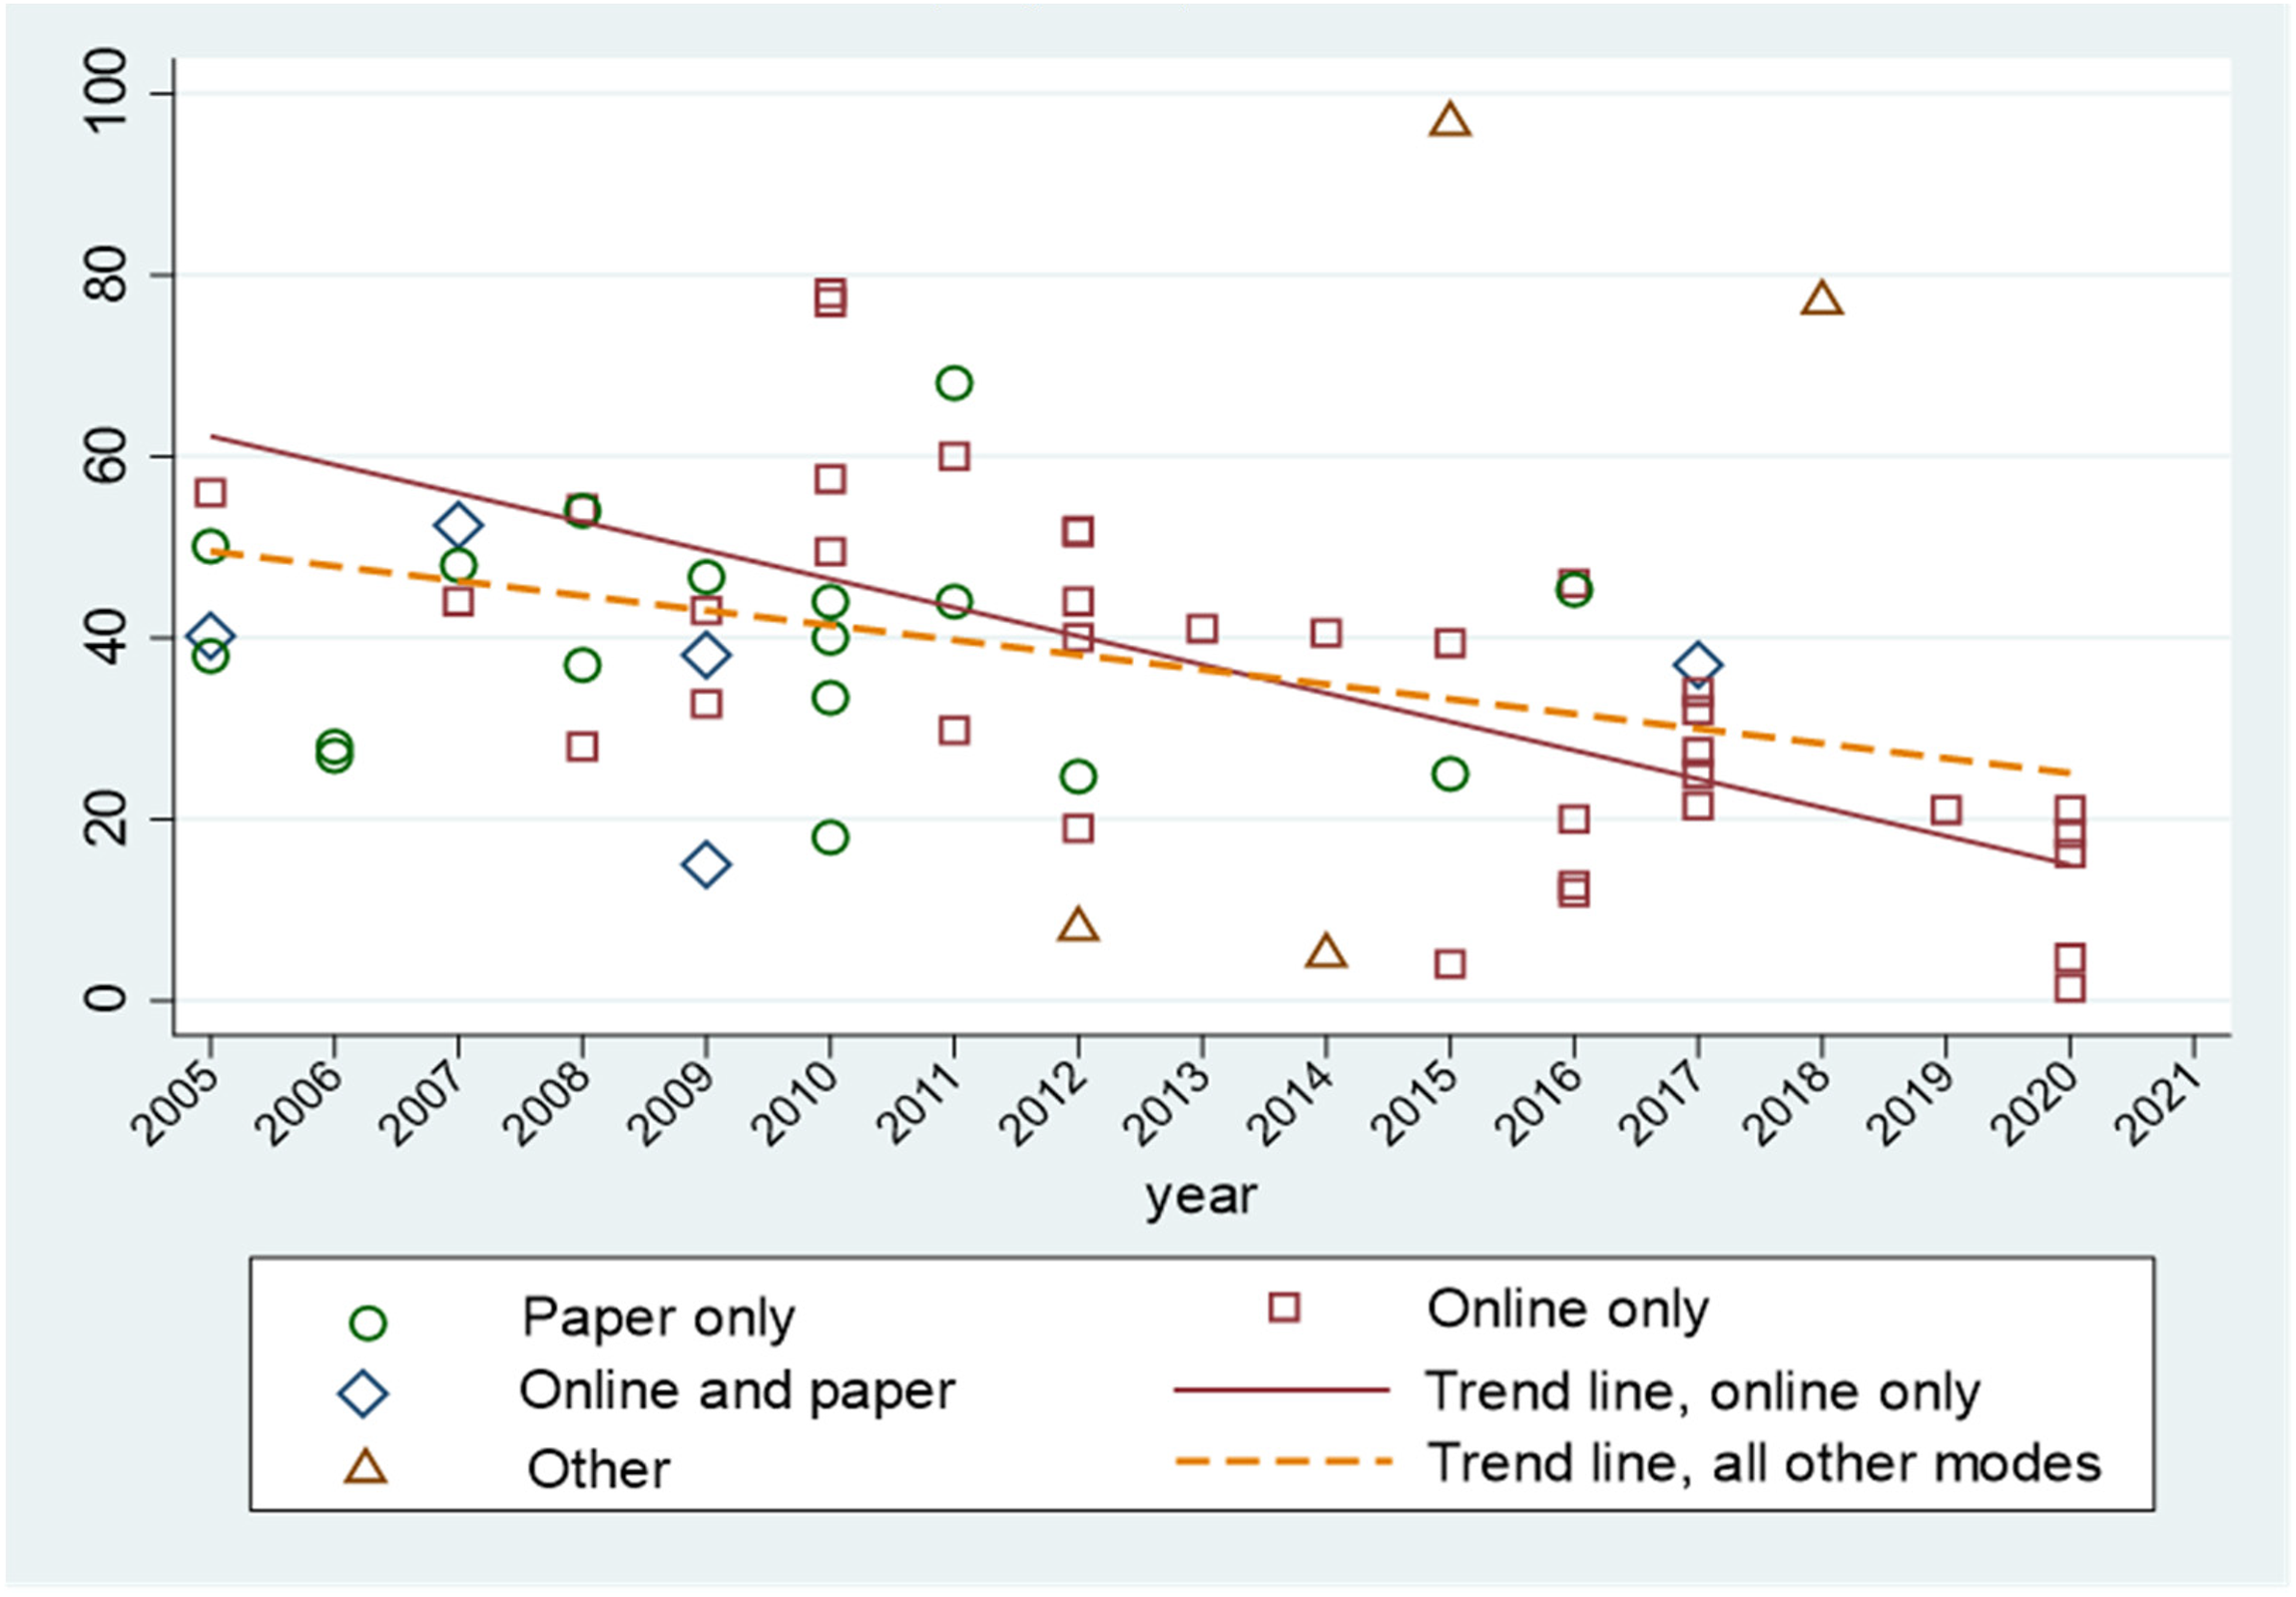
Response rate by year and primary mode of administration for nationwide, researcher-administered surveys (n = 77).
Time, Cost, and Response Rates: A Survey Follow-up Experiment
Research methodologists have conducted experiments in which they compare response rates to surveys, typically administered to members of the general public, via different modes (see e.g., Daikeler, Bošnjak, and Manfreda (2020) meta-analysis of survey response rate experiments). However, there is little concrete data on the tradeoffs, in terms of efficacy and cost, that researchers may encounter when choosing among ways of contacting local government officials to encourage survey completion. The authors of this research note conducted an experiment to develop practical knowledge to this end. In late 2021, we administered a nationwide survey to staff from 2,049 US city governments concerning city decision-making about environmental hazards. The survey contained 37 questions and was estimated to take 15 min to complete. It was emailed to the direct email address of the person in each city government pre-identified by the research team as most responsible for or knowledgeable about the survey topic. The survey was accessible via a Qualtrics link. After the initial invitation email and three reminder emails, the response rate for completed surveys was slightly over 13%—much lower than what previous similarly structured survey efforts had yielded in the past.
Following common best practice (Dillman, Smyth, and Christian 2014), we next employed non-web-based follow-ups to try to increase this rate. This is where we introduced an experimental component. The contacts from the 1,662 cities who neither responded to nor opted out of the email survey invitations were randomly assigned to one of three groups for follow-up: a hard copy mailing, a postcard with a QR code, or a personal phone call. We recorded the time and material costs associated with each approach in order to calculate their respective costs per contact and per response. These costs do not include time spent gathering individualized contact information for each recipient, as this largely occurred before the initial email-based survey effort. Costs associated with designing and formatting mailings are also not included.
The first group of recipients received a hard copy survey, mailed in an A9 (8.5 × 5.5) envelope with a printed label and first-class stamp. Each mailing included a cover letter, the full survey, and an information statement, printed double-sided on eight sheets of paper. A self-addressed stamped envelope was included for survey returns. The second randomized group of recipients was sent a postcard (see Figure 5), printed with a QR code on the front and a short URL on the back, both leading recipients to a Qualtrics interface where they could complete the survey online. For both the hard copy and postcard mailings, we ran recipient postal addresses through an online address validity check prior to mailing. Addresses were corrected as necessary. The third group of recipients received a phone call asking them to complete the survey. Student research assistants, who followed a script and received training on how to engage with local officials via phone, offered to re-send the recipient's unique Qualtrics link or administer the survey to the recipient in real-time over the phone. Interestingly, no phone call recipient chose phone-based survey completion; every willing respondent opted to complete the survey online themselves through a re-emailed link. Two to three attempts were made to reach each city's intended survey respondent.
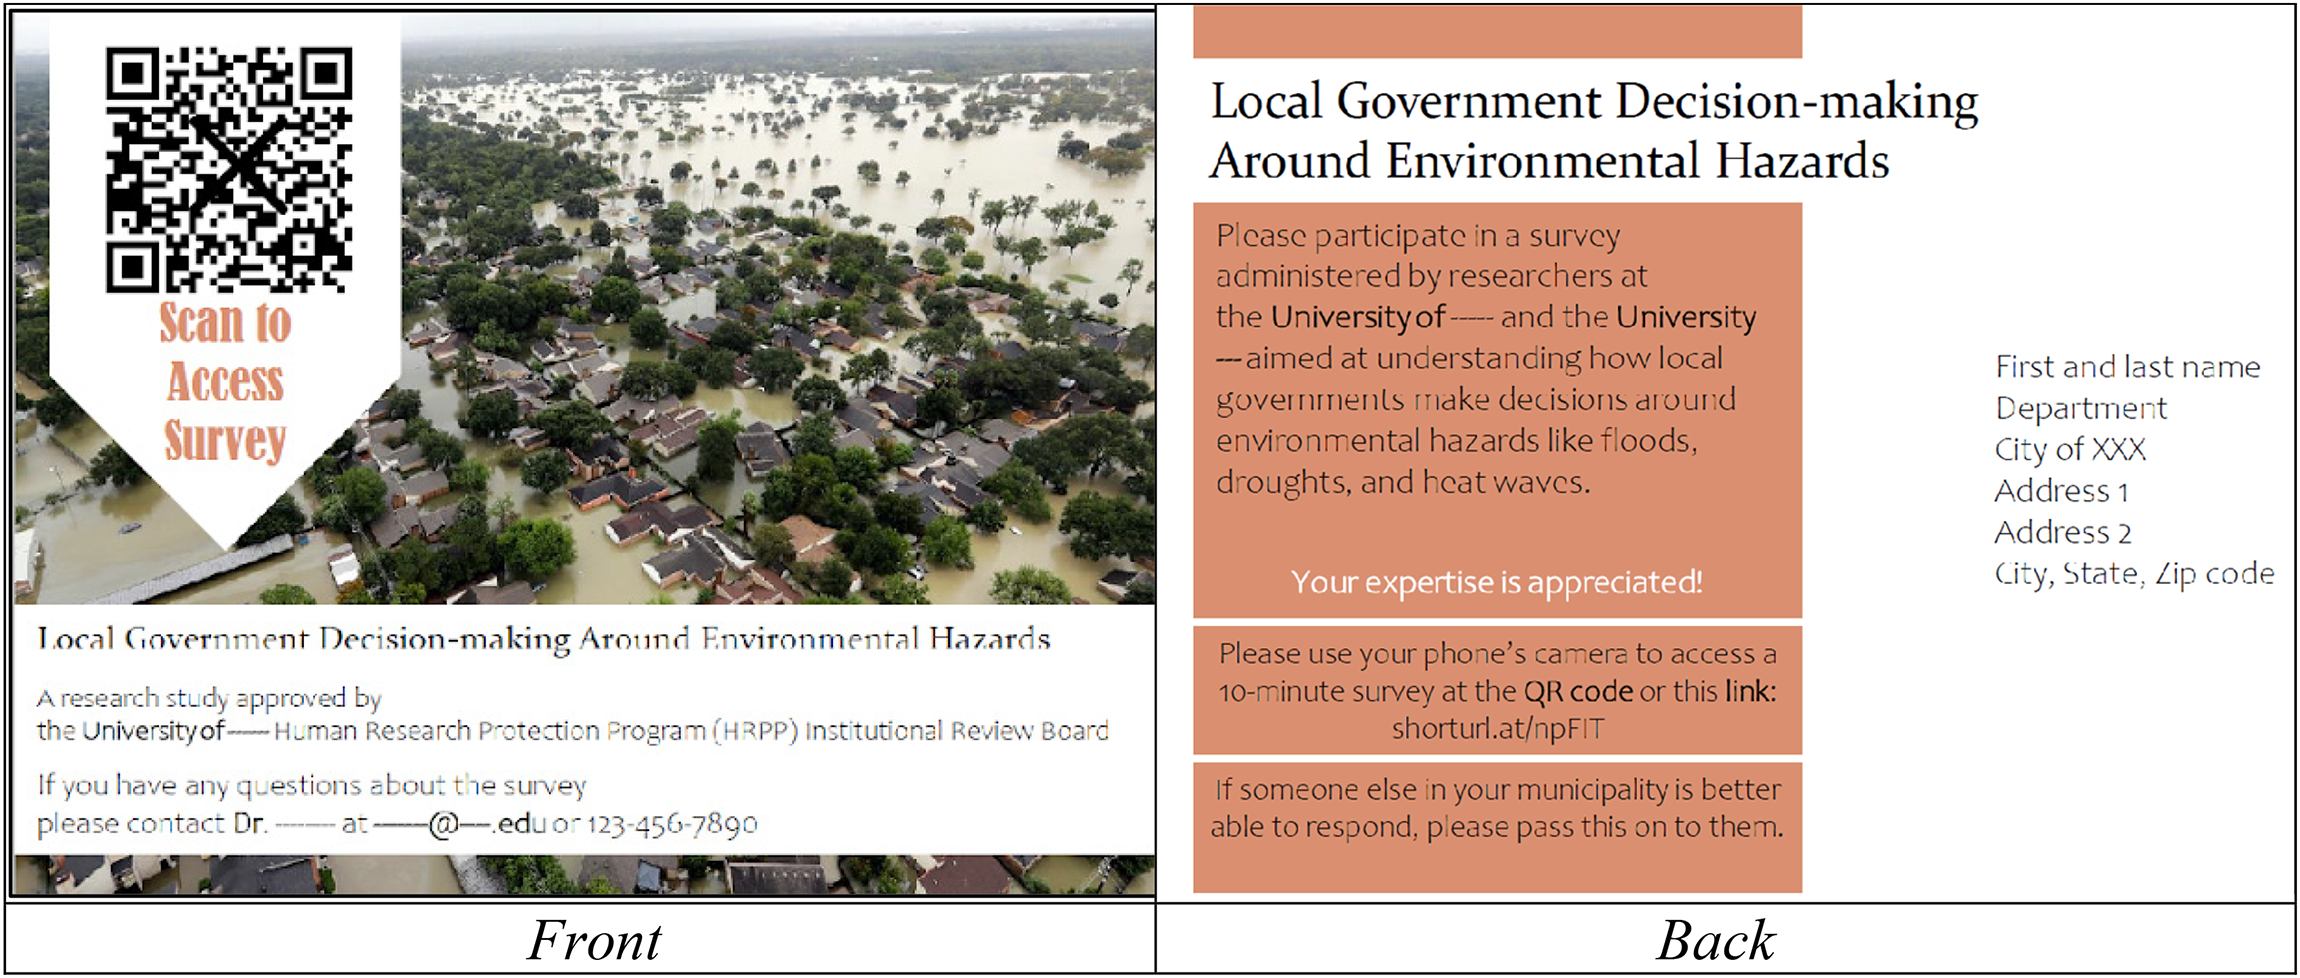
Image of postcard sent to survey recipients.
Table 2 shows the material and time costs associated with each follow-up approach, assuming a rate of $15.00 per hour. At $1.48 per unit, the QR-containing postcard was, by a large margin, the least expensive of the three approaches. Costs were mostly for the purchase of materials since relatively little time was needed to label and stamp cards. The phone call follow-up method had the middle-range per-unit cost, which came completely in the form of time and averaged $3.46 per city. Each city was called between two and three times. The traditional approach of mailing a hard copy survey was the most expensive, at $4.70 per unit. These costs are approximately equally divided between material purchases and time spent stuffing envelopes and entering data from hard copy returns.
Material and Time Cost for the Three Follow-up Approaches.
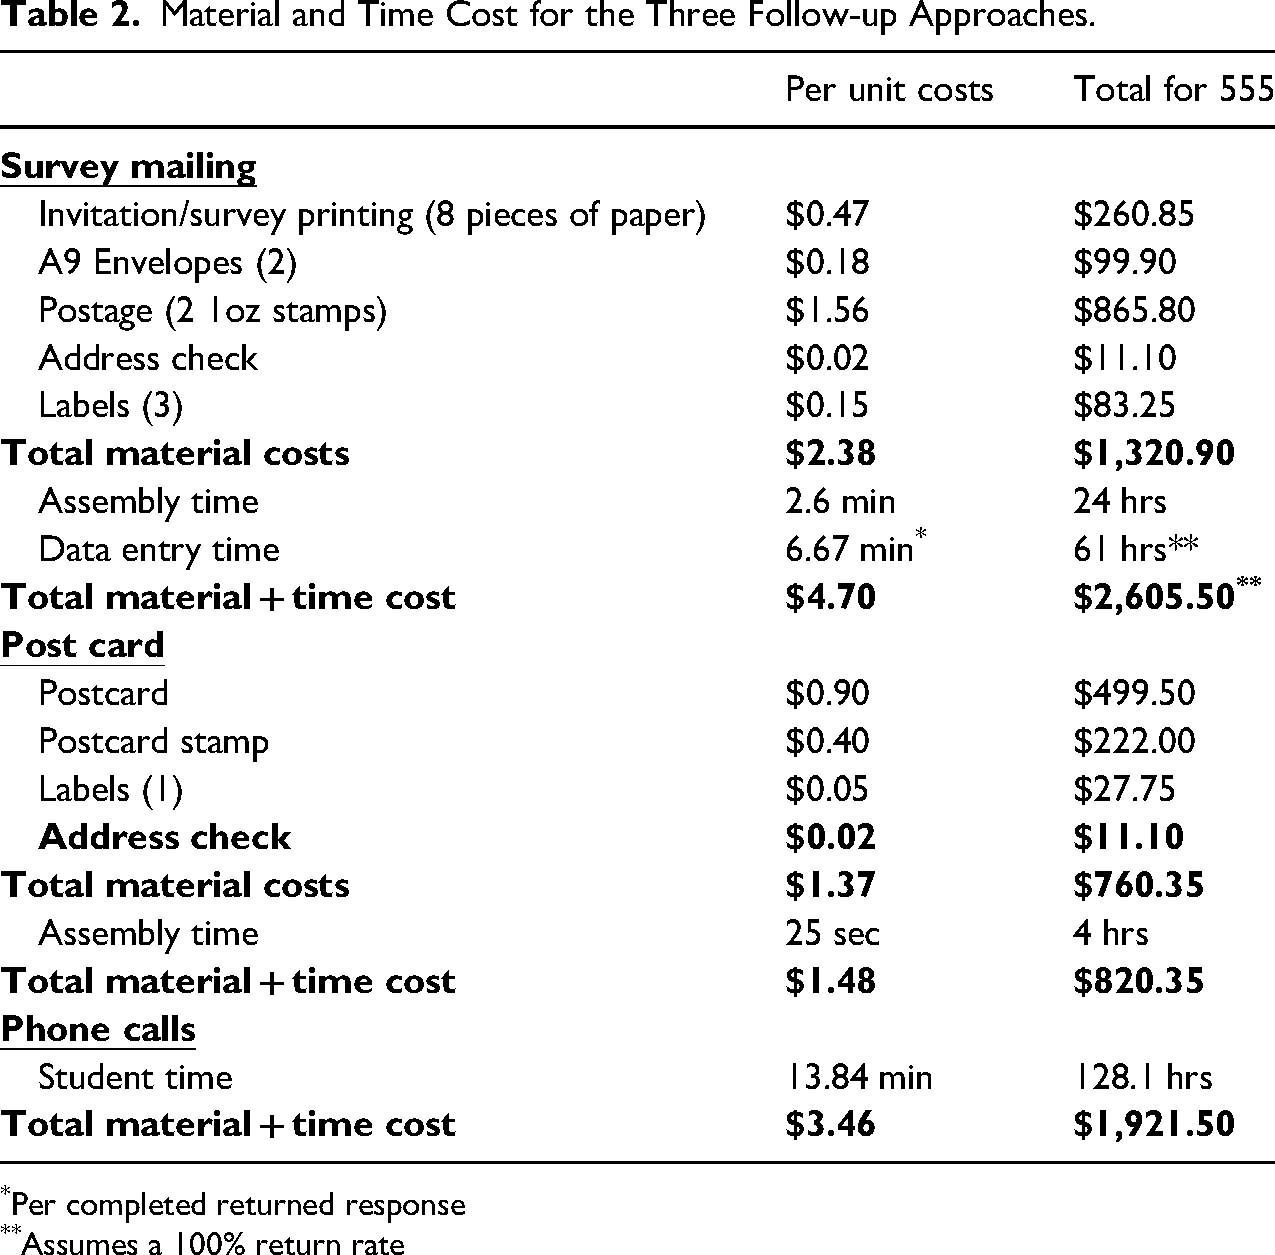
*Per completed returned response
**Assumes a 100% return rate
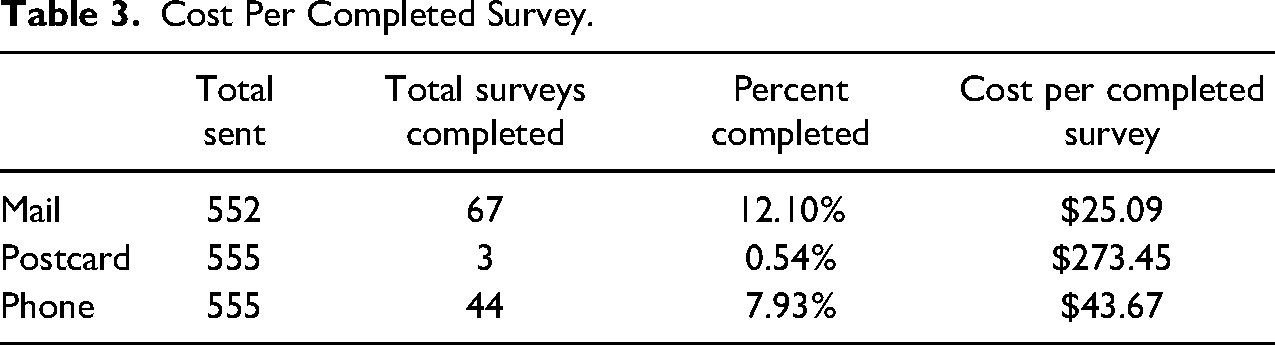
The per-unit cost of administering each follow-up approach is only part of the story. Arguably the more important part is the number of responses received and the cost per completed survey yielded by each approach. The entire follow-up effort, across all three modes, resulted in submission of 114 additional complete surveys. A total of 67 completed surveys were returned from the hard copy mail effort, 44 from the phone call effort, and only 3 from the postcards. Table 3 shows the per-unit cost of a completed survey achieved by each method. The expense ordering is reversed from what was observed in Table 2. Although each postcard was relatively cheap to administer, at a whopping $273.45, the postcards ended up being the most expensive follow-up approach per response received. At $43.67 per received response, phone-based follow-ups were considerably less expensive per completed survey. Finally, although its distribution costs were the highest, the traditional approach of mailing a paper survey to respondents yielded the largest number of completed surveys and the best return on investment. Still, at a price of over $25 per additional hard copy survey, researchers must think hard about the value of pursuing additional observations beyond online efforts.
Cost Per Completed Survey.
Recommendations and Conclusion
Cities are making forays into new areas of policy and governance, conventionally thought to lie within the purview of state or national governments (Acuto, Morissette, and Tsouros 2017). The rapid growth of urban centers, alongside the greater connectivity between cities through trade, partnerships, and transmunicipal networks, are bringing to prominence the important roles cities play in innovation and governance broadly (Bulkeley and Betsill 2013; Nguyen Long, and Krause 2021).
Surveys, particularly those targeted at knowledgeable local government officials, are an important tool able to help researchers understand these emerging dynamics and explain how cities behave in increasingly interlinked and complex policy arenas. A strong survey response rate can be crucial to generate a sample large enough to support quantitative analysis and representative enough to give insight into conditions across a range of subjects (Fincham 2008). Ten to twenty years ago, researchers could usually count on online surveys of local government officials as a cost-effective tool for yielding such strong response rates. Yet our longitudinal review of response rates in survey efforts targeting local government officials suggests that the days when online surveys could reliably deliver data on a significant proportion of city elites may be ending.
Our systematic review of the articles published in major urban policy and administration journals between 2010 and 2021 considered 176 survey efforts spanning 27 countries. We detect a downward trend in survey response rates, which was amplified during the COVID pandemic and appears more acute for online surveys relative to surveys administered via other modes. We suspect these declines are driven by survey fatigue, officials’ concerns about cyber security, and an increasingly contentious political environment. These factors present an impediment for survey-based research on urban governments. Still, there are steps researchers can take to try to shore up survey efforts in this challenging context. Our survey follow-up experiment helped illuminate some of these.
First, if researchers want to rely on online surveys, perhaps due to their low cost relative to other modes, they should be aware of the low and falling response rates particularly affecting this mode of administration and plan to address it. Specifically, researchers might consider scheduling a long survey administration period in which multiple reminders, likely more than the conventional two to three, can be sent. Changing the mode of survey administration during follow-up may help solicit more responses, but additional time and funds are necessary to make this switch. Second, if researchers have resources to support follow-ups using alternate modes, our experiment suggests that, despite their high up-front costs, mailing paper surveys may be the most cost-effective way of boosting responses to a national survey following online administration. Third and finally, researchers may be wise to exhibit caution when considering new, inexpensive, but untested approaches for survey solicitation. We were surprised and disappointed that the postcards containing QR codes resulted in such a low response rate, particularly since the material and time costs of this mode were much less than those for hard copy mailings or phone reminders. Although we were not aware of any other academic surveys using QR codes, we thought this method might be productive given the increasing use of QR codes by businesses and the public's growing familiarity with their use (e.g., many restaurants adopted QR codes for mobile ordering during COVID). Our gamble obviously did not pan out. We cannot be certain whether the QR code made potential respondents apprehensive or if their delivery via postcard made the solicitation easy to disregard. Additional experimentation may be warranted, especially since as younger professionals (i.e., digital natives) join the ranks of public officials, QR codes may become a viable, cost-effective method for recruiting survey respondents.
Readers should keep in mind that our findings regarding mode yield and cost efficacy are drawn from an experiment conducted among relatively hard-to-reach respondents. The follow-up targeted pre-identified local government officials who, for one reason or another, did not respond to the four initial email-based solicitations. These respondents are not low-hanging fruit. It is unclear if similar results would ensue if different modes for contacting local officials were used as an initial, rather than follow-up, survey effort.
It is likewise important to note that, although our experiment focused solely on the mode of distribution, the survey methods literature identifies numerous additional factors—such as pre-notification, invitation design, and sponsorship and number of contact attempts—that may also serve as levers influencing response rate (Tourangeau, Conrad, and Couper 2013). It is possible that their careful deployment could effectively reduce the impact had by some of the dynamics we previously identified as contributing to the trend of lower response rates from local officials. For example, a well-executed pre-notification message could reduce a city official's concern about the safety of clicking on a link to an online survey and an explicit partnership with a professional organization trusted by survey recipients may dampen potential fears that their provided responses will be politicized. Each of these strategies are also—of course—accompanied by their own resource and time-investment costs, and further study is needed to understand the added value of these factors. We challenge other urban researchers to experiment with these levers and record and share both differences in obtained response rates as well as differences in the costs and time required in order to provide the larger field with a more complete picture of tradeoffs.
In conclusion, the downward trend of responses to online surveys, and other modes of survey data collection, appears persistent. While worrisome, new and creative approaches are being developed for collecting data on local governments. For example, Sumner, Farris, and Holman (2020) describe crowd-sourcing local data collection by paying respondents small amounts to complete specific online data collection tasks. Web scraping and big data tools can support the automated collection and analysis of large quantities of local data (Kassen 2013) and are becoming an increasingly viable source of data as local governments digitize and place data on open sharing platforms. These techniques can reduce reliance on surveys sent to local government officials. They, however, cannot replace surveys entirely, since they are unable to capture information on things such as local officials’ perceptions and priorities or on informal municipal practices and deliberations. Still, utilizing these alternative approaches whenever possible can reduce the number of requests local officials’ receive, mitigating this population's overall survey fatigue. Fewer requests may result in higher response rates for surveys seeking information that can only be reasonably obtained via that mode. For this to work, however, there will need to be collective action among researchers (Field 2020). It will require not only a greater sharing of data, but also more communication between research teams prior to surveys being launched to find ways to share the burden of their administration and ensure that the questions asked will maximize data usability.
Footnotes
Declaration of Conflicting Interests
The author(s) declared no potential conflicts of interest with respect to the research, authorship, and/or publication of this article.
Funding
The author(s) disclosed receipt of the following financial support for the research, authorship, and/or publication of this article: This material is based upon work supported by the U.S. National Science Foundation under grant numbers 2049916 and 2049917. Any opinions, findings, and conclusions expressed in this material are those of the authors and do not necessarily reflect the views of the National Science Foundation.