
Abstract
The fate of residents living in gentrifying neighborhoods remains an important yet little understood outcome of the gentrification process. In this study, we assess the effects of gentrification on mobility patterns using the geocoded version of the panel study of income dynamics (PSID), a nationally representative longitudinal survey of households. While many studies examine whether residents move from gentrifying neighborhoods, few study their destinations. We utilize PSID data from 2001 to 2017 to identify each respondent's census tract and characteristics of the tract to which they moved. We find little difference in the socioeconomic status or access to the urban core of the destination neighborhoods of residents originating in gentrifying neighborhoods compared to the destination neighborhoods of residents originating in nongentrifying neighborhoods. Our findings inform debates on whether residents of gentrifying neighborhoods are pushed out of central cities and into worse neighborhoods than residents of other low-income neighborhoods.
Introduction
Gentrification, or the process by which central urban neighborhoods that have undergone disinvestments and economic decline experience a reversal, reinvestment, and the in-migration of a relatively well-off, middle- and upper-middle-class population (Smith and van Vliet 1998), has proven to be one of the most controversial topics amongst urbanists. 1 Despite the massive ink spilled on this topic, our understanding of the dynamics of residential turnover accompanying gentrification remains limited. We know little about the destinations of those moving out of gentrifying neighborhoods and whether trends are distinct in recent decades when gentrification became more widespread. Some urbanists have speculated that with successive periods of gentrification, American cities will come to resemble European cities, with the poor relegated to the urban periphery (The Economist 2019). Understanding these dynamics are crucial for both our theoretical understanding of gentrification and its consequences, as well as for policymakers who often act to promote gentrification and/or dampen some of the consequences associated with gentrification.
In this article, we utilize the panel study of income dynamics (PSID) to analyze mobility out of gentrifying neighborhoods as well as the destinations of those leaving gentrifying neighborhoods. We find little evidence of elevated mobility rates in gentrifying neighborhoods, on average, across multiple measures of gentrification. Our findings, along with other studies that also fail to find elevated mobility rates in gentrifying neighborhoods, suggest that the demographic changes that occur in gentrifying neighborhoods are not due to elevated mobility rates, relative to nongentrifying neighborhoods, of poor residents moving out. We find some evidence to suggest that those moving out of gentrifying neighborhoods move to somewhat poorer neighborhoods, but our estimates are not precise enough to reject the null hypothesis of no difference in destination neighborhoods between those leaving gentrifying versus nongentrifying neighborhoods. We suspect that these findings are largely explained by heterogeneity across metropolitan areas. Our article also considers if the destinations of those moving from gentrifying neighborhoods are different along spatial dimensions, including distance from origin neighborhood and moves out of central cities, but we fail to detect any differences.
In sum, our results are consistent with the strand of research that fails to find elevated rates of mobility among residents of gentrifying neighborhoods. Our paper expands the extant literature by shedding additional light on the destinations of movers from gentrifying neighborhoods, including the first we are aware of that utilizes a national dataset with relatively frequent observations. 2 Here, our findings show that household-level factors seem to determine destinations instead of the gentrification status of the origin neighborhoods. Our research thus broadens and deepens our understanding of how household mobility is influenced by neighborhood context.
Background
Here we describe how the changing context of gentrification necessitates a reconsideration of some of the recent findings on the relationship between gentrification and residential displacement. Gentrification during this century is occurring in more neighborhoods and cities than in the late twentieth century, when the process could aptly be described as “islands of renewal in seas of decay” (Berry 1985). Gentrification scholars describe this more recent period of gentrification as more rapid and widespread compared to the past, having an increased role of large-scale developers and the state, and expanding into areas further from city centers (Davidson and Lees 2010; Hwang and Lin 2016). The changing nature of gentrification has generated growing concerns over the consequences of gentrification for disadvantaged residents who live in these once low-income areas. Many studies document the variety of negative consequences faced by long-term, low-income residents as their neighborhoods gentrify, including increased financial burden and fear of displacement, the replacement of the area's cultural character and spaces, and the loss or threat of loss of political voice and representation (Freeman 2006; Hyra 2017; Pattillo 2007; Zukin 2009).
The primary focus of both scholarly and public debates over gentrification's consequences, however, has been the residential displacement of long-term, low-income residents (Atkinson 2004). The transformations that come with gentrification, especially the increased demand and concomitant rising home values and rents, may force an area's original lower-income residents to move. These moves can occur through formal processes like eviction because residents fall behind on payments on their rising property taxes or rents, or they can occur when residents choose to move as they face higher housing costs. But even some “volitional” moves can still be involuntary and reflect displacement. For example, residents can face intentional harassment or neglect by landlords or may take financial offers by landlords or developers hoping to replace their tenants with higher-paying ones or to rehabilitate the property to sell for a larger profit (Newman and Wyly 2006). Alternatively, the increased financial burdens associated with rising costs of living may lead residents to move somewhere more affordable (Marcuse 1986).
Quantitative studies relying on outmigration rates to assess displacement have typically not found strong evidence of low-income, long-term, or minority residents moving out of their homes at higher-than-average rates, either voluntarily or involuntarily (Ding, Hwang, and Divringi 2016; Ellen and O’Regan 2011; Martin and Beck 2018; McKinnish, Walsh, and White 2010; Freeman and Braconi 2004; Freeman, Cassola, and Cai 2015; Vigdor 2002). This research finds that most of the neighborhood-level demographic changes occur because of the higher rates of in-migration by college-educated, often-White, residents (Ellen and O’Regan 2011; Freeman 2005). However, a recent study by Lee and Perkins (2022) does find slightly higher mobility rates in gentrifying neighborhoods.
Despite the lack of a consistent link between gentrification and elevated rates of mobility, the passage of time suggests revisiting these analyses with more recent data may be warranted. Several of the studies rely on data from the last century. In the intervening years, there has been a housing bubble and bust, and the pervasiveness of gentrification itself, as noted above, has changed.
Research on evictions, a type of displacement, also fails to find consistent links with gentrification. Studies that have found higher rates of eviction in gentrifying neighborhoods have lacked counterfactuals—gentrifiable neighborhoods that did not gentrify (Chum 2015; Ramiller 2021). Several other studies have failed to find a connection between eviction rates and gentrification (Desmond and Gershenson 2017; Shelton 2018).
The second stage of the mobility process—destinations—is relatively under-examined in the gentrification literature. Those who do move as a result of gentrification may have worse destination outcomes, even if they are not more likely to move in the first place. Those moving out of gentrifying neighborhoods may be relocating to socioeconomically disadvantaged neighborhoods, or distant from important personal networks and social resources. For example, suburban locales often lack the physical and social infrastructure to support poor households (Kneebone and Garr 2010). Thus, if residents from gentrifying neighborhoods are moving to disadvantaged neighborhoods, either in terms of the socioeconomic status (SES) of the destination neighborhood, because of distance from central-city services, or distance from origin neighborhoods, this would suggest that gentrification does indeed have negative long-term consequences for disadvantaged residents who move. Therefore, understanding where residents move when they move is another important element for studying displacement.
Only a handful of studies on gentrification using longitudinal panel data have analyzed the characteristics of the areas to which residents move (Brummet and Reed 2019; Ding, Hwang, and Divringi 2016; Dragan, Ellen, and Glied 2019; Hwang and Ding 2020; Mah 2020; Lee and Perkins 2022). Ding, Hwang, and Divringi (2016) examine the median household income of census tracts to which residents move in Philadelphia; and Hwang and Ding (2020) examine a broader set of characteristics, including crime rates and elementary school standardized test scores. Ding, Hwang, and Divringi (2016) find that residents with low credit scores and residents without mortgages who move from gentrifying neighborhoods are more likely than residents from nongentrifying neighborhoods to move to neighborhoods with lower median household incomes compared to their origin neighborhood. Comparing neighborhoods by their racial compositions, Hwang and Ding (2020) find that low-SES residents from historically Black gentrifying neighborhoods end up in more disadvantaged neighborhoods, while low-SES residents from other neighborhoods actually tend to make upward moves. Using New York City Medicaid records from 2009 to 2015, Dragan and colleagues (2019) find no difference in neighborhood poverty rates in the destinations between low-income children who move from gentrifying neighborhoods compared with those who move from nongentrifying neighborhoods. In a case study set in Detroit, Mah (2020) finds that 60% of evicted households displaced from the gentrifying Downtown area end up relocating outside of Downtown and 25% relocate outside of the city limits.
Lee and Perkins (2022) find that relative to their origin neighborhoods, movers from gentrifying neighborhoods move to neighborhoods with lower poverty rates and higher median incomes. But relative to movers from nongentrifying neighborhoods, movers from gentrifying neighborhoods move to neighborhoods with higher poverty rates and lower incomes. In other words, Lee and Perkins find both an absolute improvement in neighborhood SES of gentrification movers and a relative decline in neighborhood SES of gentrification movers. Finally, in a national-level analysis, Brummet and Reed (2019) find that people who live in gentrifying neighborhoods and move live in lower poverty neighborhoods 10–14 years later.
The mixed results on residential mobility from gentrifying neighborhoods and destination quality make it difficult to summarize the relationship between the two definitively. Most likely, additional studies including this one will be necessary before we can confidently conclude if and how gentrification influences the types of destinations people move to. Our study does add to the literature by considering destinations along additional spatial dimensions including distance from origin neighborhood and central-city versus suburban destination.
Prior research has also not considered how housing assistance may dampen displacement pressures in gentrifying neighborhoods. Qualitative evidence suggests that residents in gentrifying neighborhoods often rely on housing subsidies but also document the tenuousness of these programs in these neighborhoods (Newman and Wyly 2006). Although housing assistance is often put forth as a remedy for the downsides associated with gentrification (Godsil 2013), few studies have examined the efficacy of such assistance directly. In their studies of gentrification and displacement in New York City, Freeman and Braconi (2004) do find that residents of rent-regulated units were less likely to move in the 1990s, while Dragan, Ellen, and Glied (2019) find that low-income residents in subsidized units were less likely to move from 2009 to 2015. However, the focus on New York City limits the applicability of their findings to other settings. We, therefore, control for the receipt of housing assistance in supplementary analysis for the years in which the data are available in the PSID.
The literature on residential mobility informs our analytical strategy. This body of work posits that households move when a discrepancy arises between their locational needs and their current residence (Clark and Ledwith 2006). Moving is an attempt to resolve that discrepancy. The life cycle is seen as the paramount progenitor of such discrepancies as individuals move through various life stages such as becoming an adult, getting married, having children, and need to move to meet new residential needs (Rossi 1980). Using this framework, we can view gentrification as a precipitating factor for mobility because it changes the neighborhood conditions, creating a discrepancy between the household's residential needs and the rapidly evolving reality of their changing neighborhood. Several scholars have noted that while perhaps appreciating some changes associated with gentrification, long-term residents often feel like they are being “pushed out” and no longer welcome in their neighborhood (Freeman 2006; Hyra 2017). Consequently, the type of neighborhood change associated with gentrification could serve as a trigger for residential mobility, which should be revealed in higher mobility rates in gentrifying compared with nongentrifying neighborhoods and constrained residential mobility, which should be revealed in worse destination outcomes for movers from gentrifying neighborhoods compared to those living in nongentrifying neighborhoods. In the next section, we describe in detail our analytical approach.
Analytic Strategy
In this study, we build on past research by using the PSID—a nationally representative longitudinal household survey—to assess how gentrification is associated with whether and where residents move across the United States from 2000 to 2017. Many of the existing studies on residential dynamics associated with gentrification has examined the period prior to or at the beginning of gentrification's increased pace and spread since the late 1990s, but only a handful of published studies to our knowledge rely on data that provide information on origins and destinations across the United States in the twenty-first century at relatively frequent time intervals. This study contributes to the existing body of research on the consequences of neighborhood change and stratification by analyzing where residents move and the role of housing assistance using a national dataset in the contemporary period of gentrification.
Our analysis proceeds in three steps. First, we compare residential mobility rates of residents by income quartile in gentrifying and nongentrifying neighborhoods, controlling for additional factors related to mobility. Second, we examine the reasons respondents provide for moving to discern if those in gentrifying neighborhoods are more likely to describe reasons associated with involuntary moves. Third, we consider the destinations of those who move, comparing movers from gentrifying and nongentrifying neighborhoods by income quartile while controlling for other factors that may relate to where one moves. As the term gentrification implies a formerly disadvantaged urban neighborhood that experiences a rise in social and economic status, we consider central-city neighborhoods with the potential to gentrify but do not experience gentrification as our counterfactual for the analysis.
We expect that rates of moving overall and involuntary moving may not be more elevated in gentrifying neighborhoods for lower-income residents, consistent with the body of quantitative research on this topic and partially explained by subsidized housing, but we expect that gentrification is associated with higher rates of outmigration to similar or more disadvantaged neighborhoods and more moves out of the central city compared to similar low-income movers from nongentrifying neighborhoods.
We also assess whether low-income households, who may be especially vulnerable to displacement, have higher rates of mobility and involuntary mobility relative to higher income households in gentrifying neighborhoods compared to nongentrifying neighborhoods. Similarly, we assess whether lower-income movers from gentrifying neighborhoods move to more disadvantaged neighborhoods compared to similar residents moving from nongentrifying neighborhoods.
Data and Methods
PSID Data
For this study, we utilize data from the restricted-use geocoded version of the PSID for 2001–2017. The PSID is a panel survey that has been following the same families since 1968, with more families added over time. After 1997, the PSID was administered only in odd numbered years. The survey follows families as they change, including the birth of children, marriages, deaths, and new family formations. While the survey originally started with approximately 5,000 families, it now encompasses over 9,000 families, a few hundred of which are immigrant families added in 1997, 1999, 2017, and 2019. Aside from basic demographic information, the PSID collects a plethora of data on income, education, family composition, and health. Two other features of the PSID make it especially well-suited for studying residential dynamics in the wake of gentrification. First, the geocoded version of the PSID allows researchers to identify census tracts in which the respondents reside. The PSID can thus be used to study the mobility behavior of respondents including those residing in gentrifying neighborhoods. Second, Newman, Holupka, and Harkness (2009) have constructed an assisted housing database (PSID-AHD) by matching addresses of all PSID respondents to the addresses of assisted housing units (AHD). This allows researchers to identify whether PSID respondents receive any type of federal or state housing assistance including public housing, housing vouchers, other HUD-funded housing assistance, and the low-income housing tax credit (LIHTC) for panels from 1968 to 2009. To date, researchers have neglected to consider how housing assistance may mitigate some of the impacts of gentrification for residential mobility.
We take advantage of the geocoded version of the PSID to link respondents to tract-level data on gentrification from the 2000 decennial United States Census and the 2013–2017 American Community Survey (ACS) 5-year estimates harmonized to 2010 boundaries using Brown University's Longitudinal Tract Data Base crosswalk file, which relies on population and areal weighting. For each panel year, we only consider respondents who are the heads of their household in that year and track their mobility patterns between that survey year and their prior panel year. For the analysis, we only include panel observations where the respondent's origin neighborhood is in a central-city tract, as identified by the United States Census Bureau in 2010. We assign each tract to a corresponding metropolitan area (MA), which we operationalize as the 2013 Census-defined metropolitan divisions and core-based statistical areas without metropolitan divisions. Because whether individuals are household heads or live in gentrifiable neighborhoods change across panels, we structure our data as pooled panels and account for repeated observations by the same household head by using clustered-robust standard errors. Our final analytic dataset contains 7,104 unique households among 25,030 household-year observations, after dropping 25 observations among those with valid origin and destination tract geocodes (0.1% of the pre-exclusion sample) with missing values for our analytical variables (e.g., income quartile, origin, or neighborhood characteristics), and spans 598 origin and destination MAs. As we have restricted the sample, it is no longer representative of the entire population of the United States. The survey weights are designed to inflate the sample to be representative of the population, therefore we present unweighted results as our sample is only applicable to the subset of the population meeting the criteria described above.
Dependent Variables
We draw on the question from the PSID survey that asks respondents if they have moved since the time of the last survey (2 years ago). Respondents who respond affirmatively are classified as movers. If respondents say they move, they are asked a follow-up question about why they move, and the PSID provides a list of ten possible response options. We classify the reason for moving as an involuntary move if they pick any of the following options: They want to consume less space, want to pay less rent, or move in response to outside events (eviction, health reasons, divorce, joining the armed services, or other involuntary reasons). This is an admittedly imperfect measure of displacement. However, to the extent that these other involuntary reasons for moving, such as service in the armed forces, do not differ systematically between gentrifying and nongentrifying neighborhoods, this measure should be able to pick up any surfeit in displacement due to gentrification to the extent that such a surfeit exists.
We use the geocoded information from the PSID to identify the census tract of the destinations of movers from gentrifiable neighborhoods. We characterize movers’ destinations in four ways: (1) median household income; (2) poverty rate; (3) logged distance (miles) from origin census tract (based on centroids); and (4) central city versus suburb. To measure origin and destination neighborhood median household income and poverty, for the 2001–2009 panels, we linearly interpolate these variables using the 2000 Census and the 2008–2012 5-Year ACS (representing 2010), which has a larger sample size compared to earlier ACS years (Reardon et al. 2019). For the 2011, 2013, 2015, and 2017 PSID panels, we use the 2009–2013, 2011–2015, 2013–2017, and 2015–2019 5-Year ACSs, respectively. All data are harmonized to 2010 Census boundaries. Dollar amounts are adjusted for inflation to 2019 values. For the destination outcomes, we subset our sample to movers. This sample contains 5,308 unique households among 10,053 household-years. For models examining move distances, we only consider movers who stay within the same MA (4,426 households among 7,960 household-years) since we are assessing if residents in gentrifying neighborhoods are being pushed further from their neighborhoods than others. Because movers can move within the same census tract and thus have a move distance of zero, we add one to the move distance variable prior to the log-transformation.
Gentrification Measures
In our analysis, we focus on the neighborhood context, specifically whether the neighborhood is undergoing gentrification. Nongentrifying neighborhoods serve as our counterfactual. Census tracts are harmonized to 2010 Census boundaries. We use 2000 Census and 2013–2017 ACS data to determine if tracts are gentrifying over the period from 2000 to 2013–2017 (hereafter, 2017) for our analysis. Tracts with less than 100 people or 50 housing units at the beginning or end of the period were dropped.
Following our definition of gentrification—the reinvestment, renewal, and in-migration of middle and upper-class residents into low-income, central-city neighborhoods, we conduct our analysis using two different measures, described below. We use Freeman's (2005) measure (hereafter, FM) and Hwang's (2020) measure (hereafter, HW).
Based on our definition, gentrifiable neighborhoods are low-income, central-city neighborhoods. Thus, both measures require that the census tract is in the central city of a metropolitan area. The FM measure requires tracts to have median household incomes below the metropolitan area median household income and a share of housing built within the last 20 years to be below the metropolitan area median share in the baseline year, which is 2000 in our analysis. The HW measure only requires tracts to have median household incomes below the central-city median household income.
To be considered gentrifying the FM measure requires gentrifiable tracts to meet two criteria: (1) Exhibit change in the share of college-educated residents greater than the median change in the share of college-educated residents in a metropolitan area and (2) experience any increase in the real median housing value. The HW measure considers gentrifying tracts to (1) exhibit either a change in the share of college-educated residents or percent change in the median household income greater than the median change among central-city tracts with increases in these two indicators, respectively and (2) exhibit either a percent change in median home value or percent change in median gross rent greater than the median change among central-city tracts with increases in these two indicators, respectively. Tracts that are missing data for both the share of college-educated residents and median household income, or data for both the median home value and median rent, either at the beginning or the end of the period, are dropped from analysis.
Overall, the main differences between the two measures are the relative comparison groups: While the FM measure compares tracts’ changes to the overall metropolitan area, the HW measure compares tracts’ changes occurring in the central city and only among tracts with increases in the various indicators. The FM measure also includes criteria signaling a lack of previous investment—low levels of prior new construction—for neighborhoods to be gentrifiable. Further, the HW measure also considers changes in incomes and rents, in addition to college-educated residents and home values, which offers more flexibility to the criteria. Lastly, the FM measure does not require substantial increases in housing prices—it just requires any increase in real dollars. Nonetheless, both measures agree that both characteristics of the residents (e.g., college-educated) and characteristics of the housing market (e.g., home values) are important criteria.
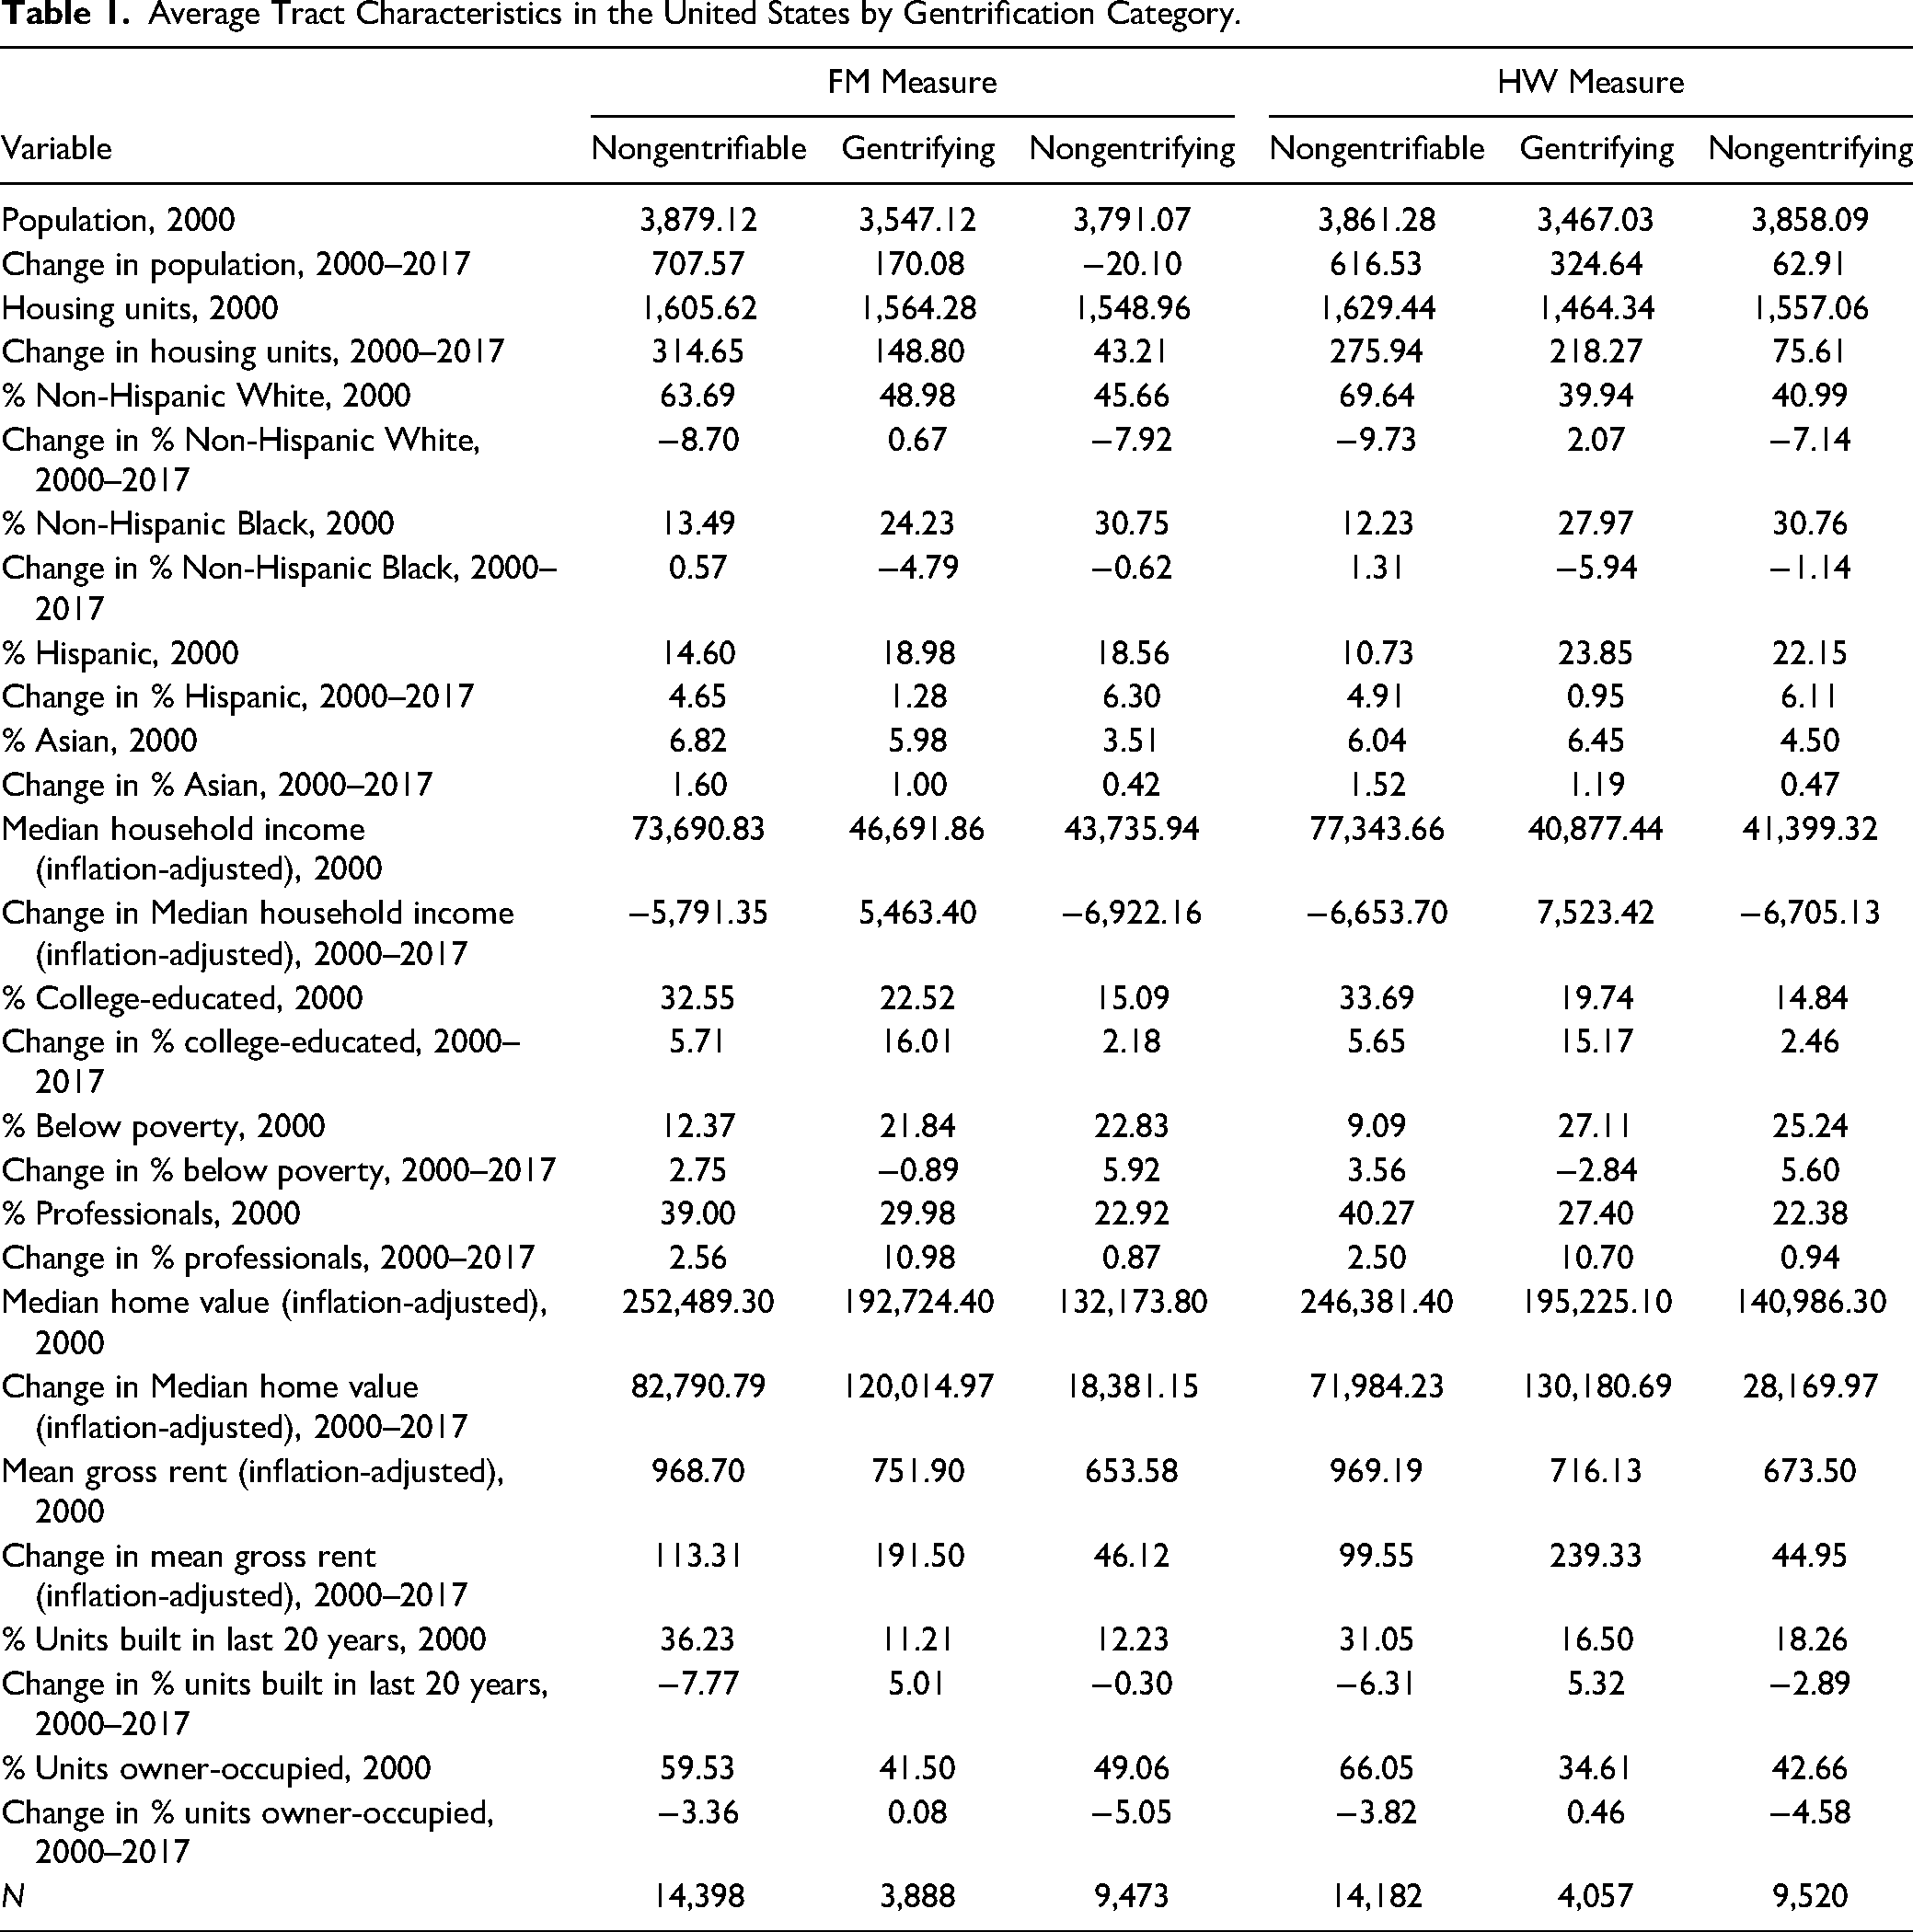
Table 1 provides descriptive statistics of all central-city census tracts in 2000 and their changes from 2000 to 2017, separated into three categories for each measure: (1) Gentrifiable in 2000 but not gentrifying in 2000–2017; (2) gentrifiable in 2000 and gentrifying in 2000–2017; and (3) not gentrifiable central-city tracts in 2000. According to both measures, slightly less than 50% of central-city tracts are gentrifiable, and about 29% of gentrifiable tracts are gentrifying during the period. For both the FM and HW measures, in 2000, both gentrifying and nongentrifying tracts had greater average shares of Black and Hispanic people, lower levels of SES, lower home prices, and low homeownership rates compared to nongentrifiable tracts. Compared to nongentrifying tracts, gentrifying tracts had higher shares of White people, college-educated residents, and professionals and lower shares of Black people in 2000 for the FM measure, but these gaps are smaller for the HW measure. On average, tracts categorized as gentrifying by the FM measure have higher shares of White and socioeconomically advantaged residents, but lower housing prices and new buildings compared to gentrifying tracts by the HW measure in 2000. This suggests that the tracts categorized as gentrifying by the FM measure are more socioeconomically advantaged at baseline than gentrifying tracts based on the HW measure. Nonetheless, gentrifying tracts experienced substantial changes in expected directions for both measures compared to nongentrifying tracts. By 2017, gentrifying tracts had much greater shares of White residents, college-educated residents, professionals, and new buildings; higher incomes, home values, and rents; lower shares of Black and Hispanic residents; and lower poverty rates.
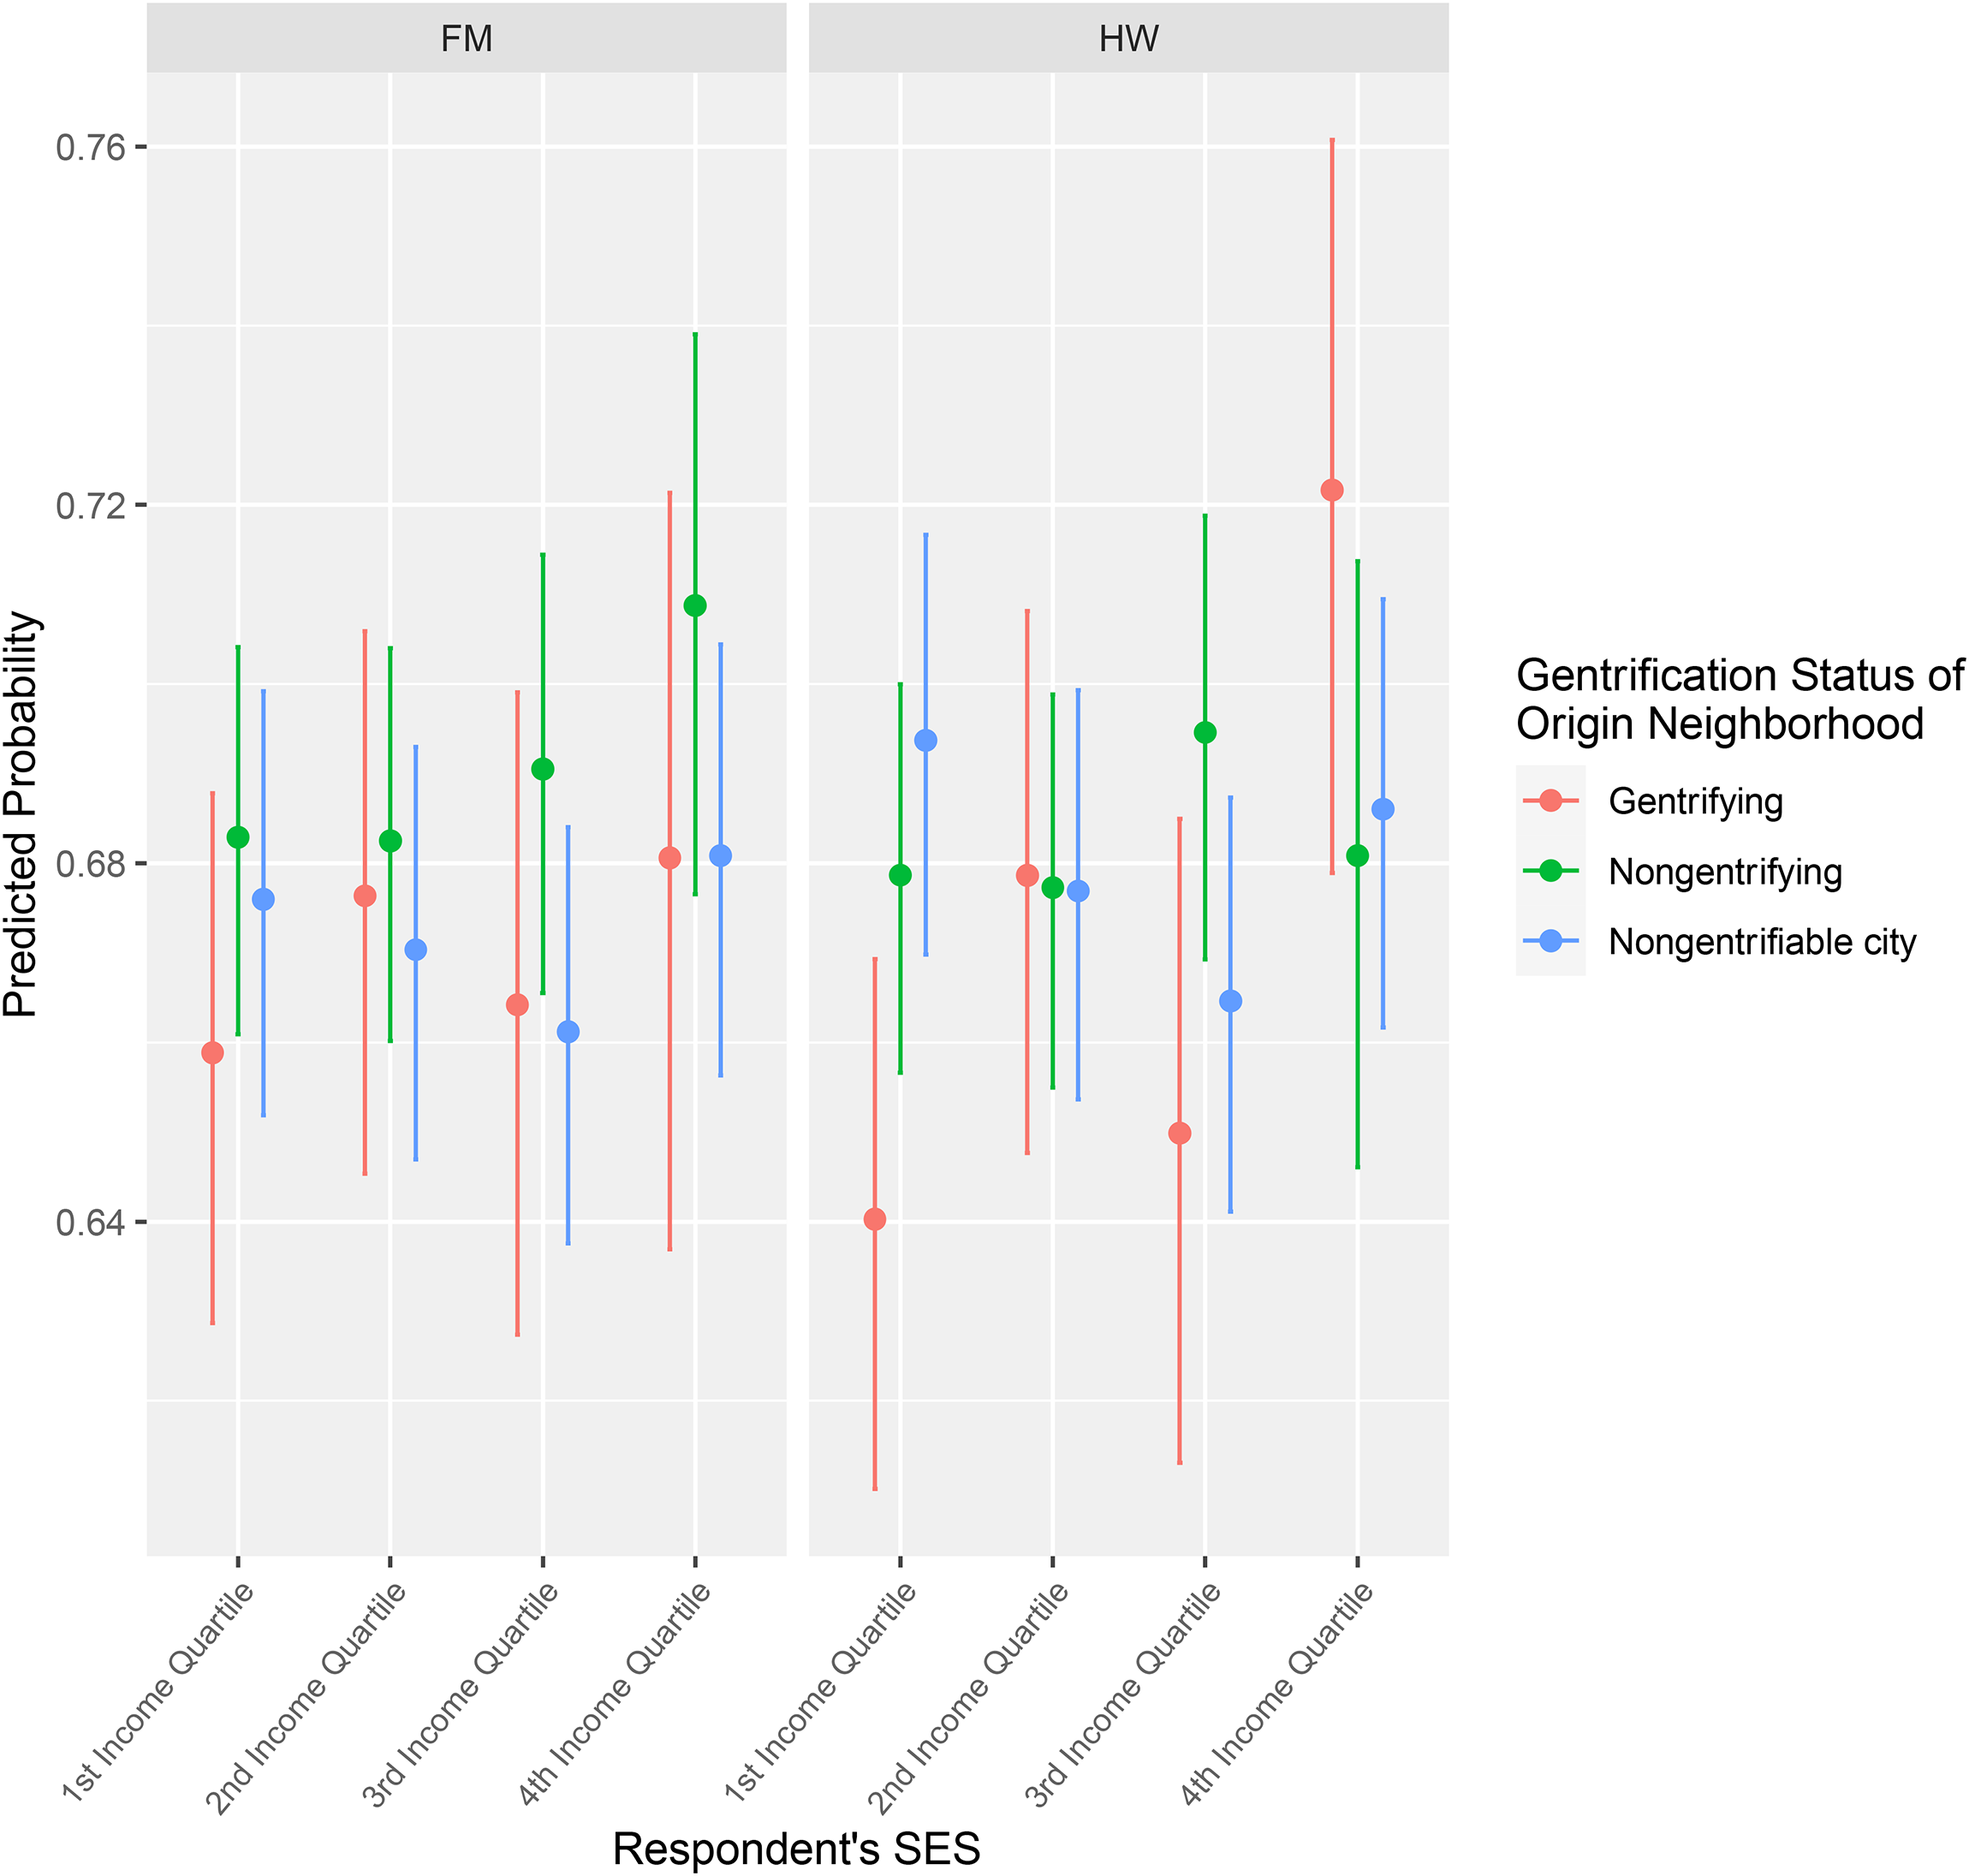
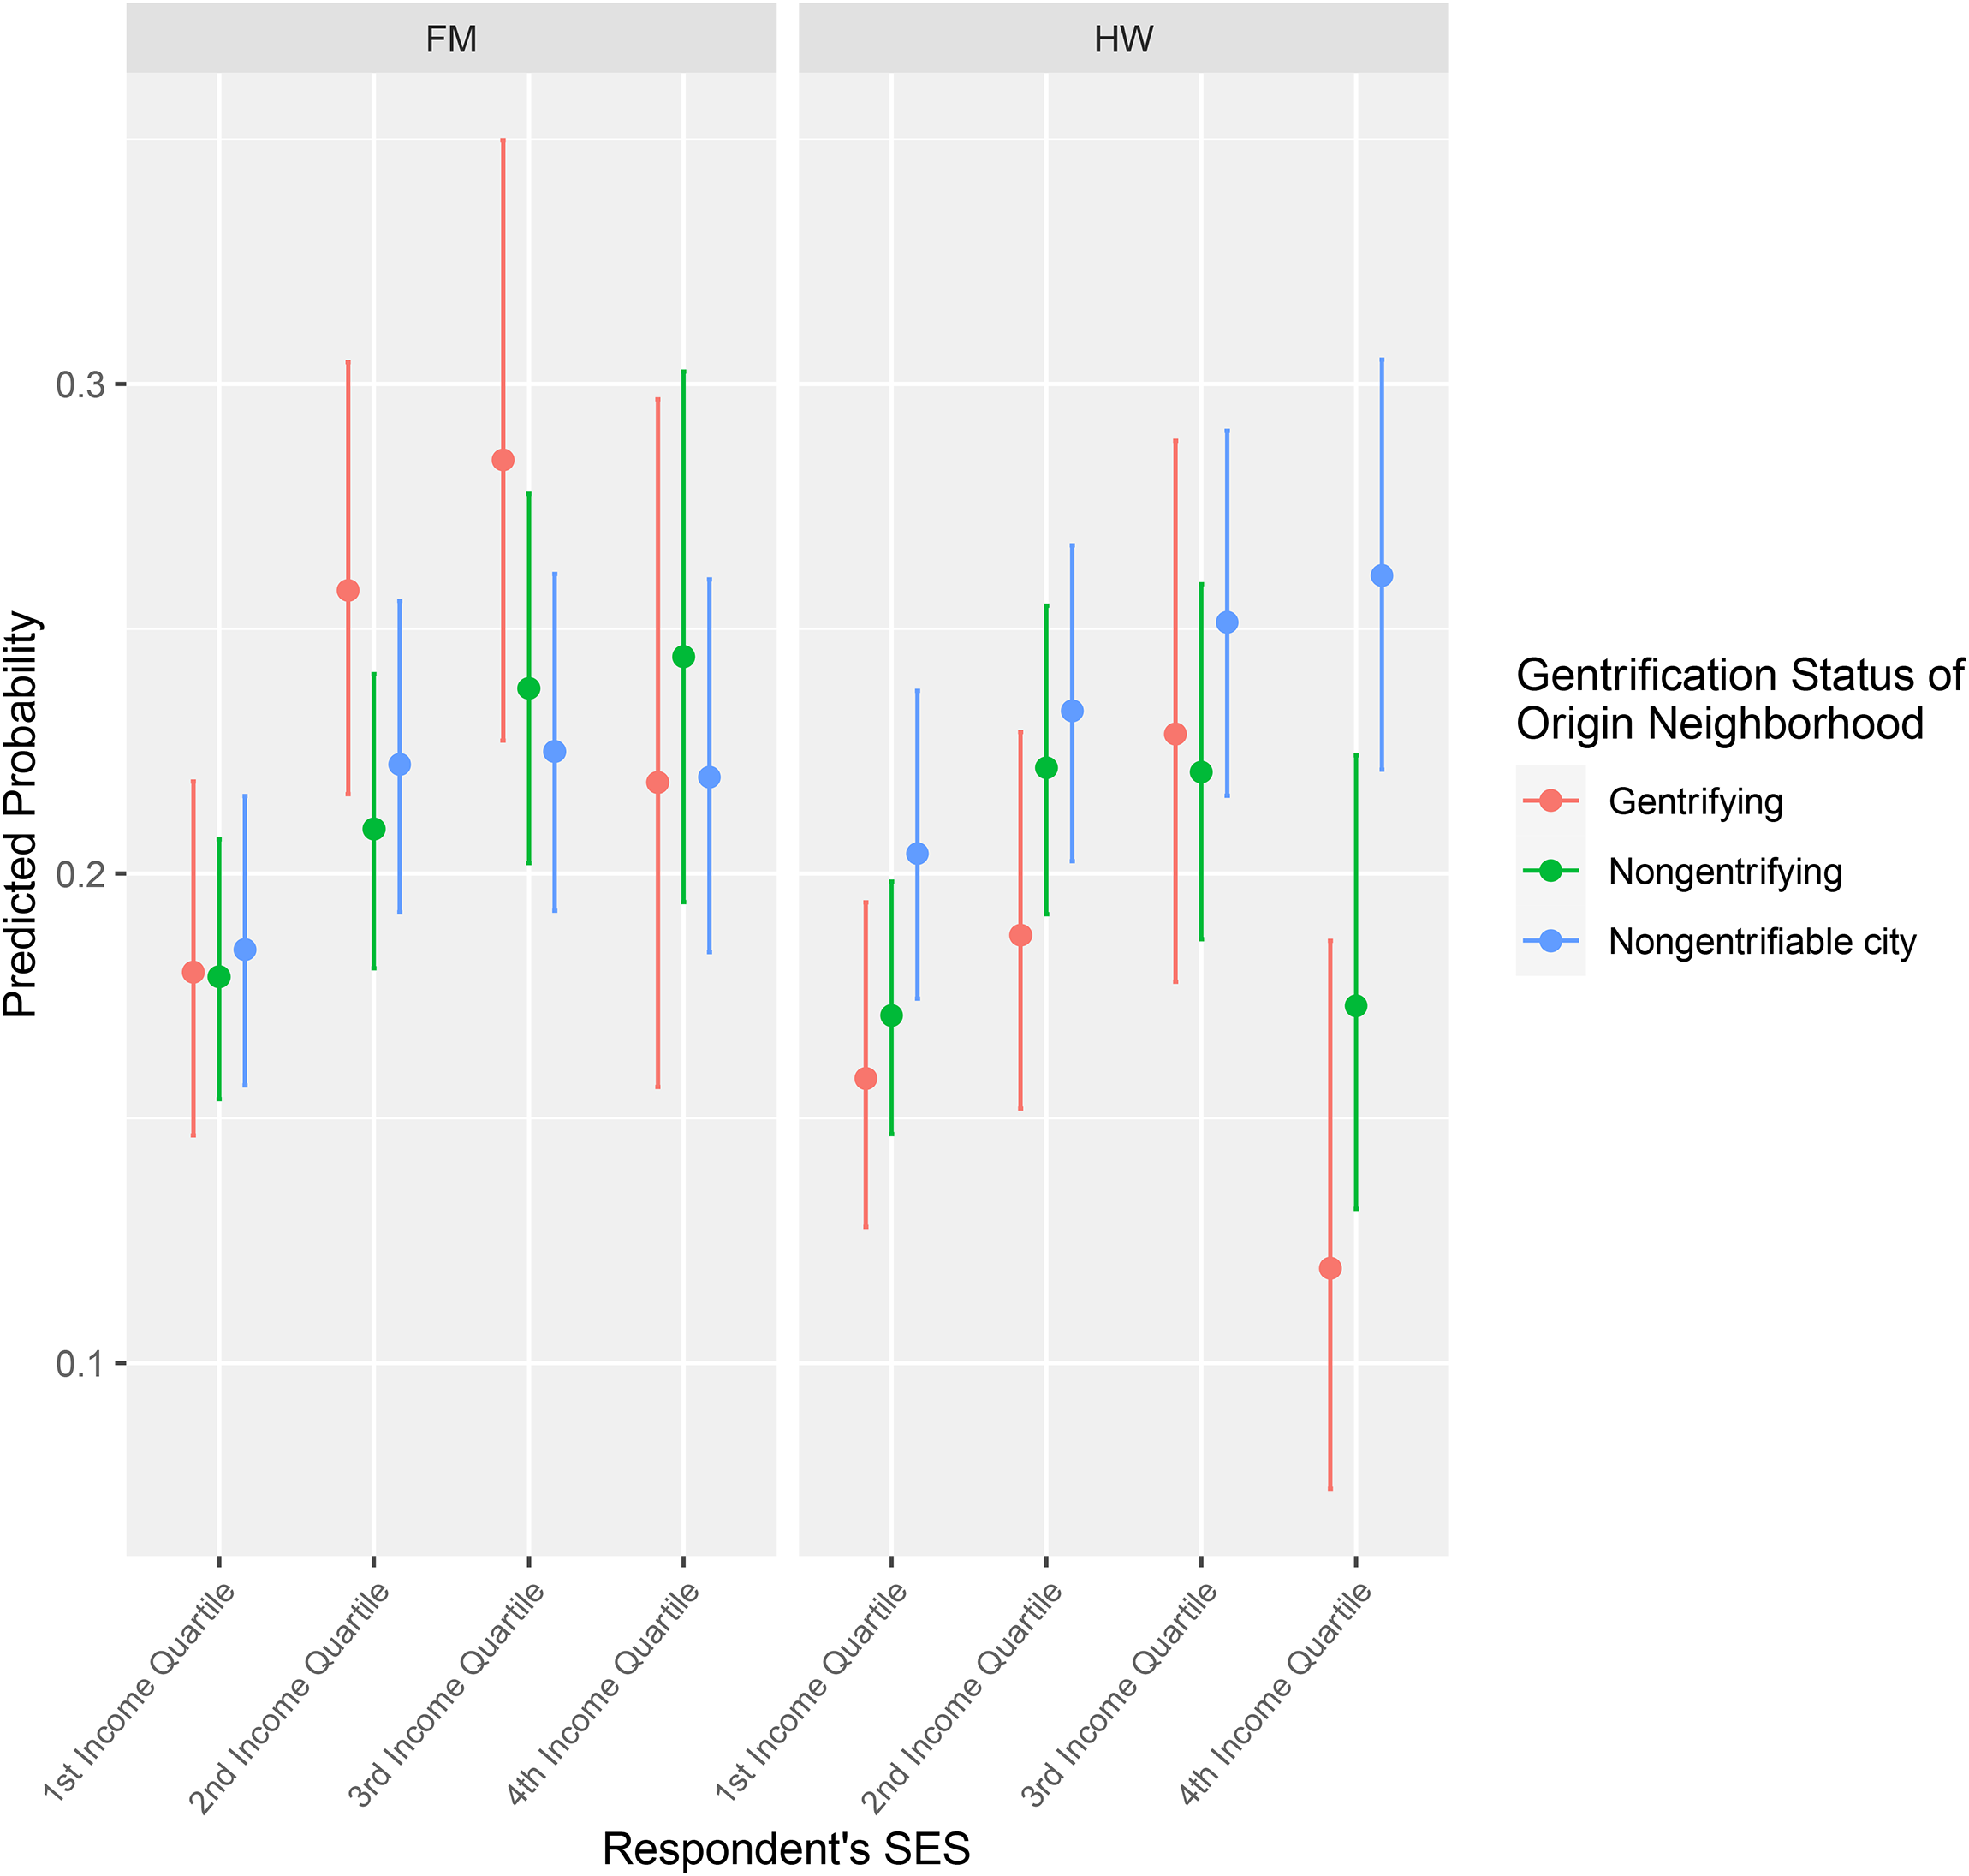
Predicted probability of moving by SES * gentrification.
Average Tract Characteristics in the United States by Gentrification Category.
Household Income
To test whether low-income households are especially susceptible to displacement pressures, we examine respondents stratified by income quartile and compare their mobility patterns depending on whether they reside in a gentrifying neighborhood or not. We refer to households in the lower two quartiles as low-income. To adjust for income differences across MAs, for each panel year, we assign an income quartile to each respondent by comparing their reported family income (all sources of income for all members of the household) against the household income distribution in that panel year in their MA using Census and ACS data, which defines household income in the same way as the PSID. For the 2001–2009 panels, we linearly interpolate the household income distribution using the 2000 Census and the 2008–2012 5-Year ACS (representing 2010). For the 2011, 2013, 2015, and 2017 PSID panels, we use the 2009–2013, 2011–2015, 2013–2017, and 2015–2019 5-Year ACSs, respectively. Dollar amounts are adjusted for inflation to 2019 values.
Control Variables
In our analysis, we control for other factors known to influence residential mobility, measured at the respondent's last panel year observation, for example, prior to a move. The literature on residential mobility suggests mobility is triggered by a discrepancy between current housing needs and the current housing unit occupied that shifts as people move through the life cycle (Rossi 1980; Speare 1974). We include the respondent's age, gender, marital status, and number of children as indicators of the stage in the life cycle.
We include a control for housing tenure since renters tend to move more frequently than owners (Rohe and Stewart 1996; Martin and Beck 2018). Housing conditions have also been shown to influence mobility decisions. We include a measure of crowding, defined as the housing unit having more than one person per room, excluding bathrooms, which we generate using the number of people in the household divided by the number of rooms in the housing unit. 3
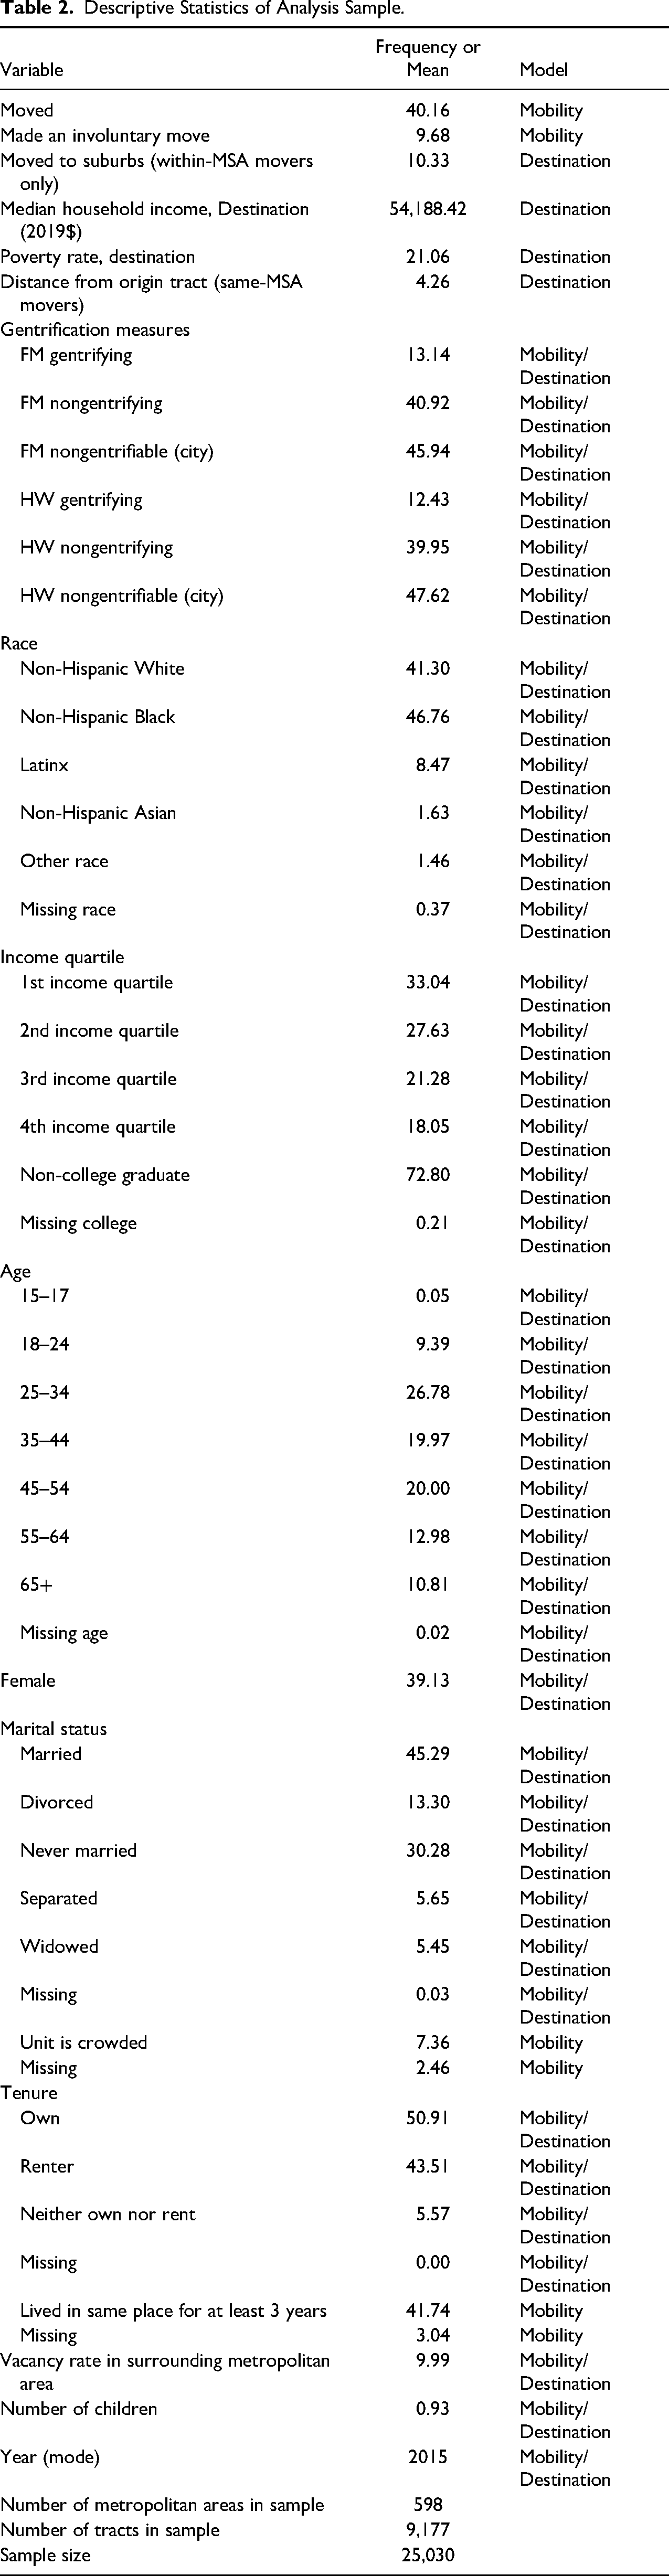
The longer one lives somewhere, the stronger that person's ties are likely to be to the surrounding area and the less likely he or she is to move. Thus, we also include a dummy variable for whether the respondent has lived in their current residence for at least three years, assigned 1 if they report not moving in the previous two consecutive panels, 0 otherwise, and missing if we do not have two consecutive panel years of residential history (Pais, South, and Crowder 2009). We also include additional demographic characteristics, including race/ethnicity, and year of the move as controls. 4 Finally, we control for metropolitan area vacancy rate to account for the impact of housing supply constraints on mobility and destination outcomes. We also separately include the share of central-city tracts identified as gentrifying for each measure as a control variable in additional supplementary models, which does not change our results. Table 2 provides the descriptive statistics for our sample and indicators of whether the variable is included as a control for the model (e.g., mobility, destination).
Descriptive Statistics of Analysis Sample.
Methods
We first estimate whether a resident moves from their neighborhood since the last survey using a logistic regression model, and we include an interaction term in the model between respondents’ income quartile and whether the respondent was living in a gentrifying neighborhood in the model. We present predicted probabilities to interpret interaction terms. For involuntary moves, we use a similar logistic regression model predicting the likelihood of a household moving involuntarily. We also run an alternative model with a three-way interaction term between origin neighborhood gentrification status, the respondent's income quartile, and the respondent's tenure status. 5 All other control variables described above are included in these models.
Regression equations for the mobility models, and models testing whether respondents make a suburban move (moves out of the central city within the same MA), which use logistic regression are as follows:

Regression equations for these destination models, which use linear regression, are as follows:
Housing assistance such as a voucher or residence in project-based housing assistance should remove one of the triggers for moving, not being able to afford the rent (Gold 2018). For the PSID panel years in 2001–2009, the PSID-AHD allows us to identify whether households have any form of subsidized housing. In supplementary analyses based on data from these years, we subset the data to only residents in the lowest-income quartile, since they form the bulk of those receiving housing subsidies. Using this sub-sample, we assess whether the relationship between gentrification and mobility/displacement may be moderated by whether someone is an owner, subsidized renter, nonsubsidized renter, or neither, a residual category in the PSID. This model, which includes the respondent's tenure status is also included as a third interaction term, can be formalized as follows:
Results
Moving
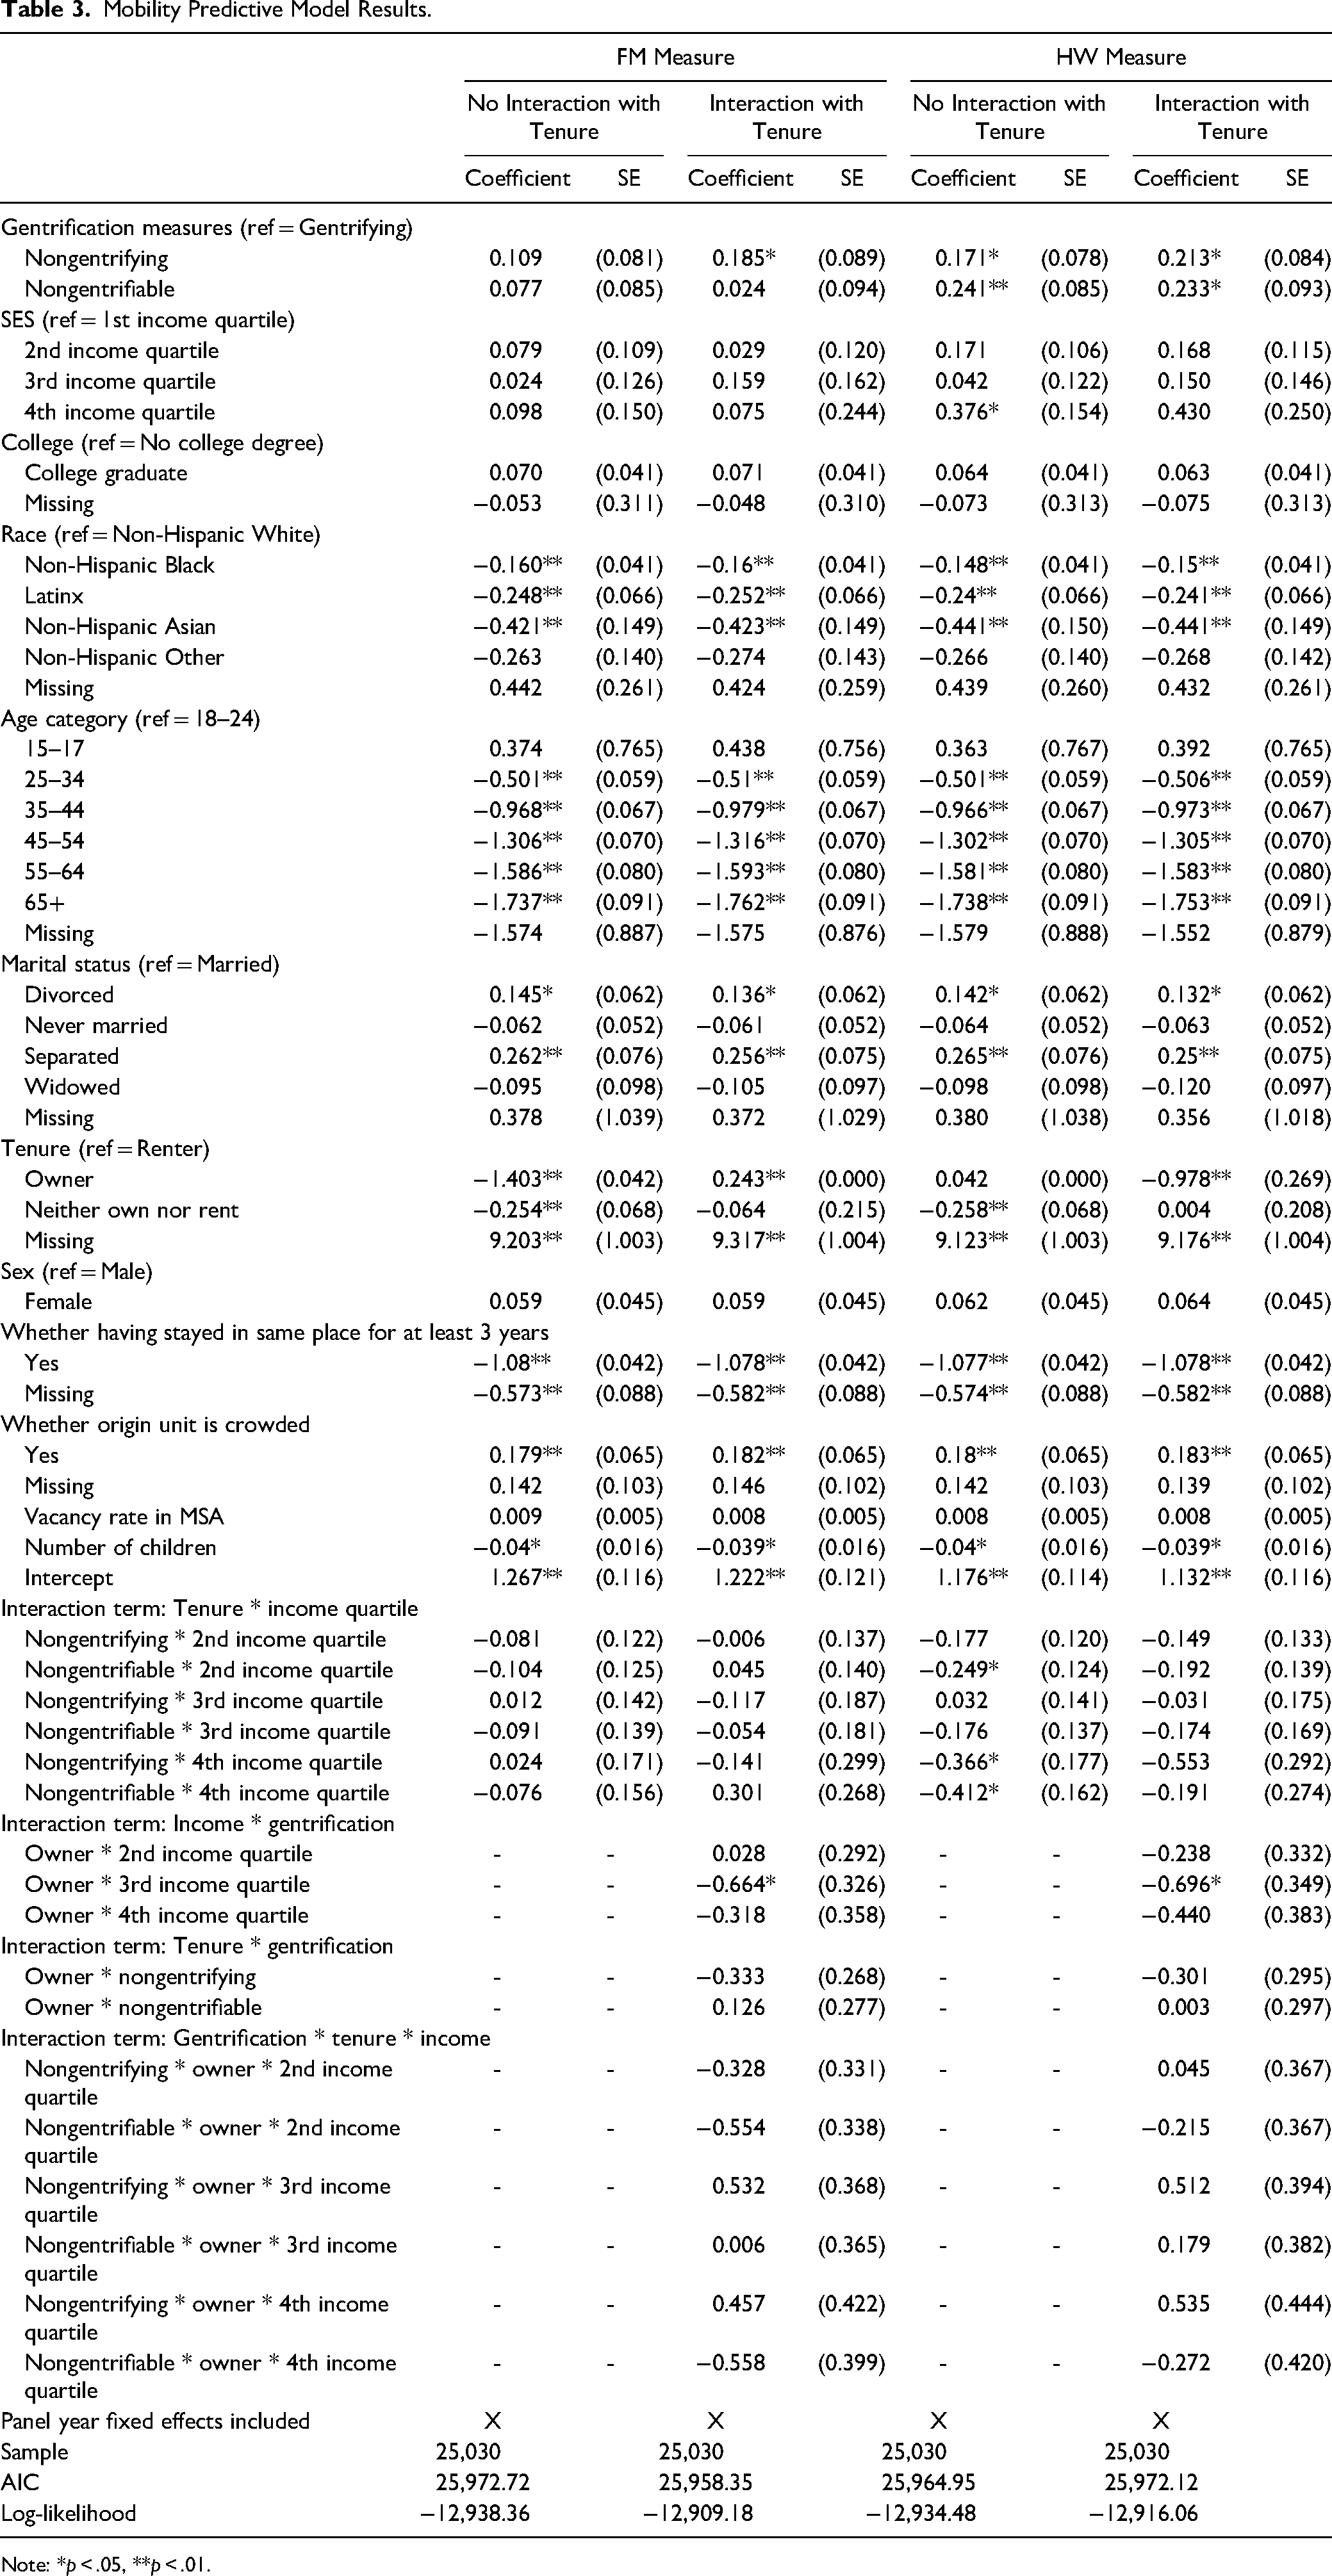
The results of our models predicting if someone moves are presented in Table 3. Overall, we do not find evidence of higher mobility rates among those living in gentrifying neighborhoods relative to those in nongentrifying neighborhoods for both measures. Because the value of the interaction term can vary depending on the value of the variables in the term, we present the predicted probabilities for the interaction terms to facilitate interpretation with covariates held at their mean values for continuous variables and model values for categorical ones. 7
Mobility Predictive Model Results.
Note: *p
Figure 1 presents predicted probabilities of moving for individuals by income quartile based on the type of neighborhood they resided in before moving, in models without a three-way interaction for housing tenure. We present estimates with 83% confidence intervals to test whether differences in predicted probabilities are statistically significant, whereas conventional 95% confidence intervals could mask statistically significant differences (Bolsen and Thornton 2014; Goldstein and Healy 1995; Knol, Pestman, and Grobbee 2011). The predicted outcomes represent what we will observe if everyone resides in the respective neighborhood type (e.g., gentrifying). There is no evidence to support the hypothesis that gentrification is associated with elevated rates of mobility for low-income residents. The predicted probability of moving is similar whether gentrification is measured using the FM or HW metrics. The predicted probabilities of moving from gentrifying neighborhoods are generally lower than from nongentrifying neighborhoods, but the differences are not statistically significant. The width of the 83% confidence intervals does not allow us to infer that these estimates are different from those living in nongentrifying neighborhoods. In the HW measure only, residents in the first income quartile in nongentrifiable, central-city neighborhoods are more likely to move than similar residents in gentrifying ones.
The results for control variables are consistent with the life cycle perspective. Older individuals who own their homes are less likely to move. Consistent with prior research, the longer someone has been at a place, the less likely they are to move. White people are more likely to move than other racial groups, and renters are more likely to move than owners. The results in Table 3 also show that tenure is an important predictor of mobility in models without a three-way interaction term. Homeowners are the least likely to move, and this pattern is consistent across models with both measures. We do not focus on those who are neither renters nor owners as they represent a residual category. In models with a three-way interaction term between origin neighborhood gentrification status, SES, and housing tenure, we find that while being a homeowner is associated with significantly lower probabilities of moving than being a renter across all income quartiles, renters in gentrifying neighborhoods are not significantly more likely to move than similar renters in nongentrifying ones. 8
Involuntary Mobility
We turn now to considering whether gentrification is associated with higher levels of involuntary moving. Recall that we classify involuntary moves as those who select any one of the following options in the PSID question about reason for moving: they want to consume less space, want to pay less rent, or move in response to outside events including eviction, health reasons, divorce, joining the armed services, or other involuntary reasons. Table 4 presents the results from these models predicting involuntary mobility using the FM and HW measures, respectively. Again, we do not find evidence of higher involuntary mobility rates among those living in gentrifying neighborhoods relative to those in nongentrifying neighborhoods. We use the predicted probabilities to facilitate the interpretation, and these results are presented in Figure 2.
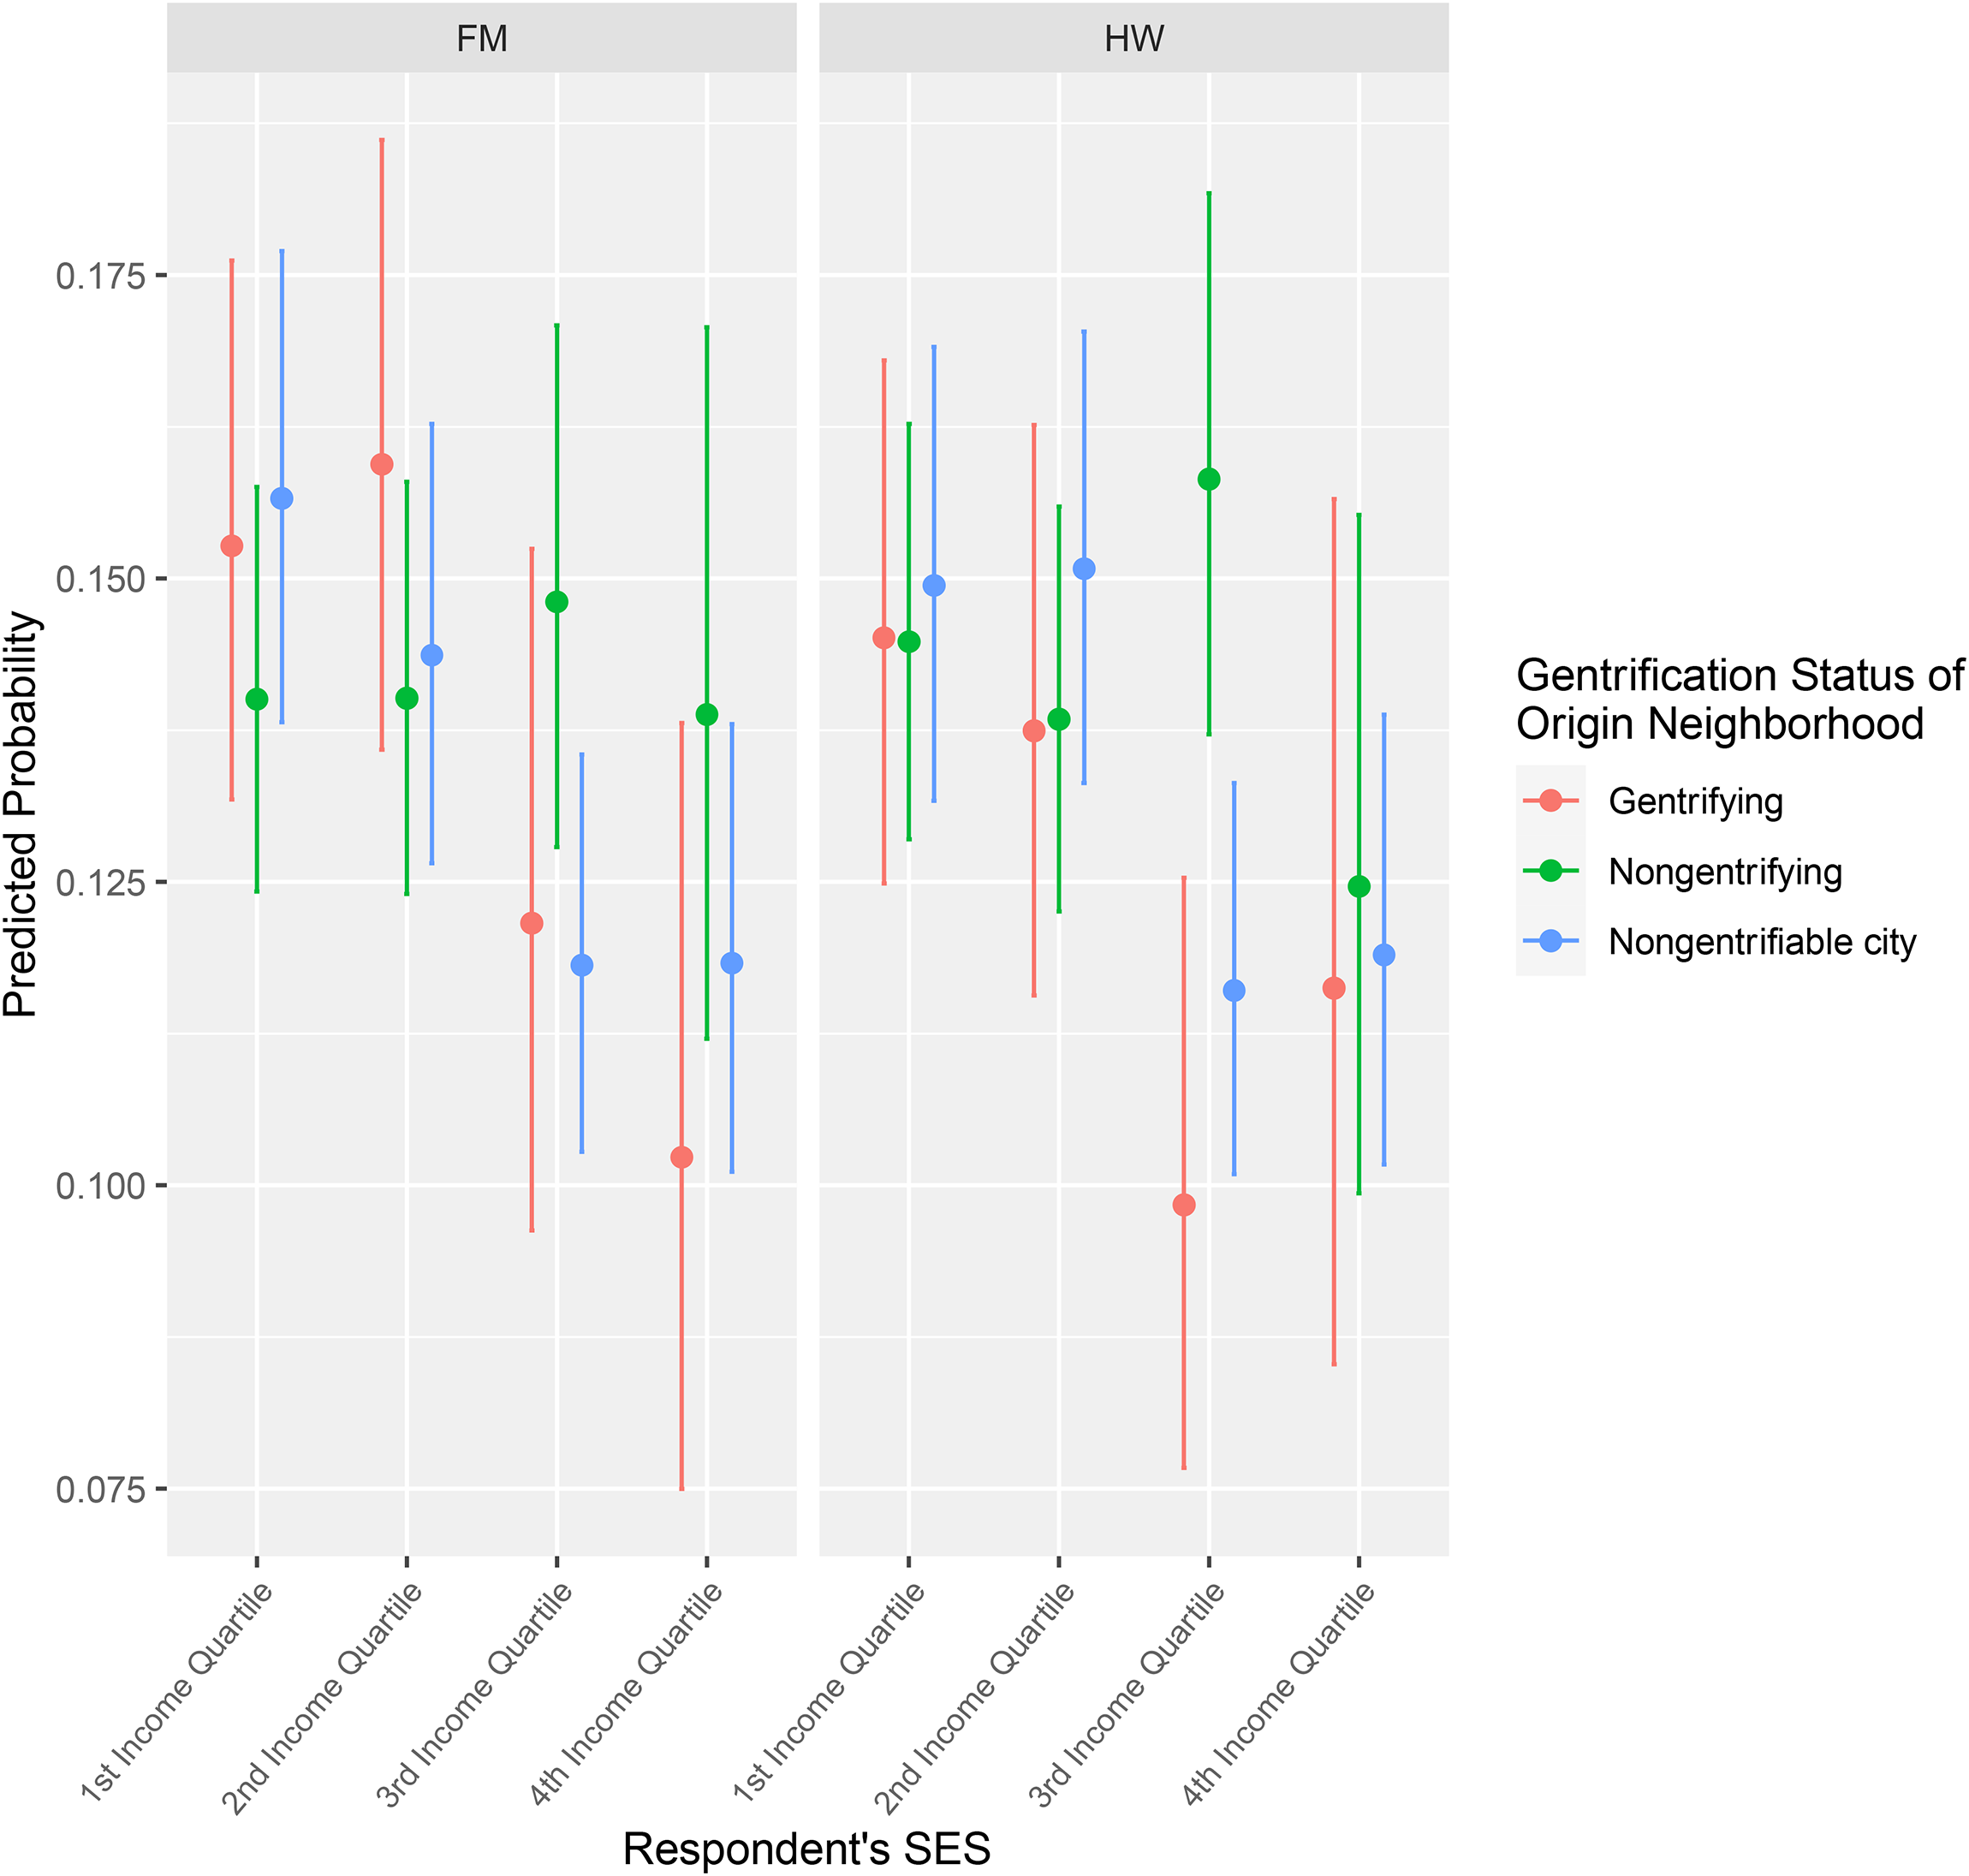
Predicted probability of involuntary moving by SES * gentrification.
Displacement Predictive Model Results.
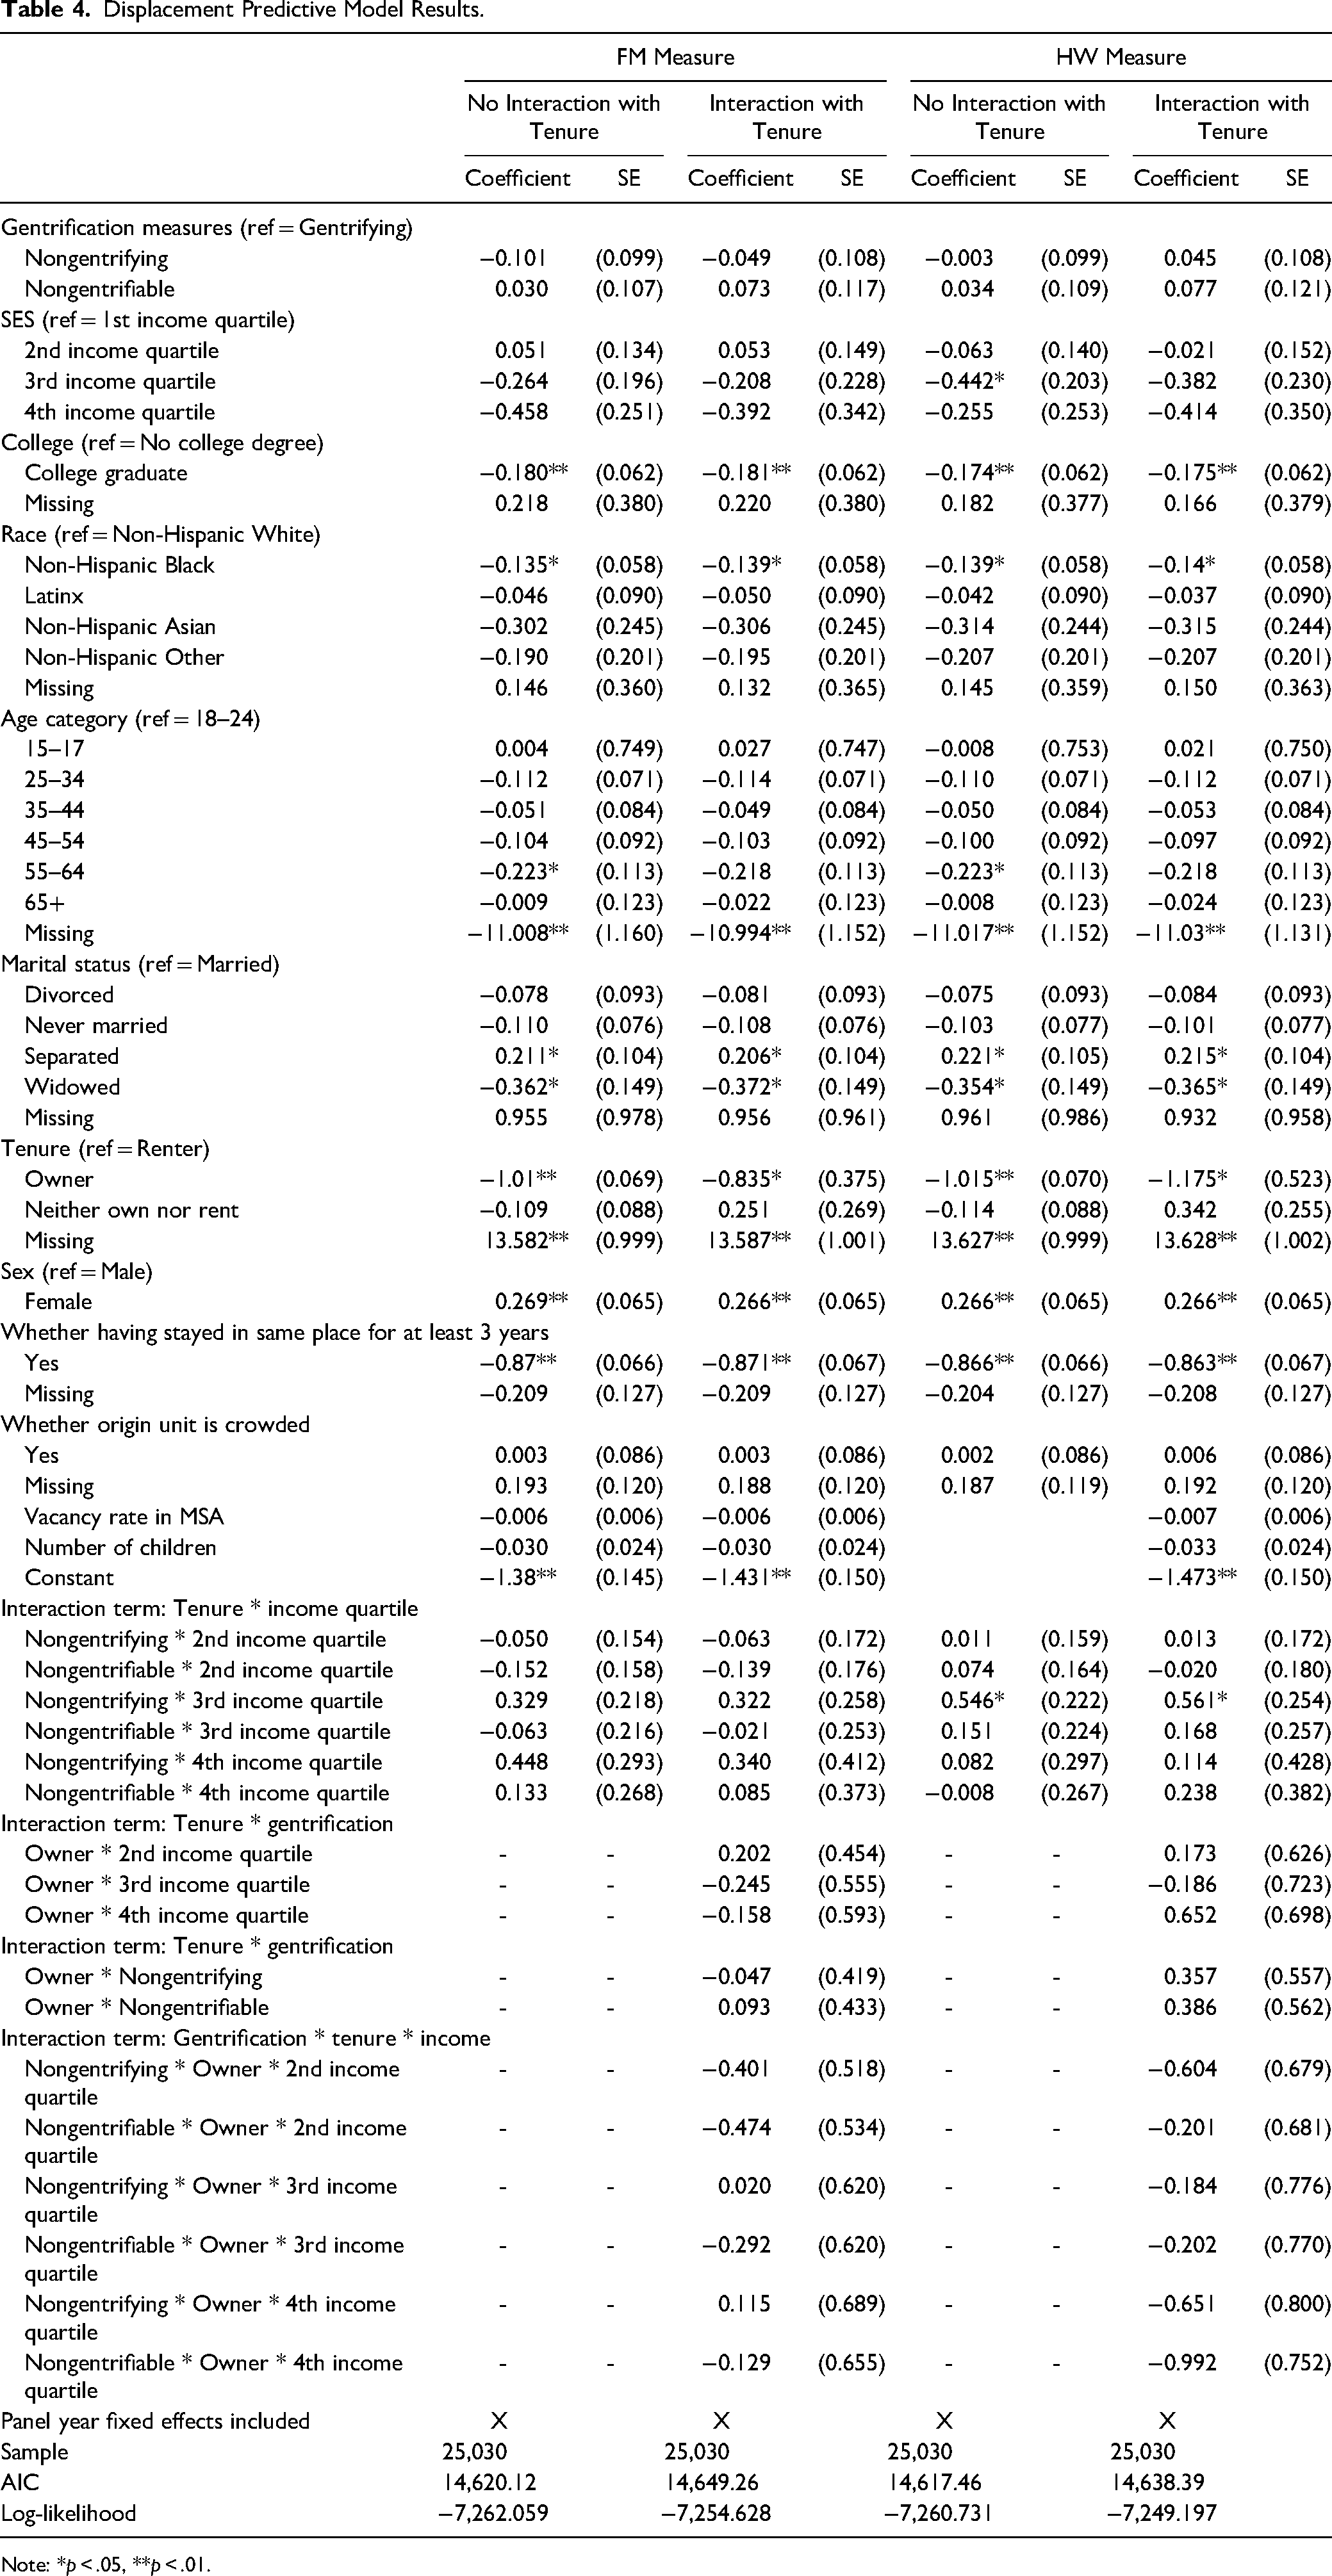
Note: *p
The results presented in Figure 2 provide little evidence to suggest that low-income residents living in gentrifying neighborhoods are more likely to move involuntarily than similar residents living in nongentrifying ones, as the 83% confidence intervals illustrate that the probability is not statistically significantly higher for those living in gentrifying neighborhoods. Similar to the mobility models, in models with three-way interaction terms, we do not see statistically significant differences in the probability of making an involuntary move among low-income renters in gentrifying versus nongentrifying neighborhoods. There is also no significant difference for similar residents in nongentrifiable neighborhoods.
The evidence presented thus far does not show strong evidence of involuntary mobility associated with gentrification. Whether displacement is inferred using elevated rates of mobility or measured directly by asking respondents whether they moved involuntarily, we see little difference between those living in gentrifying neighborhoods compared to those living in nongentrifying neighborhoods.
Destinations
The final question is whether the destinations of neighborhoods of those originating in gentrifying neighborhoods differ from those moving from nongentrifying neighborhoods. An important finding of the Ding, Hwang, and Divringi (2016) study is that low-income individuals originating in gentrifying neighborhoods are more likely to wind up in lower-income neighborhoods than where they started compared to those originating in nongentrifying neighborhoods in Philadelphia. We test if there are similar patterns across the United States. Overall, we find that destination outcomes are not worse (e.g., lower median household income, higher poverty, longer move distance, pushed out of the central city) for low-income movers moving from gentrifying neighborhoods versus similar movers moving from nongentrifying neighborhoods. Destination neighborhood income and poverty outcomes appear to be structured by income (e.g., fourth-income quartile residents end up in higher-income and less poor neighborhoods than do first-income quartile residents).
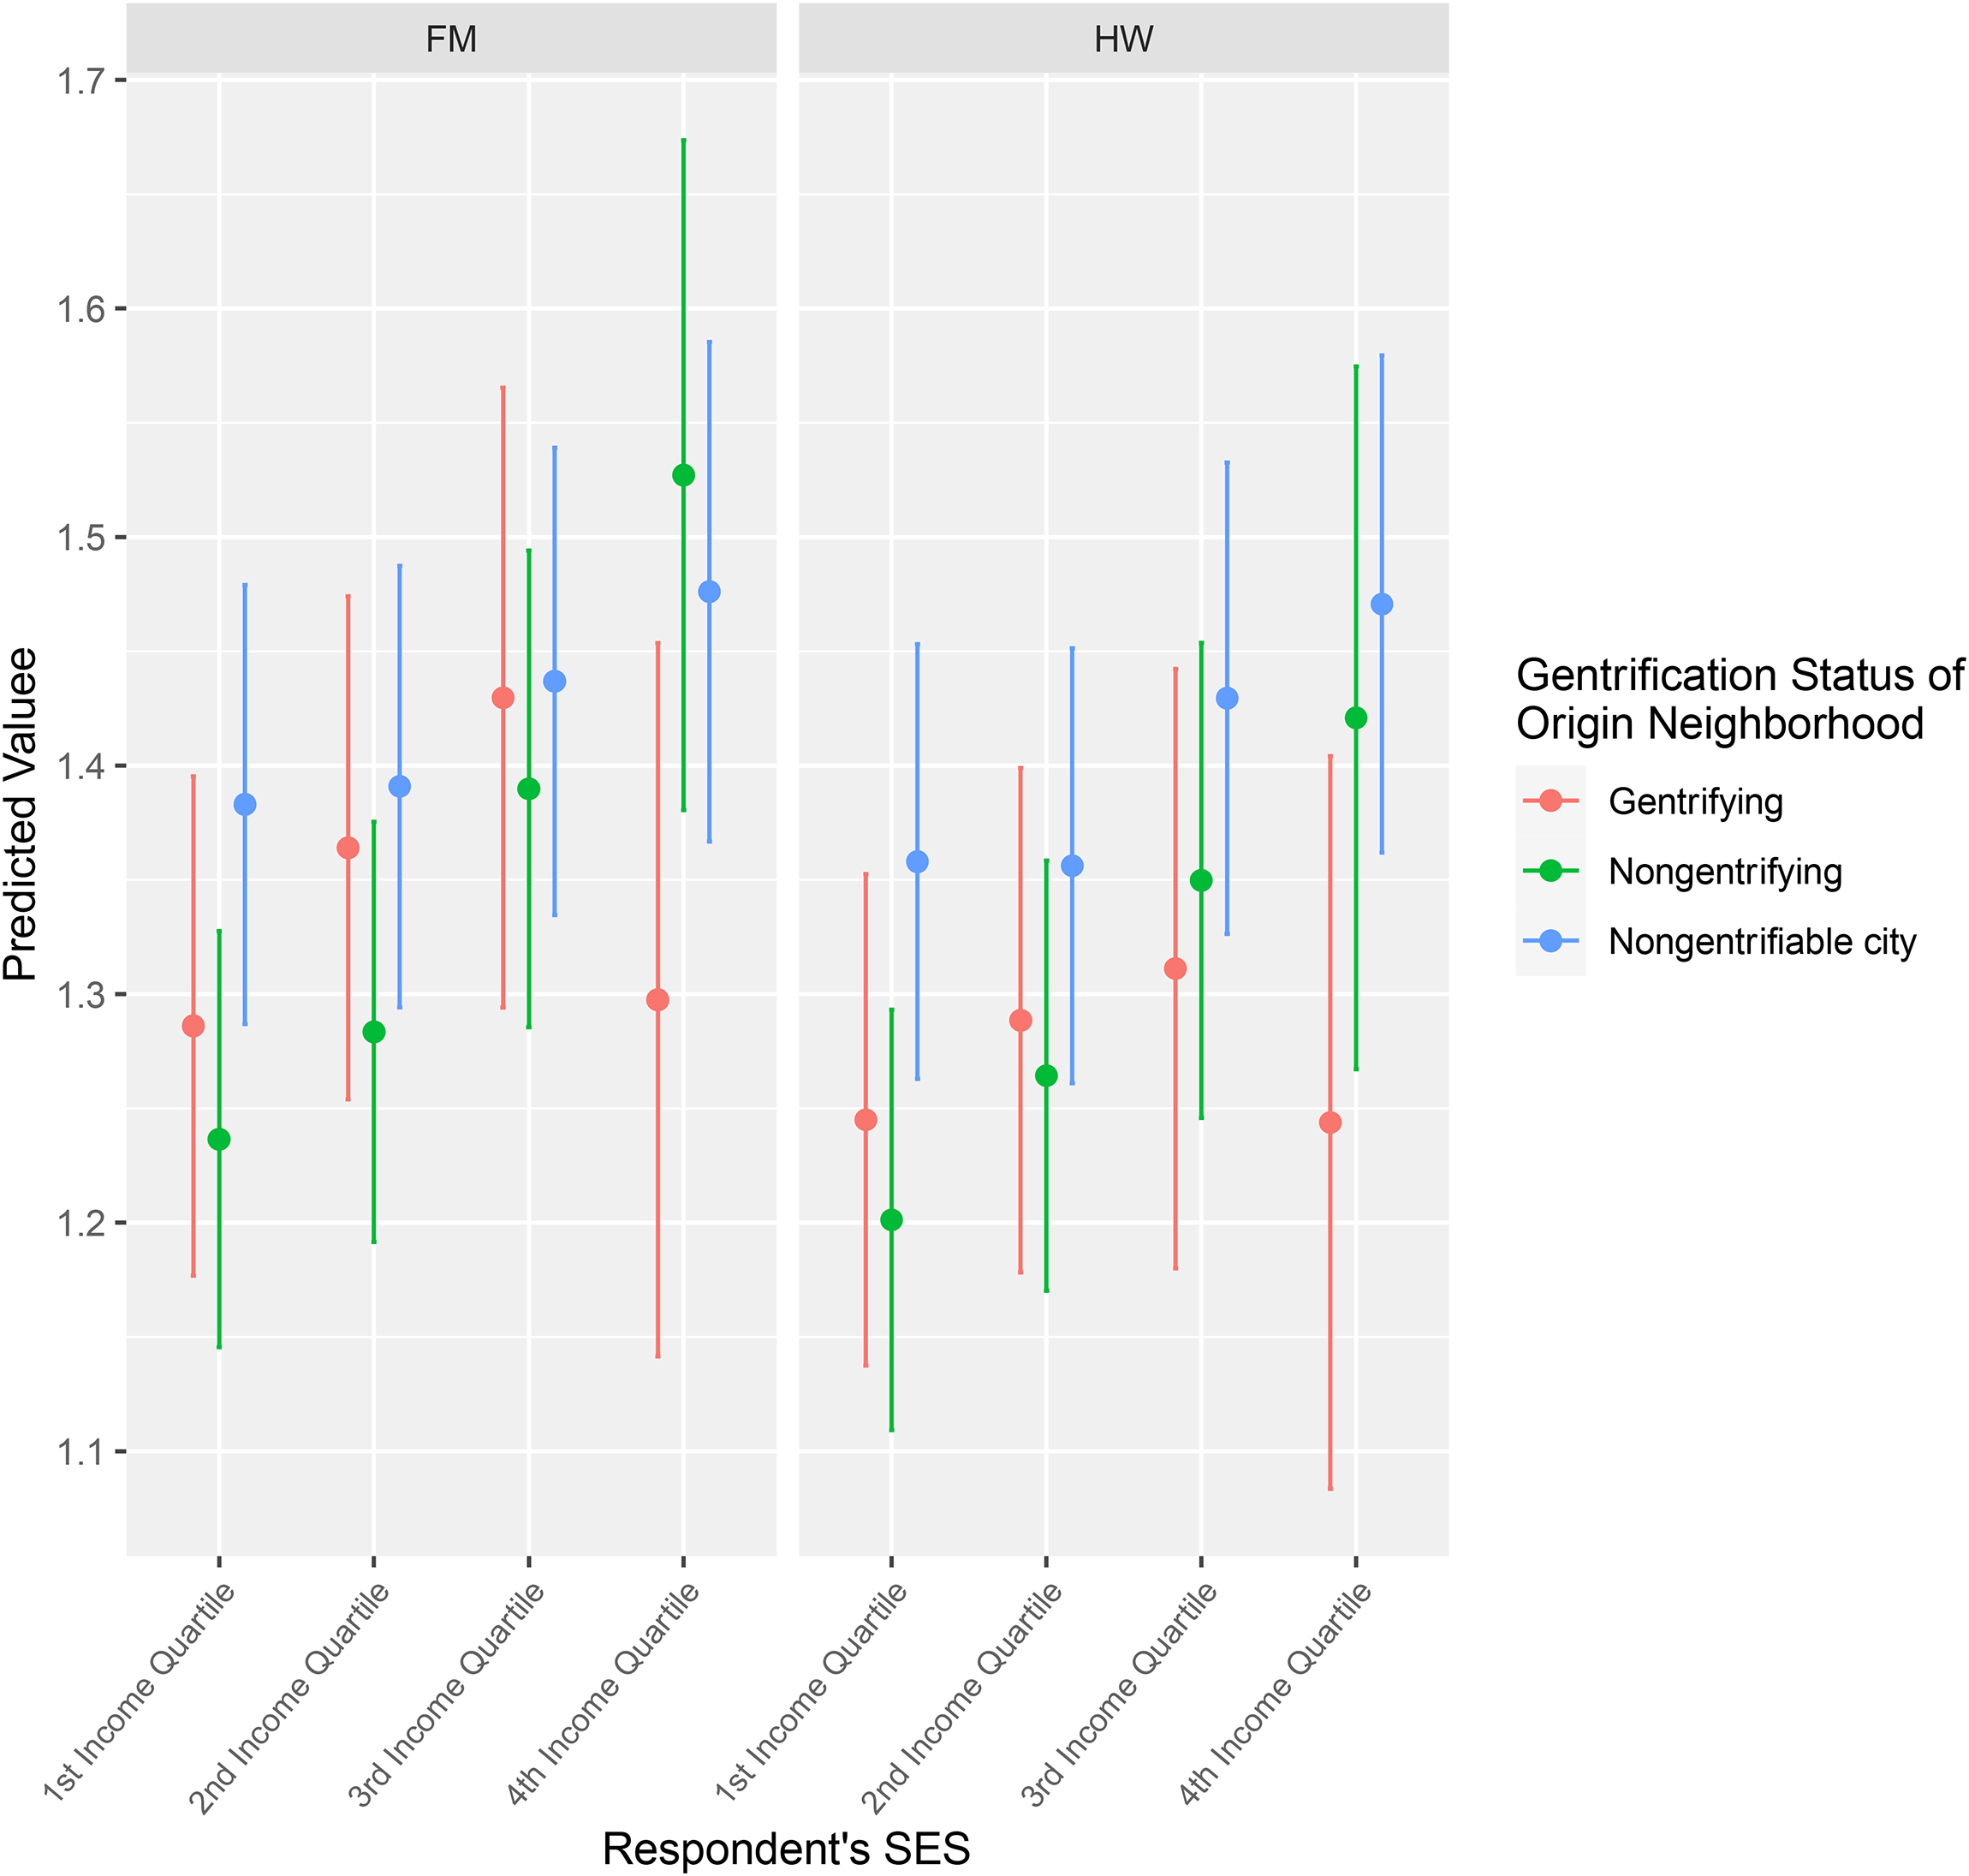
We present only the predicted outcomes using the linear regression models we described in the methods section. Figure 3 shows predicted median household incomes of the destination neighborhood by income quartile and depending on whether the origin neighborhood is gentrifying or not, based on our model results to examine how these two variables interact (or not) in determining neighborhood conditions after moving. In addition to MA-fixed effects, we also use panel year-fixed effects and control for age, marital status, sex, race/ethnicity, educational attainment, number of children, and housing tenure type before moving (e.g., renter).
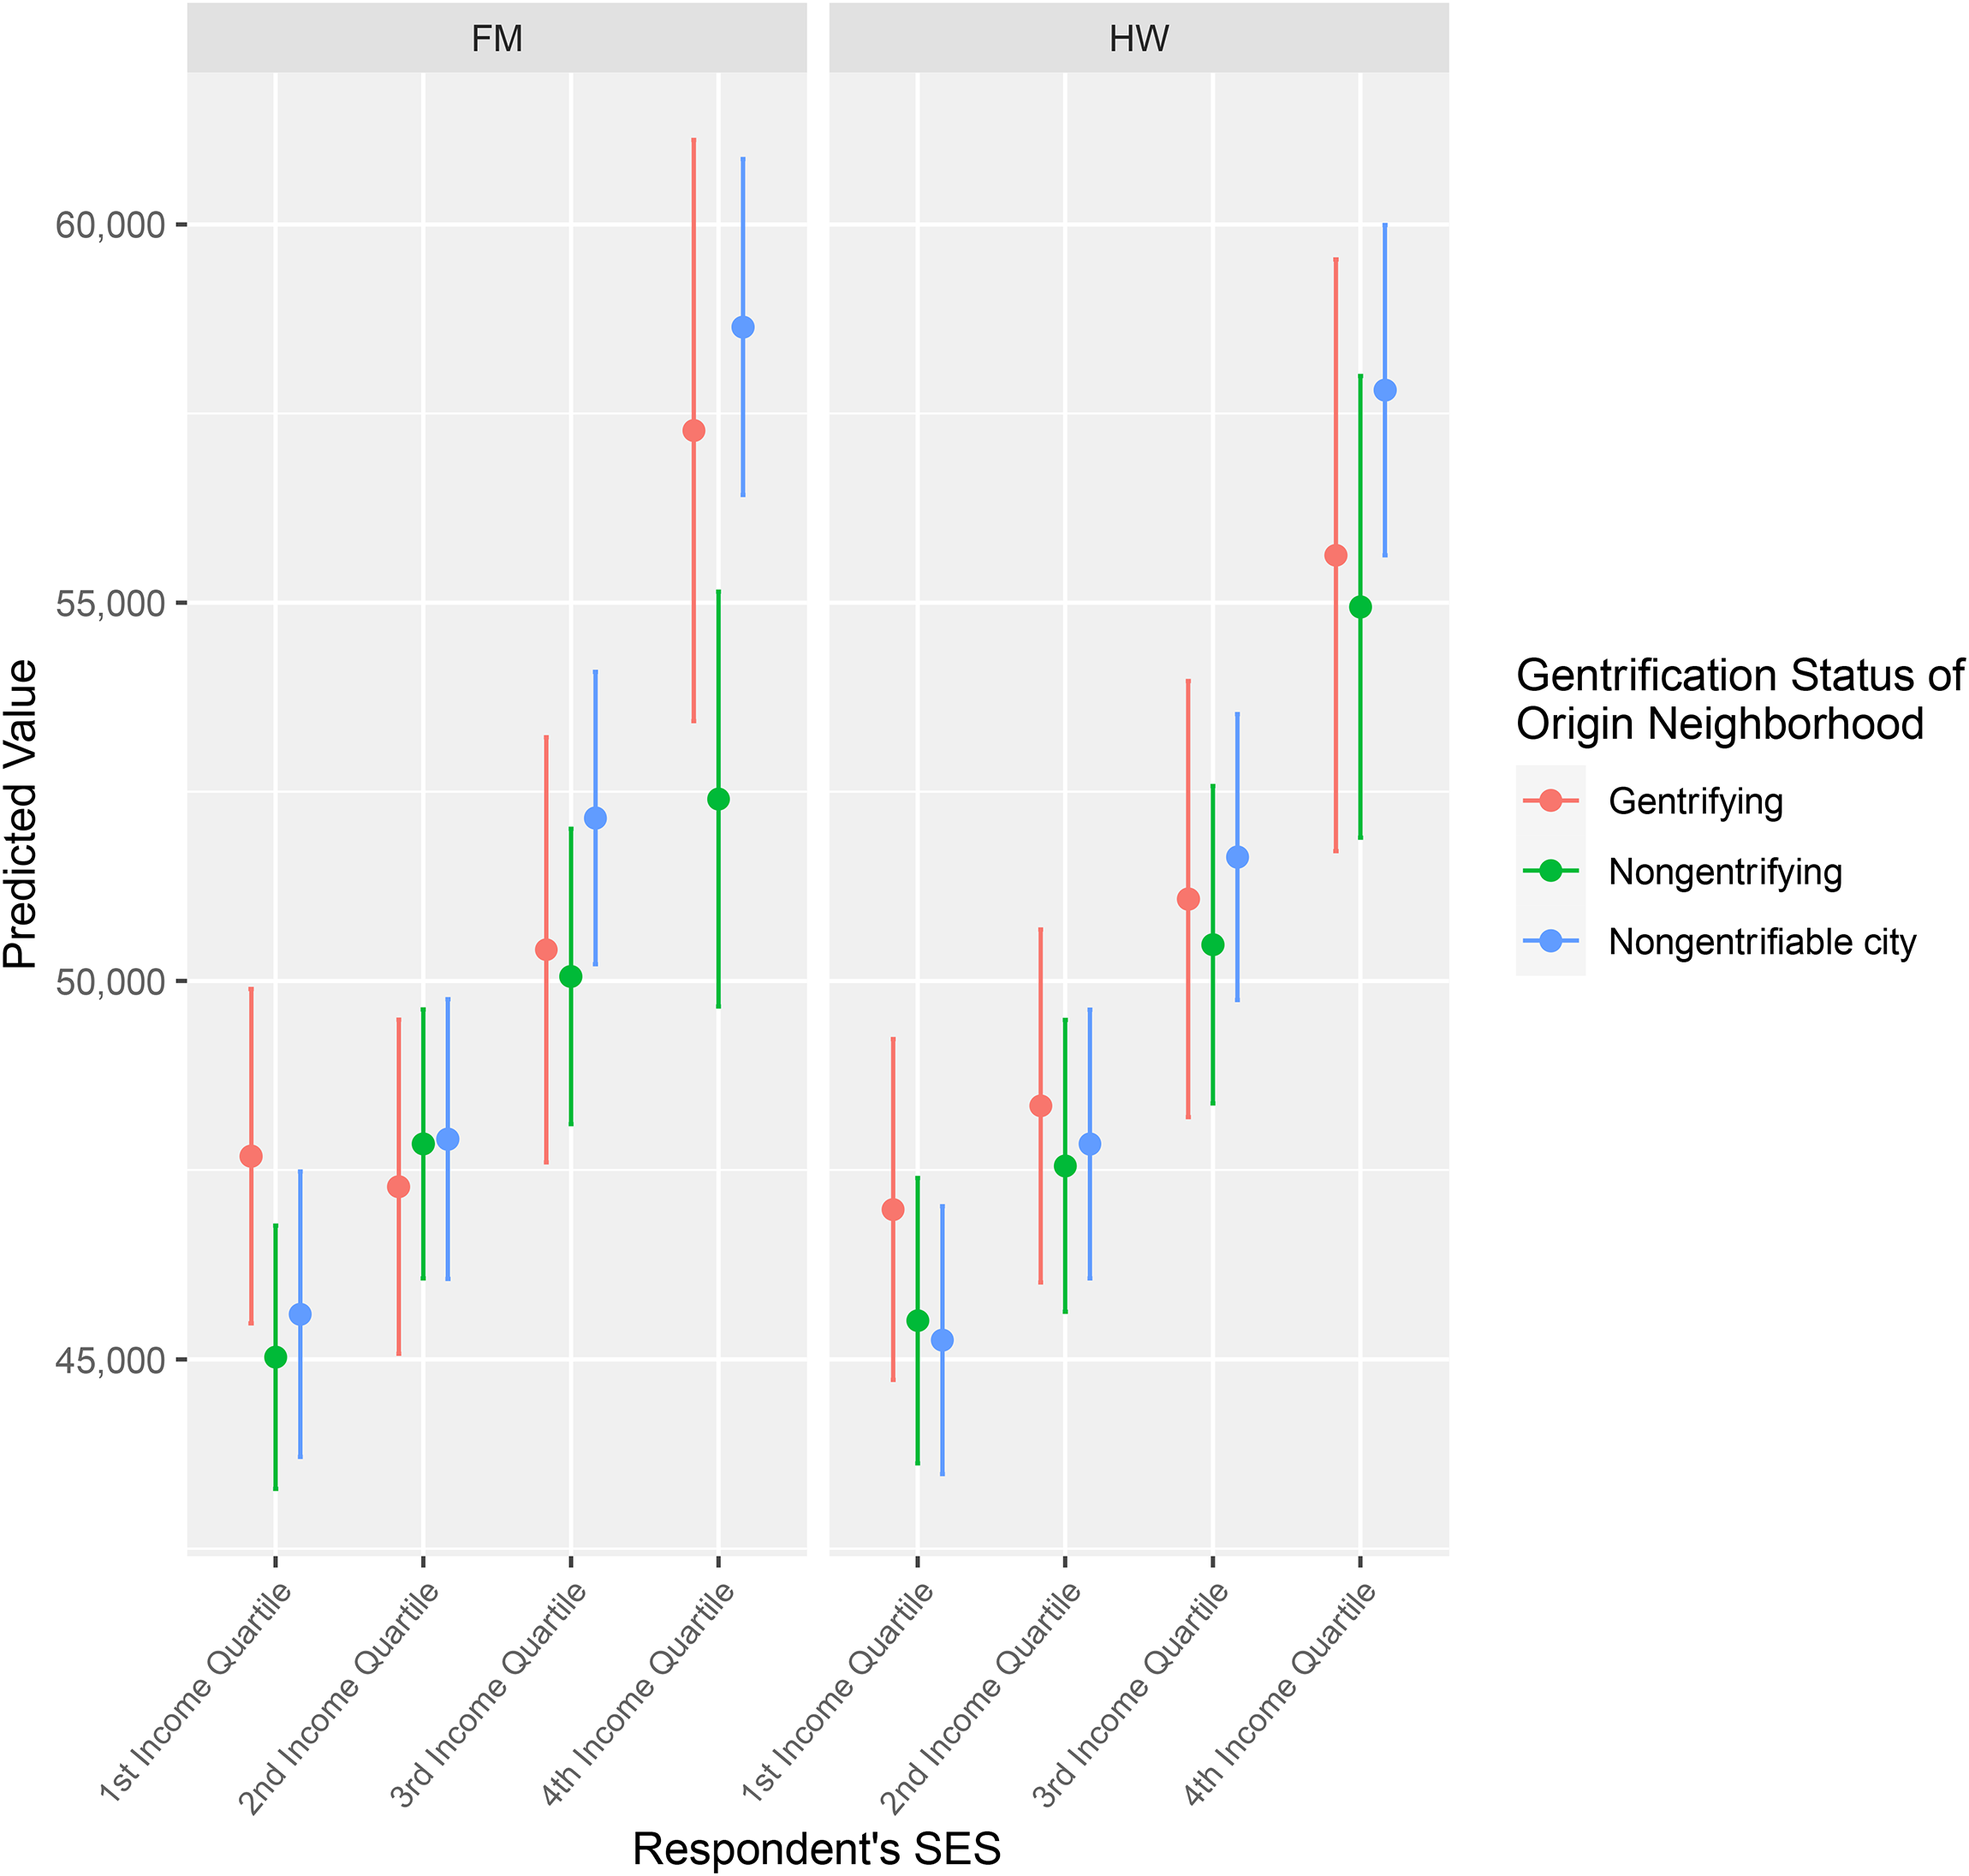
Predicted destination median household income by SES * gentrification.
The results generally show little difference in the destinations’ median household incomes across the different income groups by whether the origin neighborhood is gentrifying. Across both measures of gentrification, median household income for lower-income households originating in gentrifying neighborhoods is somewhat higher compared to similar households who originate in nongentrifying neighborhoods, although the overlapping confidence intervals indicate it could be somewhat smaller or larger. This suggests that the relationship between median household income in the destination neighborhood and respondent's income does not differ significantly depending on whether the origin neighborhood was gentrifying. Notably, the highest-income quartile residents’ destinations have significantly higher median household incomes than those for the lowest-income quartile residents, whether comparing residents in gentrifying, nongentrifying, or nongentrifiable neighborhoods. Moreover, the highest income quartile residents moving from nongentrifiable neighborhoods move to significantly higher-income neighborhoods than those from gentrifying, nongentrifying, or nongentrifiable neighborhoods for all three other income quartile residents. Therefore, compared to differences between gentrifying and nongentrifying neighborhoods, differences in destination neighborhood median household income are driven more by respondents’ income, especially among residents living in nongentrifiable neighborhoods.
We repeat the models presented in Figure 3 using the poverty rate of the destination neighborhood as the dependent variable and examine if lower-income households from gentrifying neighborhoods move to poorer neighborhoods than lower-income households from nongentrifying neighborhoods. These results, presented in Figure 4, virtually mirror the results in Figure 3. When compared to those originating in nongentrifying neighborhoods, lower-income movers who originate in gentrifying neighborhoods move to destinations where the poverty rate is lower when using both the FM and HW measures, but these differences are not statistically significant. The confidence intervals suggest our estimates are not precise enough to conclude there are substantially important differences in terms of the destinations of lower-income households between those who originate in gentrifying neighborhoods versus those who originate in nongentrifying neighborhoods. Instead, the stratification among destinations reflects the socioeconomic differences of the households and the advantage of those in the highest income quartiles who originate in nongentrifiable central-city neighborhoods relative to other gentrifiable neighborhoods.
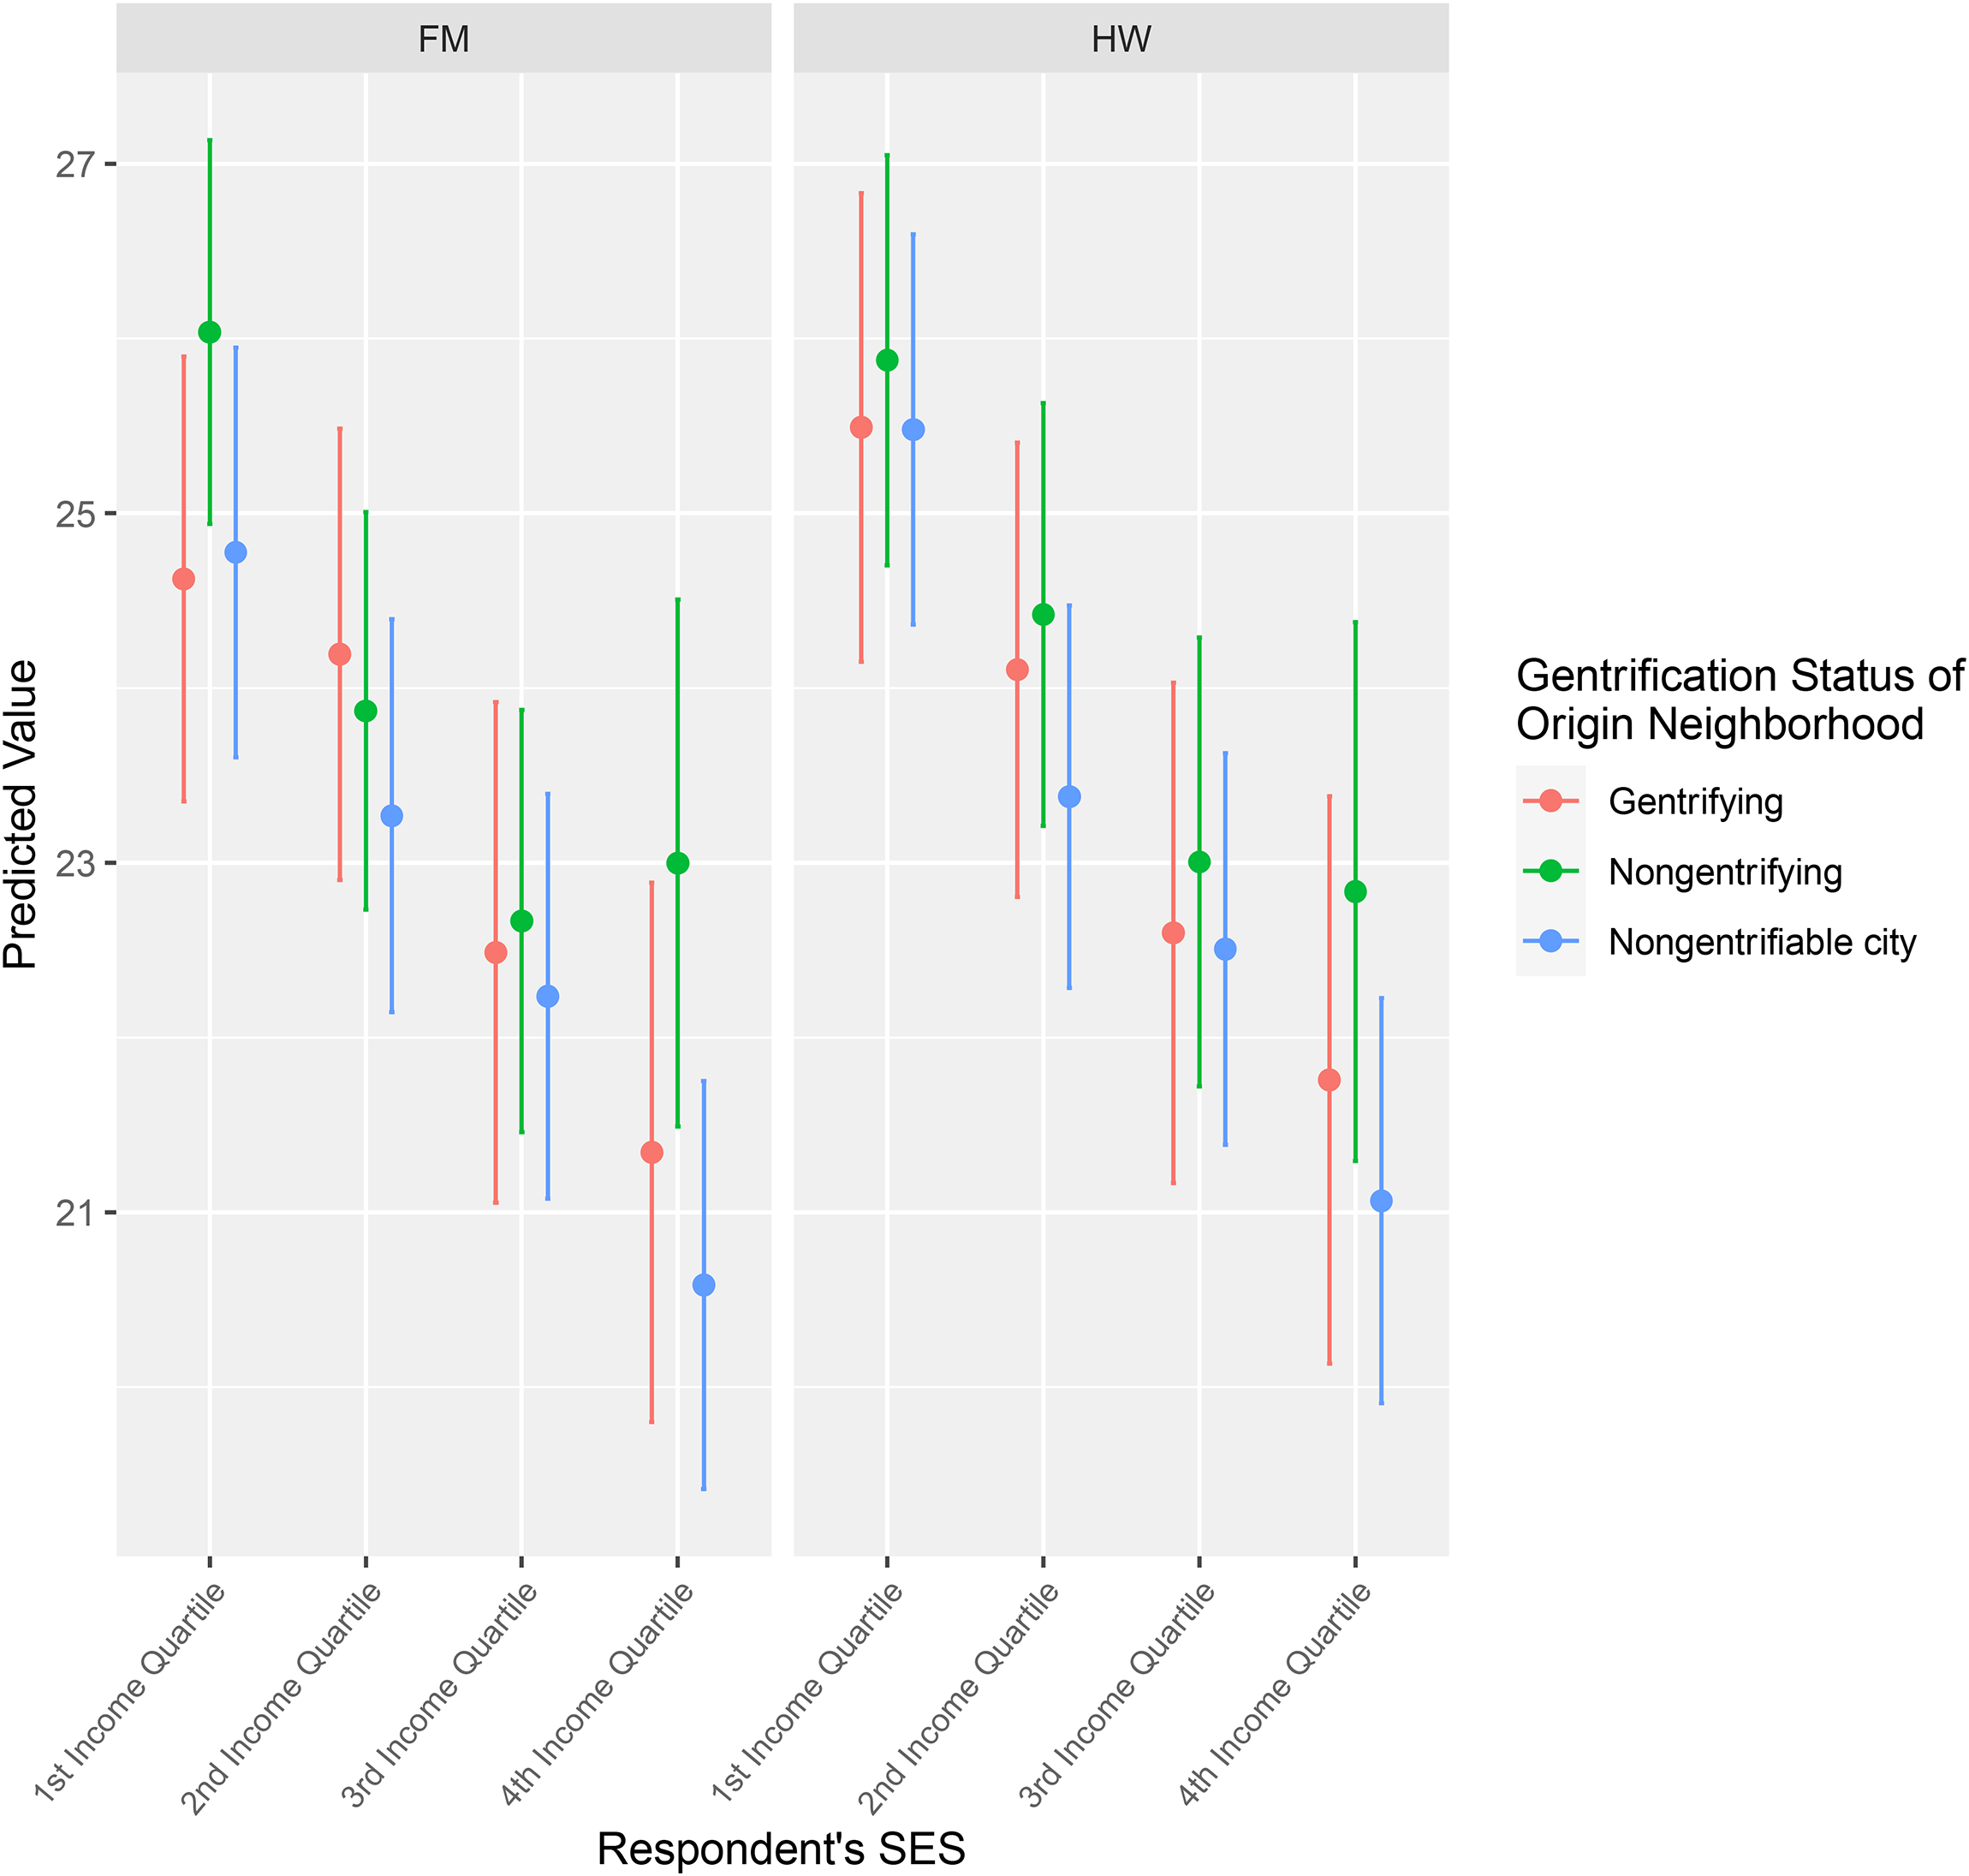
Predicted destination poverty rate by SES * gentrification.
Finally, we consider distance from the original tract and movement out of the central city as outcomes. The distance from the mover's origin tract can help us identify the extent to which gentrification is disrupting typical patterns of residential mobility whereby movers often settle near their original residences (Krysan and Crowder 2017). Our focus on the second outcome mentioned here, movement out of the central city, is motivated by concerns about the poor being pushed out of urban centers and away from the economic opportunities and services those cities provide. Overall, we find no evidence that low-income movers from gentrifying neighborhoods are making significantly longer distance moves or are moving out of the city at significantly higher rates than similar movers from nongentrifying neighborhoods.
Figure 5 illustrates the predicted log-transformed distances based on our regression results using the same models presented in Figures 4 and 5 with the distance between move destination and origin as the dependent variable, for movers within the same metropolitan area only. For both the FM and HW gentrification measures, we see little evidence to suggest movers originating in gentrifying neighborhoods are moving significantly further distances than movers originating in nongentrifying neighborhoods. There is considerable overlap in the confidence intervals of the moving distances between the two types of neighborhoods across the income spectrum.
Predicted move distance (logged, miles) by SES * gentrification.
Finally, we consider is movement out of the central city. Figure 6 illustrates the predicted probabilities of households moving out of the central city. Focusing first on the left panel of the figure which is based on the FM metric, we see the estimates for the most part have confidence intervals too wide or the differences in the estimates too small to conclude that gentrification is pushing lower-income households out of the central city. The panel for the HW measure shows similar results. Overall, our analyses do not find conclusive evidence that gentrification is pushing lower-income households out of the central cities and into the suburbs.
Predicted probability of moving out of city by SES * gentrification.
Sensitivity Analyses
Because gentrification occurs unevenly across places (Hackworth and Smith 2001) and unfolds over time in a stage-like process (Clay 1979), we have conducted supplementary analyses to test whether our results are sensitive to two alternative measures of gentrification. First, we repeat the above analyses but split the 2000–2017 period into two periods: 2000–2010 and 2010–2017. We also consider if the tracts were gentrifying prior to 2000. This allows us to consider how far along the gentrification process is in a given tract. Using these two alternative measures of gentrification to account for the stage of the gentrification process does not change the substantive conclusions we draw about the relationship between gentrification, SES, and mobility/displacement and destination outcomes.
In additional analyses, we draw on data from the 2001–2009 panels of the PSID-AHD to consider whether subsidized housing moderated the relationship between gentrification and residential mobility. The only statistically significant finding was for the HW measure, where renters without subsidies in nongentrifying neighborhoods are more likely to report involuntary moving than similar renters with subsidies. Overall, these additional results suggest that subsidies may help mitigate the need to move and to move involuntarily, but the differences are neither statistically significant nor unique to gentrifying neighborhoods.
Finally, we also operationalize movement away from the central city using distance from the central business district (CBD) using Manduca's (2021) operationalization of CBDs. Using this alternative specification, we also do not find substantive or statistically significant differences in terms of distance from the CBD between the destination neighborhoods of households originating in gentrifying neighborhoods and households originating in nongentrifying neighborhoods across income quartiles. Detailed analyses and results from the sensitivity analyses are available upon request.
In sum, our results do not show gentrification triggering different outcomes for these households, relative to lower-income households in nongentrifying neighborhoods. Our discussion has focused on lower-income households as presumably they are most vulnerable in the face of gentrification. We discuss the implications of these findings in the next section.
Discussion and Conclusion
This study sets out to replicate studies based on earlier periods of gentrification and to examine the characteristics of neighborhoods in which movers from gentrifying neighborhoods end up. Consistent with earlier studies, we find no conclusive statistical evidence of elevated mobility rates amongst those residing in gentrifying neighborhoods, even among lower-income residents. We also fail to find compelling evidence of involuntary mobility due to gentrification. The evidence from this study along with several others cited earlier that also fail to find evidence of increased probabilities of displacement due to gentrification suggests exclusionary displacement—the inability for residents to move into neighborhoods (Marcuse 1986)—may be more important for understanding the dynamics of demographic change in gentrifying neighborhoods. As others have described in more detail elsewhere (Freeman, Cassola, and Cai 2015), these findings do not mean gentrification is not a cause for concern with regard to affordable housing. Only that the normal turnover in gentrifying and other disadvantaged neighborhoods that do not gentrify masks any mobility that may arise due to gentrification.
Our final set of findings relate to the types of neighborhoods people from gentrifying neighborhoods move to or how far they move. We do not find evidence that residents who originate in gentrifying neighborhoods are more likely to move to poorer neighborhoods than residents in similar income quartiles who originate in nongentrifying neighborhoods. This suggests that mobility patterns among residents in gentrifiable neighborhoods are largely structured by socioeconomic factors, rather than whether their neighborhood is gentrifying. These results have wide confidence intervals and thus do not necessarily rule out the possibility that residents from gentrifying neighborhoods move to worse neighborhoods than their origin, while residents from nongentrifying neighborhoods tend to move to higher status neighborhoods than their origin. Future research should analyze changes in residents’ neighborhoods and consider differences in neighborhood characteristics if they have stayed in a gentrifying neighborhood.
Multiple caveats are in order regarding our findings. Our approach attempts to gauge outcomes for residents of gentrifying neighborhoods by comparing them to outcomes for residents in neighborhoods that have not experienced gentrification. Our findings suggest residential mobility outcomes are no worse for residents of gentrifying neighborhoods. This does not mean there is no reason for concern regarding these outcomes. For example, consider our finding that involuntary moves are no higher in gentrifying neighborhoods. The level of involuntary moves may still be of concern in both gentrifying and nongentrifying neighborhoods, and something that policymakers should address. Research suggests involuntary moves are more prevalent in areas with restrictive land use regulations (Dawkins 2022) and that such moves are predicted by job loss and neighborhood crime rates (Desmond and Gershenson 2017). Officials seeking to reduce displacement regardless of a neighborhood's gentrification status may seek to address these factors. Our findings suggest, however, that gentrifying neighborhoods should not necessarily be the only focus of such efforts if reducing involuntary moves is the desired outcome.
Additionally, our spatial and temporal operationalizations of gentrification are accompanied by important limitations. For example, our decision to measure gentrification at the census tract level may obscure block or block group-level neighborhood changes. Furthermore, census tracts sometimes bisect large neighborhoods, or misalign with the boundaries of established neighborhoods, and their use might thereby mask certain instances of gentrification. Our main analysis also measures whether a tract is gentrifying over a relatively long time period (2000–2017) despite gentrification potentially occurring with temporal heterogeneity across regions. Sensitivity analyses described above in the “Gentrification Measures” section suggest results are robust to more granular operationalizations of time periods. However, the possibility remains that some regions may have gentrified along time frames that have rendered the process undetectable within the time frames used for measurement in this study. Moreover, we measure gentrification in two ways and with binary measures, but other ways of operationalizing gentrification may yield distinct results. In particular, continuous measures or finer-grained categories that capture gentrification's stages may reveal nonlinear patterns of displacement. Generally, given our national-level analysis, our findings are subject to the possibility that heterogeneity across areas and over time might mask distinct patterns in individual areas or regions or in different phases of the gentrification process.
These findings add to our understanding of gentrification's impact on residents. Future studies should examine other neighborhood attributes of the destinations of those originating in gentrifying neighborhoods, including racial/ethnic composition and employment opportunities, as well as how the findings may vary across metropolitan areas with more or less segregation or income inequality. While our study does not find evidence that residents moving from gentrifying neighborhoods end up in poorer or more distant neighborhoods than those with similar incomes moving from nongentrifying neighborhoods, vulnerable residents in gentrifying neighborhoods may experience other consequences that we do not observe in this study. Myriad factors beyond neighborhood poverty rates and distance from origin neighborhood may impact residents’ health, prosperity, and quality of life, and additional studies should seek to uncover whether and how they are associated with gentrification. Furthermore, moves from gentrifying neighborhoods may be associated with changes in household characteristics such as family composition and tenure type, and future studies focused on these factors would be worthwhile. Finally, the results from our study may reflect how vulnerable residents in nongentrifying neighborhoods are facing similar experiences as those in gentrifying neighborhoods, as part of gentrification's spillover effects. As tightening housing markets become more widespread, local governments should consider moving beyond the most commonly implemented policies such as inclusionary zoning, which have produced minimal amounts of affordable housing and are unlikely to serve as effective mitigators of increasing housing costs (Freeman and Schuetz 2016). Bolder strategies that embrace affordable housing development and ensure community members and housing advocates are given a meaningful voice in neighborhood housing development processes (Howell 2016) offer a promising alternative.
Footnotes
Declaration of Conflicting Interests
The author(s) declared no potential conflicts of interest with respect to the research, authorship, and/or publication of this article.
Funding
The author(s) received no financial support for the research, authorship, and/or publication of this article.