
Abstract
Eviction has been studied almost exclusively as an urban phenomenon. The growing suburbanization of poverty in the United States, however, provides new cause to analyze the prevalence and correlates of displacement beyond cities. This study analyzes urban-suburban disparities in eviction rates across 71 large metropolitan areas. We show that eviction is a common experience in suburbs as well as cities. Urban eviction rates exceed suburban rates in most cases, but one in six metropolitan areas experienced higher eviction rates in the suburbs. Multilevel models show that key correlates of eviction—especially poverty and median rent—influence eviction patterns differently in urban and suburban contexts. We explore variations in urban-suburban disparities through case studies of Milwaukee, Seattle, and Miami. Metropolitan areas with larger shifts toward suburban poverty, more expensive urban rental markets, and more segregated suburbs experience more suburban evictions.
Introduction
Researchers have investigated the prevalence and the individual-, building-, and neighborhood-level correlates of eviction (Desmond and Gershenson 2017; Gomory 2021; Immergluck et al. 2019). Nearly all previous studies have focused on how these relationships play out in cities (Desmond and Shollenberger 2015; Lundberg and Donnelly 2019), yet today the majority of poor Americans—those most likely to face the threat of eviction—live in suburbs (Allard 2017a). Considerable attention has been paid to the consequences of this suburbanization of poverty, particularly the limited symbolic and material supports offered by state and nonprofit actors in these spaces (Allard 2009; Kneebone and Berube 2013). We know much less, however, about the differences—if any—between the operation of urban and suburban housing markets. In this paper we address three questions. First, do renters in the suburbs face equivalent risk of eviction as their urban peers? Second, are the factors associated with high rates of displacement in urban spaces the same ones that predict eviction in the suburbs? Third, what explains variations between metropolitan areas in the scale or direction of urban-suburban disparities in eviction rates?
To answer these questions, we examined more than 2.3 million eviction cases filed between 2012 and 2016 in 71 metropolitan areas. We found that median eviction rates were higher in urban neighborhoods than in the suburbs (3.19 percent vs. 2.00 percent). We fit a series of regressions modeling eviction rates as a function of suburban status and an array of tract- and metro-level variables. After adding controls, we found no remaining difference: equivalent urban and suburban neighborhoods had, on average, equivalent eviction rates. To explore this finding in greater depth, we analyzed how the relationship between eviction rates and four key neighborhood characteristics—poverty rates, age of available housing, racial composition, and median rents—differed by suburban status. We found that the basic relationships observed in studies of urban eviction played out differently in suburban spaces.
Although these models allowed us to evaluate general patterns in eviction risk across urban and suburban spaces, the main effects belied significant variation between and within metropolitan areas. We found that suburban communities had higher median eviction rates than their urban counterparts in one in every six metropolitan areas in our sample. Regression results indicated that this pattern was most common in metropolitan areas that experienced greater shifts toward suburban poverty since the year 2000, where urban rents were higher relative to suburban rents, and where suburbs were more segregated. We provide case studies of three metropolitan areas—Milwaukee, Miami, and Seattle—that yield sharply divergent patterns of urban-suburban disparities in eviction risk. Understanding this heterogeneity is, we argue, critical in addressing housing instability in any given area.
Our findings illuminate a previously-overlooked aspect of suburban poverty: residential instability. This paper provides new insight into the contours of the eviction crisis, expanding beyond the urban spaces that have been the locus of nearly all previous research. In so doing, it advances sociological research into displacement and the housing dynamics of low-income suburban neighborhoods.
Eviction and the Shifting Geography of Poverty
The geography of poverty in North America has changed considerably over the last several decades (Gordon and Janzen 2013; Murphy and Allard 2015). Throughout the 1980s, poor residents of U.S. metropolitan areas were primarily concentrated in inner-city neighborhoods (Jargowsky 1997). Starting in the 1990s, the number and proportion of low-income residents in suburban neighborhoods increased significantly (Jargowsky 2003; Kneebone and Garr 2010; Madden 2003). More than half of poor Americans now live in the suburbs (Allard 2017a). These suburbs—an increasingly-common destination for immigrants (Katz et al. 2010)—are remarkably diverse, both relative to the primary cities they surround and to one another (Hall and Lee 2010). They also profoundly shape the lives of their residents (Millward and Spinney 2013). For example, the suburban poor who have more trouble accessing health care are more likely to struggle with food insecurity than the urban poor (Allard et al. 2017; Schnake-Mahl and Sommers 2017).
Only relatively recently, however, have studies of displacement and instability begun to look beyond the urban perimeter (Clark 2005; C. E. Jones 2020; Markley 2018). The urban bias remains entrenched in the more recent literature on eviction, where nearly all research has been based on data drawn from cities (Desmond and Gershenson 2017; Lundberg and Donnelly 2019). There is no reason to think, however, that residential displacement ends at city limits, or that the repercussions of eviction are felt any less acutely in the suburbs. Evictions carry with them a broad range of consequences for individuals’ and families’ financial well-being, health, and long-term housing stability (Desmond and Kimbro 2015; Hatch and Yun 2021; Osypuk et al. 2012). Research on the suburbanization of poverty remains incomplete so long as it neglects events as common and consequential in the lives of low-income households as eviction. The reification of eviction as an urban phenomenon not only leaves significant gaps in our understanding of displacement but promotes the impression that eviction is a narrowly urban issue undeserving of broader attention.
The first aim of this paper is to describe urban-suburban disparities in eviction rates. Do suburban neighborhoods experience levels of eviction that are equivalent to their urban counterparts? Prior work has included suburban spaces within their analyses but has not evaluated how the risk of eviction might differ in urban and suburban contexts. For example, in analyzing serial eviction filing patterns in Atlanta, Immergluck et al. (2019) drew on data from suburbs, but their focus was primarily property ownership characteristics rather than location effects. Likewise, recent work on evictions in Fulton County, Georgia, Lexington, Kentucky, and the greater Seattle area included both urban and suburban spaces, but urban-suburban disparities were not an explicit area of investigation (Raymond et al. 2018; Shelton 2018; Thomas et al. 2019a). Here, we foreground this geographic divide, aiming to demonstrate the extent to which eviction rates differ beyond the limits of central cities and how the correlates of eviction vary.
Explaining Urban-Suburban Disparities Within Metropolitan Areas
The extant literature on the correlates of displacement provides a description of the factors that are, in the urban context, associated with higher rates of eviction. These include characteristics of buildings, such as corporate ownership of the property or scale of landlord's holdings (Gomory 2021; Immergluck 2018; Seymour and Akers 2021a, 2021b). Certain tenants, especially Black renters and women, are at higher risk of eviction than others (Desmond and Valdez 2012; Hepburn, Louis, and Desmond 2020). Evictions are also spatially concentrated (Raymond et al. 2018; Rutan and Desmond 2021; Shelton 2018), particularly in neighborhoods that have higher poverty rates, more Black renters, more children, and more households headed by single mothers, among other factors (Desmond and Gershenson 2017; Goodspeed, Benton, and Slugg 2021; Johns-Wolfe 2018). Do neighborhood characteristics associated with eviction in the urban context—particularly poverty, housing stock, racial composition, and rent—predict eviction rates equally well in the suburbs?
Poor households living in urban areas may be more vulnerable to eviction than those living in suburbs for several reasons. The extreme concentration of poverty in urban neighborhoods exacerbates challenges facing residents by embedding them within more disadvantaged social networks and exposing them to higher crime rates (Sharkey 2018; Wilson 1987). Although the majority of poor Americans now live in suburbs, the urban poor are four times more likely than their suburban counterparts to live in concentrated poverty (Kneebone and Berube 2013). The relatively diffuse experience of poverty in the suburbs may provide tenants with more stability by protecting them from some of concentrated poverty's negative effects.
The suburban poor, however, may face unique challenges that make it more difficult to make ends meet and leave them at greater risk of eviction. The design of suburban communities requires additional transportation expenses, which can strain household budgets (Roberto 2008). Because of the historic concentration of poverty, public and nonprofit service providers have been focused on central cities and have not kept pace with sociodemographic changes (Allard 2009; Murphy and Wallace 2010). Fragmented suburban municipal governments may be ill-equipped to handle poverty governance and to intervene to reduce evictions and prevent homelessness (Allard 2017a; Mattiuzzi and Weir 2020). On the whole, we favor the former set of explanations in our first hypothesis.
We expect that eviction rates will be higher in neighborhoods with older housing stock relative to more recently-developed areas in both cities and suburbs, and that this relationship will be stronger in the latter. Suburban property owners allowed vast swaths of housing—originally affordable to the middle class—to deteriorate in quality (Jackson 1985). These properties now serve as a source of naturally occurring affordable housing for low-income households looking to escape increasing rents in cities (Madden 2003; O’Flaherty 1996; Somerville and Holmes 2001). Inner-ring suburbs with housing stock built before 1970 have experienced particularly pronounced socio-economic decline and have the highest rates of suburban poverty (Allard 2017a; Hanlon 2010). The concentration of poverty in these spaces may make landlords in such neighborhoods faster to turn to eviction as a form of tenant control.
By contrast, in urban areas this tight linkage between age of housing stock and risk of displacement may be attenuated. Older buildings are prevalent both in stably poor urban areas as well as neighborhoods experiencing gentrification or revitalization. The pace of new construction and growth of rental housing stock has been slower in cities than in suburbs, leaving better-off renters with fewer viable newly-constructed housing options. 1 Rents have risen more quickly since 2000 in older urban neighborhoods—those with housing stock built before 1970—than in comparable suburban spaces, suggesting increasing demand even in areas with older housing stock. 2 While higher rents could plausibly force out a growing number of long-term residents, previous quantitative research has failed to find a strong link between gentrification and direct displacement such as through eviction (Freeman and Braconi 2004; Hwang and Ding 2020).
Previous research has consistently found that eviction rates are highest in majority-Black neighborhoods (Nelson et al. 2021; Thomas 2017). We expect that this pattern will hold in the suburbs as well, but may be less pronounced. Black households experience more discrimination in suburban real estate markets (Fischer and Massey 2004). This may mean that Black suburban renters are a positively selected group—less likely to fall behind on rent, more likely to find adequate housing that does not lead to conflict with their landlord—because of the additional scrutiny and prejudice they must overcome to rent in the suburbs. If so, eviction rates may be lower in suburban neighborhoods with more Black residents than in equivalent urban spaces. Notably, previous research found that Black-White disparities in eviction rates were especially large in urban metropolitan counties (Hepburn, Louis, and Desmond 2020). This suggests that while Black renters in suburban spaces may still face higher eviction rates than their White peers, the difference may be less stark than in urban spaces.
Eviction is most common among lower-income renters who struggle with irregular and insufficient pay and scant state support (Desmond 2016). Because these renters are priced out of much of the housing market, we anticipate that eviction rates will decline in neighborhoods with higher median rents. Especially in urban areas, the poor often have limited options for lower-cost housing; rents charged even in relatively high-poverty neighborhoods may be only slightly below rents charged in better-off areas (Desmond and Wilmers 2019). One of the key drivers of the suburbanization of poverty, especially for poor Black and Latino households, is the relative affordability of suburban housing (Howell and Timberlake 2014; Madden 2003). The suburban poor are more diffusely spread across suburban neighborhoods, having gained access to a broader set of neighborhoods than the urban poor (Kneebone and Berube 2013). We anticipate that the negative relationship between rents and eviction rates may be less pronounced in urban neighborhoods.
Documenting and Explaining Urban-Suburban Disparities Between Metropolitan Areas
A general pattern may hold in the relationship between, for example, poverty and eviction rates. But the fit of that relationship is always imperfect in any given case and heterogeneity in these patterns bears scrutiny. Where are the aberrations? How much of the variation can be explained?
Each of the factors explaining variations within metropolitan areas may also prove significant in explaining between-metro variability. After all, what holds for Akron may not hold true in Atlanta. Suburban evictions may prove more common in those metropolitan areas that have experienced greater shifts toward suburban poverty, particularly if the suburban poor are more vulnerable. If housing age proves positively correlated with eviction, then metropolitan areas with older suburbs may witness more suburban evictions than metropolitan areas with more recently-built suburban housing stock. Intra-metropolitan variations in housing costs are likely to affect residents mobility patterns and shift the geography of eviction risk (Zhu, Füss, and Rottke 2013). For example, researchers studying suburban foreclosures during the Great Recession observed that housing loss appeared to be more skewed toward suburban communities when city housing costs were higher and in metropolitan areas with a greater suburbanization of poverty over time (Schildt et al. 2013). Suburban eviction may also be more common if low-income tenants are priced out of central cities.
Racial segregation can structure and exacerbate displacement by constraining housing choice (Robinson 2021; Rugh and Massey 2010). Tenants with limited options may have to rent from landlords they might otherwise avoid, settle for subpar housing conditions, or pay relatively more in rent (Deluca, Wood, and Rosenblatt 2019; Desmond and Wilmers 2019). Greater degrees of segregation enable and even encourage more discriminatory or more exploitative behavior on the part of real estate professionals (Korver-Glenn 2021; Taylor 2021). While suburbs tend to generally be less segregated than the cities that they surround (Massey and Tannen 2018), suburban real estate professionals demonstrate a greater tendency to discriminate (Fischer and Massey 2004). Segregation may influence the patterns of eviction differently for urban and suburban tenants based on local context.
The literature has also highlighted lower accessibility of nonprofit organizations in suburbs as a challenge to poor suburbanites (Allard 2009; 2017a). Metropolitan areas with less-developed nonprofit sectors may see higher suburban eviction rates. Metropolitan areas vary in the extent to which resource hoarding and the push for local control have led suburbs to splinter into separate and independent municipalities (Lipsitz 2011). This municipal fragmentation has been understood as a challenge to effectively managing the suburbanization of poverty (Allard 2017a). Metropolitan areas that are fragmented into more municipalities may see higher suburban eviction rates.
Data and Methods
Our analysis draws on eviction court records filed between 2012 and 2016. Individual-level records were collected by LexisNexis Risk Solutions and compiled by the Eviction Lab at Princeton University. Records were cleaned, stripped of duplicates and commercial cases, geocoded, and validated against publicly-available data published by county and state courts. 3 The cleaning and validation procedures created uniform case outcome definitions across jurisdictions and guarded against potential biases in the analysis of court records that have been documented in the previous literature (Porton, Gromis, and Desmond 2020). 4 Evictions are among the most straightforward type of civil court hearing (Sudeall and Pasciuti 2021). The vast majority of cases are for nonpayment of rent (Hare 2018; McCabe and Rosen 2020) and many tenants receive default judgments because they do not appear in court (Desmond 2016; Kleysteuber 2007). Although a metropolitan area may span several distinct court districts, subtle differences in the eviction process across courts are unlikely to create differences in the portion of filings that result in judgments (Sudeall and Pasciuti 2021).
The eviction rate was calculated as the total number of eviction judgments divided by the number of renter-occupied housing units. 5 We focus on eviction judgments, as opposed to eviction filings, because they are a clear moment of displacement—a judge has ordered possession of the property returned to the landlord. A growing body of research demonstrates the significance of eviction filing patterns and the ways in which filings may reflect landlords exerting power over tenants or using the court system to facilitate rent collection (Garboden and Rosen 2019; Immergluck et al. 2019; Leung, Hepburn, and Desmond 2021). As such, in the Online Appendix we replicate all analyses using eviction filings as the outcome measure (see Table A6). 6
In total, 3,366,960 eviction filings from 80,943 tract-years were observed across the United States between 2012 and 2016. 7 We focused on tracts within the 200 most populous metropolitan areas. We restricted our sample to metro-years for which we had valid observations in at least 10 urban and suburban tracts (n = 16,238 tracts in 71 metropolitan areas). The median metropolitan area in our analytic set had coverage for 100 percent of the urban area and 93.7 percent of the suburban area. 8 To calculate the eviction rate—and to limit the effects of year-to-year noise in the data—we took the average number of eviction judgments per observed year within each tract. 9 The Online Appendix provides a full listing of metropolitan areas and assesses the representativeness of the sample. While these data are the most comprehensive nationwide set of eviction records available, there were still tracts missing within included metropolitan areas. The multilevel framework that we employ for analysis is ideal for situations such as this where data may be limited for some of the units (Gelman and Hill 2007). This characteristic of the modeling strategy, combined with sensitivity tests detailed in the Online Appendix, give us confidence that results are not a product of missingness.
The suburbanization of poverty literature is marked by disagreement over what constitutes a suburb (Airgood-Obrycki and Rieger 2019; Forsyth 2012; Terbeck 2020). We adopted Kneebone and Berube’s (2013) census-based definition, which relies on functional political boundaries. We considered tracts to be urban if they were contained within either the first principal city in the official name of the metropolitan area or any subsequent named city with a population greater than 100,000. 10 The remainder were marked as suburbs. While this definition does not allow us to distinguish between different types of suburbs, recent research indicates that such boundary-based suburban definitions effectively distinguish between urban and suburban spaces (Terbeck 2020).
To describe differences in eviction rates between urban and suburban neighborhoods, we fit a series of multilevel negative binomial regressions in which tracts were nested within metropolitan areas. We allowed each metropolitan area to have a varying intercept and suburban term and, over the course of several models, systematically added covariates at each level. The nature of the dependent variable—the count of the number of evictions filed in the tract—necessitated either a Poisson or a negative binomial model, and likelihood ratio tests favored the latter. In all models we included an offset—

To examine how the predictors of neighborhood eviction rates varied between urban and suburban spaces, in the third model we included interactions between suburban status and each of the tract-level characteristics included in the vector
Additional tract-level covariates, drawn from the ACS, accounted for a range of factors that have been associated with eviction rates in previous studies (Desmond and Gershenson 2017; Desmond, Gershenson, and Kiviat 2015). Because landlords might be less likely to file for eviction in soft rental markets, we included the housing vacancy rate. We also included controls for the percentage of the tract's population under the age of 18 and the percentage of female-headed renter households because of the excess eviction risk faced by children and female-headed households (Desmond 2016).
In all models, we predicted the tract-level intercept (

To examine differences in urban-suburban disparities between metropolitan areas, we allowed the suburban term (

After completing the regression modeling, we reviewed the random effect estimates for each metropolitan area. We purposively selected three metropolitan areas that exhibited divergent trends: one with lower eviction rates in suburban than urban tracts; one with the opposite pattern; and one that exhibited functionally equivalent patterns. We evaluated the geography of eviction by dividing neighborhood eviction rates by the metropolitan eviction rate and then mapping each of these metropolitan areas. In dialogue with these maps, we analyzed the historical processes that led to the current patterns.
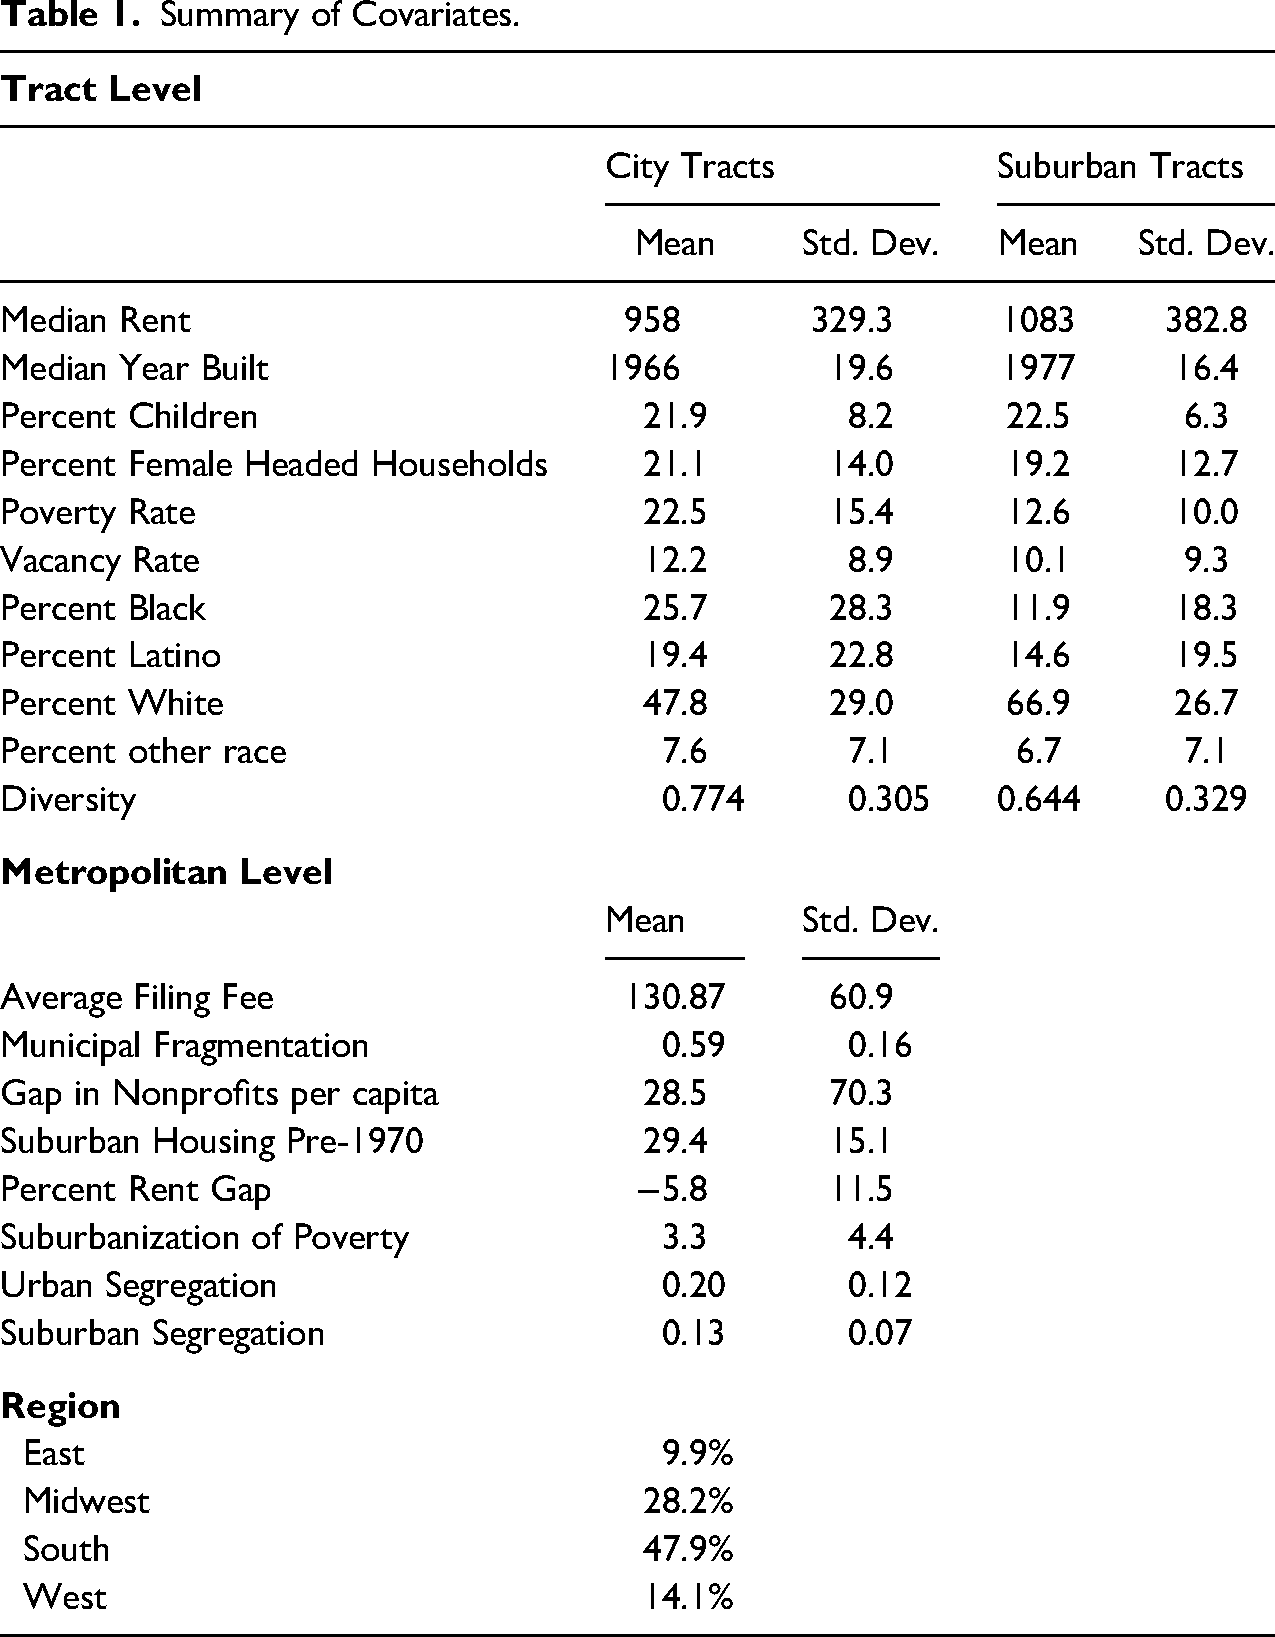
Table 1 provides a description of the sample and covariates. Just under 60 percent of tracts in our sample were suburbs. Housing in cities was older than in suburbs: the average year of construction was 1966 in urban tracts compared to 1977 in the suburbs. Across these 71 metropolitan areas, a majority of poor residents (54.7 percent) lived in the suburbs, but poverty rates were, on average, still much lower in suburban than in urban neighborhoods (12.6 percent vs. 22.5 percent). Rents were notably higher in the suburbs than in urban neighborhoods ($1,083 vs. $958), though this does not account for variations in the size and/or quality of housing. Suburban tracts had more white residents and smaller shares of Black and Latino residents. As such, urban tracts were, on average, more racially diverse than suburban tracts. Nearly half of metropolitan areas were in the South and relatively few were in the East (7 out of 71). The average metropolitan-level had a larger share of poor residents in the suburbs—3.3 percentage points—in 2012–2016 than in 2000. In the average metropolitan area, it cost $130 to file an eviction.
Summary of Covariates.
Results
Between 2012 and 2016, 1,135,080 total eviction judgments were handed down in the tracts in our sample. Of those, 449,310 (39.6 percent) were in suburbs. The median eviction rate was higher among urban tracts (3.19 percent vs. 2.00 percent). Put another way, approximately one in every 30 urban renters faced eviction each year, compared to one in every 50 suburban renters.
Urban-suburban disparities in eviction rates varied by the extent of neighborhood poverty. In Panel A of Figure 1 we display median eviction rates in urban and suburban neighborhoods by tract poverty rate. Median eviction rates were nearly identical—approximately 1.45 percent—in low poverty (less than 10 percent) urban and suburban neighborhoods. By contrast, high-poverty (more than 20 percent) urban neighborhoods had notably higher median eviction rates (4.82 percent) than their suburban counterparts (3.64 percent). These high-poverty neighborhoods were also more prevalent in urban spaces. Roughly half of all urban neighborhoods in our sample were categorized as high poverty, compared to just under 20 percent of all suburban neighborhoods. This pattern is consistent with other work showing that suburban poverty is far more diffuse than urban poverty (Kneebone and Berube 2013).
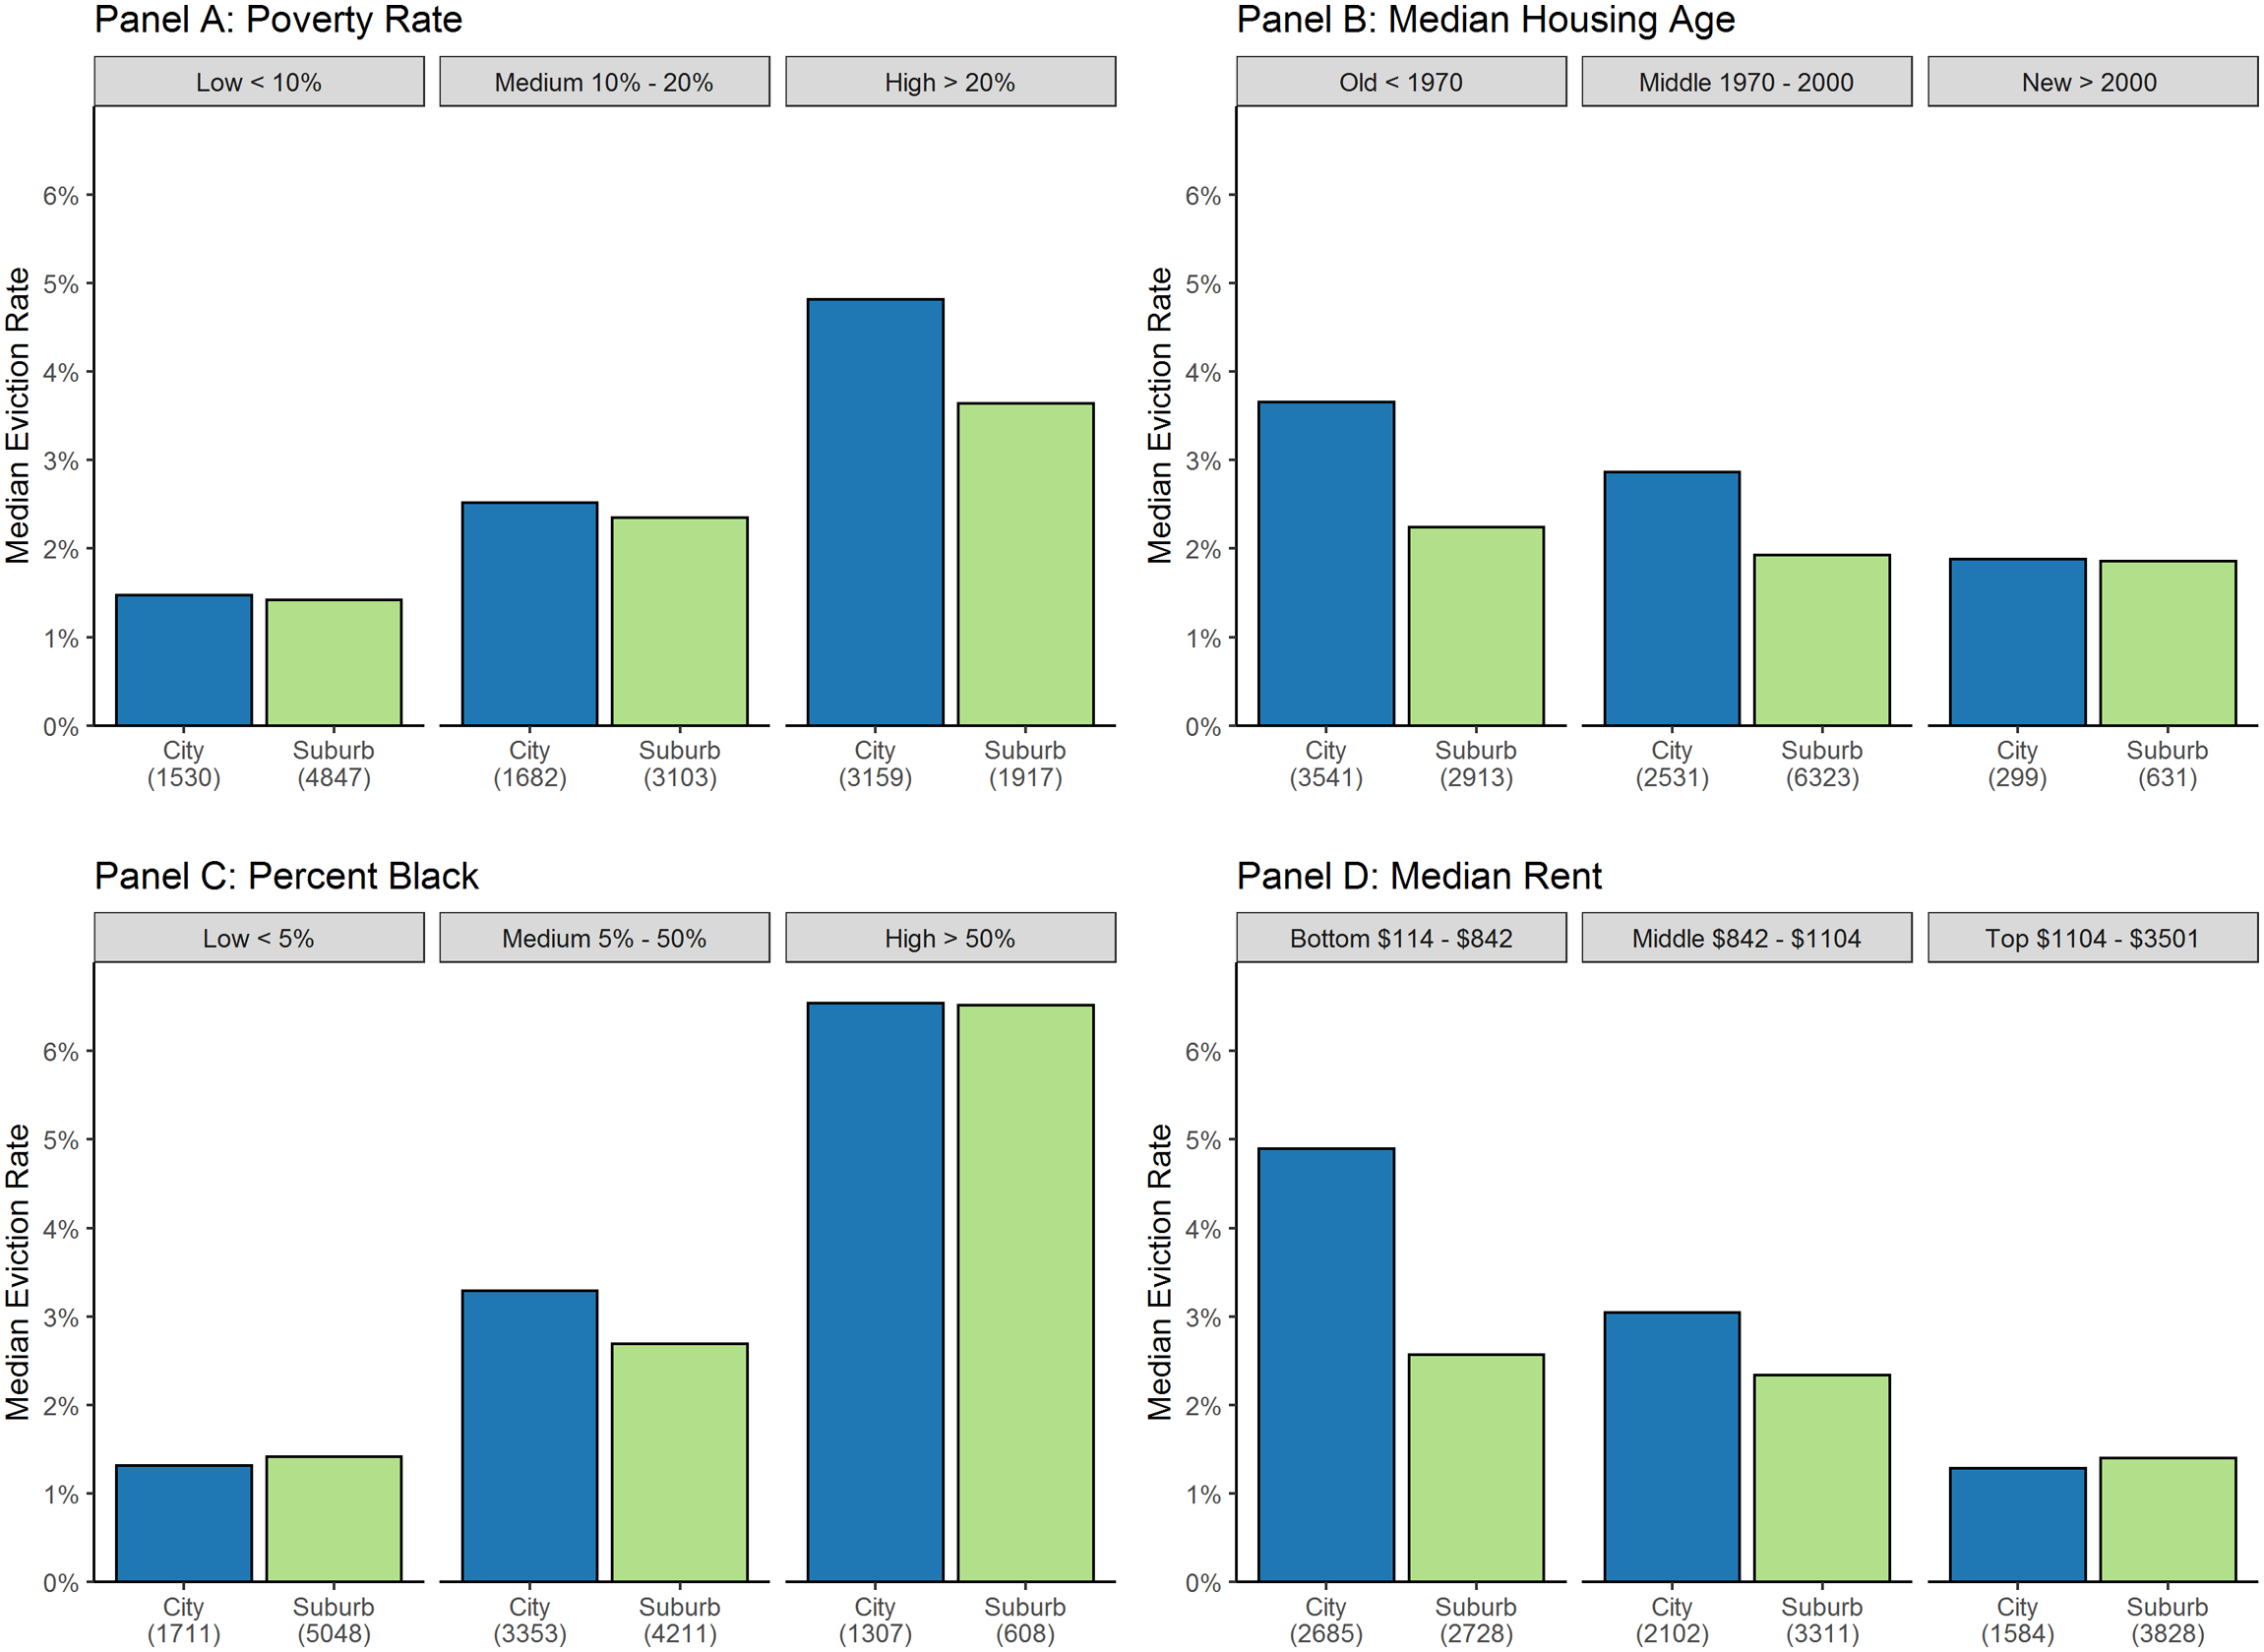
Bivariate relationships between hypothesized variables and eviction rate.
Eviction rates varied across housing markets. In Panel B of Figure 1 we plot the median eviction rates in urban and suburban neighborhoods, disaggregated by the median age of housing construction. Median eviction rates were much higher in older urban neighborhoods (3.65 percent), where most of the housing stock was built before 1970, than in newer ones (1.88 percent), where most housing was built after 2000. The gradient was less steep among suburban neighborhoods; older suburbs had median eviction rates (2.24 percent) only slightly higher than the newest ones (1.86 percent).
In Panel C, we examine how eviction rates varied as the share of neighborhood residents who were Black increased. We found very little difference in eviction rates between urban and suburban neighborhoods that had very few Black residents (<5 percent) or that were majority-Black. However, in between those extremes—in neighborhoods in which Black people made up between 5 percent and 50 percent of the residents—eviction rates were higher in urban neighborhoods. Finally, eviction was most common in lower-rent neighborhoods, in both the cities and the suburbs. As Panel D of Figure 1 shows, there was a much steeper gradient in urban neighborhoods (4.90 percent in the lowest vs. 1.28 percent in the highest-rent areas) compared to suburban neighborhoods (2.57 percent vs. 1.40 percent).
In Table 2, we present results from a series of regression models predicting tract eviction judgments. In all models the tract-level intercepts were modeled as a function of metro-level covariates (per Equation 2). In Model 1, the suburb indicator was the only tract-level covariate. In Model 2, we added the full set of tract-level covariates. In Model 3, we built on the previous model by introducing a set of interactions between the indicator of suburban status and the tract-level covariates. Because of the inclusion of an exposure term for the number of renter households, all coefficients should be read as changes in the log eviction rate given a one standard deviation change in the covariate.
Regression Results: Predicting Eviction Rates.
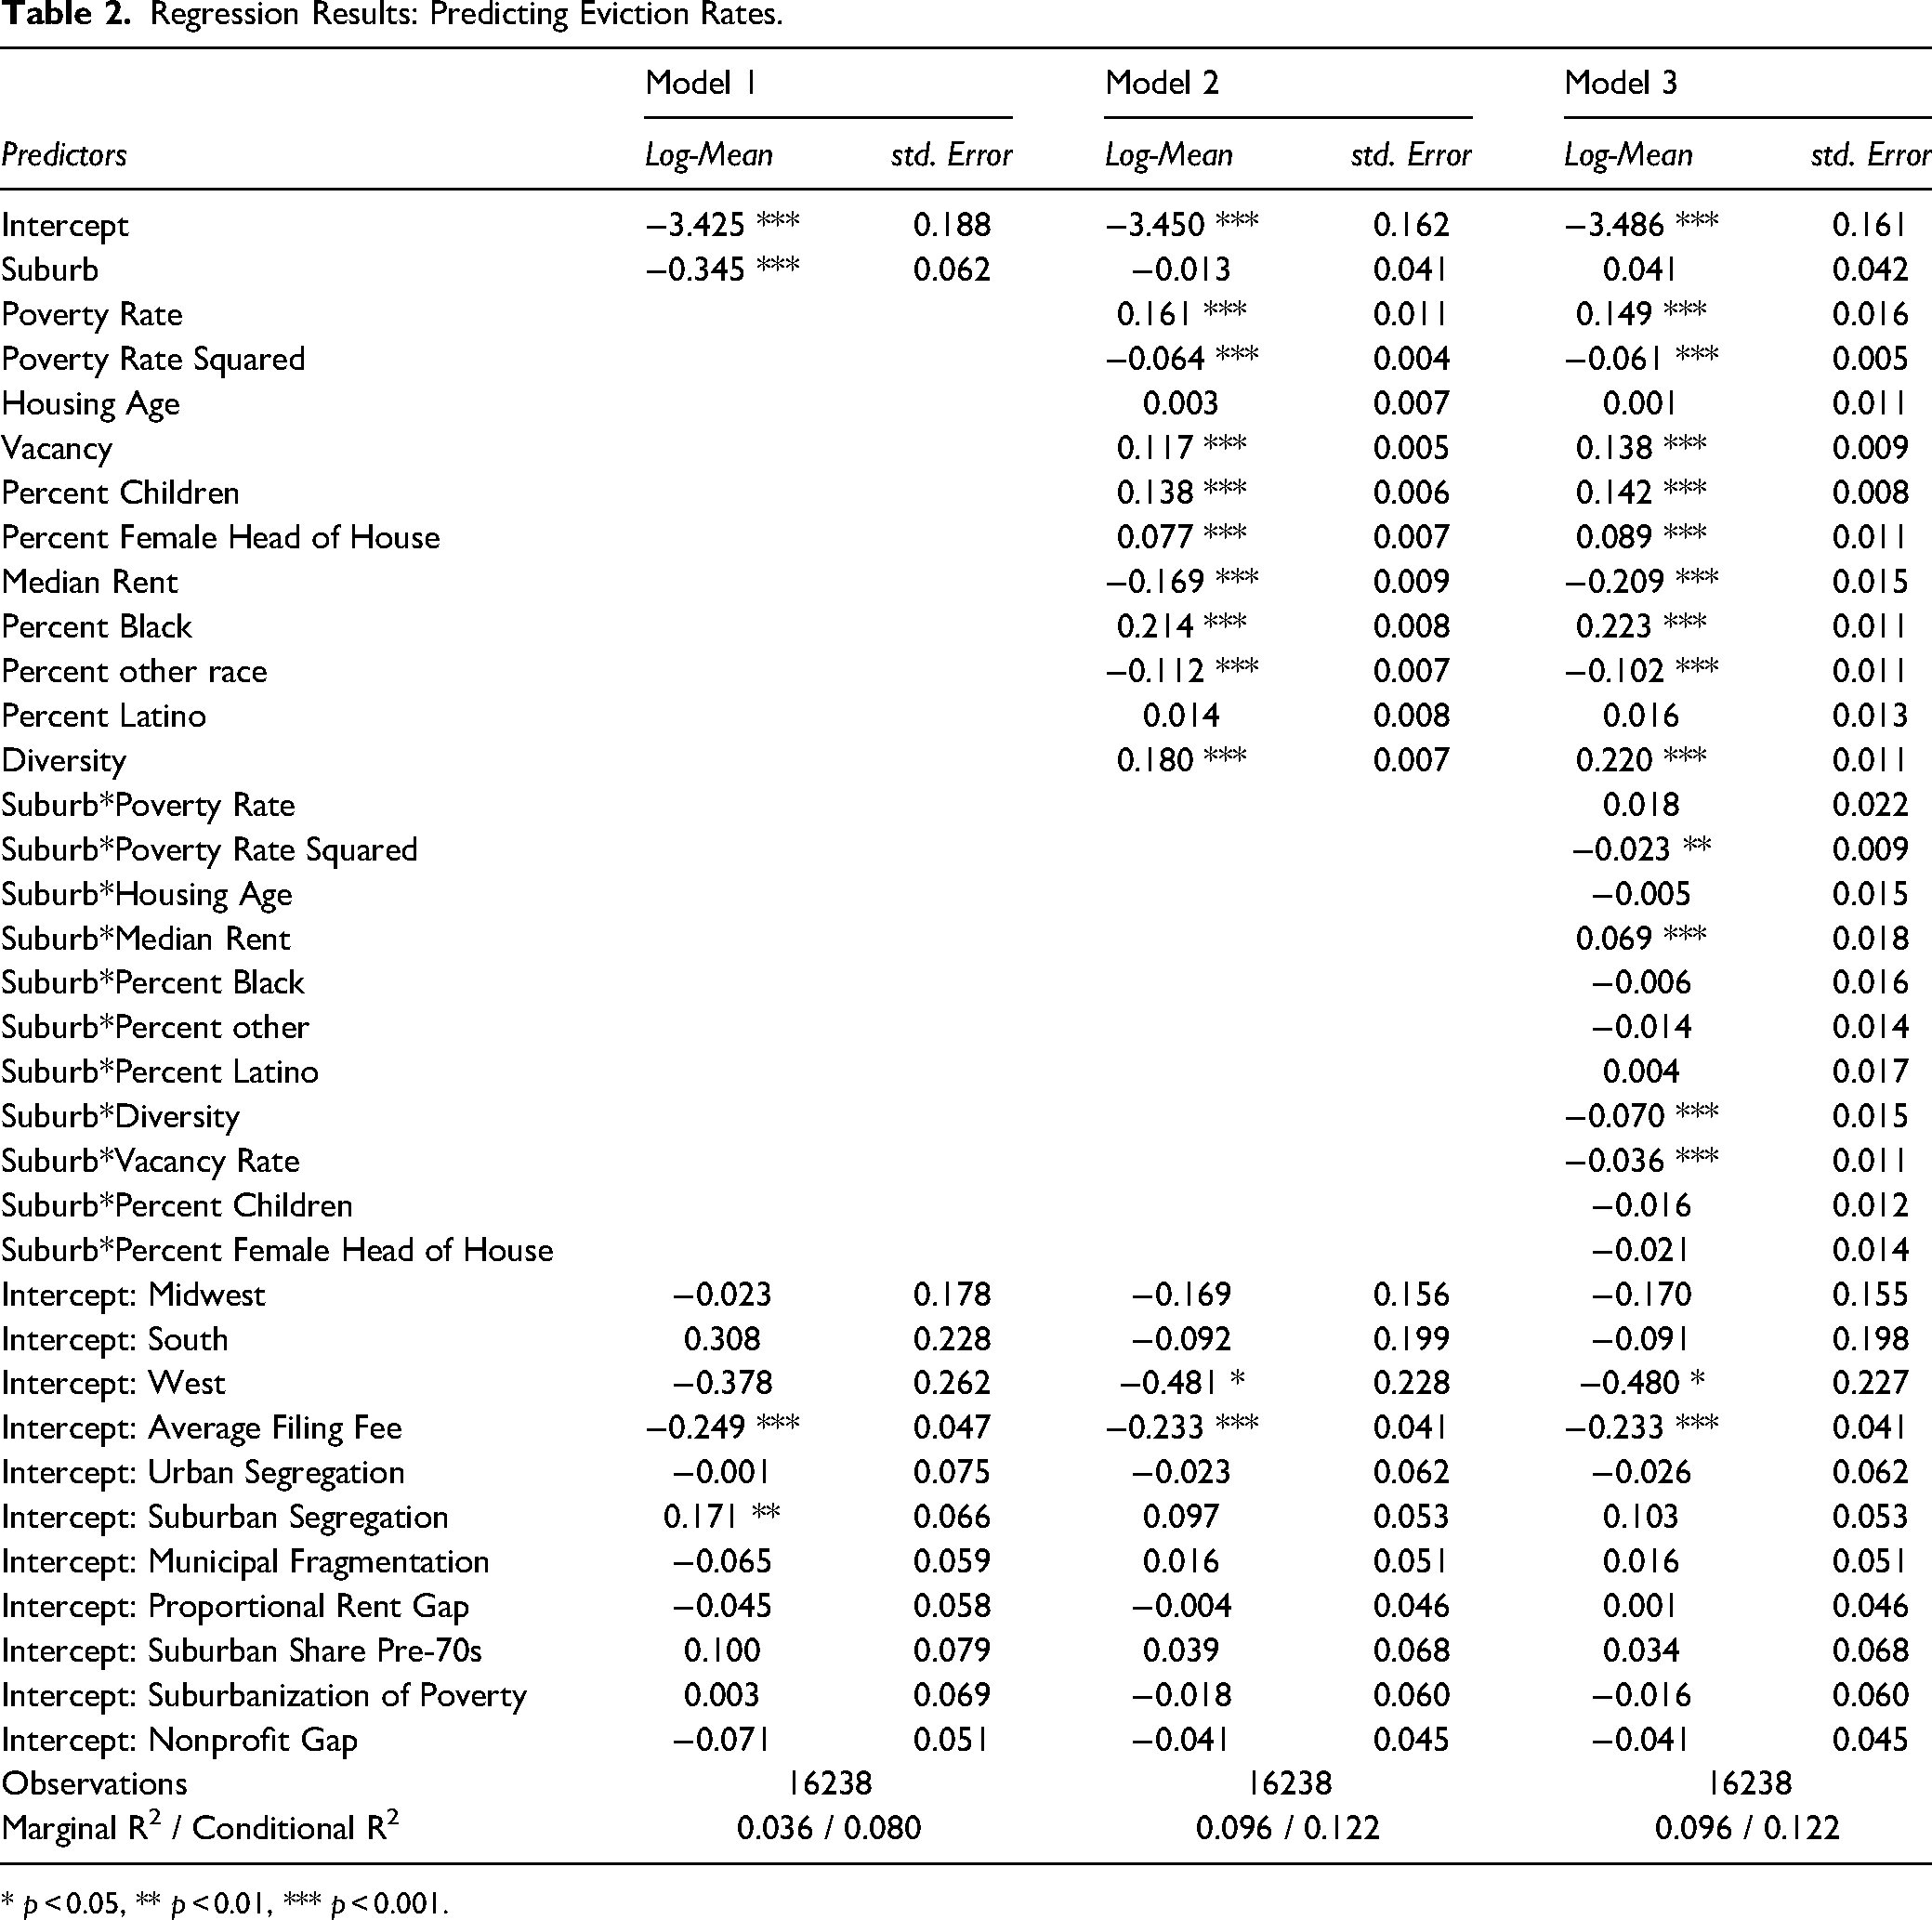
* p < 0.05, ** p < 0.01, *** p < 0.001.
In Model 1, controlling for no other neighborhood characteristics, we found that suburbs had significantly lower eviction rates than urban neighborhoods. A suburban tract was predicted to have an eviction rate 29.2 percent lower than an urban tract (
Is the difference entirely a function of composition, or do the underlying relationships between neighborhood characteristics and eviction rates vary between urban neighborhoods and suburbs? In Model 3, we found a significant positive relationship on the main effect of tract poverty and a significant negative term for the squared term, indicating that eviction rates were expected to increase in urban neighborhoods as poverty rates rose, at least up to a point at which the relationship tapered off. Interactions between these two variables and the suburb term were both negative, and the latter significant. The combined effect is that, holding other factors constant, suburban eviction rates were predicted to be slightly lower than urban eviction rates, especially at higher levels of poverty.
We found no association between the age of neighborhood housing stock and the neighborhood's eviction rate, and the suburb interaction revealed no significant difference. Controlling for other factors, there does not appear to be a remaining relationship between the age of housing stock and eviction rates.
In urban neighborhoods, we observed a strong positive relationship between the share of residents who were Black and its eviction rates. By contrast, we found no association between share of Latino residents and the eviction rate and a significant negative relationship between the share of residents of some other race or ethnicity—predominantly people of Asian descent—and the eviction rate. Interaction terms indicate that none of these relationships differed in the suburbs. We also found that higher levels of diversity were associated with higher eviction rates in urban neighborhoods. This was true of suburbs as well, but significantly less so.
We found a significant negative relationship between the median rent charged in an urban tract and that neighborhood's eviction rate. The interaction with suburban status was significant and positive; the net effect was a less-extreme negative relationship between rent and eviction rates in the suburbs. In otherwise-equivalent neighborhoods with median rents below $1,100 per month, the urban would be predicted to have a higher eviction rate than the suburban, whereas at higher rent levels the suburban neighborhood would be expected to have higher eviction rates.
Finally, consistent with the previous literature, we found that urban tracts with more children, more female-headed families, and higher vacancy rates all had significantly higher eviction rates. Relationships for the first two variables showed no difference in the suburbs, but the relationship between rental vacancy rates and eviction rates was attenuated in these spaces.
Heterogeneity in Urban-Suburban Disparities
The pattern of higher eviction rates in urban neighborhoods than in the suburbs did not hold uniformly across the sample. 15 Eviction rates were higher in the suburbs than in the corresponding urban neighborhoods in 12 of the 71 metropolitan areas in our sample (16.9 percent). For instance, in Columbia, SC, the median eviction rate in the suburbs was nearly double that observed in urban neighborhoods (4.98 percent vs. 2.75 percent). This was true of several large metropolitan areas, including Philadelphia, Houston, and Boston.
In 26 of the metropolitan areas, the urban eviction rate exceeded the suburban eviction rate by less than one percentage point. The remaining 33 metropolitan areas (46.5 percent of the sample) with notably higher urban than suburban eviction rates included cities such as Providence, Kansas City, Richmond, Jacksonville, and Tucson. Of the six metropolitan areas in which urban eviction rates exceeded suburban rates by the largest amount, four were in Ohio (Akron, Cleveland, Dayton, and Canton). 16
Detailed case studies offer a more revealing description of the extent of this heterogeneity. Reviewing the suburban term random effects for metropolitan areas produced by Model 3 of Table 2, we selected three that had strikingly dissimilar patterns: Milwaukee, Miami, and Seattle. 17
Evictions in Milwaukee were heavily concentrated within city boundaries, particularly in the Northside of the city. We map rates across the metropolitan area in Figure 2, shading tracts based on their eviction rate relative to the metropolitan average (2.3 percent). Between 2012 and 2016, the median eviction rate in urban neighborhoods in Milwaukee was 4.01 percent, compared to 0.73 percent in the suburbs. Nearly a third of urban neighborhoods (30.4 percent) had eviction rates of six percent or more. By contrast, no suburban neighborhood had an eviction rate above 5.21 percent.
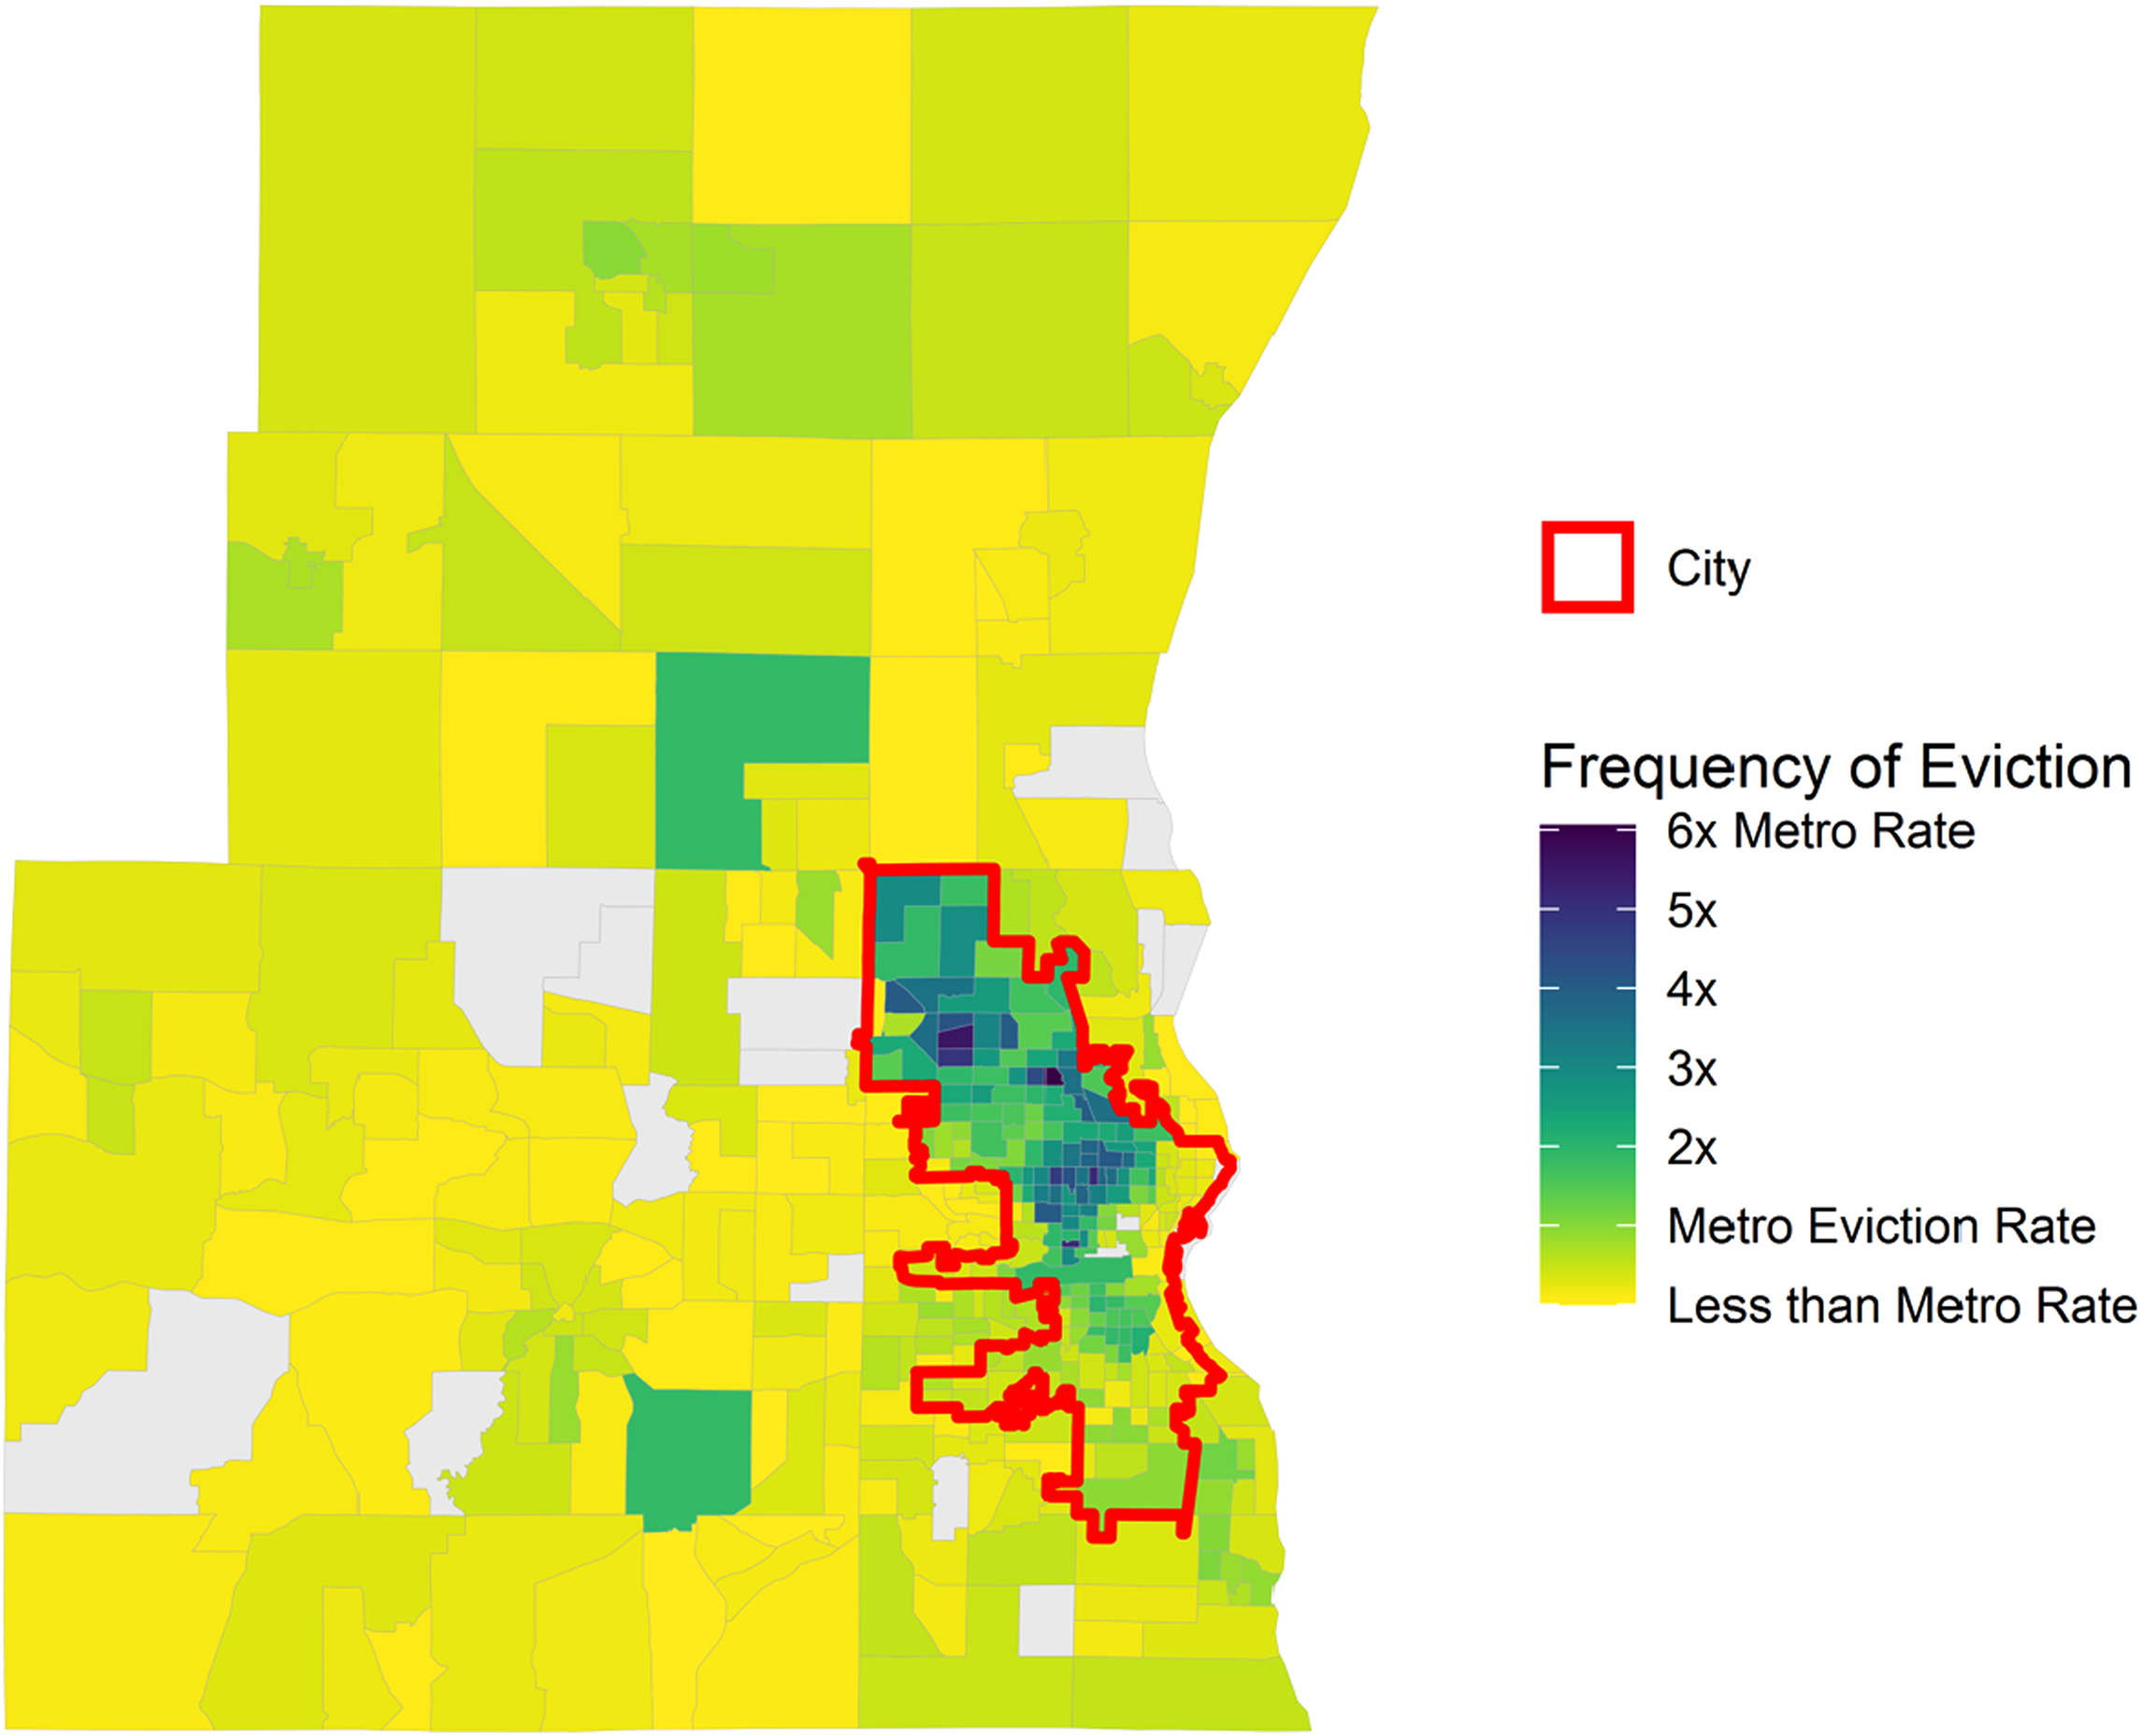
Tract-level eviction rates in the Milwaukee-Waukesha-West Allis metropolitan area.
Current eviction patterns in the metropolitan area derive from a long history of racial segregation. During the Great Migration, Black families who relocated to Milwaukee were forced to live in a crowded ghetto on the Northside of the city. Legalized segregation provided landlords no incentive to maintain their properties or drop the rent, and Black families lived in dishonorable and dangerous conditions, which often bred disease like tuberculosis (Trotter 1985). A year before the Fair Housing Act was passed, Black Milwaukee residents launched an energetic housing campaign that was met with a powerful White countermovement. Open housing marches from the Black Northside of the city to the White Southside were met with mob violence, as the descendants of Polish and German immigrants worked to ensure White enclaves stayed White (Jones 2009). Despite considerable effort, the open housing movement in Milwaukee failed to advance racial integration.
Since that time, Milwaukee has remained one of the most racially-segregated cities in the country. Its urban-suburban layout not only traces traditional racial and economic divides, but it is geographically demarcated by different colored street signs (green in the city; blue in the suburbs). Unlike other large Midwestern cities (e.g., Chicago, Pittsburgh), Milwaukee has not experienced extensive gentrification or rapid in-migration of professional households, typically associated with low-income families decamping to the suburbs. In this way, Milwaukee's metropolitan layout resembles an archetypical city in that poverty and evictions remain concentrated in its urban core, while its surrounding suburbs are characterized by a high concentration of White homeowners with more financial stability (Desmond 2016).
In the Miami metropolitan area, which encompasses Miami, Fort Lauderdale, and West Palm Beach, there was little difference in the distribution of eviction risk between urban and suburban tracts (Figure 3). The median tract-level eviction rate across the three core cities was 1.98 percent between 2012 and 2016. The median eviction rate in the suburbs between these cities—including Boca Raton, Hialeah, Coral Springs, Hollywood, and Delray Beach, as well as the areas to the Southwest of Miami—was just slightly lower (1.74 percent). Eviction rates were higher in Broward County, including Fort Lauderdale and the central section of the metropolitan area, than in Palm Beach County to the North and Miami-Dade County to the South. Notably, there was considerable variation in eviction rates within both urban and suburban neighborhoods in the metropolitan area. Across urban tracts, 11.7 percent had eviction rates above six percent, compared to 7.4 percent of suburban tracts with equally high rates. By contrast, 15.3 percent of urban neighborhoods had eviction rates below one percent, while this was true of 29.4 percent of suburban neighborhoods.
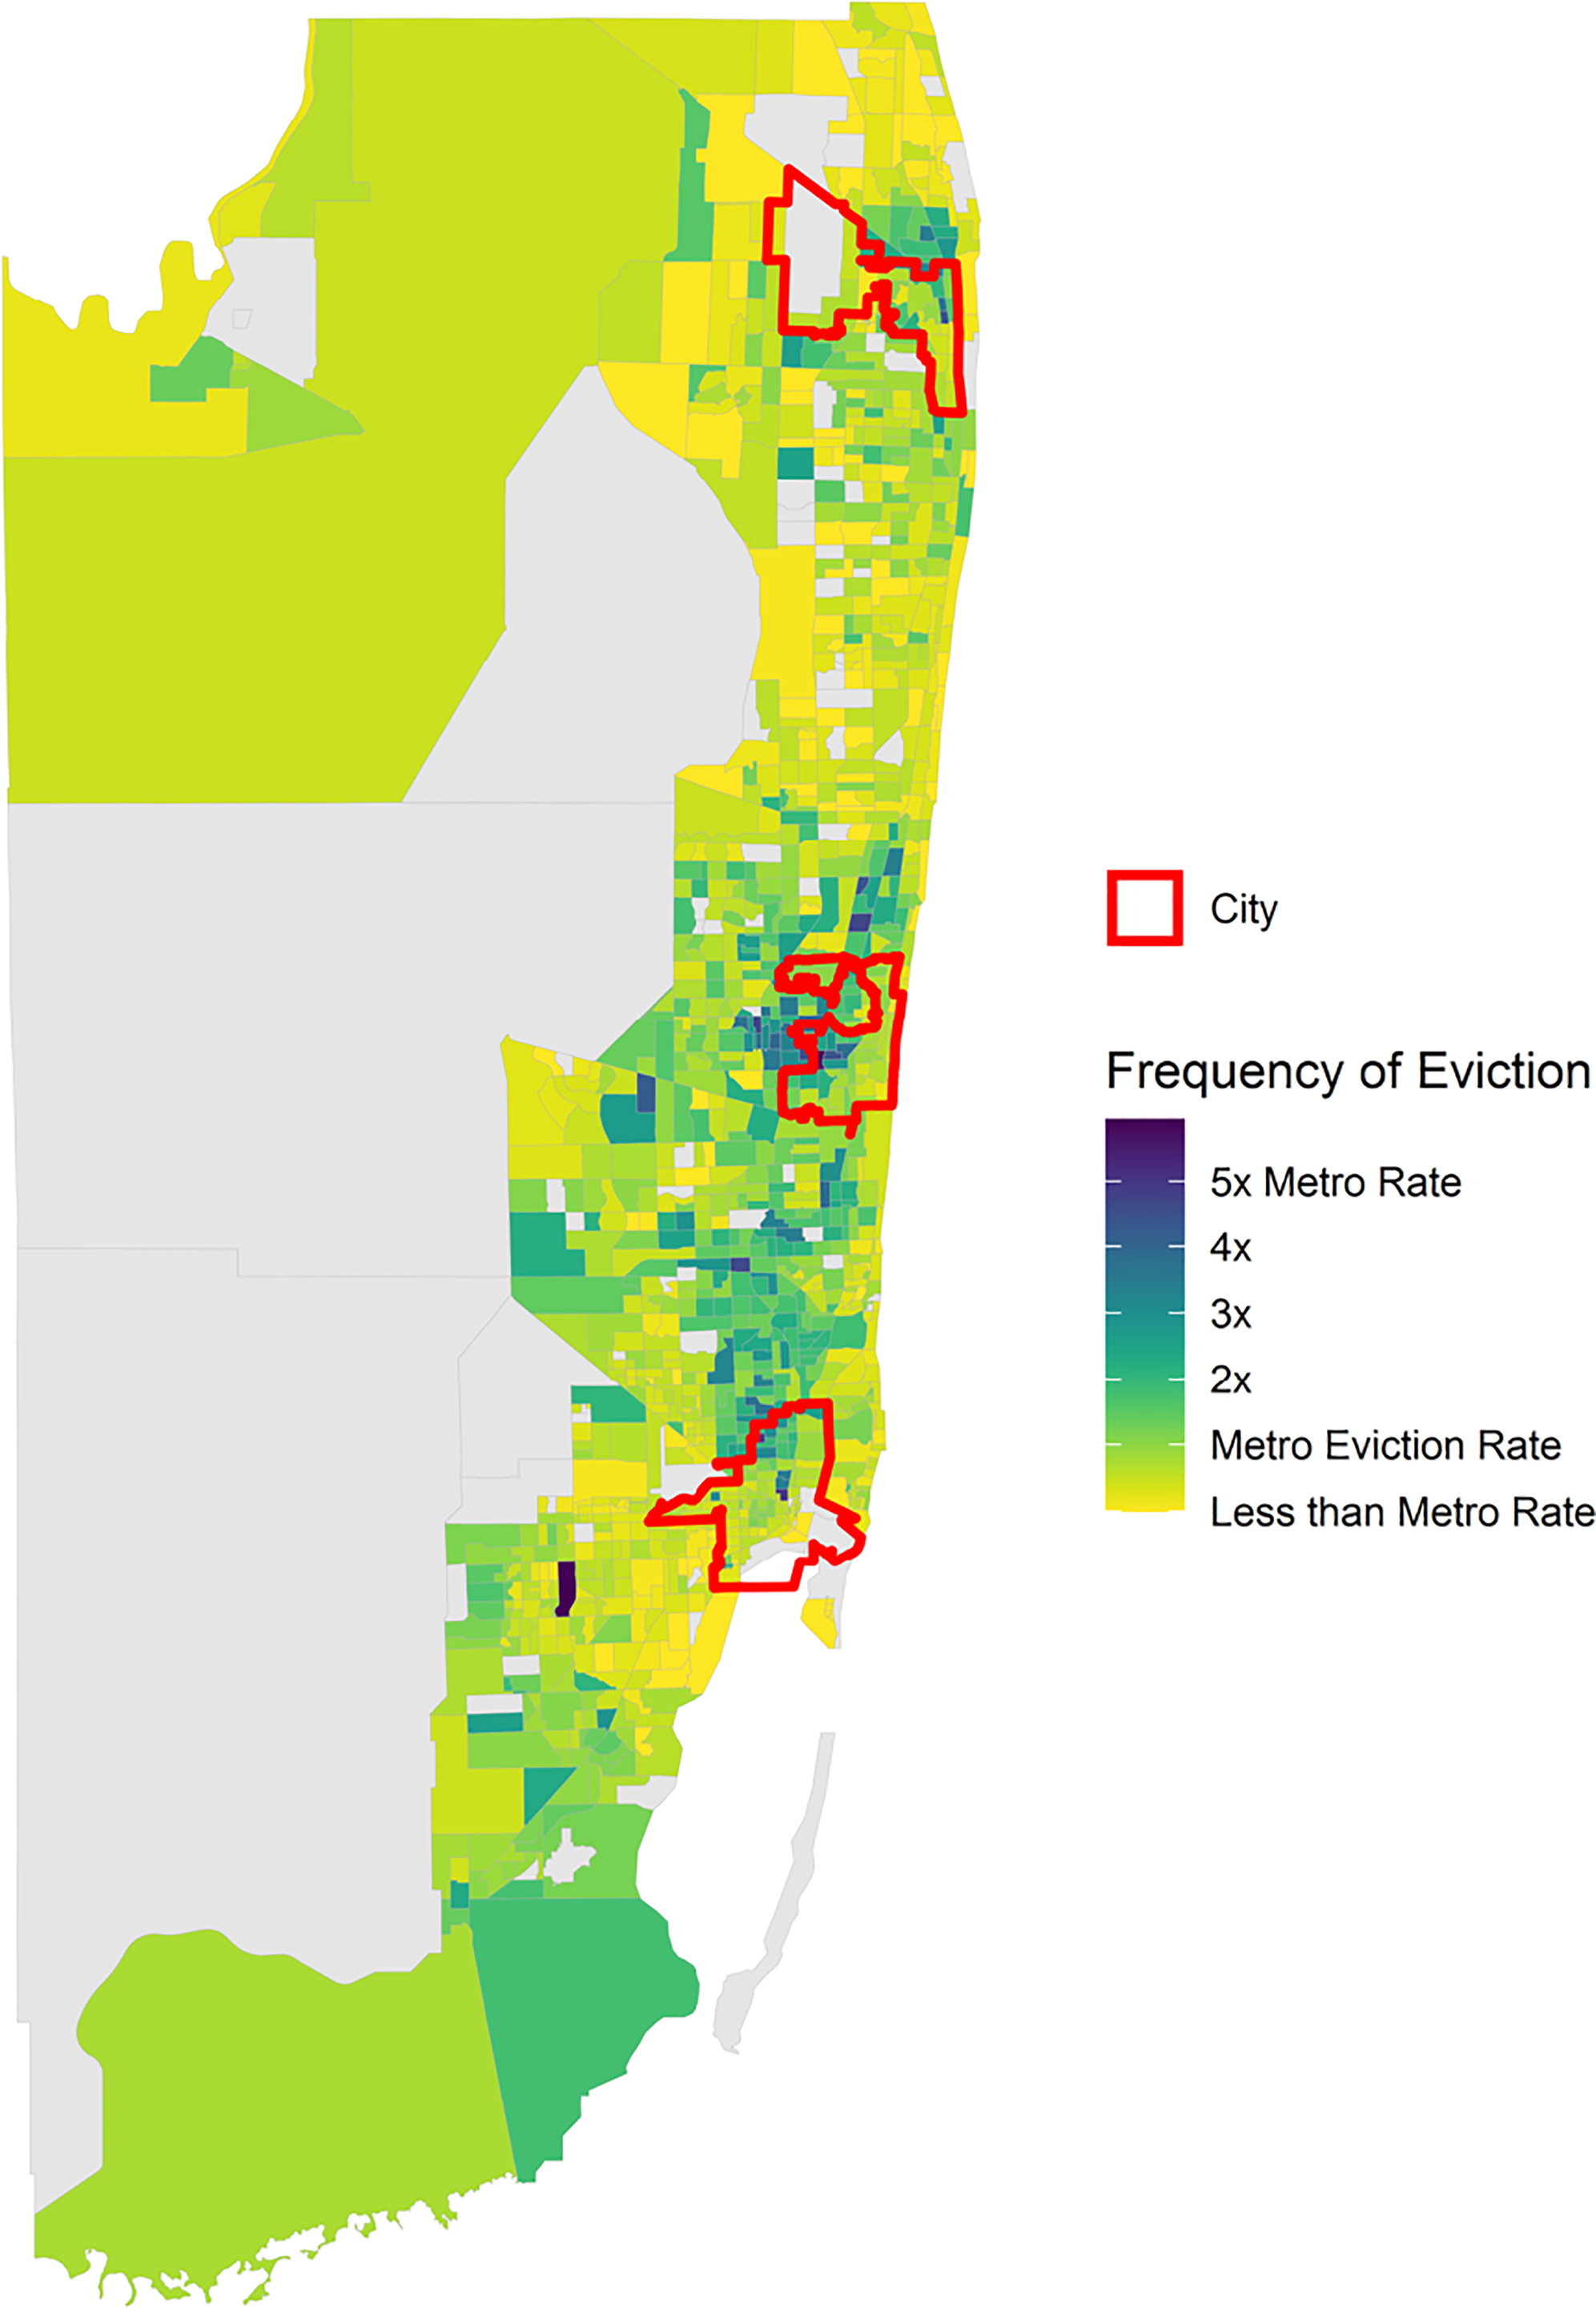
Tract-level eviction rates in the Miami-Fort Lauderdale-West Palm Beach metropolitan area.
Residential dynamics in Miami are profoundly shaped by the history of immigration to the region, especially from Cuba (Portes and Armony 2018). Early Cuban migrants to Miami, many of them from middle-class backgrounds, were able to successfully integrate into social and political life throughout the region. More recent migrants, especially those arriving during and after the Mariel boat lift (1980), were seen as less desirable and often cut off from networks of co-ethnic support. These more recent migrants were more geographically concentrated, both in poor neighborhoods of urban Miami as well as in suburbs, notably Hialeah (Portes and Puhrmann 2015). While these ethnic enclaves may convey meaningful benefits for their residents (Viruell-Fuentes et al. 2013), it is unclear whether they would result in greater housing stability.
Greater Miami is a case-study in the suburbanization of poverty over the last 30 years. Since 1990, most population growth in the metropolitan area—and nearly all increase in poverty—has been concentrated in the suburbs. Between 1990 and 2014, Miami added nearly 415,000 poor people to its suburban population, the third-highest net gain of any metropolitan area in the country. By contrast, it added only 22,000 urban poor residents (Allard 2017b). Compared to Milwaukee, where poverty was much more clearly concentrated in urban spaces, the urban-suburban disparity in poverty rates was smaller in greater Miami (average rates of 23.7 percent in urban tracts vs. 15.8 percent in the suburbs).
Over the same period that the suburbs of Miami were growing more impoverished, job growth in the metropolitan area was modest and wages relatively low (Allard 2017a, 55). Rents increased dramatically in the metropolitan area since the 1990s, while the supply of affordable housing has languished (Collinson 2011). A growing share of poor people moved to the suburbs, but they did not necessarily find less expensive housing. In our sample, median rents were notably higher on average in suburban than urban tracts in the metropolitan area ($1,388 vs. $1,140).
The result, as seen in Figure 3, was a patchwork of eviction risk across the suburbs. We see hotspots of eviction in inner-ring suburbs just North of West Palm Beach (Palm Beach Gardens), just East of Fort Lauderdale (Plantation), and to the Northwest of Miami (Hialeah up to Miami Gardens). These are also the suburbs with the highest poverty rates in the metropolitan area. 18 By contrast, evictions appeared to be relatively rare in the Pompano Beach area between West Palm Beach and Fort Lauderdale and in the suburbs to the Southwest of Miami (Kendall). Miami serves to highlight the heterogeneity of urban and, particularly, suburban spaces: to speak of a unified “suburban” experience in this case would be misleading.
Across the Seattle-Tacoma-Bellevue metropolitan area, the eviction rate between 2012 and 2016 was quite low (0.86 percent). Those rates were, on average, notably higher in suburban than urban neighborhoods: 1.1 percent across the suburbs versus 0.48 percent in the urban spaces (see Figure 4). Indeed, 40 suburban tracts in the metropolitan area had eviction rates above two percent, compared to just six urban tracts.
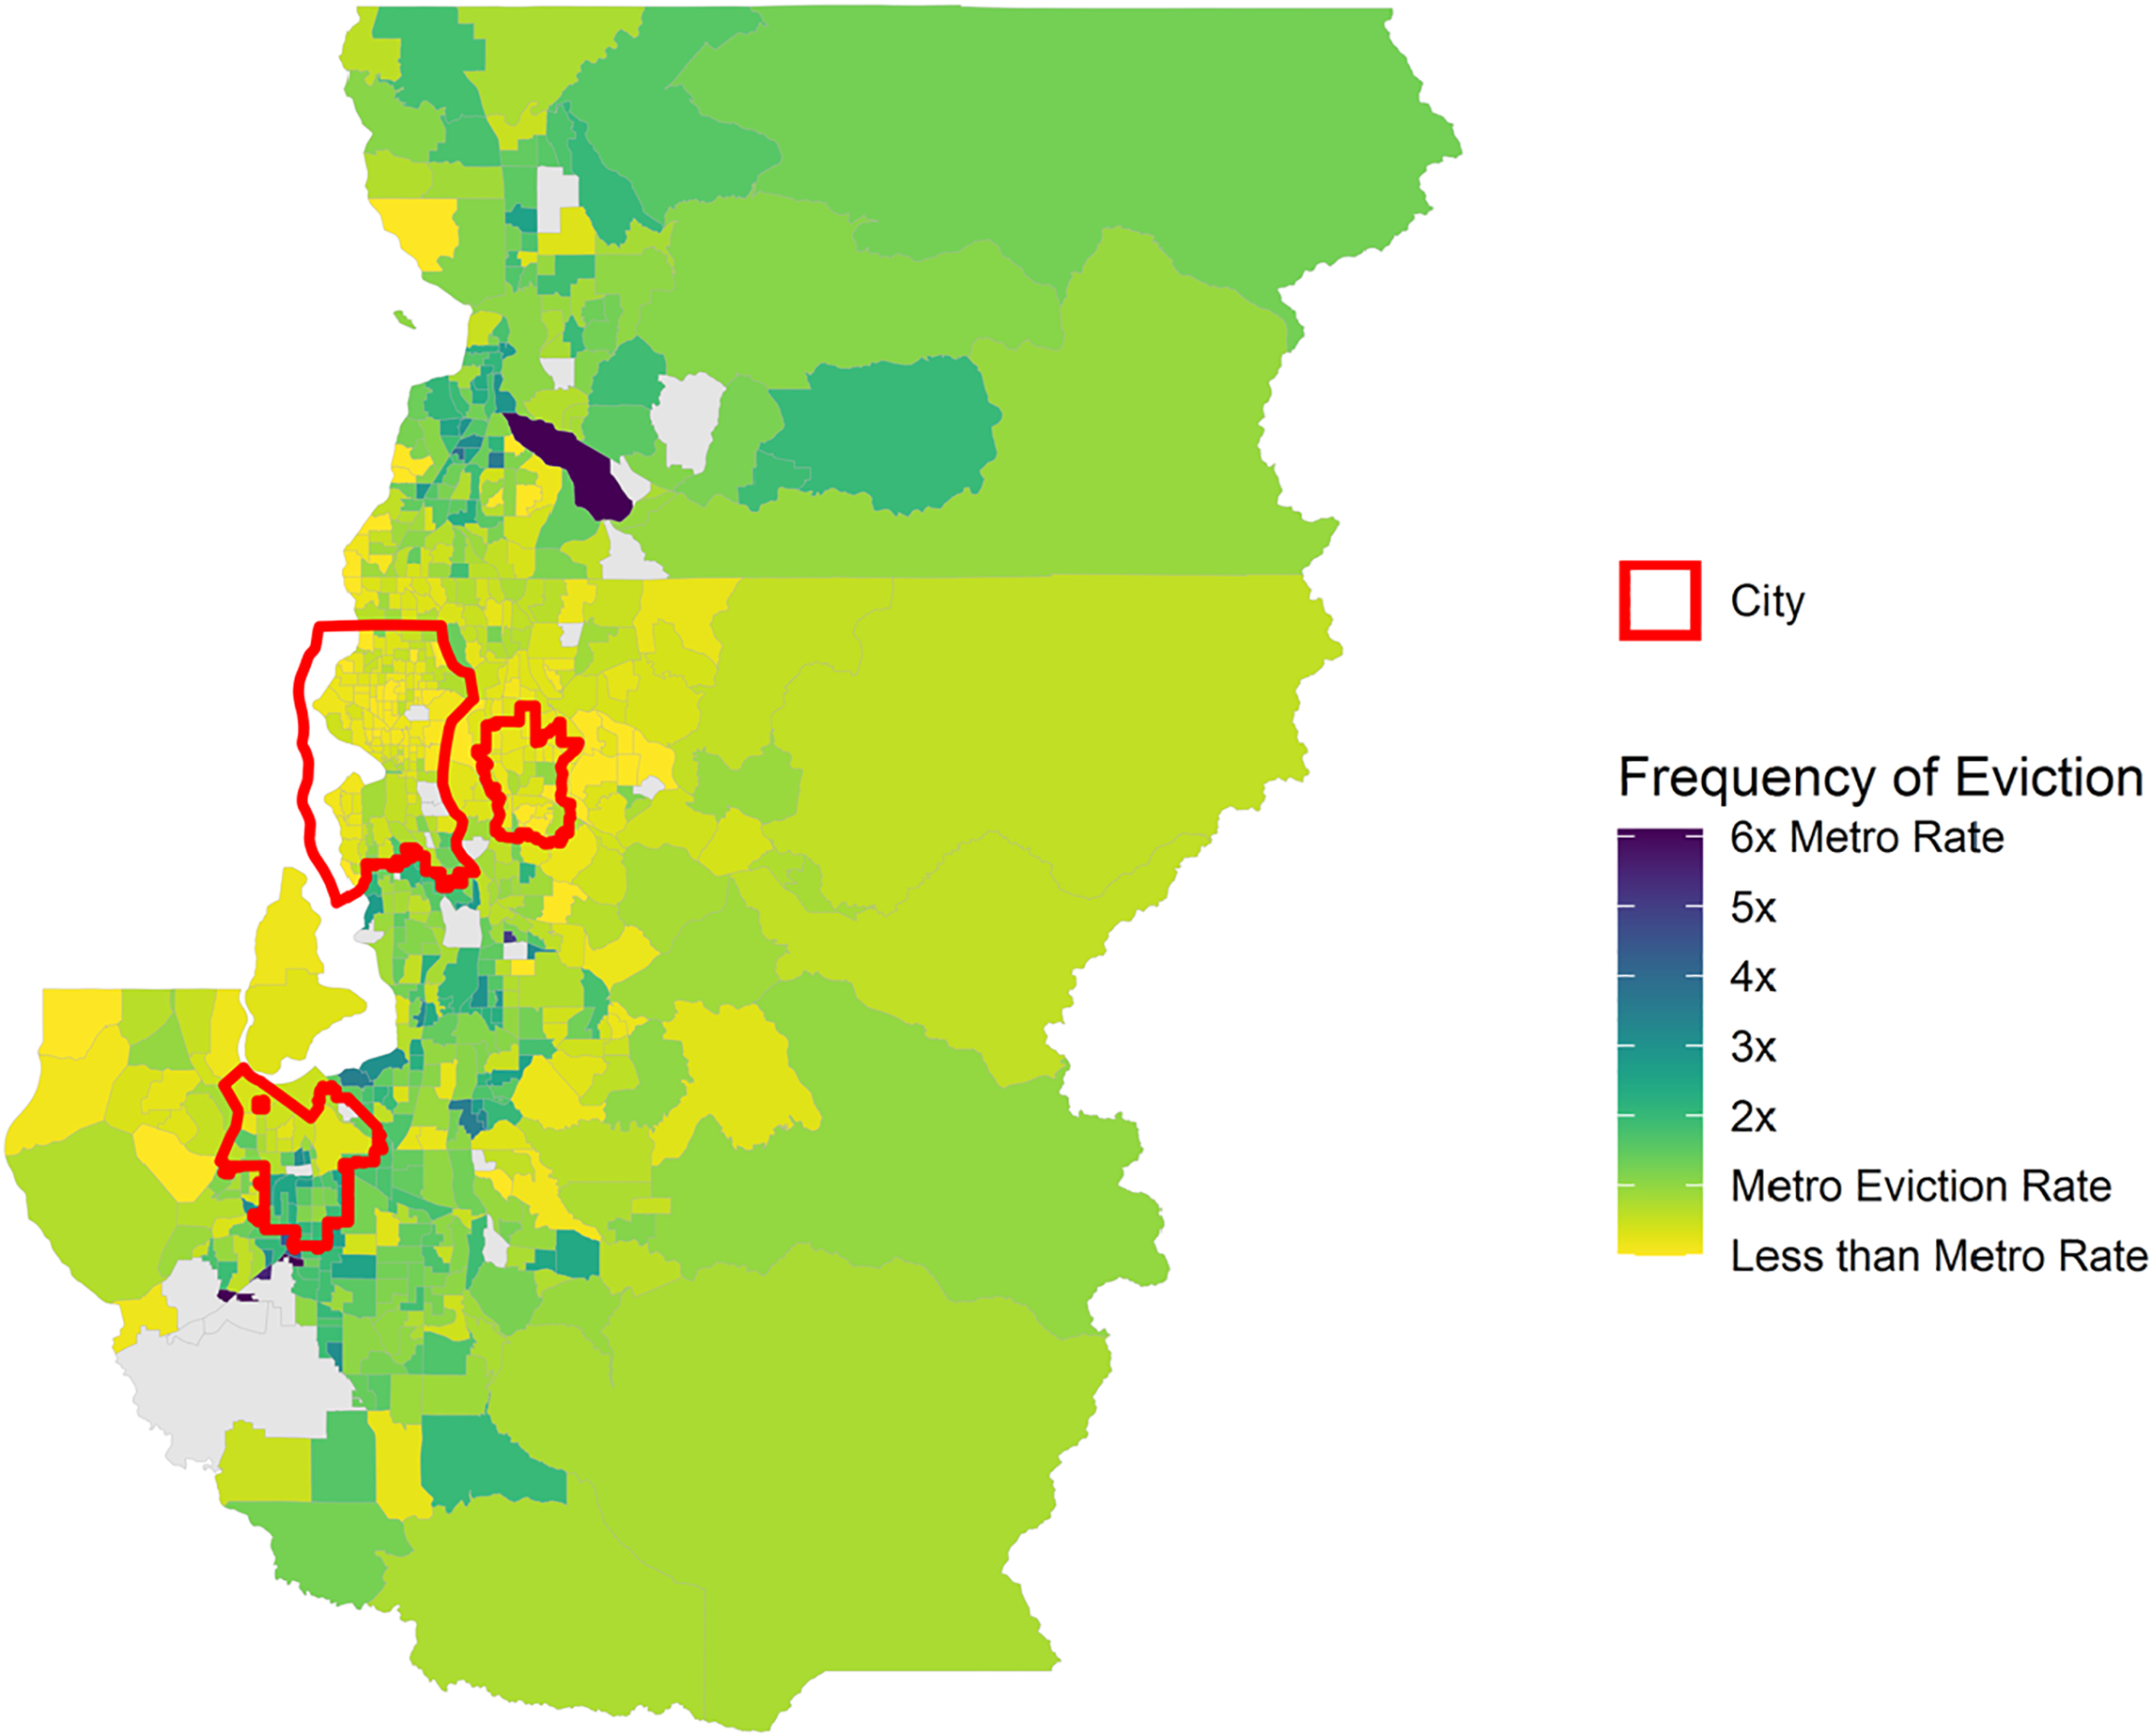
Tract-level eviction rates in the Seattle-Tacoma-Bellevue metropolitan area.
The greater concentration of eviction rates in the suburbs of Seattle stems from the economic renaissance and gentrification of greater Seattle from the 1990s onward. As the tech industry boomed, a growing number of high-income individuals flocked to the urban neighborhoods of Seattle and Bellevue, particularly low-cost Black neighborhoods (Hwang 2020). Dramatic increase in housing prices led to equity gains for existing Black and Latino residents, but the declining stock of affordable housing within city borders also hastened their exit to other parts of the metropolitan area (Glick 2008). Unlike in the Milwaukee or Miami metropolitan areas, rents in greater Seattle were higher in the urban than the suburban tracts in our sample.
As lower-income households were increasingly pushed to the suburbs, so was the risk of eviction (Thomas et al. 2019a). As Thomas and colleagues have documented in longitudinal perspective, current eviction risk in the suburbs South of Seattle—Renton, Kent, Federal Way, and Auburn—tracks the dispersion of non-White Washingtonians beyond city borders. These suburban areas were composed of almost entirely White residents in 1980, but had grown far more diverse by 2010 (Thomas 2017; Thomas et al. 2019b).
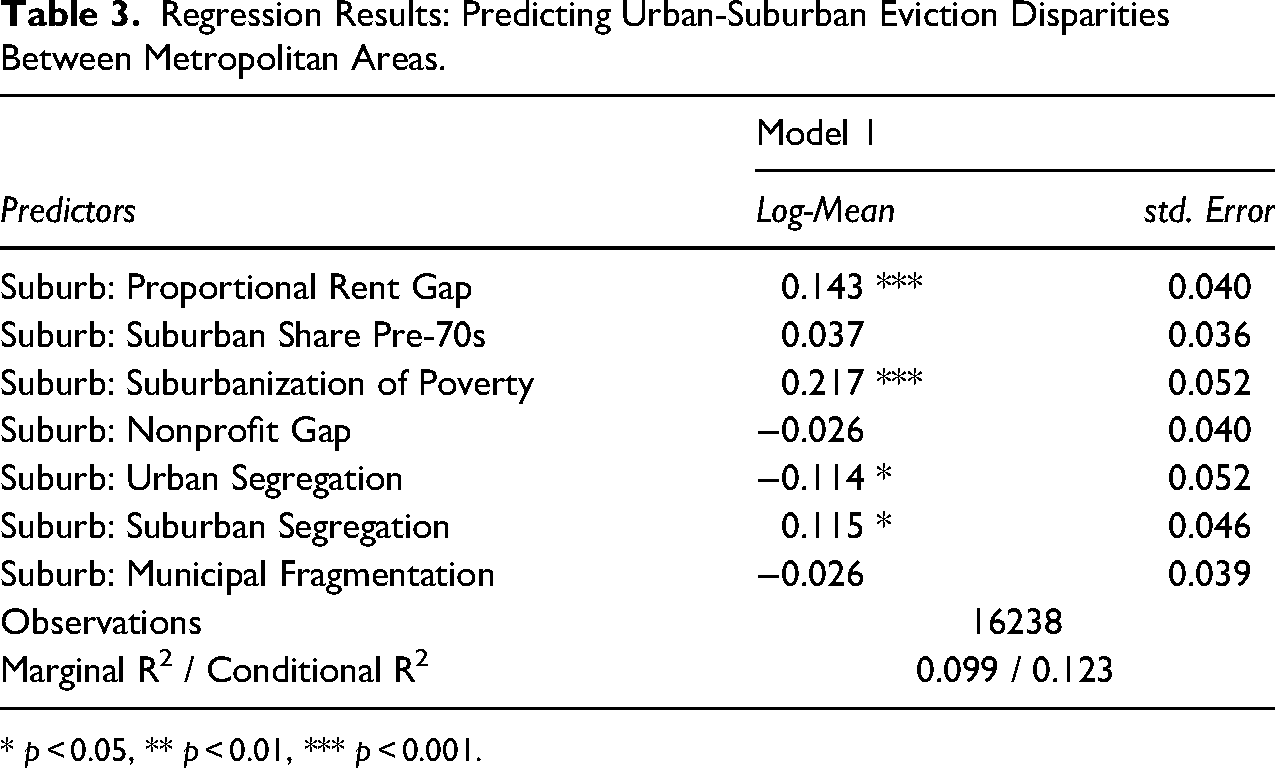
Returning to the regression framework, can we more systematically account for variations across the metropolitan areas in our sample in urban-suburban disparities in eviction rates? To address this question, in Table 3 we present results from a fourth specification of our regression model. We fit a model equivalent to Model 2 from Table 2 but added predictors for metro-level variation in the suburban effect (the vector
Regression Results: Predicting Urban-Suburban Eviction Disparities Between Metropolitan Areas.
* p < 0.05, ** p < 0.01, *** p < 0.001.
Suburban eviction rates were higher than urban rates in metropolitan areas where urban rents exceeded suburban rents and those that experienced greater shifts toward suburban poverty. In our sample, suburban rents were typically higher than urban rents. In those metropolitan areas in which this trend was reversed—where urban rents were higher than suburban rents, indicative of housing markets in which poor people might be more likely to find housing in the periphery—suburban eviction rates were predicted to be higher. A metropolitan area one standard deviation above the mean would have more expensive rents in urban neighborhoods than in suburbs (5.5 percent more expensive). Suburban neighborhoods in such a metropolitan area were expected to have eviction rates 15.4 percent higher than their urban counterparts (
Suburban eviction rates were also higher relative to urban rates in metropolitan areas that experienced a greater suburbanization of poverty. Metropolitan areas that saw an increase in suburban share of poverty one standard deviation above the mean—a 7.8 percentage point increase—were predicted to have significantly higher suburban than urban eviction rates. Suburban eviction rates were 12.2 percent greater relative to urban eviction rates in metropolitan areas with more segregated suburbs but slightly lower than urban eviction rates (10.8 percent) in metros with more segregated cities (
Discussion
Nearly all research on the prevalence and consequence of eviction has been based on data drawn from cities (Desmond and Shollenberger 2015; Lundberg and Donnelly 2019). As economic and demographic changes have blurred the line between urban and suburban, the urban bias in displacement research has become untenable. This study moves eviction and displacement research beyond the urban center.
We evaluated how eviction rates differed in suburbs, relative to cities, and whether the neighborhood-level correlates of eviction differed in the suburbs. While suburban eviction rates are lower than those found in cities, this was almost entirely a function of observable socio-demographic and housing market differences. The previous literature on the suburbanization of poverty has stressed a range of factors that make life more difficult for poor individuals and families in the suburbs relative to those in cities. Our results suggest that, in addition, these spaces—as they come to more closely resemble their urban counterparts—may provide little to no relief from the threat of residential displacement. Displacement is not exclusively an urban process. The aging and filtering of housing stock in suburbs may yield a new source of affordable housing, but that housing is not necessarily stable. Low-income renters in cities and suburbs alike face eviction.
We found that several key relationships between neighborhood characteristics and eviction rates operated somewhat differently in suburbs than in urban neighborhoods. While neighborhood poverty was positively associated with eviction rates in both urban and suburban tracts, the relationship is significantly weaker in the latter. Likewise, we found that the relationship between eviction rates and neighborhood median rents were attenuated in the suburbs. Taken jointly, these findings suggest that eviction is somewhat less predictable in the suburbs, that knowing the characteristics of neighborhoods will not let you as easily distinguish between the low- and high-eviction spaces. By contrast, associations between the racial composition of neighborhoods and their eviction rates were functionally identical in suburbs and cities. After controlling for poverty, rents, racial composition, and other neighborhood socio-demographic characteristics, we found no association between the age of housing stock and eviction rates in either urban or suburban areas.
Suburban eviction rates were not always lower than urban eviction rates. Indeed, for one in six metropolitan areas in our sample—including large cities such as Atlanta, Boston, and Philadelphia—the reverse was true. Case studies of the Milwaukee, Miami, and Seattle metropolitan areas offered a reminder that the general patterns observed across the 71 metropolitan areas in our sample play out in distinct ways in each one. Milwaukee saw a clear concentration of evictions in the Northside of the city and almost none in the suburbs. Eviction risk was distributed in a patchwork pattern between and within the urban and suburban neighborhoods of greater Miami. And in Seattle, urban economic growth and gentrification had pushed evictions to the suburbs.
We highlight this heterogeneity as a reminder that no given metropolitan area or neighborhood will behave exactly as predicted. Researchers and policymakers must avoid relying solely on general trends and incorporate the particularities of local cases into their work. Understanding that the urban-suburban disparity looks fundamentally different in Seattle than in Milwaukee is critical to developing appropriate responses. Results also highlight the need for policy coordination and metropolitan-wide eviction-prevention solutions (Allard 2017a). While the majority of eviction judgments we analyzed originated in urban neighborhoods, we nonetheless observed nearly half a million suburban eviction judgments in five years across just these 71 metropolitan areas. Reforms or ordinances aimed at preventing eviction that stop at a city's border will offer no help to suburban renters. If socio-demographic shifts result in increasingly fragmented and segregated suburban poverty, it is particularly important to understand the geographic concentration of eviction in small pockets of the suburban periphery (Rutan and Desmond 2021; Shelton 2018).
Findings from this study suggest a range of future research. In particular, results from Table 3 bear further investigation. We found that suburbs were predicted to have significantly higher eviction rates (relative to urban neighborhoods) in those metropolitan areas that had experienced most dramatic suburbanization of poverty between 2000 and 2016. This finding serves as a reminder that the suburbanization of poverty is fundamentally a process. How have eviction rates changed in urban and suburban spaces over time? How have changes in the distributions of low-income populations affected these trajectories?
It may be equally productive to consider how differences in ownership of rental housing affects observed urban-suburban disparities in eviction. The composition of these rental markets—and particularly suburban rental housing markets—has changed in many parts of the country over the last decade. In the wake of the 2008 financial crisis, foreclosed single-family suburban homes were a major target for private equity firms seeking to expand rental real estate holdings (Dezember and Kusisto 2017; Fields 2014; Immergluck and Law 2014a, 2014b). These firms now control large segments of the suburban rental markets, especially throughout the Sunbelt (Immergluck 2018), and have adopted a series of cost-savings strategies and scale efficiencies that allow them to operate in a fashion similar to larger urban landlords (Semuels 2019). Previous single-city studies have documented how owner characteristics affect eviction risk (Gomory 2021; Immergluck et al. 2019; Raymond et al. 2021; Seymour and Akers 2021a, 2021b). Future research should examine how these patterns affect suburban housing and how that results in more or less concentration of evictions in these spaces (Rutan and Desmond 2021). It is also critical to recognize that neither urban nor suburban rental housing exists in a unitary market. Renters’ options are constrained and property managers practices vary across segmented markets in ways that deserve further analysis in both urban and suburban spaces (Teresa and Howell 2021).
It is also important to understand how the consequences of eviction differ in cities and suburbs on a human scale. Evictions are not only moments of acute housing instability but are linked to a wide array of negative consequences that linger long after individuals and families are displaced. Evictions are associated with heightened risk of subsequent unemployment, increased stress and depression, and moves into poorer, more-dangerous neighborhoods (Desmond and Gershenson 2016; Hatch and Yun 2021). The effects of suburban evictions may be particularly acute. Local safety nets are weaker in suburban areas and nonprofits are fewer and further between (Allard 2017a; Mattiuzzi and Weir 2020). To take one example, homeless shelters are far more numerous and accessible in cities than in suburbs, which begs the question: where do the suburban evicted go? The more limited suburban support system may exacerbate the known negative effects of eviction, but understanding how, where, and for whom deserves greater attention.
Supplemental Material
sj-docx-1-uar-10.1177_10780874221085676 - Supplemental material for Beyond Urban Displacement: Suburban Poverty and Eviction
Supplemental material, sj-docx-1-uar-10.1177_10780874221085676 for Beyond Urban Displacement: Suburban Poverty and Eviction by Peter Hepburn, Devin Q. Rutan and Matthew Desmond in Urban Affairs Review
Footnotes
Acknowledgments
We would like to thank Scott Allard for his advice and guidance as we started work on this project. This research was conducted under the aegis of The Eviction Lab, and we thank members of the Lab for their feedback on early iterations of the article. The Eviction Lab is funded by the Gates, JPB and Russell Sage Foundations as well as the Chan Zuckerberg Initiative and Pew Charitable Trusts.
Supplemental Material
Supplemental material for this article is available online.
Notes
Author Biographies
References
Supplementary Material
Please find the following supplemental material available below.
For Open Access articles published under a Creative Commons License, all supplemental material carries the same license as the article it is associated with.
For non-Open Access articles published, all supplemental material carries a non-exclusive license, and permission requests for re-use of supplemental material or any part of supplemental material shall be sent directly to the copyright owner as specified in the copyright notice associated with the article.