
Abstract
State-funded child maltreatment prevention aims to reduce risk, but whether reach aligns with community need is unclear. This county-level cross-sectional study of all 254 Texas counties examined whether Fiscal Year 2023 Prevention and Early Intervention (PEI) service distribution tracked structural risk and substantiated maltreatment. Two outcomes were modeled with negative binomial regression and a log child-population offset: annual family service recipients (home visiting and family support) and average monthly youth service recipients (community-based programs). Structural risk was operationalized through socioeconomic, housing, and violent crime indicators. In fully adjusted models, family service rates were approximately ten times higher in urban than rural counties (incidence rate ratio [IRR] = 10.52, 95% CI [4.74, 23.33]) but unrelated to substantiated maltreatment. This urban–rural gap was absent for youth services, which tracked substantiated maltreatment (IRR = 1.44, 95% CI [1.07, 1.93]). Family prevention reach in Texas tracks geography rather than need, while youth prevention tracks observed maltreatment burden — patterns implicating distinct allocation pathologies in state-administered prevention.
Keywords
Introduction
The estimated lifetime costs of one year’s confirmed child abuse and neglect cases in Texas exceed $55.9 billion (TexProtects, 2021), yet Texas allocates only 14% of its child welfare budget to prevention and 49% to out-of-home placements — a distribution somewhat exceeding the national tilt toward placement, with 43 states averaging 15% on prevention and 44% on placements in state fiscal year 2022 (Rosinsky et al., 2025). The Texas Department of Family and Protective Services (DFPS) has expanded its Prevention and Early Intervention (PEI) portfolio in response (Texas Department of Family and Protective Services, 2025), but whether these services reach counties facing the greatest structural disadvantage and maltreatment burden, or are more common where provider capacity is strongest, remains unclear.
Child maltreatment remains a major public health crisis in Texas, with harms concentrated among families facing persistent economic hardship and geographic isolation (TexProtects, 2021). National and international reviews show a strong, consistent association between poverty and child abuse and neglect, especially neglect (Bywaters et al., 2016; Cusick et al., 2024). Whether DFPS’s upstream preventive strategy can succeed depends on how well PEI services reach communities with the greatest structural risk. The present study uses the lens of the “inverse care law,” which proposes that the availability of good care tends to vary inversely with the need for it (Hart, 1971); applied to child welfare, the concern is that prevention services may be most available in counties with the greatest organizational capacity, not the greatest underlying risk of maltreatment.
Social Disorganization and Structural Risk
Social disorganization theory holds that child maltreatment concentrates in communities with high structural disadvantage and low collective efficacy — limited capacity of neighbors and institutions to support families and intervene when children are at risk (Sampson et al., 1997). Concentrated poverty, unemployment, and housing instability weaken informal social controls, increase chronic stress, and elevate the risk of both neglect and abuse (Maguire-Jack, 2014; Sampson et al., 1997). Chronic neighborhood adversity can both deplete caregivers’ coping capacities and dysregulate children’s developing stress response systems, a pathway captured by the toxic stress framework (Shonkoff & Garner, 2012; Shonkoff et al., 2021). Family structure compounds this risk: single-parent and female-headed households are more likely to experience poverty, limited social support, and high caregiving demands (Cusick et al., 2024).
Beyond socioeconomic indicators, housing and crime conditions shape how disadvantage translates into family stress. Violent crime is associated with higher rates of child maltreatment, particularly physical and sexual abuse, even after accounting for neighborhood poverty (Morris et al., 2019); it functions both as a direct risk factor through exposure to community violence and as a proxy for weak institutional support (Sampson et al., 1997). Housing market stress operates through related mechanisms: high rent burden leaves fewer resources for food, utilities, and childcare (Collins et al., 2024; Cusick et al., 2024), while high vacancy rates signal disinvestment that reduces informal supervision and weakens social networks (Sampson et al., 1997). Together, these indicators form an interlocking web of structural disadvantage that shapes where maltreatment risk is concentrated (Bywaters et al., 2016; Maguire-Jack, 2014).
Rural–Urban Divide: Vulnerability Versus Capacity
Geography modifies how structural risk is experienced. Although social disorganization theory emerged from urban research (Sampson et al., 1997), newer work highlights a distinct rural risk profile: Maguire-Jack and Kim (2021) found that rural children in the United States are reported for maltreatment at higher rates than urban children but have less access to services, describing rural communities as “service deserts” where transportation barriers, workforce shortages, and limited parenting and mental health programs compound family stress. Federal policy analyses similarly identify rural communities as facing higher burdens of trauma amid fewer formal supports (National Advisory Committee on Rural Health and Human Services [NACRHHS], 2018), and county-level studies show that poverty may be a weaker predictor of maltreatment in rural counties, where isolation, stigma, and strained local systems shape both risk and reporting patterns (Smith et al., 2021).
These findings raise a concern for PEI: if programs are located primarily where provider organizations already exist, prevention services may cluster in urban counties with higher administrative capacity and more established nonprofit networks, even if structural risk per child is as high or higher in rural areas. Such a pattern would exemplify the inverse care law.
Race, Ethnicity, and Differential Access to Prevention
Child welfare systems in the United States have long exhibited racial and ethnic inequities. In unadjusted analyses, Black children appear at higher rates of investigation, substantiation, and placement than White children (Drake et al., 2011; Kim & Drake, 2018). However, a robust body of evidence indicates that these observed patterns largely reflect differential exposure to structural risk rather than race per se: once poverty, neighborhood disadvantage, and family-level risk factors are accounted for, racial disparities in child welfare system involvement are substantially attenuated or eliminated (Drake et al., 2011; Font et al., 2012; Kim & Drake, 2018; Putnam-Hornstein et al., 2013). Even policies designed to mitigate economic stress can have uneven benefits across racial and ethnic groups: Puls et al. (2024) found that more generous Supplemental Nutrition Assistance Program policies reduced Child Protective Services (CPS) investigations overall but with stronger protective effects for White than for Black or Hispanic children.
Descriptive Statistics for Texas Counties, 2023 (N = 254)
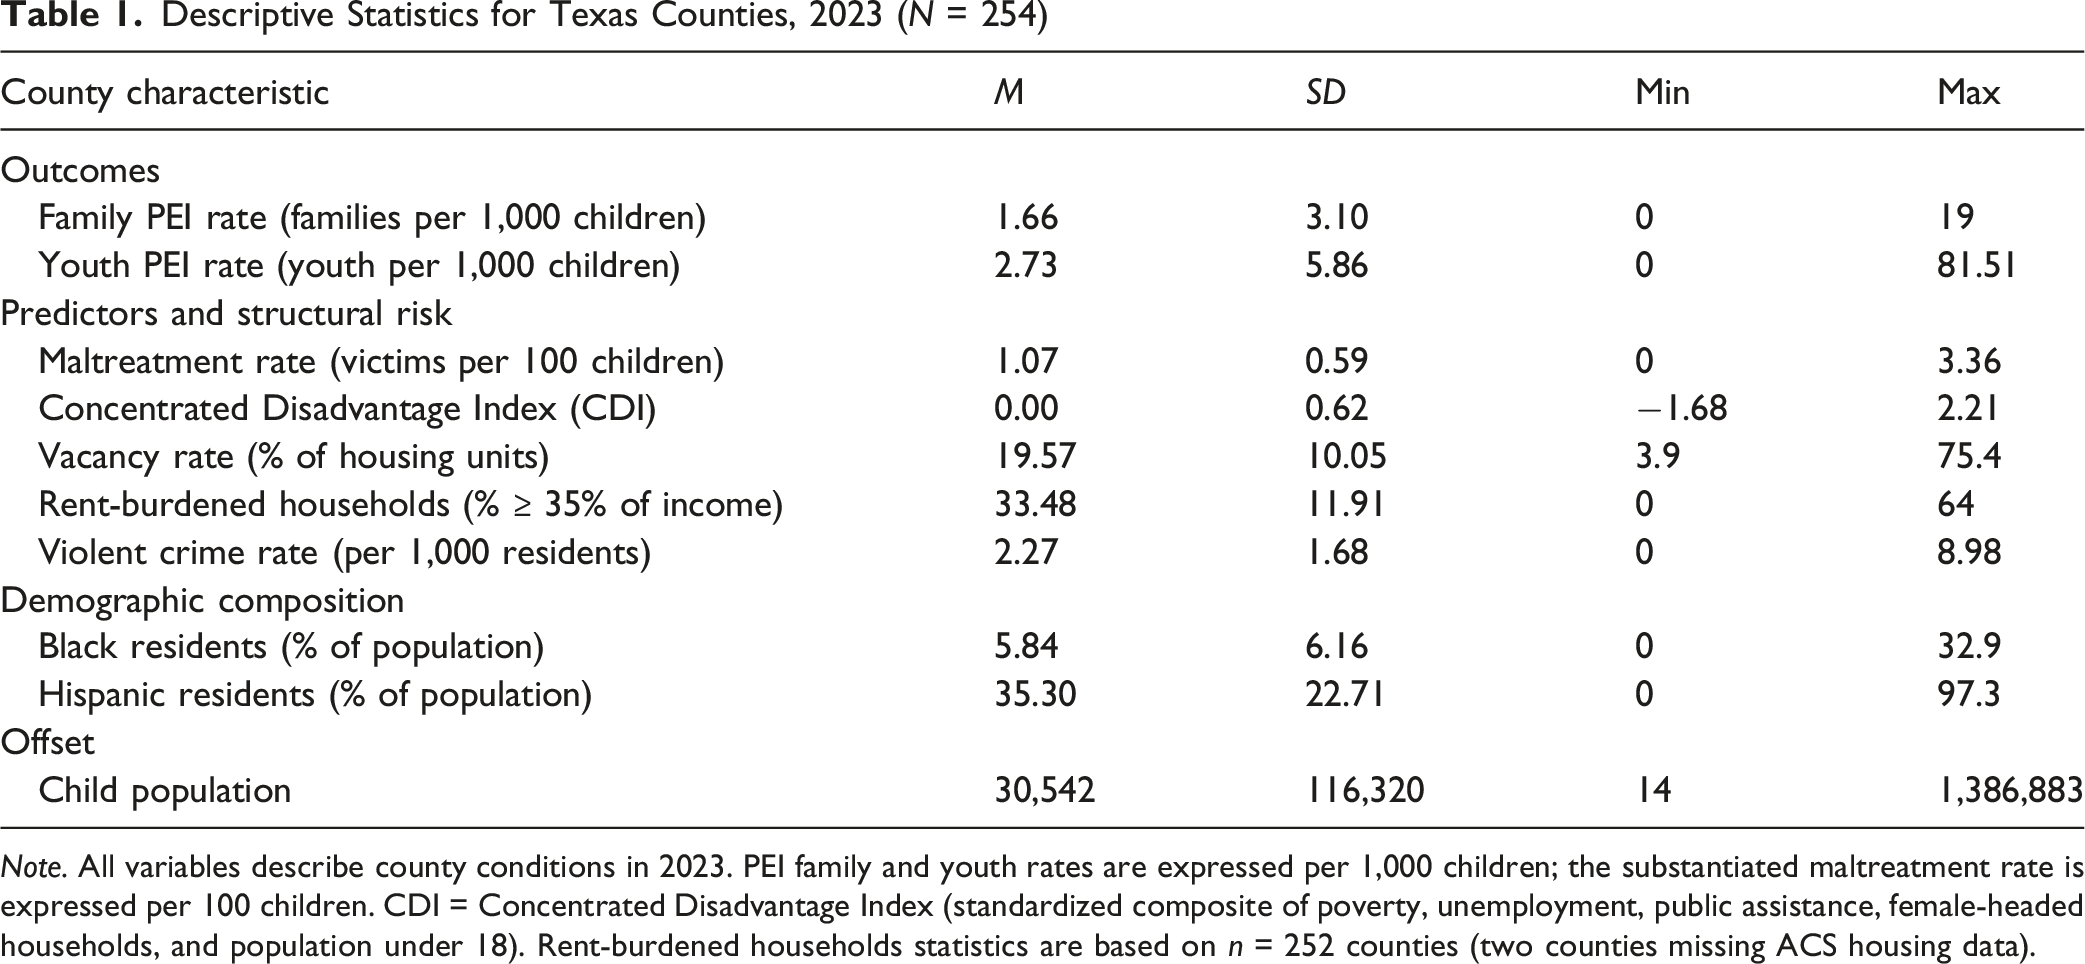
Note. All variables describe county conditions in 2023. PEI family and youth rates are expressed per 1,000 children; the substantiated maltreatment rate is expressed per 100 children. CDI = Concentrated Disadvantage Index (standardized composite of poverty, unemployment, public assistance, female-headed households, and population under 18). Rent-burdened households statistics are based on n = 252 counties (two counties missing ACS housing data).
The Present Study
The present analysis instead treats PEI service intensity as the outcome and asks: How are Texas DFPS PEI family and youth services distributed across counties, and do these patterns align with observed maltreatment burden, structural disadvantage, and geographic context? Although prior literature has established that structural disadvantage and rurality predict child maltreatment (Bywaters et al., 2016; Maguire-Jack & Kim, 2021), modeling maltreatment as the outcome does little to reveal whether prevention services are deployed where they could do the most good. Retrospective Texas analyses have raised but not answered this question (Texas Institute for Child & Family Wellbeing, 2017). The hypotheses below are tested in a hierarchical sequence beginning with the simplest test of policy alignment and progressively introducing structural, geographic, and demographic predictors. • • • •
Method
This study uses a cross-sectional, county-level analysis of all 254 Texas counties to examine the distribution of state-funded child maltreatment prevention services across the state. The analytic dataset was constructed by linking administrative data from DFPS with sociodemographic and crime data from federal and state agencies for FY 2023.
Prevention Service Setting
The DFPS PEI Division administers a portfolio of voluntary, community-based programs intended to reduce child maltreatment risk before family crisis necessitates CPS involvement (Texas Department of Family and Protective Services, 2025). Participation is non-coercive: families are not referred to PEI through substantiated reports. The PEI Division transferred to the Texas Health and Human Services Commission effective September 1, 2024 (Texas Health and Human Services Commission, 2024); the present analysis reflects FY 2023 data and program structure prior to this transfer.
PEI’s two principal service streams correspond to the two outcomes modeled in this study and target distinct populations, developmental stages, and risk pathways (Jones Harden et al., 2020). Family-focused PEI programs are evidence-based home visiting and parent education models delivered to caregivers of young children, typically ages 0–5, and emphasize primary prevention of maltreatment through enhanced parenting capacity, infant health, and family functioning (Jones Harden et al., 2020). The largest evidence-based models implemented across the DFPS family-focused PEI programs (e.g., HOPES, TFTS, HIP) during FY 2023 included Nurse-Family Partnership (Olds, 2006), Healthy Families America, and SafeCare; additional contracted programs and models are listed in the FY 2023 DFPS Data Book (Texas Department of Family and Protective Services, 2024). These models are open to broad populations of caregivers without requiring a CPS report or substantiated maltreatment finding, and are typically recruited through prenatal, pediatric, and community channels (Jones Harden et al., 2020). Youth-focused PEI programs target school-age children and adolescents and are best characterized as secondary prevention, with eligibility tied to observable risk indicators rather than population-wide outreach. Community Youth Development (CYD) is a delinquency-prevention program contracted into ZIP codes with elevated juvenile crime rates and provides mentoring, youth employment, leadership development, and recreational activities. Family and Youth Success (FAYS) provides short-term crisis-intervention counseling, respite care, and family counseling to families experiencing family conflict, truancy or delinquency, or runaway behavior. The Statewide Youth Services Network (SYSN) provides evidence-based juvenile delinquency prevention services for youth ages 10–17 within each DFPS region (Texas Department of Family and Protective Services, 2024). The term “youth” is retained throughout to align with DFPS administrative nomenclature; in practice, this stream serves primarily school-age children and adolescents and does not overlap with the infant and toddler populations served by family-focused home visiting.
The two service streams were modeled as separate outcomes for both conceptual and empirical reasons: family and youth services intervene at different developmental stages through distinct theoretical pathways, and the two county-level service rates were only modestly correlated (r = .13, p = .032), indicating that counties high in one were not consistently high in the other.
Data Sources
The analytic dataset was constructed by linking county-level data from five sources for FY2023. Service utilization counts for the two prevention outcomes — annual families served (PEI 2.1 Families Served During Fiscal Year by Program) and average monthly youth served (PEI 1.2 Average Monthly Youth Served by County) — the substantiated maltreatment rate, DFPS administrative region classifications, and the child population offset were drawn from the FY 2023 DFPS Data Book (Texas Department of Family and Protective Services, 2024). Sociodemographic indicators—including the five components of the Concentrated Disadvantage Index, housing vacancy and rent-burden rates, and county racial and ethnic composition—came from the 2019–2023 American Community Survey (ACS) 5-Year Estimates (U.S. Census Bureau, 2024); 5-year estimates were used in lieu of 1-year estimates because the latter are not published for counties below a population threshold, making 5-year estimates the only option for the majority of Texas counties in this analysis. County rurality was classified using the 2023 National Center for Health Statistics (NCHS) Urban–Rural Classification Scheme (NCHS, 2024), and the violent crime rate was constructed from the Texas Department of Public Safety’s Uniform Crime Reporting system for calendar year 2023 (Texas Department of Public Safety, 2025). Operational definitions, years, and source data series for all measures are provided in Supplemental Table S1.
Measures
Dependent Variables
Two dependent variables, hereafter Family Prevention Reach and Youth Prevention Reach, measured prevention service intensity relative to county child population. For both outcomes, the natural log of the county child population served as an offset, allowing model coefficients to be interpreted as effects on per-child service rates (Hilbe, 2011). The youth outcome, reported in source data as a monthly average, was rounded to the nearest whole integer to satisfy negative binomial count requirements.
Independent Variables
Concentrated Disadvantage Index (CDI)
The CDI derives from Sampson et al.’s (1997) operationalization of concentrated disadvantage and was constructed following the PhenX Toolkit (2016) protocol by standardizing and averaging five components: poverty rate, unemployment rate, public assistance receipt, female-headed household rate, and percentage of population under 18. Because these indicators are highly correlated and load on a single latent construct, compositing preserves statistical power, reduces unstable estimates on collinear predictors, and enables cross-study comparability under a standardized protocol (Song et al., 2013). Consistent with the protocol, the percentage of Black residents, often included in traditional indices (Sampson et al., 1997), was excluded to avoid conflating race with structural disadvantage (Maguire-Jack et al., 2015); racial composition is entered separately in Model 4. A sensitivity analysis entering the components individually is reported in Supplemental Materials.
Rurality
The 2023 NCHS Urban–Rural Classification Scheme was developed specifically for studying urban–rural differences in health measures (Ingram & Franco, 2014). Its six categories were collapsed into three: Urban (Large Central Metro, Large Fringe Metro, and Medium Metro; NCHS 1–3), Semi-rural (Small Metro and Micropolitan; NCHS 4–5), and Rural (Noncore; NCHS 6; reference group).
Racial and Ethnic Composition
To test for equitable service distribution (H4), the percentage of the total population identified as Black or African American and Hispanic or Latino were included as continuous covariates.
Substantiated Maltreatment Rate
The substantiated maltreatment rate was included as a predictor to test the Alignment Hypothesis (H1); the variable was rescaled so that one unit equals one victim per 100 children to improve the interpretability of regression coefficients. Substantiated rather than reported maltreatment rates were used because they are the operational metric DFPS publishes in its Data Book and uses in regional resource planning, making them the policy-relevant denominator for an alignment test of agency-administered prevention services. Although reporting practices differ systematically by urbanicity, substantiation probabilities are roughly comparable across urban and rural counties (Maguire-Jack & Kim, 2021), supporting the comparative validity of substantiated counts across the rurality categories examined here. Furthermore, Kohl et al.'s concerns about substantiation status are most consequential when individual service eligibility depends on it, which is not the case here because PEI operates upstream of CPS involvement. Limitations of substantiation as a risk indicator are addressed in the Discussion.
Contextual Controls
Violent crime rate, housing market stress (vacancy rate and rent-burdened households), and DFPS administrative region were included as controls. DFPS region was entered as a categorical covariate in every model to control for unobserved regional differences in child welfare practice, contractor presence, service infrastructure, and organizational factors known to shape substantiation rates (Dettlaff et al., 2011; Font & Maguire-Jack, 2021).
Analytic Strategy
Analyses were conducted in SPSS Statistics. Univariate distributions were inspected for skewness and overdispersion, and variance inflation factor (VIF) values were calculated for all regression predictors; in the final models, all VIFs ranged from 1.12 to 1.95 (threshold = 5.0). To examine the joint distribution of structural risk and rurality, CDI scores were categorized into tertiles (Low, Medium, High) across all 254 counties and cross-tabulated with the NCHS rurality classification.
Both prevention service outcomes (Family Prevention Reach and Youth Prevention Reach) were modeled using negative binomial regression with a log link function. Negative binomial regression was selected over Poisson regression to accommodate overdispersion in the count outcomes, a characteristic feature of service-utilization data (Hilbe, 2011).
A hierarchical model-building strategy was used to evaluate the unique contribution of each construct domain, with models specified as follows: • • • •
Nested models were compared using likelihood ratio tests, with AIC and BIC reported as additional fit indices. DFPS administrative region (11 categories) was entered as a categorical covariate in all models, with Region 11 (Edinburg) as reference. For Family and Youth Models 3 and 4, maximum iterations were increased to 200 with up to 10 step-halvings to ensure convergence, given modest overlap between rurality and regional composition. Results are reported as incidence rate ratios (IRRs) with 95% confidence intervals; α = .05.
Results
Crosstabulation of County Rurality Classification and Concentrated Disadvantage Index Tertile, Texas Counties (N = 254)
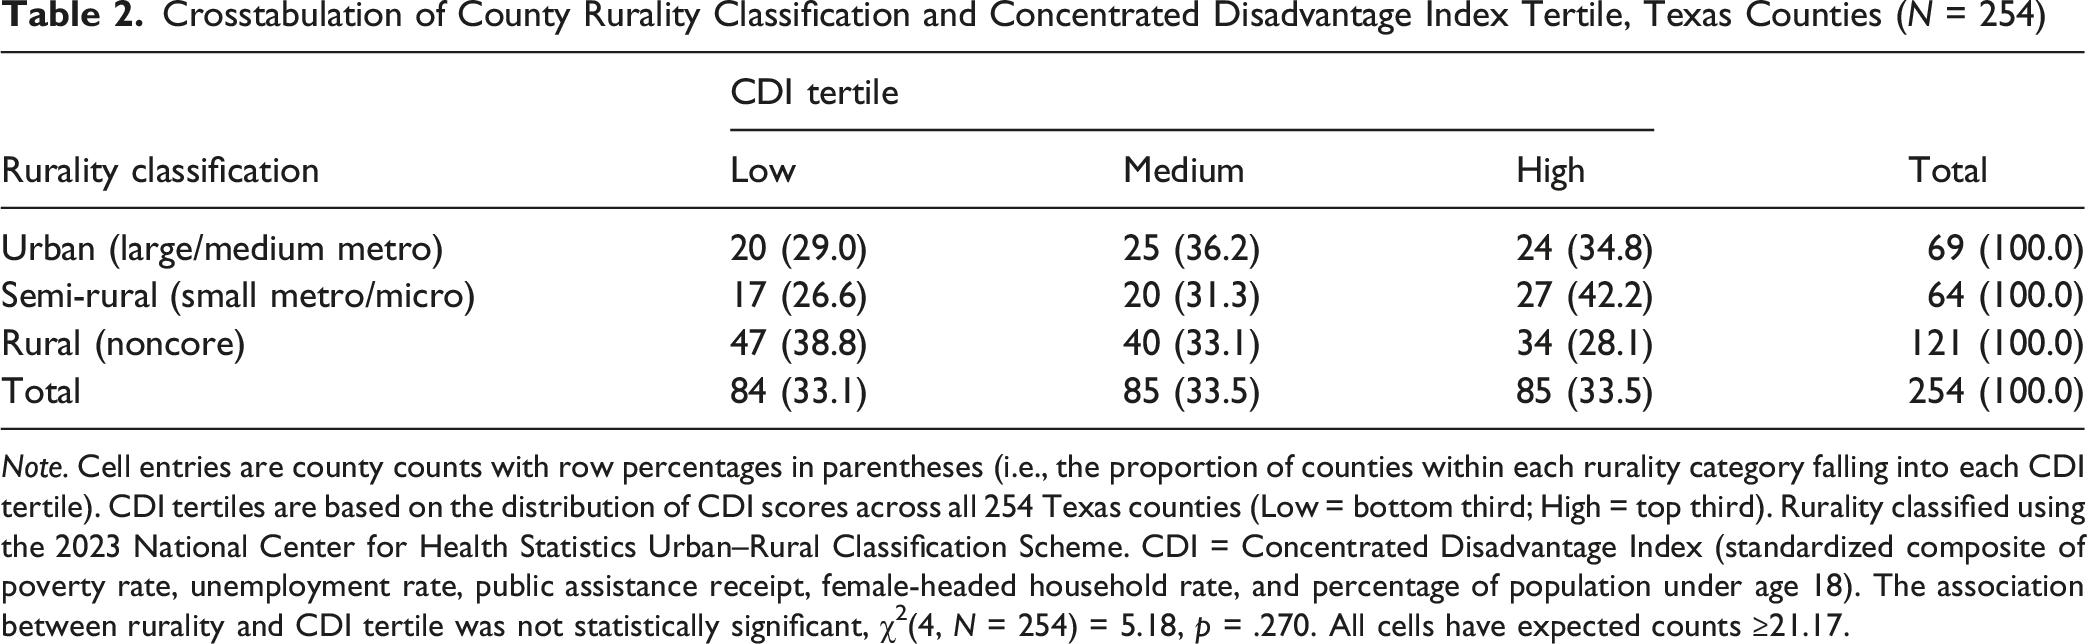
Note. Cell entries are county counts with row percentages in parentheses (i.e., the proportion of counties within each rurality category falling into each CDI tertile). CDI tertiles are based on the distribution of CDI scores across all 254 Texas counties (Low = bottom third; High = top third). Rurality classified using the 2023 National Center for Health Statistics Urban–Rural Classification Scheme. CDI = Concentrated Disadvantage Index (standardized composite of poverty rate, unemployment rate, public assistance receipt, female-headed household rate, and percentage of population under age 18). The association between rurality and CDI tertile was not statistically significant, χ2(4, N = 254) = 5.18, p = .270. All cells have expected counts ≥21.17.
Multivariate Analysis: Family Prevention Services
Negative Binomial Models Predicting Annual Families and Average Monthly Youth Served in PEI Programs, Texas Counties, 2023
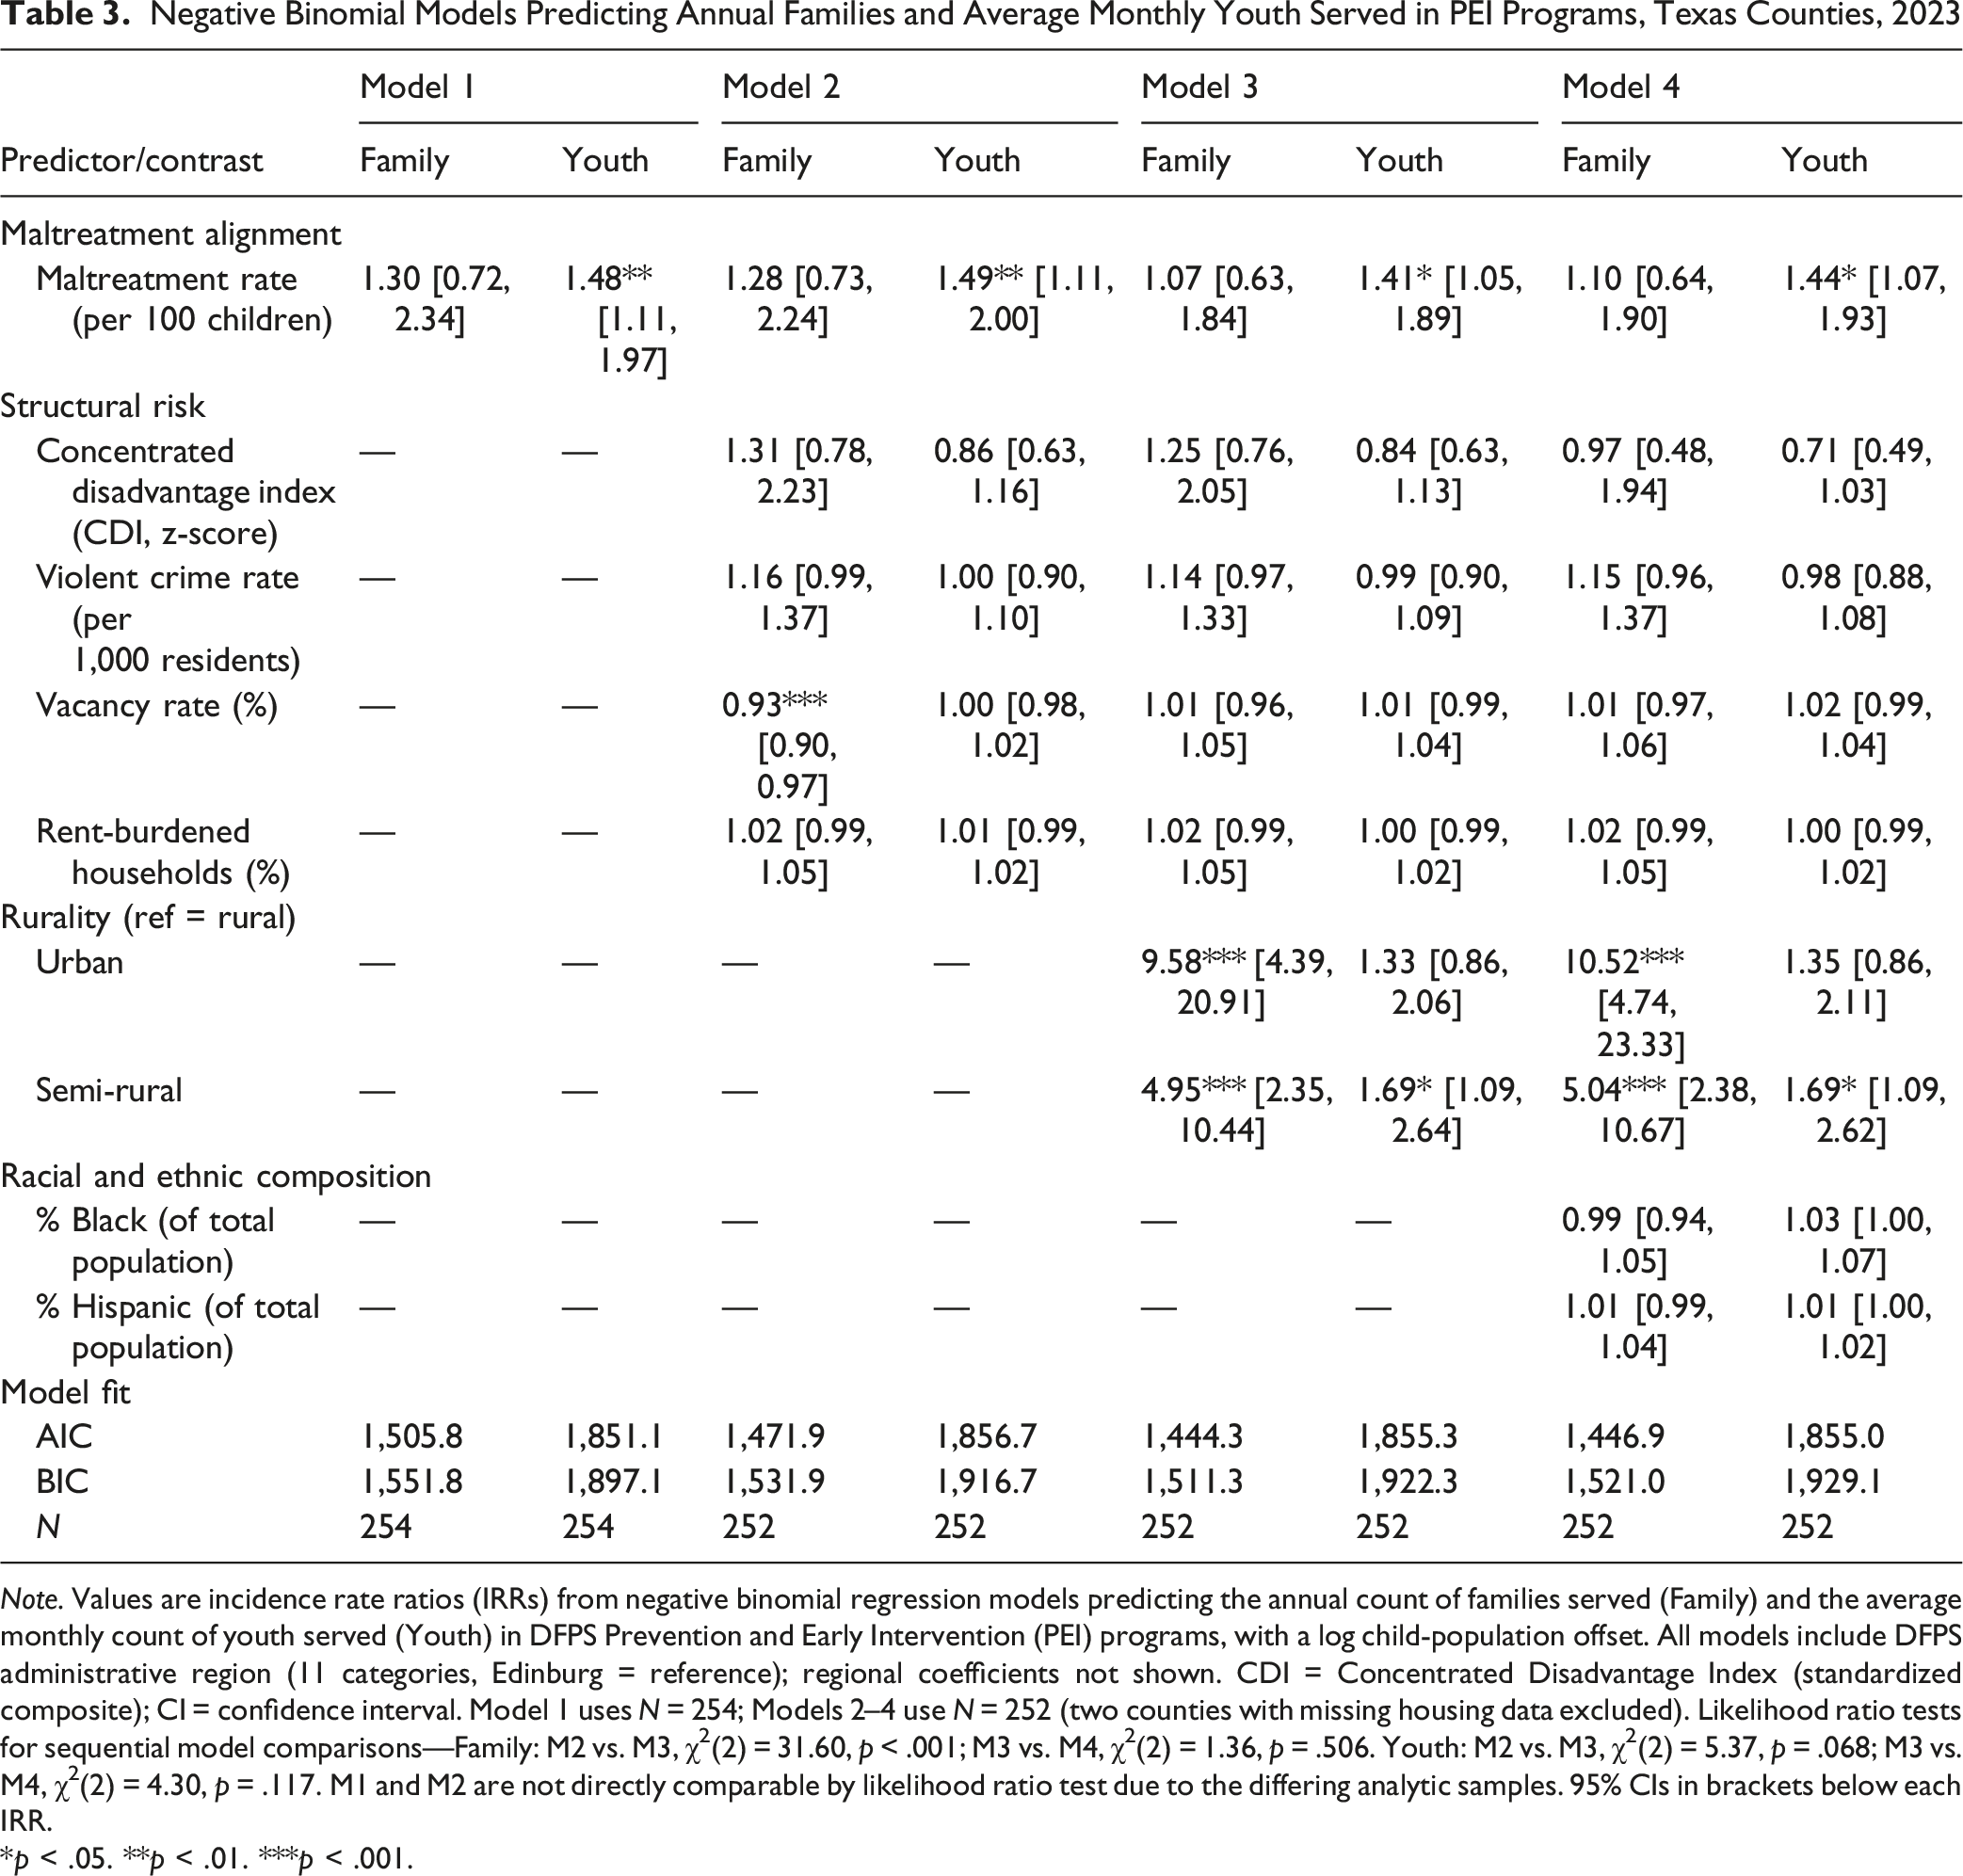
Note. Values are incidence rate ratios (IRRs) from negative binomial regression models predicting the annual count of families served (Family) and the average monthly count of youth served (Youth) in DFPS Prevention and Early Intervention (PEI) programs, with a log child-population offset. All models include DFPS administrative region (11 categories, Edinburg = reference); regional coefficients not shown. CDI = Concentrated Disadvantage Index (standardized composite); CI = confidence interval. Model 1 uses N = 254; Models 2–4 use N = 252 (two counties with missing housing data excluded). Likelihood ratio tests for sequential model comparisons—Family: M2 vs. M3, χ2(2) = 31.60, p < .001; M3 vs. M4, χ2(2) = 1.36, p = .506. Youth: M2 vs. M3, χ2(2) = 5.37, p = .068; M3 vs. M4, χ2(2) = 4.30, p = .117. M1 and M2 are not directly comparable by likelihood ratio test due to the differing analytic samples. 95% CIs in brackets below each IRR.
*p < .05. **p < .01. ***p < .001.
Model 1 (H1) entered only the substantiated maltreatment rate and DFPS region; the maltreatment rate was not significantly associated with family service intensity (Table 3), indicating that observed child welfare burden alone did not predict where family-focused services were delivered.
Model 2 (H2) added the structural risk block. Vacancy rate was strongly and negatively associated with family service intensity (Table 3), counties with higher residential vacancy received fewer family services per child, while the CDI, rent burden, violent crime, and the maltreatment alignment effect were not statistically significant.
Model 3 (H3) added the rurality trichotomy. The addition significantly improved fit, χ2(2) = 31.60, p < .001, and produced the study’s central finding: urban counties served nearly ten times as many families per child as rural counties, and semi-rural counties served roughly five times as many (Table 3). The previously significant vacancy effect attenuated to non-significance once rurality was controlled, indicating the Model 2 vacancy effect was confounded with rurality.
Model 4 (H4) added racial and ethnic composition. The addition did not significantly improve fit, χ2(2) = 1.36, p = .506, and neither % Black nor % Hispanic was significantly associated with family service rates. The rurality contrasts strengthened slightly in the fully adjusted model (Table 3).
Across the family models, rurality is the dominant predictor of service distribution, persisting and even strengthening across specifications. Alignment with substantiated maltreatment, structural risk, and racial composition does not predict family service allocation once geography and region are controlled. AIC values corroborated this pattern, declining monotonically through Model 3 before increasing slightly at Model 4 (Table 3).
Multivariate Analysis: Youth Prevention Services
A parallel sequence of negative binomial models was estimated for the average monthly count of youth served (Table 3). All models included DFPS administrative region as a categorical control.
Model 1 (H1) supported maltreatment alignment: youth services were significantly associated with observed maltreatment burden (Table 3). A 1-victim-per-100-children increase in the substantiated maltreatment rate was associated with a 48% increase in expected youth service intensity, controlling only for region.
Model 2 (H2) added the structural risk block. The maltreatment alignment effect remained significant, and no structural indicator reached significance (Table 3), providing no support for H2 in the youth context.
Model 3 (H3) added rurality. The likelihood ratio test did not reach conventional significance, χ2(2) = 5.37, p = .068. Within-model contrasts showed semi-rural counties had significantly higher youth service rates than rural counties, but the urban–rural contrast was non-significant (Table 3). The maltreatment alignment effect attenuated slightly but remained significant. H3 received mixed support: the semi-rural contrast was significant, but the omnibus addition did not significantly improve fit once region was controlled.
Model 4 (H4) added racial and ethnic composition. The addition was non-significant, χ2(2) = 4.30, p = .117, and neither % Black nor % Hispanic was significantly associated with youth service rates (Table 3); H4 was not supported. The maltreatment alignment effect re-strengthened, and the CDI showed a marginally significant negative association (p = .069), suggesting, though not establishing, that counties with greater concentrated disadvantage may receive fewer youth services per child once observed need and demographic composition are controlled. The semi-rural contrast remained significant.
The youth models reveal a more constrained allocation pattern: maltreatment alignment is the most consistent predictor, semi-rural counties show modestly elevated rates relative to rural counties, and structural disadvantage shows a marginal negative association after full adjustment. Neither rurality nor racial composition significantly improved youth model fit as omnibus blocks once regional controls were in place; AIC values were nearly flat across models (Table 3).
Sensitivity Analyses
Sensitivity analyses (Supplemental Tables S2–S4) preserved all central findings. Decomposing the CDI maintained the family rurality results; in the youth model, the decomposition revealed significant positive associations of % Black and % Hispanic with youth service rates and identified the female-headed household rate and percentage of population under 18 as carrying the negative composite effect. Restricting the analytic sample by minimum county child population (>1,000; >10,000) preserved central findings.
Discussion
This study examined whether Texas DFPS PEI services are allocated in ways that reflect county-level structural child maltreatment risk, and whether family- and youth-focused programs respond differently to that risk and to geography. The findings indicate that PEI services are only partially aligned with structural child welfare risk: family and youth services follow distinct allocation logics shaped more by infrastructure and regional organization than by where children face the greatest burden.
Family Services: A Tenfold Gap and the Inverse Care Law
The fully adjusted family services model produced this study’s central finding: a tenfold urban–rural gap in family service intensity that strengthened after extensive covariate adjustment, while neither observed maltreatment burden nor concentrated disadvantage predicted family service distribution once geography and region were controlled. The substantive question is why concentrated disadvantage failed to predict the distribution of services designed to address it.
The magnitude of this disparity is large but not anomalous relative to adjacent service domains. Documented urban-to-rural ratios scale with service specialization, ranging from modest gaps in primary care (Machado et al., 2021) to substantial gaps in pediatric specialty services, where rural counties have approximately one-eighth the per-child general-pediatrician density of the national average (Ramesh & Yu, 2023), to the most extreme disparities in child psychiatry, where 70% of U.S. counties had no child psychiatrist throughout 2007–2016 (McBain et al., 2019). Within child welfare specifically, Belanger and Stone (2008) and Maguire-Jack and Kim (2021) documented similar rural service gaps in family preservation and in-home services. Against this distribution, the 10.5-fold rural–urban gap in DFPS family-focused PEI is large but not anomalous — broadly consistent with the magnitudes documented for child specialty services and for U.S. evidence-based home visiting reach, which ranges from at least 75% county coverage in 19 states to fewer than 25% in 5 states (National Home Visiting Resource Center, 2024). Critically, the present finding is more conservative than most comparator estimates, which are typically unadjusted or minimally adjusted; the 10.5 IRR reflects a residual urban–rural gap that persists after controlling for region, structural disadvantage, observed maltreatment burden, racial composition, and housing distress.
The pattern is the inverse care law (Hart, 1971) operating in U.S. state-administered prevention. A parallel formulation, the “inverse intervention law,” in which child welfare intervention rates are lower in geographic areas with higher concentrated disadvantage, was coined by Bywaters et al. (2015) on the basis of English child protection data and has since been extended to additional contexts (Bywaters et al., 2020). Empirical demonstrations of the pattern in U.S. child welfare span multiple states and study designs (Belanger & Stone, 2008; Brewsaugh et al., 2023; Maguire-Jack & Kim, 2021). State-administered prevention systems, despite operating outside private markets in the strict sense, may reproduce market-like dynamics through grant-driven contracting, provider selection thresholds, and historical service-location decisions: family-focused PEI contractors have historically concentrated in metropolitan areas, where workforce, agency capacity, and contracting histories accumulate over time (Maguire-Jack & Kim, 2021). Texas’s rural service-supply environment compounds these dynamics. The Health Resources and Services Administration (HRSA, 2026) identifies 402 mental health Health Professional Shortage Area designations in Texas; nationally, approximately 91% of mental health geographic-area designations fall in rural or partially rural areas. The structural disadvantage and maltreatment burden documented in the rural Texas literature thus map onto a service distribution that does not respond to that burden.
Why Rurality Dominated and Structural Risk Did Not
Why did rurality so strongly predict family service intensity while concentrated structural disadvantage did not? Supply-side mechanisms that produce rural service deserts operate independently of, and often in tension with, indicators of community need: provider organizations select sites based on workforce availability, contracting infrastructure, and historical service-area definitions — factors that correlate with metropolitan status more than with disadvantage per se. The Texas crosstabulation of rurality and CDI tertile (Table 2) confirms this decoupling: rural counties span the full disadvantage continuum. Concentrated disadvantage, in other words, is not a rural variable in Texas. Family service distribution tracks the geography of provider infrastructure, which is urban, rather than the geography of need, which is distributed. This is the operational mechanism behind the inverse care pattern.
The vacancy rate finding offers a diagnostic of the same infrastructural story: vacancy’s strong negative association with family service intensity in Model 2 fully attenuated once rurality was added. What looked like a structural-disadvantage effect was geographic.
Youth Services and the Shift With Region Controls
Counties with higher confirmed maltreatment rates received more youth-focused PEI per child, indicating that this stream is more precisely targeted toward observed need than its family counterpart — plausibly because youth programs use targeted contracting based on observable risk indicators, while family programs operate through long-standing home-visiting contractor relationships with their own geographic logic. Whether this targeting translates into reduced maltreatment cannot be assessed from the present cross-sectional design.
Beyond the maltreatment-alignment effect, however, the youth findings shifted substantially once DFPS region was controlled. The rurality and race/ethnicity blocks did not significantly improve model fit, although the semi-rural – rural contrast remained significant within the rurality block; concentrated disadvantage showed a marginally significant negative association with youth service intensity (see Table 3 for full statistics). These shifts deserve interpretation. What looked, in less-controlled specifications, like rurality and race effects on youth service distribution were substantially absorbed by administrative region — the eleven DFPS geographies whose contractor compositions, nonprofit densities, and service histories differ substantially. The substantive lesson is that DFPS region was doing real explanatory work.
Asymmetric Allocation Across Service Streams
The asymmetric pattern across service streams is the substantive contribution: family-focused prevention in Texas tracks geography rather than need, while youth-focused prevention tracks observed maltreatment burden but not structural disadvantage. This divergence implicates the two streams in different structural pathologies — for family services, infrastructural maldistribution consistent with the inverse care law; for youth services, responsiveness to documented harm but insensitivity to upstream structural risk. The directional implications of the % Black and % Hispanic coefficients warrant careful interpretation. Although the main models show neither direction reliably, the decomposed sensitivity model produced positive associations for both groups. Read alongside the Hispanic paradox literature (Tejeda et al., 2024), this pattern raises the possibility that positive associations between % Hispanic and youth service intensity reflect responsive contracting in heavily Hispanic regions rather than uniform need.
Broader Implications
Although confined to Texas, the patterns documented here are unlikely to be Texas-specific. National Family First Prevention Services Act (FFPSA) prevention infrastructure remains sparse and uneven: as of December 2025, Title IV-E prevention claims totaled approximately $112.7 million in FY2023, less than 2% of all Title IV-E spending nationally, and 60% of states had submitted no prevention claims (Oberlander et al., 2026). Brewsaugh et al. (2023) found in a Midwestern state that prevention services were concentrated in areas of high Black child poverty and largely absent from rural areas of high White child poverty—a structural rather than need-driven pattern. Evidence-based home visiting, which has been associated with reductions in child maltreatment reports at the county level (Kim et al., 2024), is implemented in only 51% of U.S. counties (National Home Visiting Resource Center, 2024). As FFPSA implementation continues, attention to county-level allocation patterns, not merely state-level totals, will be necessary to determine whether prevention services reach the families they were designed to serve.
Policy Implications
Three implications follow. First, state child welfare agencies should consider explicit, indicator-based allocation frameworks for family-focused prevention rather than relying on historical contractor footprints; county-level maltreatment burden, structural disadvantage, single-parent and child-population shares, and rurality could form a composite targeting metric (Rosinsky et al., 2025; Slack & Berger, 2020). Second, rural family service coverage warrants treatment as a design goal in its own right, through set-aside funding, regional capacity-building grants, and partnership requirements with rural provider networks (Maguire-Jack & Kim, 2021; NACRHHS, 2018); expanding the FFPSA evidence-based practice slate to include economic and concrete supports, which are more rural-deliverable, would directly address the rural–urban gap (Johnson-Motoyama et al., 2022; Puls et al., 2024). Third, the youth-side responsiveness to maltreatment burden creates a diagnostic opportunity: counties where youth PEI intensity is high but family PEI intensity is low, given comparable maltreatment burden, are candidates for targeted family-services expansion.
Limitations and Future Directions
This study has several limitations. First, the cross-sectional, county-level design precludes causal inference. The null association between family PEI service intensity and substantiated maltreatment is observationally equivalent to two accounts: that family services are not targeted to county-level need (the inverse-care interpretation), or that earlier prevention services reduced subsequent maltreatment in counties that received them. The inverse-care interpretation was selected on grounds of parsimony and convergent rural-supply evidence, not causal grounds; the same ambiguity applies to the positive youth-services finding. Multi-year county panel designs linking changes in prevention service reach to subsequent maltreatment outcomes (Kim et al., 2024) represent the appropriate methodological response.
Second, race-region confounding limits interpretation of the H4 null result. In Texas, Black residents are disproportionately concentrated in urban and metropolitan counties, with roughly 65% residing in the Houston and Dallas–Fort Worth metropolitan areas (U.S. Census Bureau, 2024). Within the present county sample, the percentage of Black residents therefore carries limited independent variance from rurality, a structural overlap evident in the multicollinearity diagnostics (% Black VIF = 1.95), and restricts the study’s ability to detect race effects statistically distinguishable from rural–urban geography. Multilevel or within-region designs using more granular geographic units would better disentangle race and place (Smith et al., 2021).
Third, substantiated maltreatment rates likely undercount the broader population of children at risk and are shaped by organizational context independent of underlying need (Font & Maguire-Jack, 2021; Kohl et al., 2009). This concern is particularly salient in rural counties, where weaker reporting infrastructure may produce systematically lower investigated report rates (Smith & Pressley, 2019); alignment estimates in high-poverty rural counties may therefore be conservative. Including DFPS Region as a covariate partially addresses regional variation in organizational factors, but residual variation likely remains. Additionally, the ACS 5-year estimates (2019–2023) used to construct the demographic predictors span the COVID-19 pandemic, which disrupted both reporting and service delivery and may introduce mismatch when compared against FY2023 service counts. Finally, the county-level service-reach outcomes used here capture where families and youth are served, not which families and youth within a county receive services, and the models omit potentially important predictors — local nonprofit capacity, transportation infrastructure, and prior DFPS contract history — that may bias estimates of structural and racial variables. Future research should specify directional hypotheses for race and ethnicity and combine county-level modeling with qualitative inquiry into DFPS regional and provider decision-making (Smith et al., 2021). Despite these constraints, the study offers a practical starting point for DFPS to refine its prevention targeting framework and strengthen the alignment between upstream services and the communities where children face the greatest structural vulnerability.
Supplemental Material
Supplemental Material - Upstream but Uneven: The Mismatch Between Structural Risk and Child Maltreatment Prevention Service Allocation in Texas
Supplemental Material for Upstream but Uneven: The Mismatch Between Structural Risk and Child Maltreatment Prevention Service Allocation in Texas by Makayla M. Meador in Child Maltreatment
Footnotes
Acknowledgements
The author is grateful to Dr. Kenneth Wink (The University of Texas at Tyler) for his thoughtful guidance and encouragement during the early development of this project.
Ethical Considerations
This study was reviewed by the Institutional Review Board (IRB) of The University of Texas at Tyler (IRB Protocol #2026-048) and determined on February 18, 2026, to be Not Human Subject Research as defined under 45 CFR 46 and 21 CFR 56. The determination was based on the study’s exclusive use of secondary, publicly available, county-level aggregated data and the absence of interaction with human participants or access to identifiable private information.
Consent to Participate
Not applicable. This study did not involve human participants; therefore, informed consent was not required.
Consent for Publication
Not applicable. This study did not involve human participants and contains no identifiable individual-level data.
Funding
The author received no financial support for the research, authorship, and/or publication of this article.
Declaration of Conflicting Interests
The author declared no potential conflicts of interest with respect to the research, authorship, and/or publication of this article.
Data Availability Statement
The data analyzed in this study were obtained from publicly available sources. All data sources, operational definitions, and reference years are detailed in Supplementary Table S1. The compiled analytic dataset is available from the corresponding author upon reasonable request.
Use of Artificial Intelligence
The author used generative AI tools (Anthropic’s Claude) to assist with editing, language refinement, formatting, and structural organization. All analyses, interpretations, and final writing decisions are the author’s own, and the author reviewed and edited all manuscript materials to ensure accuracy and originality.
Supplemental Material
Supplemental material for this article is available online.
References
Supplementary Material
Please find the following supplemental material available below.
For Open Access articles published under a Creative Commons License, all supplemental material carries the same license as the article it is associated with.
For non-Open Access articles published, all supplemental material carries a non-exclusive license, and permission requests for re-use of supplemental material or any part of supplemental material shall be sent directly to the copyright owner as specified in the copyright notice associated with the article.