
Abstract
This study assessed the effectiveness of Safe@Home, an in-home intervention to (1) prevent out-of-home placement for children at imminent risk of placement, and (2) minimize time in out-of-home care for children already in foster care. Using Coarsened Exact Matching, children who received Safe@Home were matched to a comparison group of children served before Safe@Home was available in their community. All children were determined by the child welfare agency to be unsafe and in need of immediate intervention. The matched samples (Safe@Home n = 510, Comparison n = 851) showed strong baseline equivalence on child age, race/ethnicity, previous history of child welfare involvement, and safety threats. Children who received Safe@Home experienced lower rate of out-of-home placements, higher rate of permanency with a parent (sustained for 12 months after the end of Safe@Home), fewer days in out-of-home care, and shorter time to case closure relative to children who received treatment as usual. There was no effect of Safe@Home on post-permanency outcomes of maltreatment and entry or re-entry after case closure.
Introduction
Public child welfare agencies around the United States are charged with the responsibility of ensuring children’s safety. When believed necessary, agencies and courts intervene in families’ lives using the least intrusive means possible, sometimes removing children from their families to keep children safe. If removed, agencies must promote children’s ongoing safety while making reasonable efforts to reunify children with their families in a timely manner (U.S. Department of Health and Human Services, 2000). The overarching goal is to keep children safe with their families intact as often as possible, either through prevention of out-of-home placements or timely reunification (Child Welfare Information Gateway, 2020). Effective alternatives to removal and foster care a needed to accomplish this goal.
At critical points in a child welfare case, agencies attempt to differentiate risk from lack of safety, which has significant implications for case decisions including placement and reunification. Risk exists on a continuum and is informed by the presence of factors that may increase the likelihood of future maltreatment (Child Welfare Information Gateway, 2020). Risk factors for child maltreatment, when broadly-defined, may include family poverty, life stressors, social isolation, and child age (Austin et al., 2020; Belsky, 1993). In contrast, safety threats—often referred to as impending danger—describe threatening family conditions associated with caregiver functioning and parenting practices that are out of control and likely to cause serious harm to a child in the near future if safety action is not taken and/or sustained. Risk factors do not inherently constitute safety threats, and it is important that child welfare agencies analyze the pervasiveness, duration, intensity, and whether harm is imminent—as well as parents’ capacity to protect their children even in the presence of risk factors—when assessing threats to children’s safety. When child welfare agencies identify impending danger within a family, children are believed to be unsafe and in need of immediate protection, which may require out-of-home placement.
Families whose children are unsafe and at imminent risk of placement are different from other, broader vulnerable populations. Their circumstances are dangerous enough that intervention is warranted to ensure that children are safe, and children have often experienced maltreatment, so ongoing safety assessment and active safety management may be necessary (DePanfilis, 2005; Pecora et al., 2013). Families involved with child welfare are also typically involuntary participants involved with the child welfare agency and often feel coerced into cooperating with government intervention (D’Andrade & Chambers, 2012; Smith, 2008). Families may perceive case service plans and requirements as punitive (Smith, 2008) and may experience fear in interactions with service providers (Schreiber et al., 2013).
Every day, child welfare agencies around the country serve children who are unsafe and either at imminent risk of entering foster care or seeking to reunify with their families. Often, accepted child welfare practices are not rigorously tested, and leaders are uncertain whether services and programs are achieving the outcomes they had hoped for children and families (Horwitz et al., 2014). For example, the vast majority of current evidence for in-home parent skill-based programs is based on interventions designed for families with broadly-defined risk factors (Kaye & Reyes, 2021). Only a few interventions have shown successful permanency outcomes for families with impending danger, and even fewer programs have shown favorable effects on facilitating timely reunification for children that experience out-of-home placements (Kaye & Reyes, 2021). There is a clear and urgent need to continue studying how to effectively intervene in ways that ensure child safety while also preserving families. Child welfare agency administrators need sound evidence to inform their decision-making about how to best keep children safe and respond to the needs of families (Testa et al., 2014).
Safe@Home Intervention
Safe@Home is the community-based safety management component of a larger child welfare practice model: the Safety Assessment and Family Evaluation (SAFE; Holder, 2021), designed by Action for Child Protection. Safe@Home serves families with children of all ages who are determined by child welfare agencies to be unsafe with their families and who have cases opened for ongoing services with either an in-home or out-of-home safety plan. Safe@Home has the following primary goals: (1) placement prevention
Safe@Home provides in-home services to ensure that children are safe while at home with their families and parents/caregivers are making progress toward their case plan goals. Safe@Home is delivered by community-based safety managers that tailor Safe@Home services to address the unique safety threats identified by child welfare agencies for each family. The service objectives, frequency, and duration can vary from family to family. Safety managers customize service intensity to ensure that threats are sufficiently managed and needs are met, so that children are safe while at home. The typical duration of Safe@Home is between four and 6 months, with an average of in-home services 4 days per week, and 17 hours of monthly contact. Safe@Home in-home safety services include: behavior management (e.g., supervision and monitoring, stress reduction, behavior modification), social connection (e.g., parenting assistance, home management, social networking), crisis management (e.g., suicide prevention, relapse prevention, problem solving), separation (e.g., respite, day care, child-oriented activities), and resource support (e.g., employment assistance, housing assistance, food, clothing, furnishings).
Based on tenets of Family Systems Theory (Bowen, 1978), Family Centered Practice (Dunst, 1985; Dunst et al., 1988) and Trauma-Informed Care (SAMHSA, 2014), Safe@Home is directed at the family unit as a whole and intentionally includes family members in key decision-making for safety planning, case planning, and meeting children’s needs. Assessments engage families to seek understanding of their unique experiences and needs, including past trauma, while considering broader implications for racial, ethnic, and cultural issues, strengths, values, and beliefs (Holder, 2021). In contrast to traditional compliance-based models, safety managers develop helping relationships that foster an environment where caregivers and children feel safe and empowered to have a voice in key case decisions (Holder, 2021).
Safe@Home offers several innovations to traditional child welfare “services as usual”. Historically, in-home safety plans were only available to families with readily available local supports who could check on the child and family, and often used primarily for children at lower levels of risk. In contrast, child removal and placement were the predominant intervention for children determined to be unsafe. With Safe@Home, all families who meet criteria can be provided a trained safety manager who can continually assess and monitor safety to control impending danger threats while the child is at home and the family is still intact. Safe@Home supports more equitable safety planning options by making in-home safety plans available to families that are isolated, marginalized, and in need of additional support. Safe@Home is also delivered by community-based organizations that may be perceived by families as neutral and non-threatening because they do not have the same decision-making power and authority over families’ lives that the child welfare agency does. Detailed information about the Safe@Home intervention and its components are available in its intervention manual (Holder et al., 2016).
Previous Research
The Department of Family Services in Clark County (the largest and most urban county in the state of Nevada) implemented Safe@Home during its Title IV-E Waiver Demonstration Project from July 2015 to September 2019. As part of that project, outcomes of children who received Safe@Home were evaluated relative to a comparison group of children who received informal in-home safety services during the same time period (Nevada Institute for Children’s Research and Policy, 2020). Results from the accompanying IV-E Waiver implementation study revealed a high demand for Safe@Home services, with caseworkers referring nearly double the number of families than initially expected. The implementation study also gathered qualitative feedback from families, safety managers, and caseworkers which indicated overall positive experiences with Safe@Home and some specific recommendations for improvements (Nevada Institute for Children’s Research and Policy, 2020).
The IV-E Waiver outcome study focused primarily on incidents of maltreatment while cases were open and after case closure, and it did not detect significant differences between the intervention and comparison groups. Results from the outcome study are difficult to interpret because the treatment and comparison groups were imbalanced on several measured characteristics. Additionally, the authors noted, “It is possible that just by virtue of having access to these types of informal supports, the comparison group families had a greater likelihood of success than the treatment group families” (Nevada Institute for Children’s Research and Policy, 2020 p. 64).
To supplement the external evaluation, Clark County Department of Family Services (CCDFS) conducted additional analyses of its internal data in a final report to the Children’s Bureau. CCDFS reported that Safe@Home helped the county to achieve the goals of the Title IV-E Waiver. CCDFS included aggregate population-level analysis that demonstrated a trend toward (1) increasing percentages of children served through in-home safety plans and (2) decreasing average lengths of stay in out-of-home care during the period that Safe@Home was implemented (Nevada Department of Health and Human Services Division of Child and Family, 2020).
Study Objectives and Hypotheses
The purpose of this study was to rigorously test the effectiveness of the Safe@Home in-home parent skill-based intervention implemented by CCDFS as part of their larger comprehensive practice model. The study described in this article was designed to add to stakeholders’ understanding of Safe@Home in Clark County and to contribute to the evidence base about Safe@Home more broadly, by: a) examining placement and permanency outcomes related to the goal of keeping families together, b) constructing a comparison group that is matched on child characteristics and case circumstances, and c) defining the counterfactual to capture the population-level treatment effects of Safe@Home compared to public child welfare services as usual for a population of children determined by CCDFS to be unsafe with their families.
Prior to the implementation of Safe@Home, CCDFS had few safety resources to support families and allow children to remain home while parents/caregivers worked towards their case plan goals. Without in-home, community-based support, out-of-home safety plans were often the only option available to protect children. It was hypothesized that, relative to children with comparable characteristics and safety threats served before Safe@Home was available in their community, children that received Safe@Home would experience improved permanency and safety outcomes (further defined in the Method section).
Method
This study employed a retrospective longitudinal quasi-experimental design that relied on child welfare administrative records. It was verified as Exempt from Institutional Review Board oversight (protocol #2022/02/10, Solutions IRB, LLC), because it was as a program evaluation using secondary data. Details of all variables coded from administrative data are described in the Supplementary Material. Full methodological details including data management, quality assurance, and sample selection are also available in a comprehensive evaluation report (Kaye & Reyes, 2021). Statistical analyses were performed in Stata (v.17).
Participants
Inclusion and Exclusion Criteria for the Intervention and Comparison Groups.
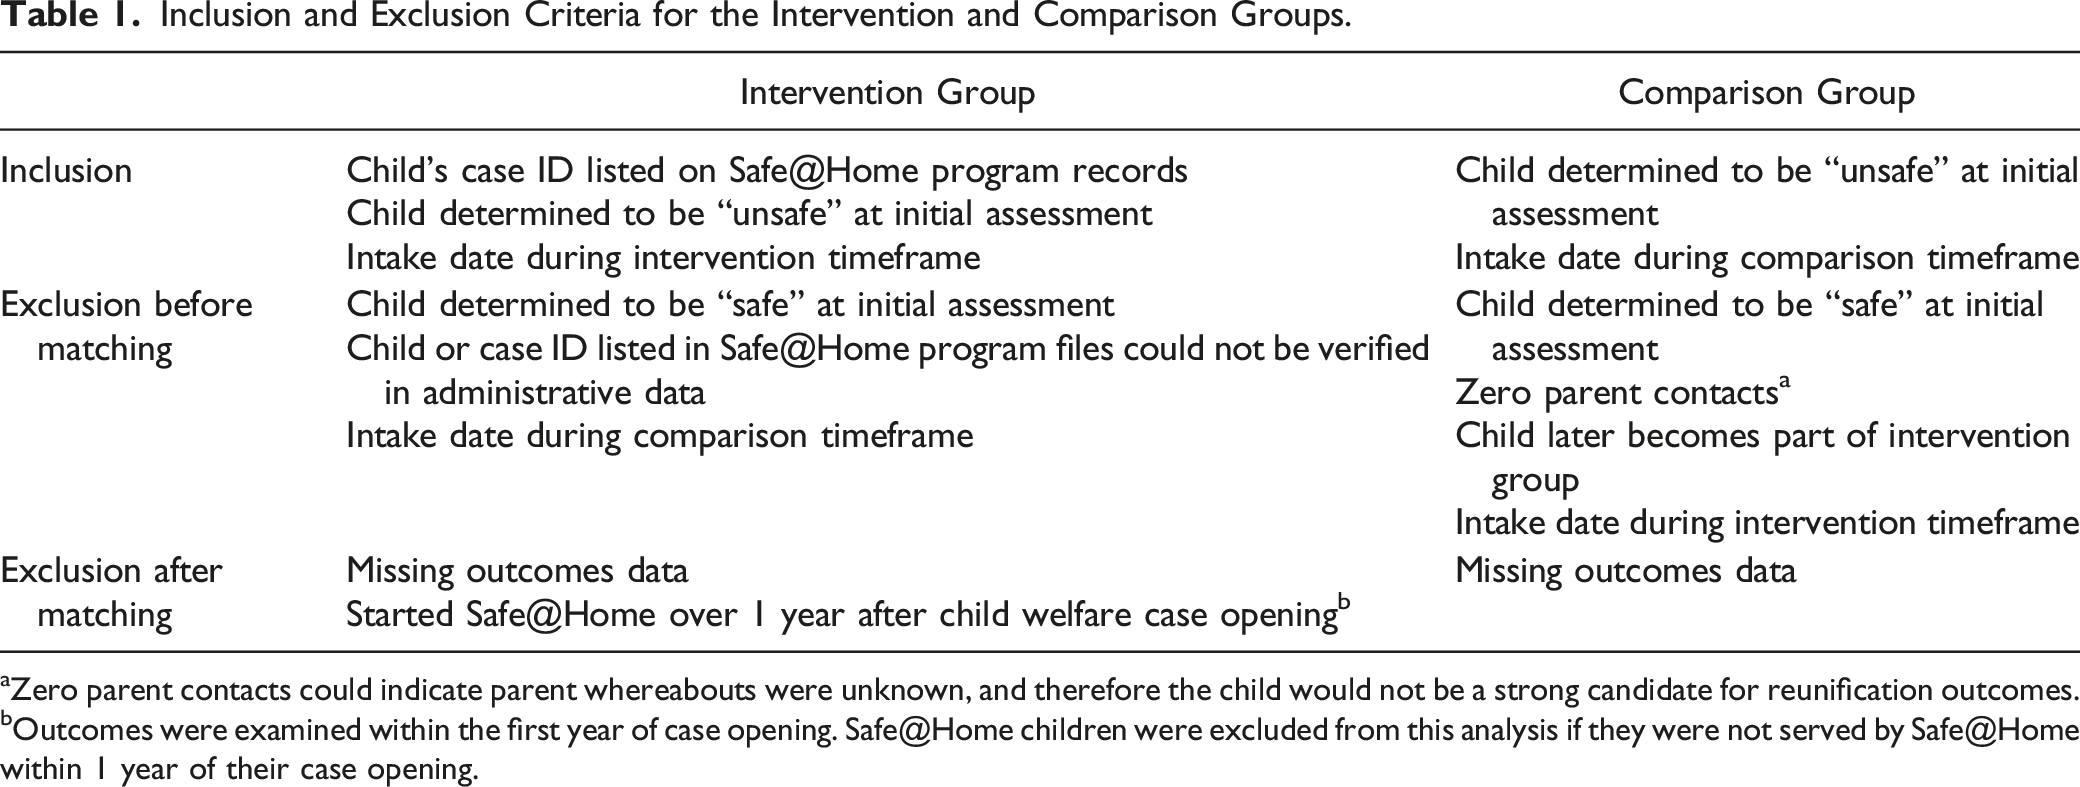
aZero parent contacts could indicate parent whereabouts were unknown, and therefore the child would not be a strong candidate for reunification outcomes.
bOutcomes were examined within the first year of case opening. Safe@Home children were excluded from this analysis if they were not served by Safe@Home within 1 year of their case opening.
Constructing the Matched Sample
The historical comparison group was constructed by matching children in the intervention group to children from the full population of children from within the same county (N = 2394) determined to be unsafe and served by CCDFS after the launch of the initial SAFE components (beginning in November 2013) but before Safe@Home was implemented in their communities (beginning in September of 2015; see Kaye & Reyes, 2021 for full details of implementation across the county). Children were matched based on: child age, race or ethnicity, previous history of child welfare involvement, and impending danger threats identified during the initial assessment. Children were matched at completion of the initial family assessment when workers determined whether the child was safe or unsafe. If the child was determined to be unsafe, workers also determined whether to intervene with an in-home or out-of-home safety plan. Assessing outcomes from this point in the case provided the same baseline information for intervention and comparison cases and allowed for evaluation of placement prevention as well as other child welfare outcomes of interest in this study.
Potential comparison cases that met inclusion criteria were selected to match characteristics of the intervention group in a 1:1 ratio, using coarsened exact matching (CEM; Blackwell et al., 2009). The technique temporarily “coarsens” continuous variables by grouping them into categories, exact matches cases using the coarsened data, then prunes unmatched cases before using the original uncoarsened values for subsequent analyses (King & Nielsen, 2019). Initially, a successful match was found for 95% of children whose families received the Safe@Home intervention.
Analysts intended to include all matched children within each family and account for non-independence using multi-level models. However, intra class correlations (ICC) indicated that there was almost no variation within families for these child welfare outcomes, which made it impossible to obtain valid estimates using multi-level models. As an alternative, analysts randomly sampled one child per family from the matched samples to serve as a focal child using the sample command in Stata v17. This approach reduced the final total sample size and changed the ratio of intervention to comparison cases (resulting in more comparison cases than intervention cases) but eliminated the problem of non-independence and made it possible and appropriate to use fixed effect models.
Baseline equivalence and all the results presented in this report are based on the final reduced sample. Differences in baseline characteristics between the Safe@Home groups and comparison groups were compared using independent samples t-tests for continuous variables and chi-squared tests for categorical variables. Effect sizes for baseline differences were estimated using Hedges’ g (Hedges & Olkin, 1985) for continuous variables (e.g., child age) and Cox’s d (Cox, 1970; Haddock et al., 1998) for dichotomous variables.
Outcome Calculations and Analysis
Permanency and safety outcome variables were constructed based on the following definitions. Out-of-home placement prevention (dichotomous) was defined as whether children were ever placed in an out-of-home placement setting during the identified child welfare episode. Length of time in out-of-home care (count) was calculated by summing the total days children spent in out-of-home placements within the first year of the case. Case closure within 1 year (dichotomous) was quantified as the total number of days between the child welfare case start and end dates, regardless of whether the child was in an in-home or out-of-home placement and summarized as a dichotomous indicator of closure within 365 days. Permanency with a parent (time-to-event) was operationalized as being in a parental placement when the child welfare case closed and measured in days to case closure with parent. Repeat maltreatment (dichotomous) was defined as the presence of one or more substantiated maltreatment allegations (a) within 6 months of case closure and (b) within 12 months of case closure. Entry or re-entry in out-of-home care (dichotomous) was defined as whether the child experienced a new out-of-home placement (a) within 6 months of case closure and (b) within 12 months of case closure. Sustained prevention of out-of-home placement (dichotomous) was defined as having spent no days in out-of-home care during the 12-months following the end of services for children that received Safe@Home (or a comparable 12-month follow-up period for the comparison group).
Statistical Models
The historical comparison group was observed for a longer period of time (up to 80 months, from November 2013 to June 2020) than the more recently observed intervention group (up to 59 months, from August 2015 to June 2020). Analysts used multiple strategies to account for the difference in observation length as well as the possibility that some cases may still be open and have not yet observed case closure or permanency outcomes (<5% of study sample). First, to assess case closure, repeat maltreatment and entry/re-entry into out of home care, analysts compared the proportion of children that experienced outcomes within comparable time intervals and calculated odds ratios using logistic regressions predicting whether or not the outcome was observed during that interval. For example, analysts estimated the proportion of cases that closed within 12 months of case start, and the proportion of cases that experienced re-entry within 6 months of case closure. Second, to assess permanency with a parent, analysts used Cox proportional hazards regressions to compare the “risk” of permanency with parents across time in both groups. Cox proportional hazard models are used to account for censoring (i.e., cases that have not yet experienced an outcome) in time-dependent outcomes (Cox, 1972).
To analyze the impact of Safe@Home on the amount of time that children spent in out-of-home care, analysts used Tobit regressions because they allow for continuous outcome variables that are both right and left censored (Tobin, 1958). In the current study, many children spent 0 days in out-of-home care, and the maximum amount of time spent out of home was truncated at 365 days, as noted above.
Logistic regressions were used to assess the dichotomous outcomes of placement prevention and sustained placement prevention. Sustained out-of-home placement prevention effects beyond the end of treatment were observed for 12 months following the end of Safe@Home for children in the Placement Prevention group. Because the comparison group cases did not have a similar end of intervention, their follow-up period was constructed (Beachy-Quick et al., 2018). Analysts extrapolated a “wait period” based on the amount of time that comparison children likely would have been involved with Safe@Home had they received the intervention. The duration of Safe@Home was 6 months or less for the majority (75%) of children in the Safe@Home Placement Prevention group, so a wait period of 6 months was used for their matched comparison group. Three variations of the analyses were conducted to assess the consistency of the findings using different wait periods (see Supplemental Material).
Baseline characteristics with effect sizes between d = 0.05 and 0.25 in the final matched sample were included as control variables in the final statistical models (Wilson et al., 2019). Control variables included child age, child race or ethnicity, and type of impending danger threats (see Supplemental Material) for both the Safe@Home Reunification and Safe@Home Placement Prevention groups. Previous history of child welfare involvement was used as an additional control variable for the Safe@Home Reunification group, but previous child welfare involvement was not included in final models for the Safe@Home Placement Prevention group, because the baseline difference effect was less than d = 0.05. Additionally, a dichotomous indicator of whether the child achieved permanency with a parent at case closure was included as a covariate in models that explored repeat maltreatment and re-entry in out-of-home care after case closure. Achieving permanency with a parent—as opposed to being adopted or placed with a guardian, for example—was expected to have a strong association with post-closure outcomes.
Effect sizes for all dichotomous outcomes were computed from odds ratios obtained in final adjusted models using the Cox transformation (Sánchez-Meca et al., 2003). When models yielded hazard ratios, these were converted to risk ratios using the transformation described by Shor and colleagues (Shor et al., 2017) and then to odds ratios based on the transformations described in Grant (2014). Raw calculations of the effect sizes are provided in the Supplementary Material. Effect sizes for continuous outcomes were calculated by dividing the unstandardized regression coefficient in adjusted models by the pooled standard deviation of the outcome variable. Conventional cutoffs were used to describe effects as small (d = 0.20–.49), medium (d = .50 to .79), and large (d ≥ .80) (Cohen, 1988).
Results
Descriptive Characteristics of the Final Matched Comparison Group (N = 1361).
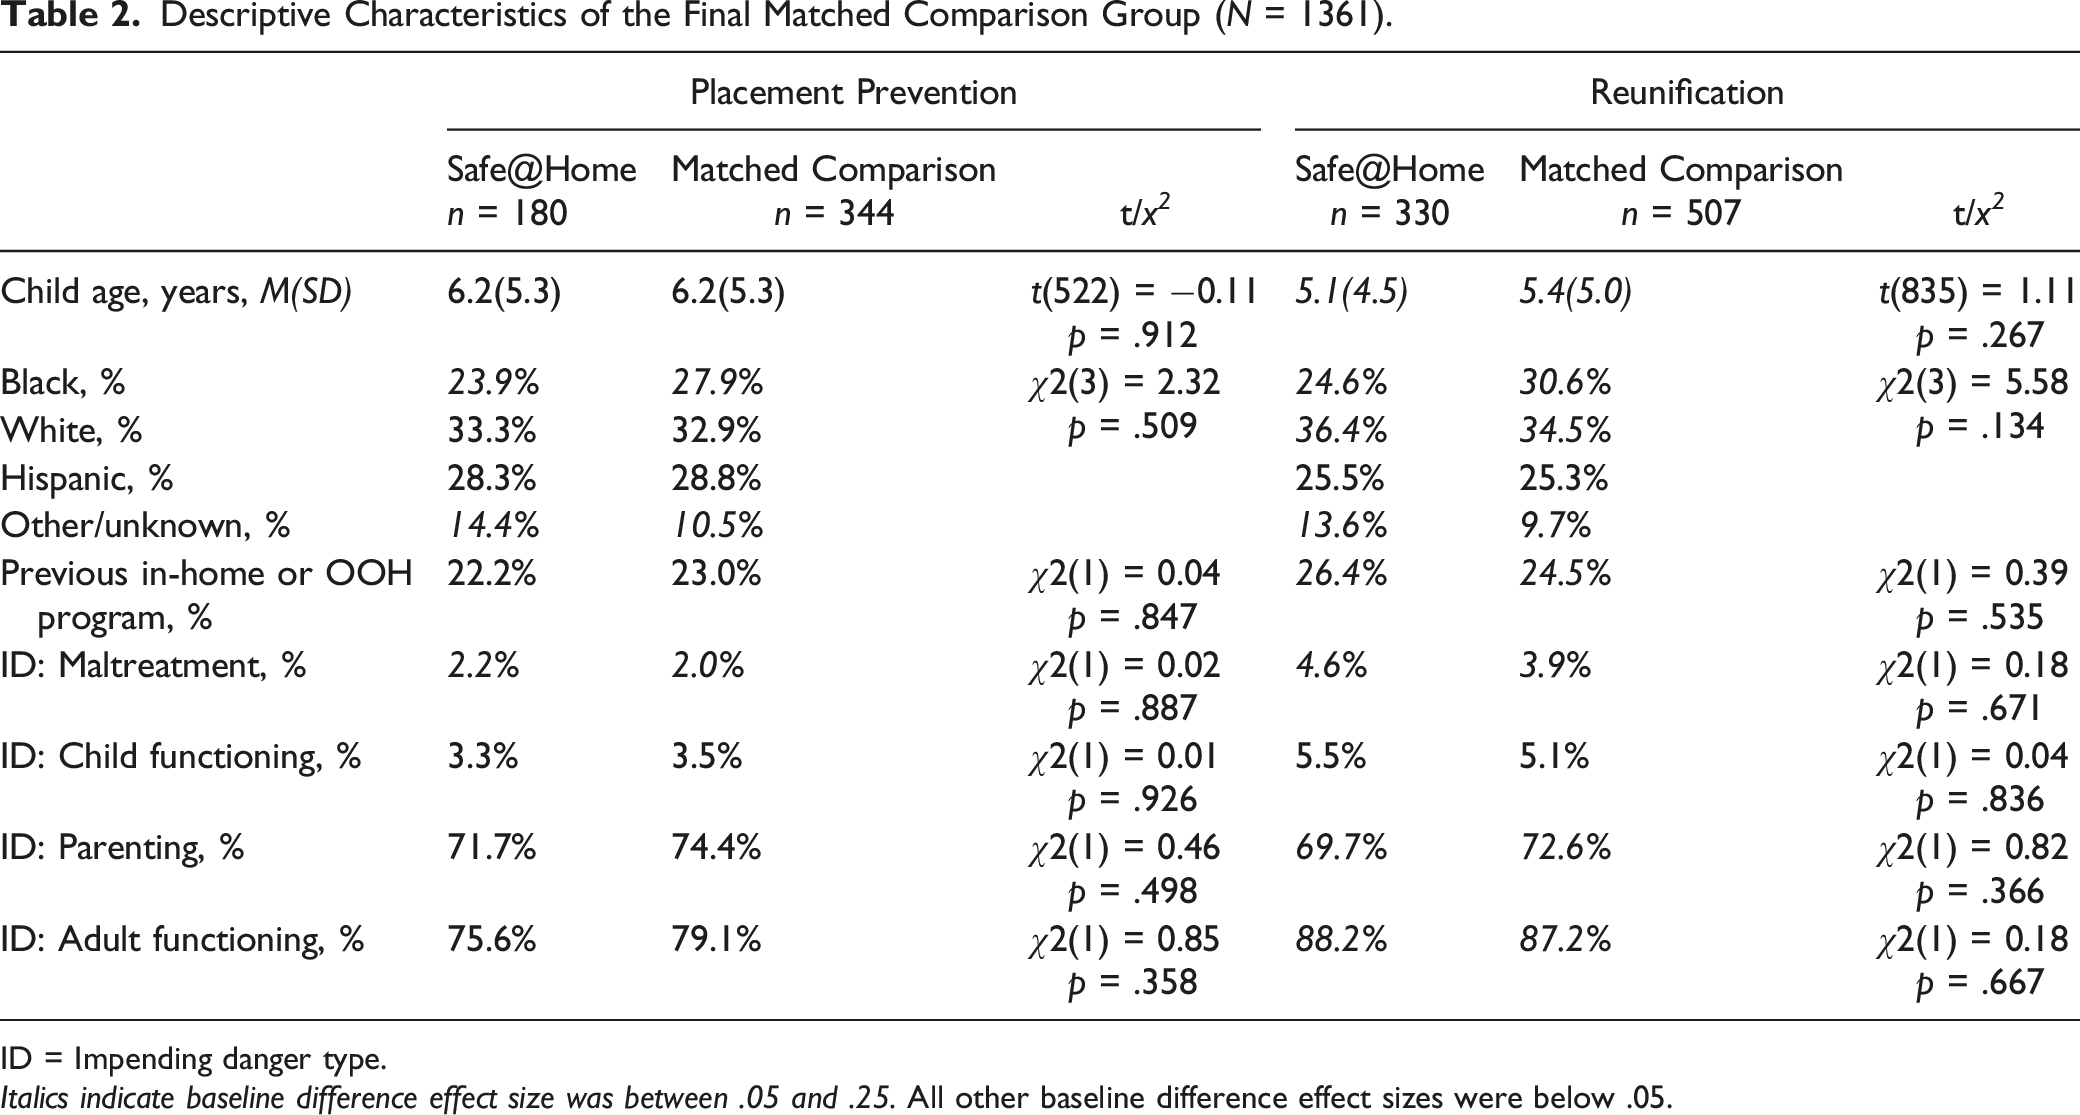
ID = Impending danger type.
Italics indicate baseline difference effect size was between .05 and .25. All other baseline difference effect sizes were below .05.
Summary of Effect Sizes for Significant Outcomes.
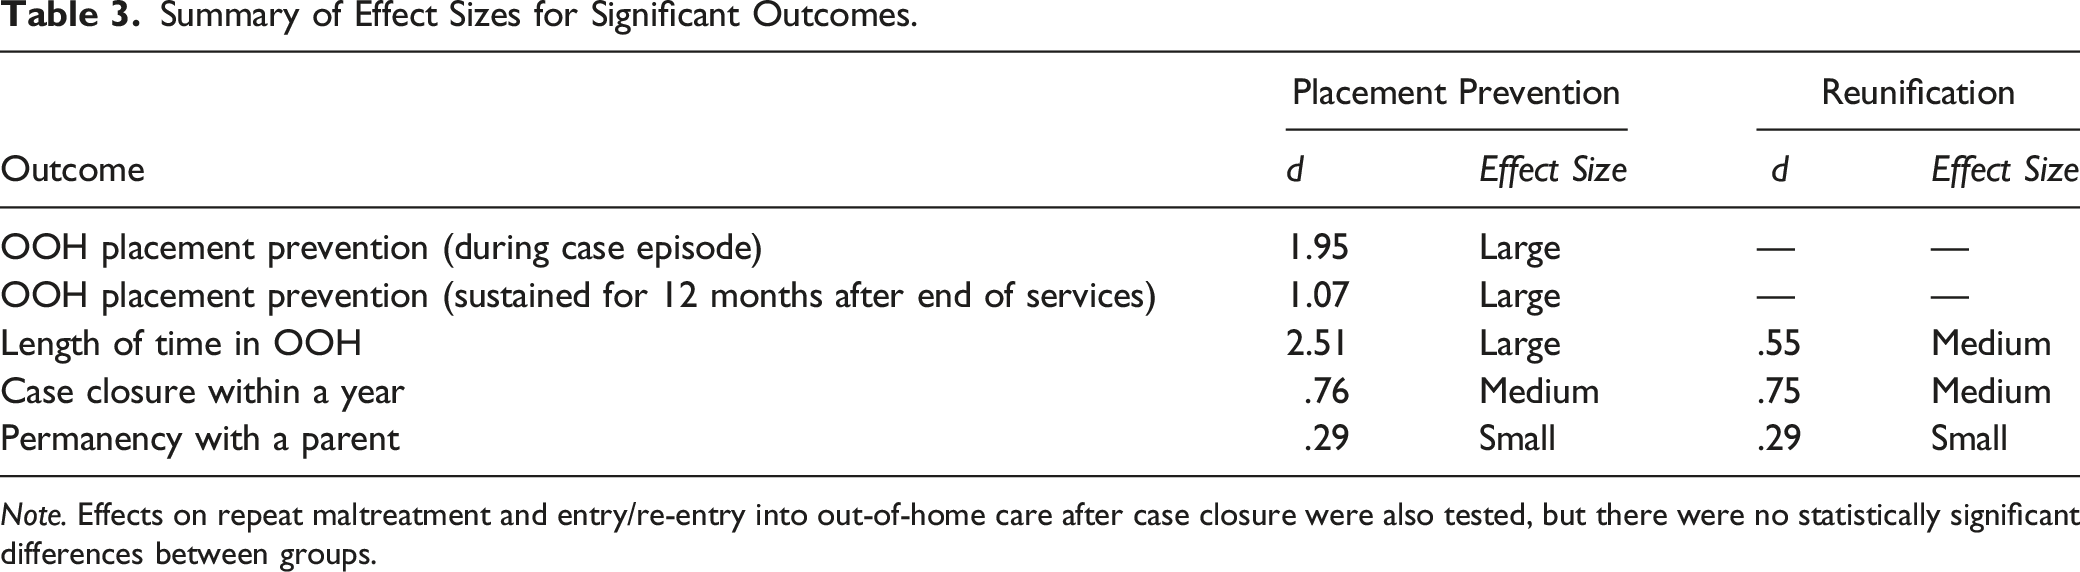
Note. Effects on repeat maltreatment and entry/re-entry into out-of-home care after case closure were also tested, but there were no statistically significant differences between groups.
Prevention of Out-of-Home Placement and Sustained Effect 12 Months After the End of Services
Of children in the Safe@Home Placement Prevention group, 21% (n = 37) were placed in out-of-home care during their child welfare case, compared to 84% (n = 289) of children in the comparison group. Logistic regressions showed that the odds of being placed in out-of-home care were 96% lower in the Safe@Home Placement Prevention group relative to the comparison group (OR: 0.04 [95% CI: 0.02 to 0.07, p < .001). Children who were older, and Hispanic or of other/unknown race (relative to white) had lower odds of being placed out of home. Impending dangers related to adult functioning and parenting at case start were associated with higher odds of being placed out of home (Table A2 in Supplemental Material).
Within the 12-month follow-up period after the end of Safe@Home services, 22% (n = 39) of children in the Safe@Home Placement Prevention group had spent one or more days in an out-of-home placement. In contrast, 61% (n = 210) of children in the comparison group had spent one or more days in out-of-home placements in their 12-month follow-up period. Logistic regressions showed that the odds of experiencing an out-of-home placement during the 12-month follow-up period were 83% lower in the Safe@Home Placement Prevention group relative to the comparison group (OR: 0.17 [95% CI: 0.11 to 0.26], p < .001). Being Hispanic or of other/unknown race and being older were associated with lower odds of out-of-home placement in the follow-up period, while impending dangers related to adult functioning and parenting at case start were associated with higher odds. (Table A3). Two other approaches with variations in the parameters used to extrapolate the comparison group’s follow-up period are described in the Supplementary Material and showed remarkably consistent results (Tables A4 and A5).
Length of Time in Out-of-Home Care
On average, children in the Safe@Home Placement Prevention group spent 55 days in out-of-home care within the first year of their ongoing child welfare case, compared to 221 days for children in the comparison group (distributions are shown in Figure 1a). A Tobit regression showed that receiving Safe@Home for Placement Prevention significantly reduced the amount of time spent in out-of-home care (p < .001). The model predicted that Safe@Home reduced time in out-of-home care by 356 days (in an uncensored dataset). Older child age and other or unknown race were associated with reduced time in out-of-home care, while impending dangers related to adult functioning and parenting at case start were associated with increased time in out-of-home care (Table A6). Days in out-of-home care within the first year of the child welfare case for the group. (a) Safe@Home Placement Prevention group and Comparison group (n = 524) (b) Safe@Home Reunification group and Comparison group (n = 837).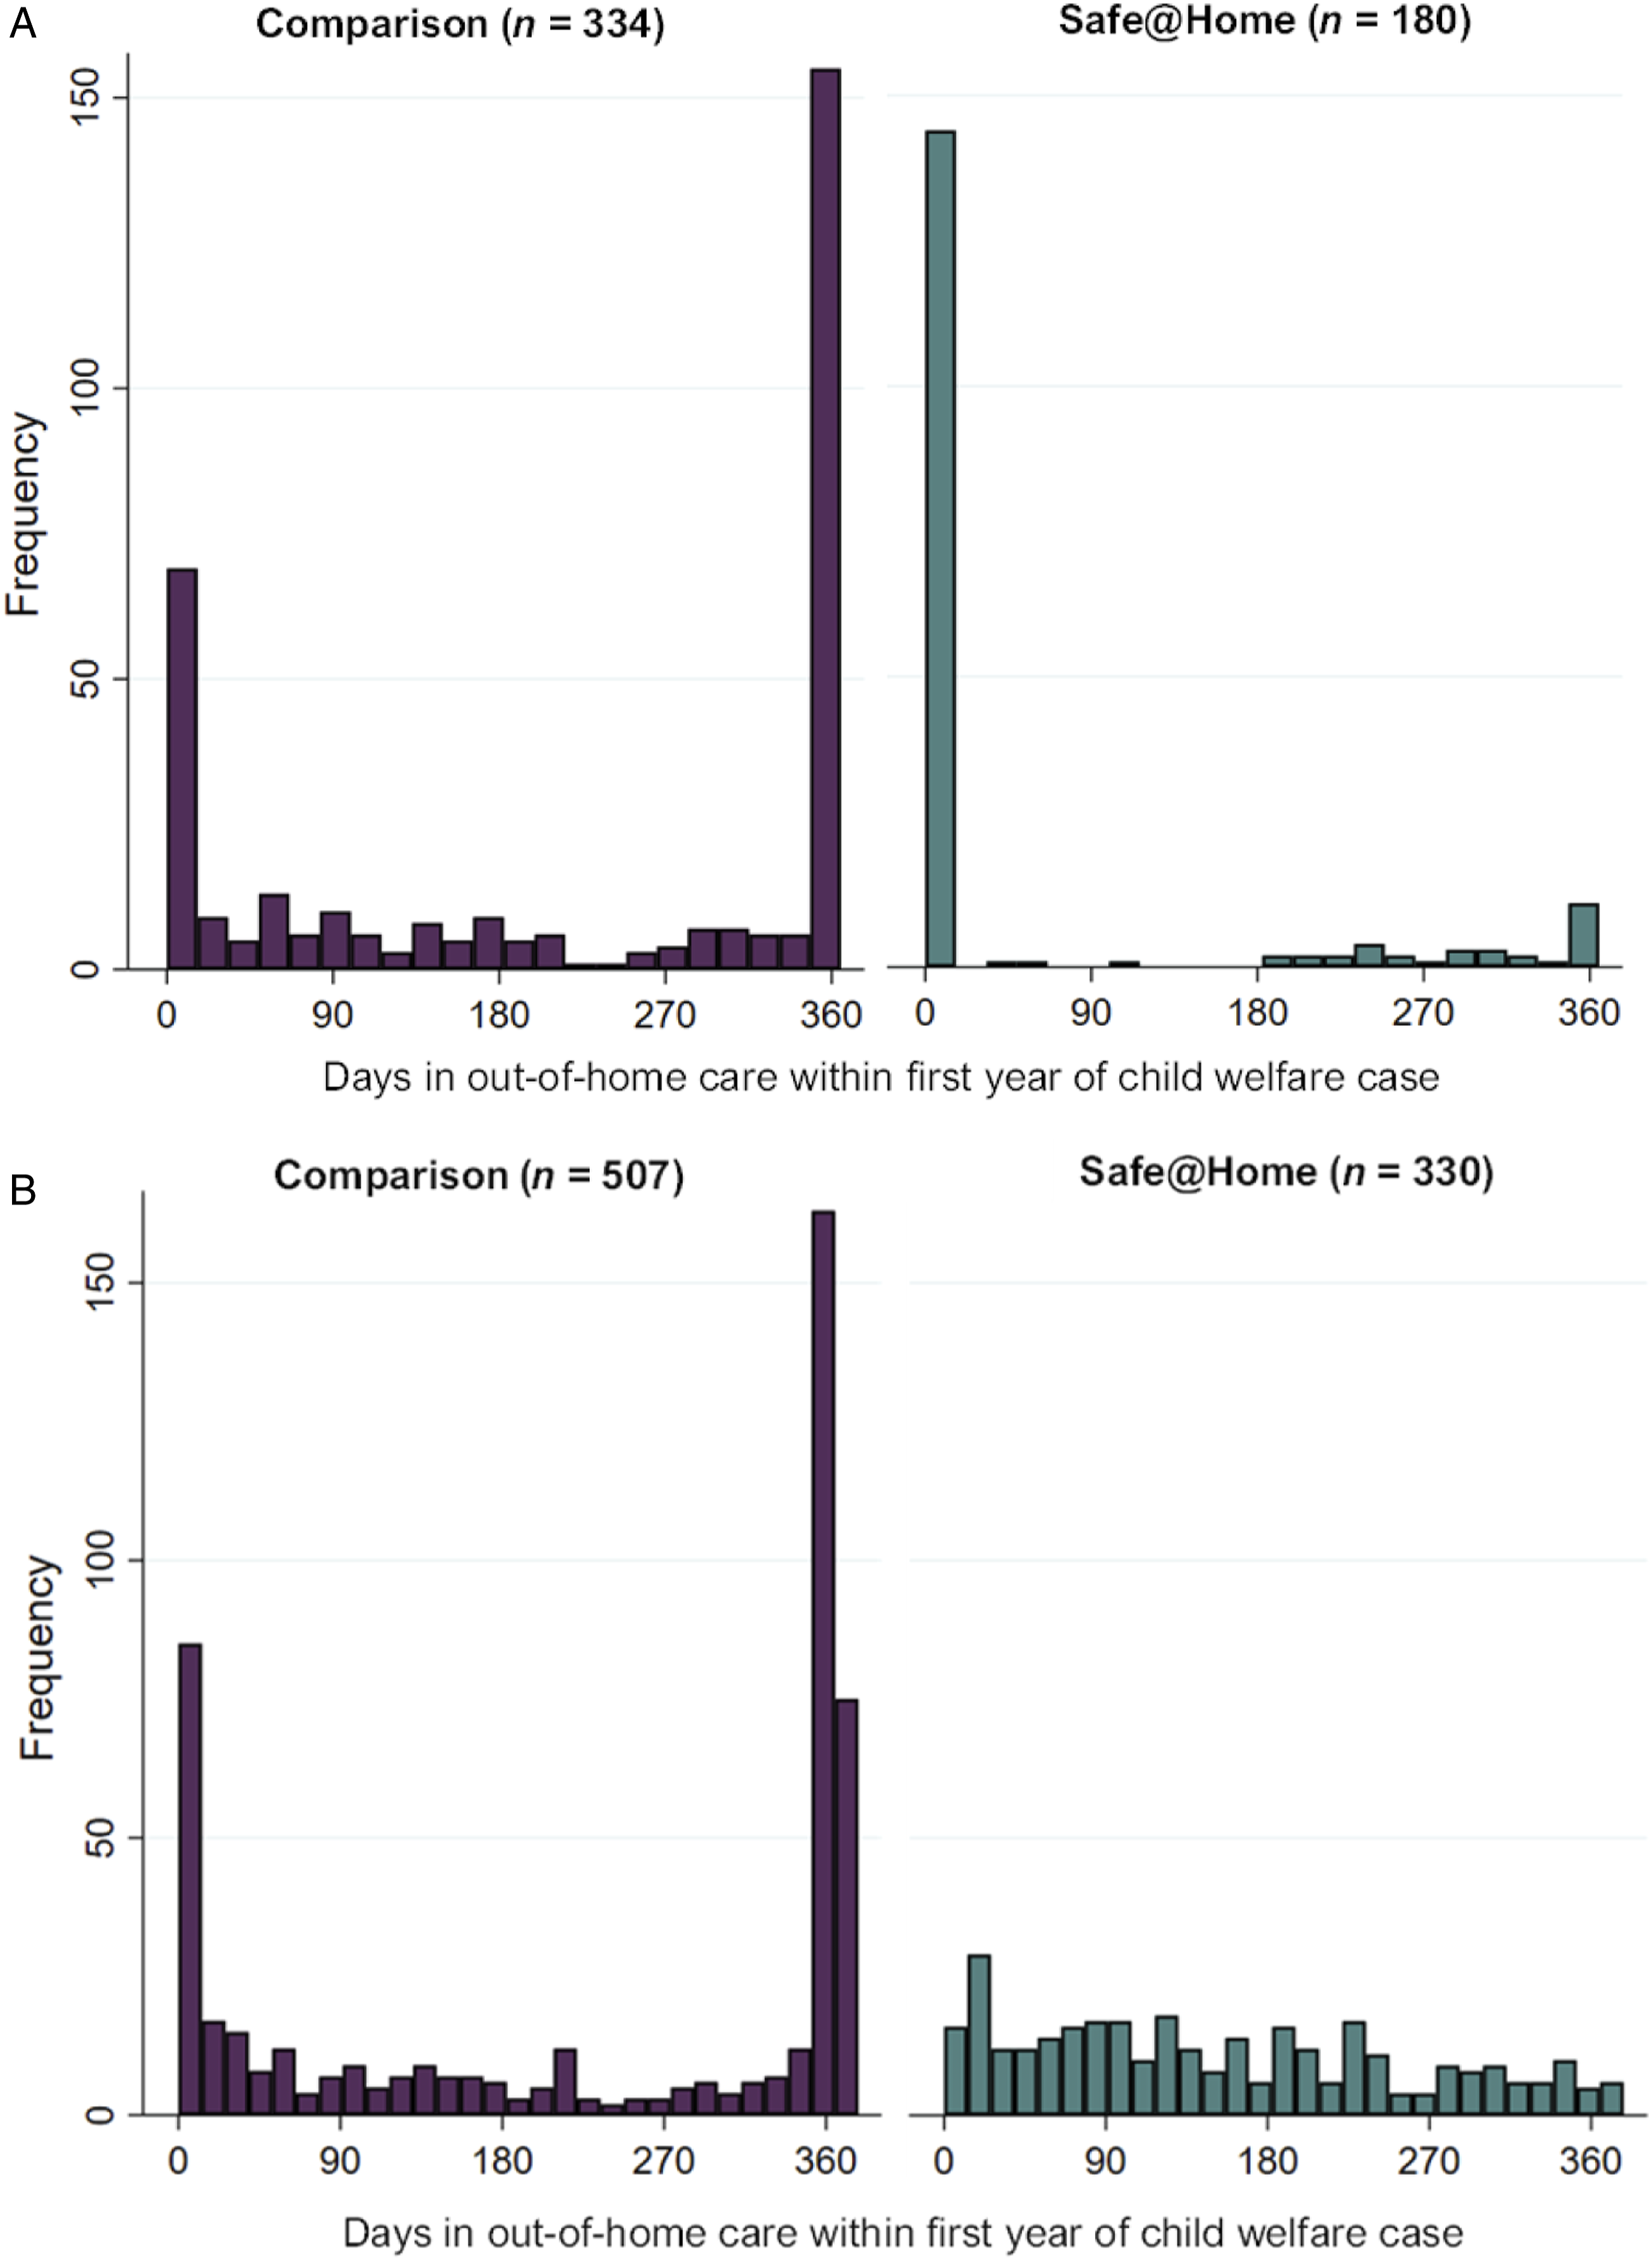
Children in the Safe@Home Reunification group spent, on average, 153 days in out-of-home care within the first year of their child welfare cases, compared to 228 days for children in the matched comparison group (distributions are shown in Figure 1b). Receiving Safe@Home for reunification significantly reduced the amount of time spent in out-of-home care (p < .001). Safe@Home was predicted to reduce time in out-of-home care by 75 days (in an uncensored dataset). Impending dangers related to parenting and adult functioning at case start were associated with increased time in out-of-home care (Table A7).
Time to Case Closure
Although most cases had closed at the end of this study’s data collection period (June 30, 2020), a small percentage (<5%) of the total sample still had open cases at that time. Of children in the Safe@Home Placement Prevention group, 74% (n = 134) had closed within a year of the start of the child welfare case, whereas 47% (n = 160) of the matched comparison children’s cases had closed in the same amount of time. A logistic regression showed that the odds of case closure within a year were 3.5 higher for children who received Safe@Home relative to the comparison group (OR: 3.48 [95% CI: 2.30 to 5.27], p < .001). Older child age and Black or other/unknown race were associated with higher odds of case closure within a year, whereas impending dangers related to parenting and adult functioning at case start were associated with lower odds (Table A8).
Of children in the Safe@Home Reunification group, 72% (n = 236) had closed within the first year of their child welfare case, compared to 43% (n = 218) of children in the comparison group. The odds of case closure within a year were 3.4 times higher for the Safe@Home group relative to the comparison group (OR: 3.45 [95% CI: 2.54 to 4.67], p < .001). Older child age was associate with higher odds of case closure within a year, whereas impending dangers related to adult functioning and parenting at case start were associated with lower odds Table A9).
Permanency with a Parent
At the time of case closure (or end of the observation period for cases that had not closed, n = 25), 87% (n = 157) of children in the Safe@Home Placement Prevention group achieved permanency with a parent, compared to 53% (n = 182) of children in the matched comparison group. Kaplan-Meier survival estimates for reaching permanency are shown in Figure 2a. A Cox proportional hazards regression confirmed that, on average across all time intervals, children whose families received Safe@Home for placement prevention achieved permanency with their parents at case closure at more than 2.5 times the rate of children in the matched comparison group (HR: 2.56 [95% CI: 2.05 to 3.18], p < .001). Black or other/unknown race were associated with higher rates of permanency, whereas impending dangers related to parenting and adult functioning at case start were associated with lower rates (Table A10). Kaplan-Meier survival estimates for achieving permanency with a parent. (a) Safe@Home Placement Prevention and Comparison Group (n = 524) (b) Safe@Home Reunification and Comparison Group (n = 837).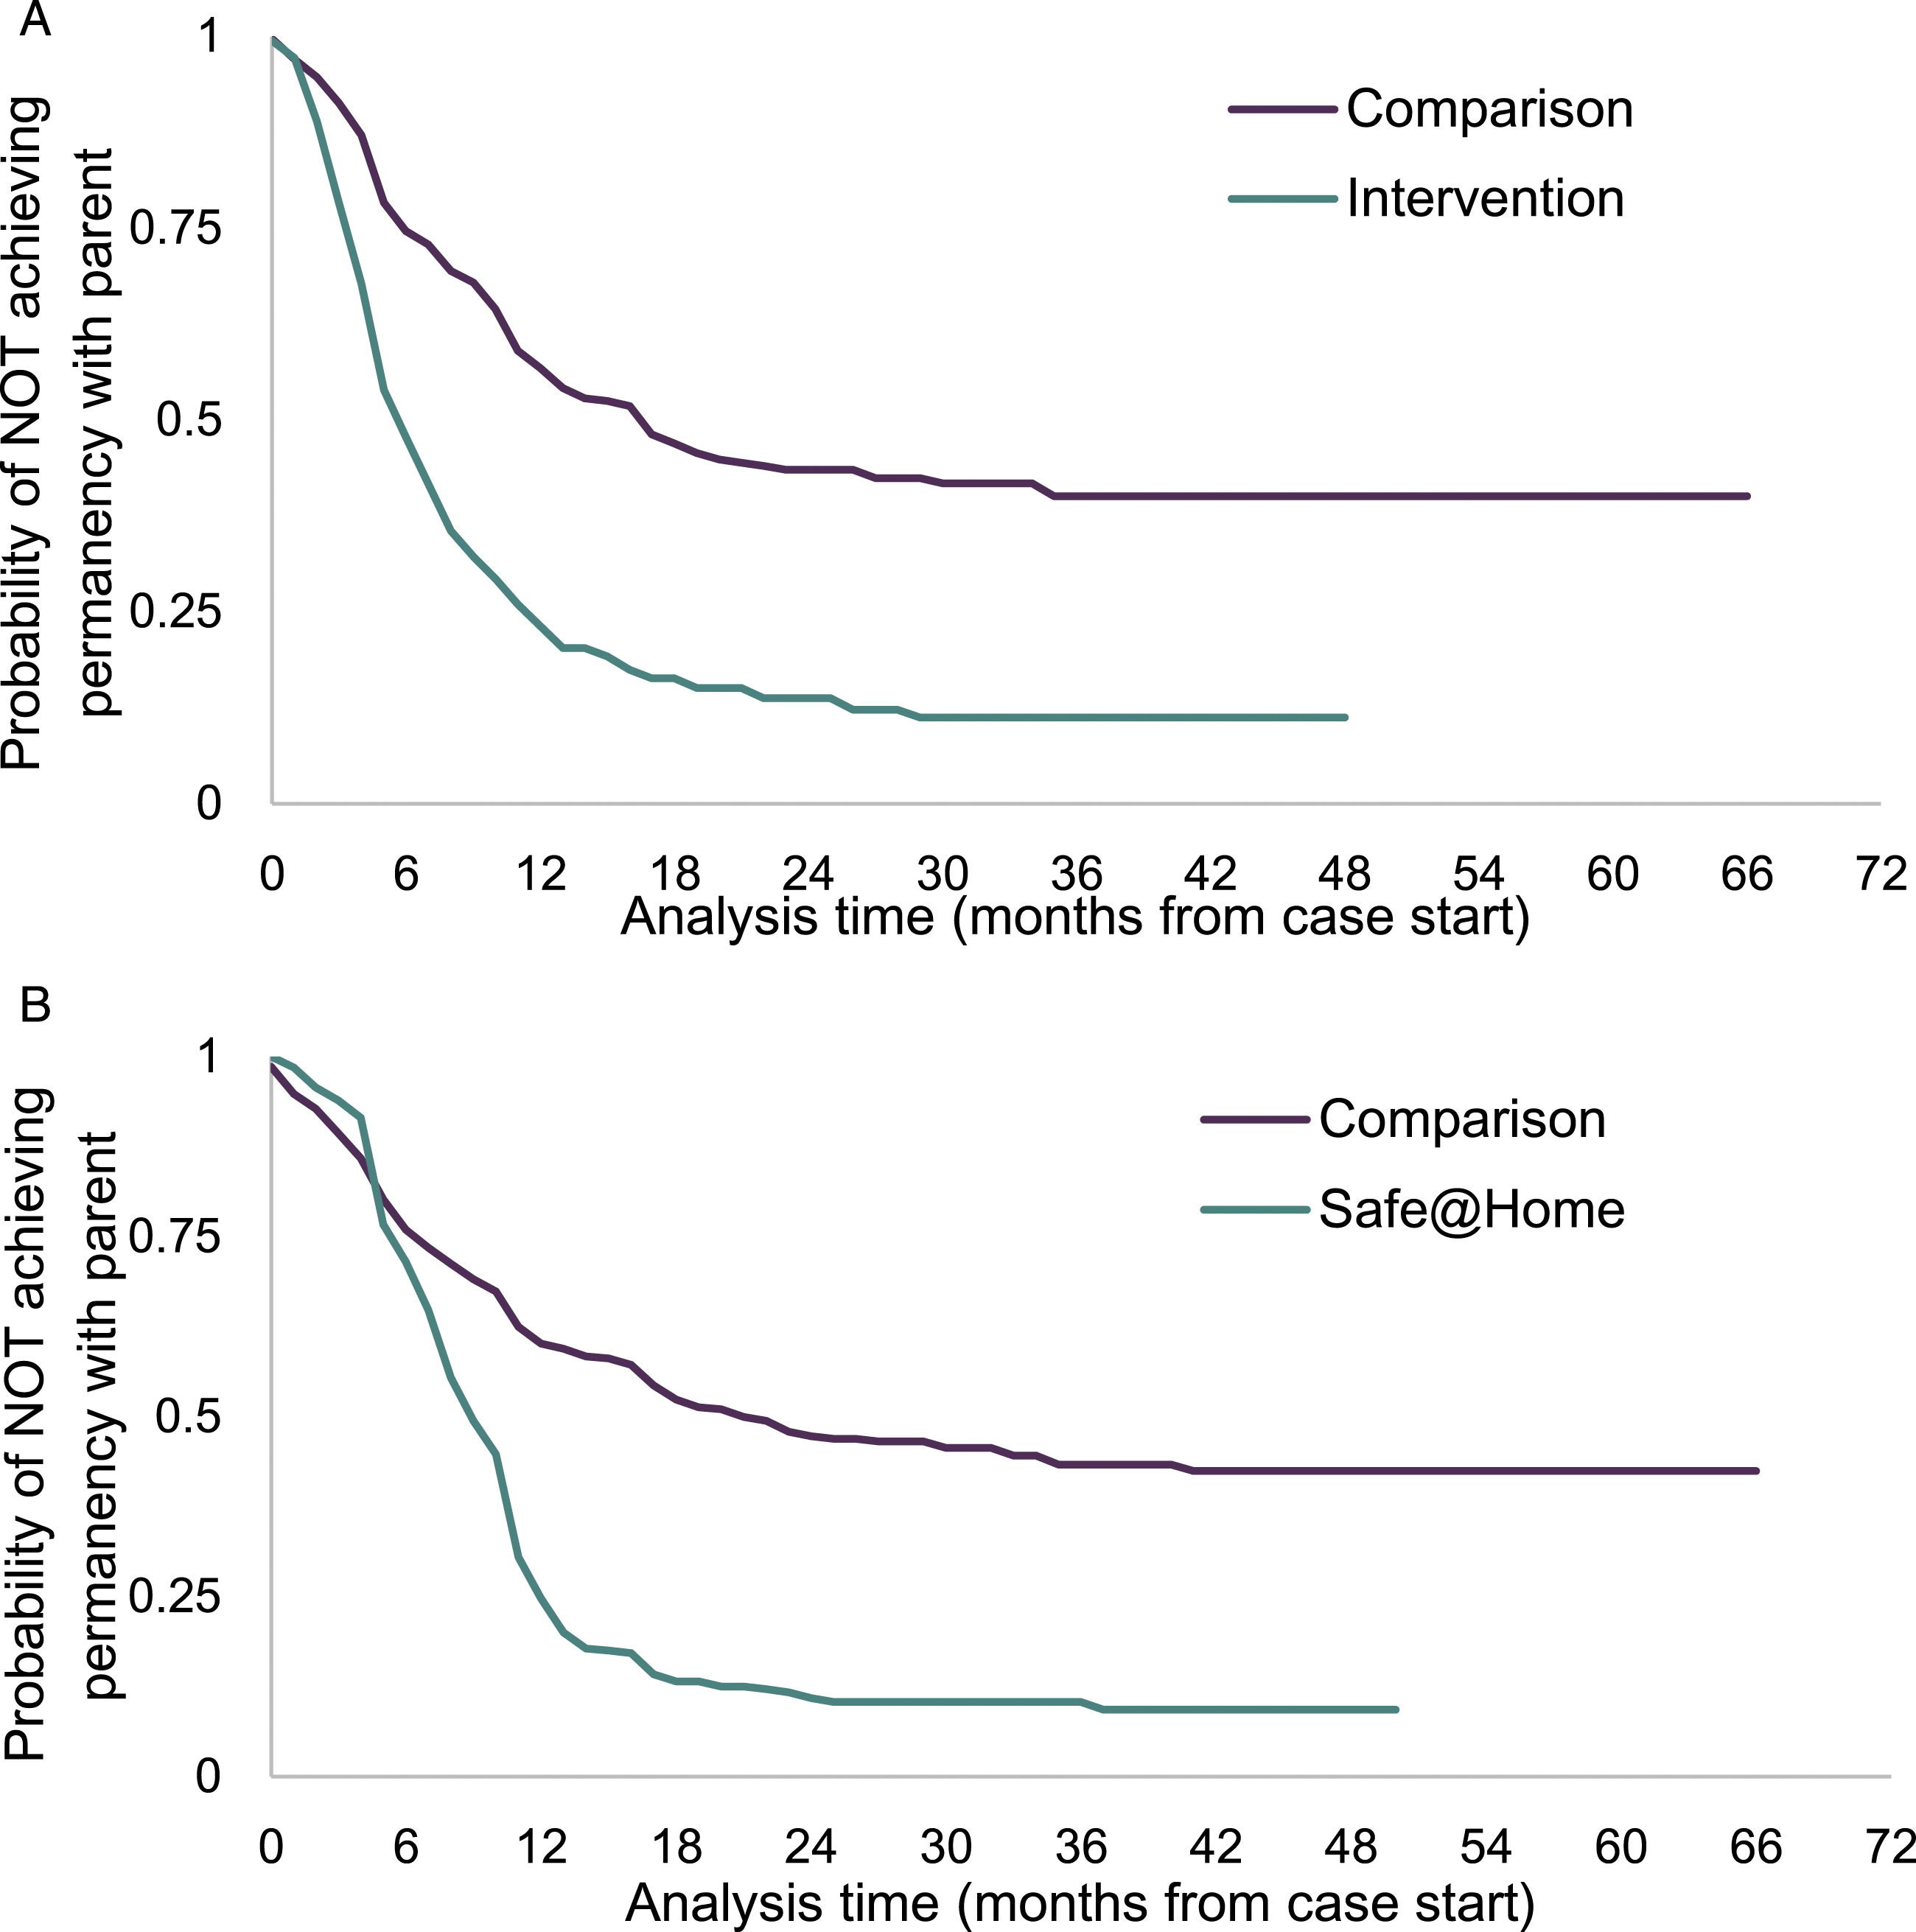
At the time of case closure (or end of the study observation period), most of the children in the Safe@Home Reunification group (88%, n = 290) group achieved permanency with their parents, whereas 50% (n = 254) of children in the matched comparison achieved permanency with a parent.). Kaplan-Meier survival estimates for reaching permanency are shown in Figure 2b. On average across all time intervals, children in the Safe@Home Reunification group achieved permanency with their parents at more than twice the rate of children in the comparison group (HR: 2.41 [95% CI: 2.02 to 2.87], p < .001). Impending dangers related to parenting and adult functioning at case start were associated with lower rates of permanency (Table A11).
No Effect on Repeat Maltreatment or Entry or Re-entry in Out-of-Home Care After Case Closure
There were no statistically significant differences between either of the Safe@Home groups and their respective comparison groups in repeat maltreatment or entry or re-entry into out-of-home care after case closure. For the Safe@Home Reunification group, the strongest predictors of repeat maltreatment and re-entry were having a previous history of child welfare involvement and having accomplished permanency with a parent.
Discussion
This rigorous quasi-experimental study offers strong initial support for average population-level treatment effects of Safe@Home when implemented in the context of the SAFE practice model. Safe@Home demonstrated positive effects in key outcome areas that are important to child welfare systems’ goals of keeping children safe and families together. Results of this study indicate that Safe@Home contributes to placement prevention and permanency for children that are at the most imminent risk for out-of-home placement or already in foster care.
These findings have important implications for child welfare policy and practice. Federal legislation designed to prioritize keeping families together (Family First Prevention Services Act, 2018; FFPSA) affords states the ability to draw federal reimbursement for providing approved evidence-based prevention services to maintain children who are “candidates for foster care” in their homes. However, most of the eligible interventions determined to be promising, supported or well-supported by the Title IV-E Prevention Services Clearinghouse (Title IV-E Prevention Services Clearinghouse, 2021), were designed for primary prevention in populations with broad risk factors (e.g., poverty, substance use, mental health) rather than for the unique circumstances of families with immediate safety threats (Kaye & Reyes, 2021). Findings of this study contribute to filling this gap by building the evidence of a safety management intervention designed specifically for families with the most threatening conditions. This is the first study of Safe@Home designed to meet the evidence standards of FFPSA (see Wilson et al., 2019). The findings suggests that Safe@Home is in line with FFPSA’s priorities of keeping more children with their families and shortening time spent out of home when they are removed.
These findings also have important implications in light of historic and systemic disproportionalities and disparities in child welfare. Children of color experience greater rates of removal and longer placements compared to white children (U.S. Government Accountability Office, 2007; Yi et al., 2020). Some agencies are beginning to implement alternative strategies to traditional child welfare practice to address the specific disproportionalities and disparities in their jurisdictions (Child Welfare Information Gateway, 2021). Future research should further explore Safe@Home implementation in the context of these issues, for example, by assessing whether there are both equitable access to Safe@Home and equitable outcomes for families of color. For all children (regardless of racial or ethnic group), while there was no evidence that Safe@Home reduced rates of repeat maltreatment or (re)entry as hypothesized in the current study, the null findings could suggest that removing children has no added benefit in preventing maltreatment or (re)entry compared to keeping children at home with Safe@Home.
A strength of this study is that the intervention being evaluated was implemented in a complex public child welfare system. Conducting the study in a “usual practice setting” increases its ecological validity (Petersen et al., 2014) for other child welfare agencies that endeavor to implement the intervention. Evaluating Safe@Home in a large, dynamic, and multi-faceted child welfare system like Clark County also presented practical challenges to aspirations for a tightly controlled research study. Evaluators of child welfare interventions must understand, control for, and in many cases, accept the potential for unmeasured influences on both practice and outcomes. Transparent discussion about the boundaries of the intervention being studied, potential confounding factors, and design limitations are critical when attempting to build evidence under usual practice conditions.
This evaluation was conducted during a comprehensive change in practice for CCDFS–the implementation of the SAFE practice model. Sampling timeframes ensured that CCDFS decision-making standards about (1) whether to open a case for services and (2) whether to intervene with an in-home or out-of-home safety plan, were based on the “front end” components of SAFE (screening, safety assessment, initial family assessment, safety plan determination) and thus were the same for both the intervention and comparison groups. Like most studies of children and families served by child welfare agencies, however, the estimated impact of Safe@Home implemented by community-based agencies may have been affected by case planning and case contact activities conducted by [BLIND] DFS during Safe@Home implementation, which could not be controlled for in this research design. The potential influence of [BLIND] DFS case practices on study outcomes makes the favorable findings no less promising, but it may limit what can be attributed exclusively to Safe@Home. Model developers at Action for Child Protection believe that Safe@Home can be implemented in conjunction with or outside of the SAFE practice model. The results observed in this study are best understood as the effect of Safe@Home in the context of SAFE.
Limitations
This study offers several contributions to the evidence about Safe@Home, but has limitations, including a retrospective design that relies entirely on administrative data. Analysts optimized internal validity and assured reliable and valid measurement through stringent quality assurance processes. This approach resulted in some excluded cases from the final analysis, which could slightly compromise generalizability. The study was also limited to child and family outcomes that could be examined with available data and does not include analyses of implementation data like fidelity or the hours and categories of services families received.
The study is also limited by its use of a historical comparison group instead of a contemporaneous comparison group. The latter was not feasible due to CCDFS’ rapid county-wide implementation of Safe@Home and the lack of viable cross-jurisdictional comparisons. Within the state of Nevada, Clark County is the is the largest and most urban community with unique social-demographic characteristics and a unique service array, which limit the validity of comparison to other counties in the state. In close consultation with CCDFS' leadership team (which has deep contextual knowledge of child welfare services in the county), the evaluation team determined that the service array, an important contributor to placement and reunification outcomes, had been stable throughout the previous decade. The team determined that a historic within-county comparison group selected from carefully designated timeframes offered the most rigorous test of the intervention compared to services as usual. Analysts matched cases on child and family characteristics to minimize the impact of any trends in types of cases served over the study period.
Future Directions
This study sought to estimate average population-level effects for the purpose of evidence building. It was beyond its scope to examine differences in Safe@Home by subgroups of children and families served. However, the impending danger threats and race/ethnicity variables that were used as statistical controls proved to be significant predictors of several of the outcomes examined. To better understand which children and families might be most effectively served by Safe@Home, future studies should explore differences in outcomes for families with different races and ethnicities and different impending danger threats. Racial disparities are pervasive in child welfare (Rolock, 2011; Shaw et al., 2008), and future studies should examine whether there is equity in access to Safe@Home (i.e., which families are most likely to be referred to Safe@Home) and whether Safe@Home produces equitable outcomes across racial and ethnic groups. Future studies may also want to explore whether other characteristics such as gender and disability status influence outcomes.
The research base about Safe@Home is early in its development. Researchers and practitioners have much to learn about how it works. Caseworkers have discretion about when and how they use Safe@Home. While Safe@Home relies on standardized decision-making criteria, caseworkers apply those criteria in consultation with their supervisors and tailor services to families’ needs and circumstances. The type, frequency, dose, and duration of services can vary across families served. Linking implementation variables to the outcomes of an intervention is critical to understanding and being able to replicate its effects (Kaye et al., 2012). Future studies could explore these factors to describe the implementation of Safe@Home and how it influences outcomes observed in the current study. Additionally, families’ and caseworkers’ perceptions of the intervention and its impact on practice are important perspectives that were outside the scope of this study. Finally, as this study examined the effect of Safe@Home in the context of the SAFE model, future studies of Safe@Home outside of SAFE would be beneficial in understanding the unique impact of Safe@Home.
While outcomes during child welfare case episodes were promising, this study did not observe significant differences in child maltreatment or entry into out-of-home care after child welfare case closure. Maltreatment and placement outcomes after case closure may be more likely to be impacted by the ongoing components of the SAFE model that target long-term behavioral change (Holder, 2021). Several important constructs of the SAFE model could not be measured with child welfare administrative data in the current study. These constructs offer future opportunities for specific tests of proximal outcomes (e.g., enhancement of caregiver protective capacities) that may help to explain Safe@Home’s immediate and longer-term effects.
Conclusions
Both Placement Prevention and Reunification populations of children and families served with Safe@Home achieved improved placement and permanency outcomes relative to matched groups of children served through child welfare “services as usual.” Children served through Safe@Home were less likely to be placed out-of-home, spent fewer days in out-of-home placements, had shorter case durations, and were more likely to achieve permanency with a parent. The placement prevention effect was sustained for 12 months beyond the end of Safe@Home services for the Placement Prevention group. Taken together, these findings suggest that Safe@Home shows promise for child welfare agencies’ goals of keeping families together whenever possible—even for a population of children that has been determined to be unsafe and in need of immediate intervention.
Supplemental Material
Supplemental Material - Impact of Safe@Home on Placement and Permanency Outcomes: Results of a Quasi-Experimental Study
Supplemental Material for Impact of Safe@Home on Placement and Permanency Outcomes: Results of a Quasi-Experimental Study by Lucia Miranda Reyes and Sarah Kaye in Child Maltreatment
Footnotes
Acknowledgement
We, the authors, thank Action for Child Protection for their support and acknowledge that the findings and conclusions presented in this report are ours alone, and do not necessarily reflect the opinions of Action or Clark County Department of Family Services.
Declaration of Conflicting Interests
The author(s) declared no potential conflicts of interest with respect to the research, authorship, and/or publication of this article.
Funding
The author(s) disclosed receipt of the following financial support for the research, authorship, and/or publication of this article: This work was supported by the ACTION for Child Protection.
Supplemental Material
Supplemental material for this article is available online.
References
Supplementary Material
Please find the following supplemental material available below.
For Open Access articles published under a Creative Commons License, all supplemental material carries the same license as the article it is associated with.
For non-Open Access articles published, all supplemental material carries a non-exclusive license, and permission requests for re-use of supplemental material or any part of supplemental material shall be sent directly to the copyright owner as specified in the copyright notice associated with the article.