
Abstract
It is unclear if surveillance bias (increased reports to Child Protective Services [CPS] related to program involvement) has a substantial impact on evaluation of home visiting (HV) prevention programs. We estimated surveillance bias using data from Connecticut’s HV program, birth certificates, CPS, and hospitals. Using propensity score matching, we identified 15,870 families similar to 4015 HV families. The difference-in-differences approach was used to estimate surveillance bias as the change in investigated reports from the last 6 months of program involvement to the next 6 months. The median age of the children at program exit was 1.2 years (range: 60 days, 5 years). We estimated that 25.6% of investigated reports in the HV group resulted from surveillance bias. We reviewed CPS reports of 194 home-visited families to determine if a home visitor made the report and found that 10% were directly from home visitors. Program evaluations should account for surveillance bias.
Reduction of child maltreatment is an important goal of home visiting (HV) programs that provide services to parents (Administration for Children and Families, 2016). Although there is inconsistent evidence from individual studies (Chaiyachati et al., 2018; MacMillan et al., 2009; Matone et al., 2012; Williams et al., 2017), a meta-analysis showed a reduction in substantiated and self-reported child maltreatment reports associated with HV (Chen & Chan, 2016). One reason for inconsistent results may be that evaluation of HV programs is complicated by the potential for surveillance bias: increased reports to Child Protective Services (CPS) due to the presence of a regular observer, namely the home visitor. There is inconsistent evidence that HV reduces injuries in young children, in particular injuries considered to indicate high risk of abuse (Fergusson et al., 2005; Folger et al., 2017; Kitzman et al., 1997; Matone et al., 2018; Matone et al., 2012). Healthcare utilization may be impacted by surveillance bias if home visitors help families navigate healthcare systems or encourage care when an injury is observed. This is an important area to investigate because injuries are also used in evaluation of HV programs.
Our focus is on understanding the magnitude of surveillance bias in the context of HV to help ensure appropriate evaluations. Home visiting programs have a wide range of goals to improve the life course of the child and other family members, including reducing child maltreatment by providing families with regular visits that include parenting education, a supportive relationship, and connections to community resources. While there is sufficient evidence of effectiveness to support wide dissemination (Home Visiting Evidence of Effectiveness, n.d.‐a) there is inconsistency in the evidence regarding child maltreatment outcomes (Home Visiting Evidence of Effectiveness, n.d.‐b), possibly due in part to surveillance bias and also due in part to variation in HV program design, including home visitor profession, duration of program, and frequency of visits (Home Visiting Evidence of Effectiveness, n.d.‐c).
Mechanisms and Type of Surveillance Bias
The implications of surveillance bias may depend on the mechanism that leads to it. Surveillance bias may occur either through overreporting in the HV group or underreporting in the control. Overreporting in the HV group would occur if home visitors reported minor problems that would otherwise not be reported. The evidence for overreporting in the HV group is limited. For instance, Green et al. (2017) reported more unsubstantiated reports in the HV group than the control group in a randomized controlled trial (RCT) and inferred that either there was overreporting in the HV group, or CPS workers chose not to substantiate because the family was already engaged in a protective program. Underreporting in the control group would occur if problems occurred that should be reported, but no reporter was aware of them. There is evidence supporting surveillance bias as the result of underreporting in the control group, including two trials in which parental self-reported serious maltreatment was associated with a greater likelihood of a CPS report in the HV group compared to the control group (DuMont et al., 2006; Lee et al., 2018). If surveillance bias is due to underreporting in the control group, this is indicative of control group families not receiving needed services, which is consistent with this group missing the benefits of the HV program. Thus, the primary concern regarding surveillance bias of either mechanism is that it may lead to underestimating the effectiveness of a program and therefore affect decisions regarding dissemination or continued use of a program. Although surveillance bias impacts all reports (investigated or not), it is important to consider CPS investigated reports because the rate of these investigated reports is a benchmark in the Maternal, Infant, and Early Childhood Home Visiting (MIECHV) program (Home Visiting Evidence of Effectiveness), which provides federal funding to programs, and continued funding to programs is dependent on the benchmarks.
Two types of surveillance bias have been discussed in the literature: direct and indirect (Chaffin & Bard, 2006). Direct surveillance bias occurs when the home visitor makes a report that would not have been made in the absence of HV. Indirect surveillance bias occurs when reports are made by someone other than the home visitor but related to the family’s involvement with the HV program, such as a healthcare provider who the family saw only because of a connection made by the program. These concepts are useful to provide insight into the mechanisms of surveillance bias and to compare estimates of surveillance bias produced through different methods.
Detection and Estimation of Surveillance Bias
Several studies on HV, including RCTs, have examined the effects of surveillance bias on study results (Chaiyachati et al., 2018; Duggan et al., 2007; Easterbrooks et al., 2013; Green et al., 2017; MacMillan et al., 2005; Olds et al., 1995). Two RCTs that found no difference in maltreatment outcomes between HV and control groups suggested surveillance bias as an explanation due to significant protective program effects for related measures, such as fewer injuries (Olds et al., 1995) and maternal depression (Easterbrooks et al., 2013). In contrast, two RCTs that also found no difference in maltreatment outcomes between HV and controls discussed surveillance bias, but both concluded that too few cases were reported by program staff to impact the findings (Duggan et al., 2007; MacMillan et al., 2005).
A higher percentage of unsubstantiated reports in the HV group compared to the control group may indicate surveillance bias. In an RCT, Green et al. (2017) found no difference in substantiated reports between HV and control groups, but HV families were more likely to have an unsubstantiated report. Chaiyachati et al. (2018) found no difference in the proportion of HV and control families with investigated reports but a lower proportion of HV families with substantiated reports.
Because HV programs do not always record whether the reporter was the home visitor, estimating surveillance bias is challenging. While these data may be collected at a local HV site level, they are not necessarily transferred to a broader program level, and, therefore, may not be available in datasets used for evaluation. Child protective services data often capture only categories of reporters (e.g., “public social agency”; Chaffin & Bard, 2006). In addition, some home visitors may choose to make a report anonymously (Holland et al., 2021), resulting in some reports not being categorized; although mandated reporters may be required to provide their name, paraprofessional home visitors are not mandated reporters in all states. Therefore, existing data are not available to directly estimate the number of reports made by home visitors in community-based programs. Two RCTs tracked reports made regarding study families. In one trial, 31% of incidents (9 of 29) were reported by a nurse home visitor (MacMillan et al., 2005). In the other, 3% of all reports (3 of 89) were made by paraprofessional home visitors (Duggan et al., 2007). Chaffin and Bard (2006) determined that 24% of reports (1099 of 4486) regarding families in a statewide nurse HV program were made by a “nurse or other health professional,” an indication that the reporter could have been the home visitor. In this and other studies, any report by a home visitor was categorized as surveillance bias because the specific report would not have occurred if the family were not in the program; however, this does not mean a report might not have been made by someone else if the home visitor were not present. The Chaffin and Bard estimate may include some indirect surveillance bias if other nurses or health professionals, who saw the family due to connections made by the program, made reports. The MacMillan et al. and Duggan et al. estimates include only direct surveillance bias as documented by program staff. Relatively small samples of reports in the two clinical trials may also explain some of the variation in point estimates.
Healthcare utilization for injuries also is used to examine whether HV improves the safety of children, including both accidental and abusive injuries. Healthcare utilization for serious injuries is not expected to be substantially impacted by surveillance bias, because most caregivers would seek care in these instances. However, less serious injuries may be impacted by surveillance bias through both direct and indirect mechanisms. Directly, home visitors may encourage or facilitate a healthcare visit after observing an injury. Indirectly, families who have established connections with the healthcare system because of support from HV may be more likely to seek care. Studies on injuries have shown risk reduction for HV children in RCTs (Fergusson et al., 2005; Kitzman et al., 1997), but higher risk for HV children in quasi-experimental designs (Folger et al., 2017; Matone et al., 2018; Matone et al., 2012). A study comparing HV families to propensity-score-matched families found more emergency department (ED) visits for unintentional injuries for HV families from birth to 2 years, but not from 3 to 5 years (Folger et al., 2017). The authors suggested surveillance bias could explain these findings, with those involved in the HV program having increased health-seeking behaviors and/or encouragement from home visitors to seek care (Folger et al., 2017). Similarly, another study of ED visits and hospitalizations found more injuries in the HV group compared to a propensity-score-matched comparison group, which was primarily due to differences in the occurrence of superficial injuries but not injuries with suspicion of child abuse (Matone et al., 2012). In summary, existing evidence suggests that surveillance bias associated with healthcare utilization may exist, but the magnitude has not been estimated.
Estimating the Magnitude of Surveillance Bias in Home Visiting
The few previous studies estimating surveillance bias have limitations, including small sample sizes and dependence on categorizing the reporter in CPS records. Although some have argued against using CPS reports to evaluate HV programs (Howard & Brooks-Gunn, 2009; Mitchell-Herzfeld et al., 2005), investigated reports are used in HV program evaluation by the MIECHV program. Therefore, to improve on the methodologies of previous studies and contribute to the understanding of surveillance bias in HV evaluation, we used two approaches to produce three estimates of surveillance bias in a single sample. By using the same sample for each estimate, we can triangulate to produce a more complete understanding of surveillance bias in this program. The first estimate used a novel application of the difference-in-differences (DID) approach to compare reports to CPS during the last 6 months of program participation to reports during the next 6 months and a comparison group. This approach allowed us to separate the effects of home visitor presence from group membership and to control for changes in CPS reports as the child aged. The second used the same DID approach to examine healthcare utilization for injuries. The third used a review of case-specific narratives of CPS reports to determine if a home visitor was mentioned as a reporter to provide an independent estimate of surveillance bias. The DID approach captured both direct and indirect surveillance bias and included both over- and underreporting mechanisms, while the narrative case review captures only direct surveillance bias and overreporting.
Methods
Sample
We obtained participant data from a Connecticut statewide HV program that used the Parents as Teachers curriculum (n = 7,687, enrolled from 2005 to 2015). Paraprofessional home visitors were supervised by clinical supervisors at sites across the state, the majority of whom had master’s degrees in social work or a related field. This voluntary program’s primary goal was to reduce child maltreatment. Families with first-born infants were recruited during pregnancy or within 3 months of childbirth and screened for maltreatment risk factors using the Revised Early Identification (REID) screening instrument (Chaiyachati et al., 2018; Duggan et al., 2007). Program personnel screened families in all birthing hospitals in the state; families also self-referred or were referred by healthcare providers, social service providers, or others during pregnancy or in the first 3 months after the child was born. From 1999 to 2015, approximately one third of families with first births in the state were screened (Joslyn et al., 2016). High-risk families were offered HV until the child’s fifth birthday, although approximately half of enrolled families dropped out by the child’s first birthday (Joslyn et al., 2016). Participant data included the number of visits attended in each month of involvement. This program provided a large dataset on sites across the state over 11 years.
A two-step process was used to create a comparison group of similar families. First, we linked HV data to state birth certificate data (all first-born children born 2005–2015, n = 174,318) using probabilistic linkage on the mother’s and child’s dates of birth, using child sex, town of residence, and race as secondary variables (n = 5476; years of involvement 2005–15; 68% linked). We used the reclink2 package in Stata, which treats each shared variable as a character string and assigns scores to pairs of observations based on the proportion of matching characters (Wasi & Flaaen, 2015), and manual review when multiple birth certificate records were close matches to an HV record.
The second step in creating the comparison group was to use the first-born children born in Connecticut from 2005 to 2015 (n = 168,842) who were not matched as HV participants as the pool for propensity score matching. We followed procedures similar to those previously reported (Holland et al., 2019) to create a comparison group that was similar to the HV group on demographic and health characteristics. Families in this comparison group were more similar to HV families than the general population of first births and were matched to a specific HV family. This matched comparison group was preferred to the full group of first-time mothers from the unmatched birth certificate dataset because the smaller size was more acceptable to the state agencies providing data from the perspectives of data security and workload, while providing a sufficiently large sample. We used logistic regression to estimate the propensity score, a proxy for the likelihood of being enrolled in the HV program. The model included maternal: race, ethnicity, education, connection with partner (married or father named on birth certificate vs. neither), parity, student status, age, insurance coverage, place of birth (3 categories: outside the US, in a US territory, in a US state); child: single versus multiple gestation, sex, year of birth, birthweight, gestational age; and neighborhood factors: residential stability, concentrated poverty, Hispanic concentration. The neighborhood factors were created by linking census-tract, from the birth certificate data, to neighborhood-level data from the American Community Survey (2005–2009; U.S. Census Bureau, 2009) and then using principal components analysis to reduce the number of variables (Alavi et al., 2020) and create factors that describe the families’ neighborhoods following a previously used approach (Ford & Browning, 2011). We used nearest-neighbor matching (caliper = 0.25 standard deviations) to match first-born children in the birth certificate data with first-born children in the HV data, utilizing Stata’s psmatch2 package (Edwin & Barbara, 2003). Four rounds of propensity score matching resulted in 21,273 comparison children and their mothers, with 5384 HV families having at least one match (98%). The distributions of propensity scores were balanced (Supplemental Figure 1), and there was common support: only one matched comparison group propensity score was outside the range of HV group propensity scores. We used standardized differences to test for balanced covariates. This method produced a comparison group that was well-matched on measured factors, maximized power by being substantially larger than the HV group, and was matched at the individual level. Matching at the individual level allowed us to assign the child’s age of last home visit of the HV group family to the matched comparison group families, which is needed to compare the likelihood of CPS reports, as well as healthcare utilization for injuries, before and after this age. Stata 15 (College Station, TX) was used for data management, linking, and propensity score matching.
Quantitative CPS Data
To determine whether a child in the HV group (n = 5384) or in the comparison group (n = 21,273) was reported to CPS from 2005 to 2019, we used probabilistic linkage with CPS data based on mother and child dates of birth, with names as a secondary variable. Of the 26,657 dyads, 32.2% (8587) had a matched CPS record. All reports from 2011 to 2019 were included, but for the period from 2005 to 2010, some reports had been expunged by the CPS agency. To protect alleged perpetrators, reports that are not substantiated are expunged from the CPS records after five years if there are no substantiations or further reports during the 5-year period. Because we obtained these data after expungement would have occurred, we do not know how many records were expunged. We excluded families who were involved in the HV program for less than 60 days past the child’s birth to increase the likelihood that the CPS reports observed were during the time the home visitor was engaged with the family. Many families were recruited during their birth hospital stay and had four or fewer visits during the first 60 days. The final sample size was 19,885 (HV group n = 4015; comparison group n = 15,870).
The outcomes obtained from the CPS database were reports, investigated reports, substantiated reports, and placements (child removed from parental custody).
Quantitative Healthcare Utilization Data
With the same HV and comparison groups described above (n = 19,885), we linked hospitalization and ED utilization data from the Connecticut Hospital Association as provided by the Department of Public Health (DPH; January 2005 – February 2019). After linkage using a DPH identifier, 99% of children had at least one hospitalization or ED visit, including birth. Using ICD-9 and ICD-10 codes, we used one approach to identify all injuries (Matone et al., 2012) and two approaches to identify possible child-maltreatment-related injuries (Leventhal et al., 2012; Matone et al., 2018). The approach that identified all injuries included many injuries unrelated to maltreatment, which are outside of our primary focus, so we used this approach only for sensitivity analysis. Of the two approaches focused on child-maltreatment-related injuries, the more restrictive one aimed to identify those likely to be the result of child maltreatment (Leventhal et al., 2012) and the other aimed to identify injuries considered at high risk of an association with child maltreatment (Matone et al., 2018). To be classified as likely the result of child maltreatment, abuse, neglect, or assault codes were required. These maltreatment codes were not required for the high-risk definition; some examples of high-risk injuries include long bone or rib fractures, unless caused by a motor vehicle accident, and intracranial hemorrhage if under 2 years old. Because maltreatment codes were not required, the high-risk injury cases could include some accidental injuries. However, we were focused on the differences between two groups, not the absolute number of cases. Prior to the analysis, we chose the high-risk injury approach as our primary outcome because the definition identifying likely maltreatment had only a small number of cases. We included healthcare data only before the child’s third birthday so that each child had the same time frame for exposure and because injury risks vary by age.
Analysis
We used the DID approach for binary outcomes (Warton & Parker, 2018) to estimate surveillance bias during the last 6 months of the family’s program participation compared to the first 6 months after the family exited the program. For comparison families, the child’s age when the matched family exited the program was used. This approach allows us to estimate this change between when the home visitor was present and when the home visitor was not, controlling for expected changes in CPS reporting as children grow older. For this method to be appropriate, the comparison group does not need to be equivalent to the treatment group, but they do need to meet two assumptions: parallel trends (same changes over time) and common shocks (same response to an external perturbation). The parallel trends assumption was tested by comparing the change in investigated reports over time (3-month increments) of HV families who had minimal program exposure (i.e., involved for less than 60 days past the child’s birth) to comparison families using linear regression with an interaction term between time and group; we found no evidence of a violation of this assumption (interaction term p = .74). The assumption of common shocks is not testable; there is no reason to expect a violation in this case, because families in both groups were demographically similar and living in the same state during the same period. We also assumed that any reduction in maltreatment risk due to involvement in the HV program was retained for at least 6 months after exit from the program, an assumption supported by a long-term follow up study (Olds et al., 1997). In the absence of surveillance bias, we would expect the difference in rates of the reports between the HV and comparison groups to be the same during the last 6 months of family program participation and the first 6 months after program exit. In contrast, a significant decrease in reports for the HV families in the first 6 months after program exit, relative to the comparison group, would be consistent with surveillance bias. Absolute surveillance bias as a percentage of families is

And relative surveillance bias, as a percentage of families with reports is
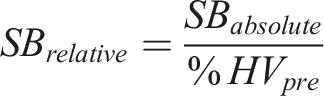
We used a modified Poisson model with an offset for time in the program, which is used for binary outcome data when a relative risk estimate is desired (Zou, 2004). We compared the proportion of families with an investigated report during each period in each group. We chose investigated reports as our primary outcome because this metric is used in HV program evaluation by the federal MIECHV program. We also compared if families had any report (investigated or not), because this outcome was reported in the previous literature on surveillance bias. In addition, we compared the percentage of reports that were investigated in each group for each period using chi-square tests, because differences in this measure have been suggested as evidence of surveillance bias.
We applied the same surveillance bias analysis to the healthcare utilization data. We examined the relative risk of each of the injury categorizations over the course of the first 3 years of the child’s life using a negative binomial model for any injury and a modified Poisson model for the two abuse-related injury categorizations. SAS 9.4 (Cary, NC) was used for all analyses, except as noted.
Simulation
To examine how surveillance bias could potentially impact program evaluation, we used R (version 3.6.3) to conduct a simulation study where we varied the occurrence of surveillance bias from 0 to 70%, in increments of 10%, by reducing the number of events in the HV group during the HV period by the level of surveillance bias. For each value of surveillance bias, we ran 1000 simulations and calculated the average associated relative risks for substantiated reports and child placements. The results provided an indication of how high surveillance bias would have to be for the HV program to show a protective effect for substantiated reports and placements.
Survival Analysis
As a secondary aim, we examined the time to the first CPS report (investigated or not) and if time to report was associated with either severity (placement) or risk (family risk score) at the first report to test the hypothesis that surveillance bias may serve a protective function by beginning CPS involvement earlier for a lower risk situation and, therefore, reducing the child’s likelihood of a more severe incident occurring later. The family risk score was assigned by the CPS worker at the time of the report, was based on the Structured Decision Making Family Risk Assessment of Abuse/Neglect® (Children’s Research Center, 2008), and ranges from very low (1) to high (4). We analyzed the time to the first report using survival analysis. Two additional survival analysis models were run to test an interaction between HV enrollment and either placement or family risk score assessed at the first report. The proportional hazards assumption was met for all survival analyses.
Sensitivity Analysis
We conducted five sensitivity analyses. First, to test the influence of choosing a 6-month window, we repeated the analyses using 3-month and 12-month windows before and after program exit. Second, we included stratified analyses of exit before 6 months of age or continued involvement until the child was at least 6 months old because many families exit the program early. This exit may be associated with a CPS report; early exit would reduce the opportunity for reports in the 6-month window. Third, to determine if the “dose” of the HV program impacted the relative risk for investigated reports, we adjusted for the number of home visits. Fourth, to determine if reports that were expunged from 2005 to 2010 influenced our findings, we repeated our primary analysis without families who potentially had these reports expunged. Fifth, we repeated the analyses without excluding those who were in the program less than 60 days past the child’s birth (i.e., all possible participants) to test the impact of this exclusion in the primary analysis. In this analysis, we excluded families with no home visits after the child’s birth, because they could not have a CPS report by the home visitor related to this child. The final samples for this analysis were 4555 HV families and 18,009 comparison families.
Narratives of CPS Reports
As an independent estimate of direct surveillance bias from the same HV sample, we randomly chose 214 investigated reports to CPS (10%) from the 2085 HV families who had at least one report during program involvement. For families with more than one report, we randomly chose one report to review. We reviewed the narrative summaries from the intake report to examine if a home visitor or supervisor was recorded as the reporter. We estimated that a subsample of 200 reports would provide a sufficient sample to estimate surveillance bias within 5% (using 24% as the expected value and 95% confidence based on the two studies that independently estimated 24% (Chaffin & Bard, 2006; MacMillan et al., 2005). We also reviewed 50 randomly selected CPS reports (0.7%) from the 6502 comparison group families who had at least one report during the time their matched family was in the program. The purpose of reviewing comparison group families was to determine if home visitors from other programs were mentioned as reporters; for this purpose, a smaller number of reports was required. Of the 264 total eligible reports, 15 could not be reviewed because they were blocked as confidential for reasons, such as being high-profile cases, and six reports were duplicates. The final sample included 243 reports (194 HV and 49 comparison families).
We collected characteristics from each report related to HV involvement, type of allegation, family risk score, and outcomes (e.g., substantiation, placement). One researcher with clinical training abstracted all data at a CPS facility. Our primary outcome was the percentage of reports in which a home visitor or supervisor was the reporter, and this percentage represented direct surveillance bias.
Ethical Considerations
This study was approved by the authors’ Institutional Review Board and the Connecticut state agencies providing data. Linkages were performed within the CPS and DPH data systems.
Results
Demographics of the Full Study Sample by Treatment Group: Home Visited (HV) and Propensity-Score Matched (PS-matched) Comparison Group.
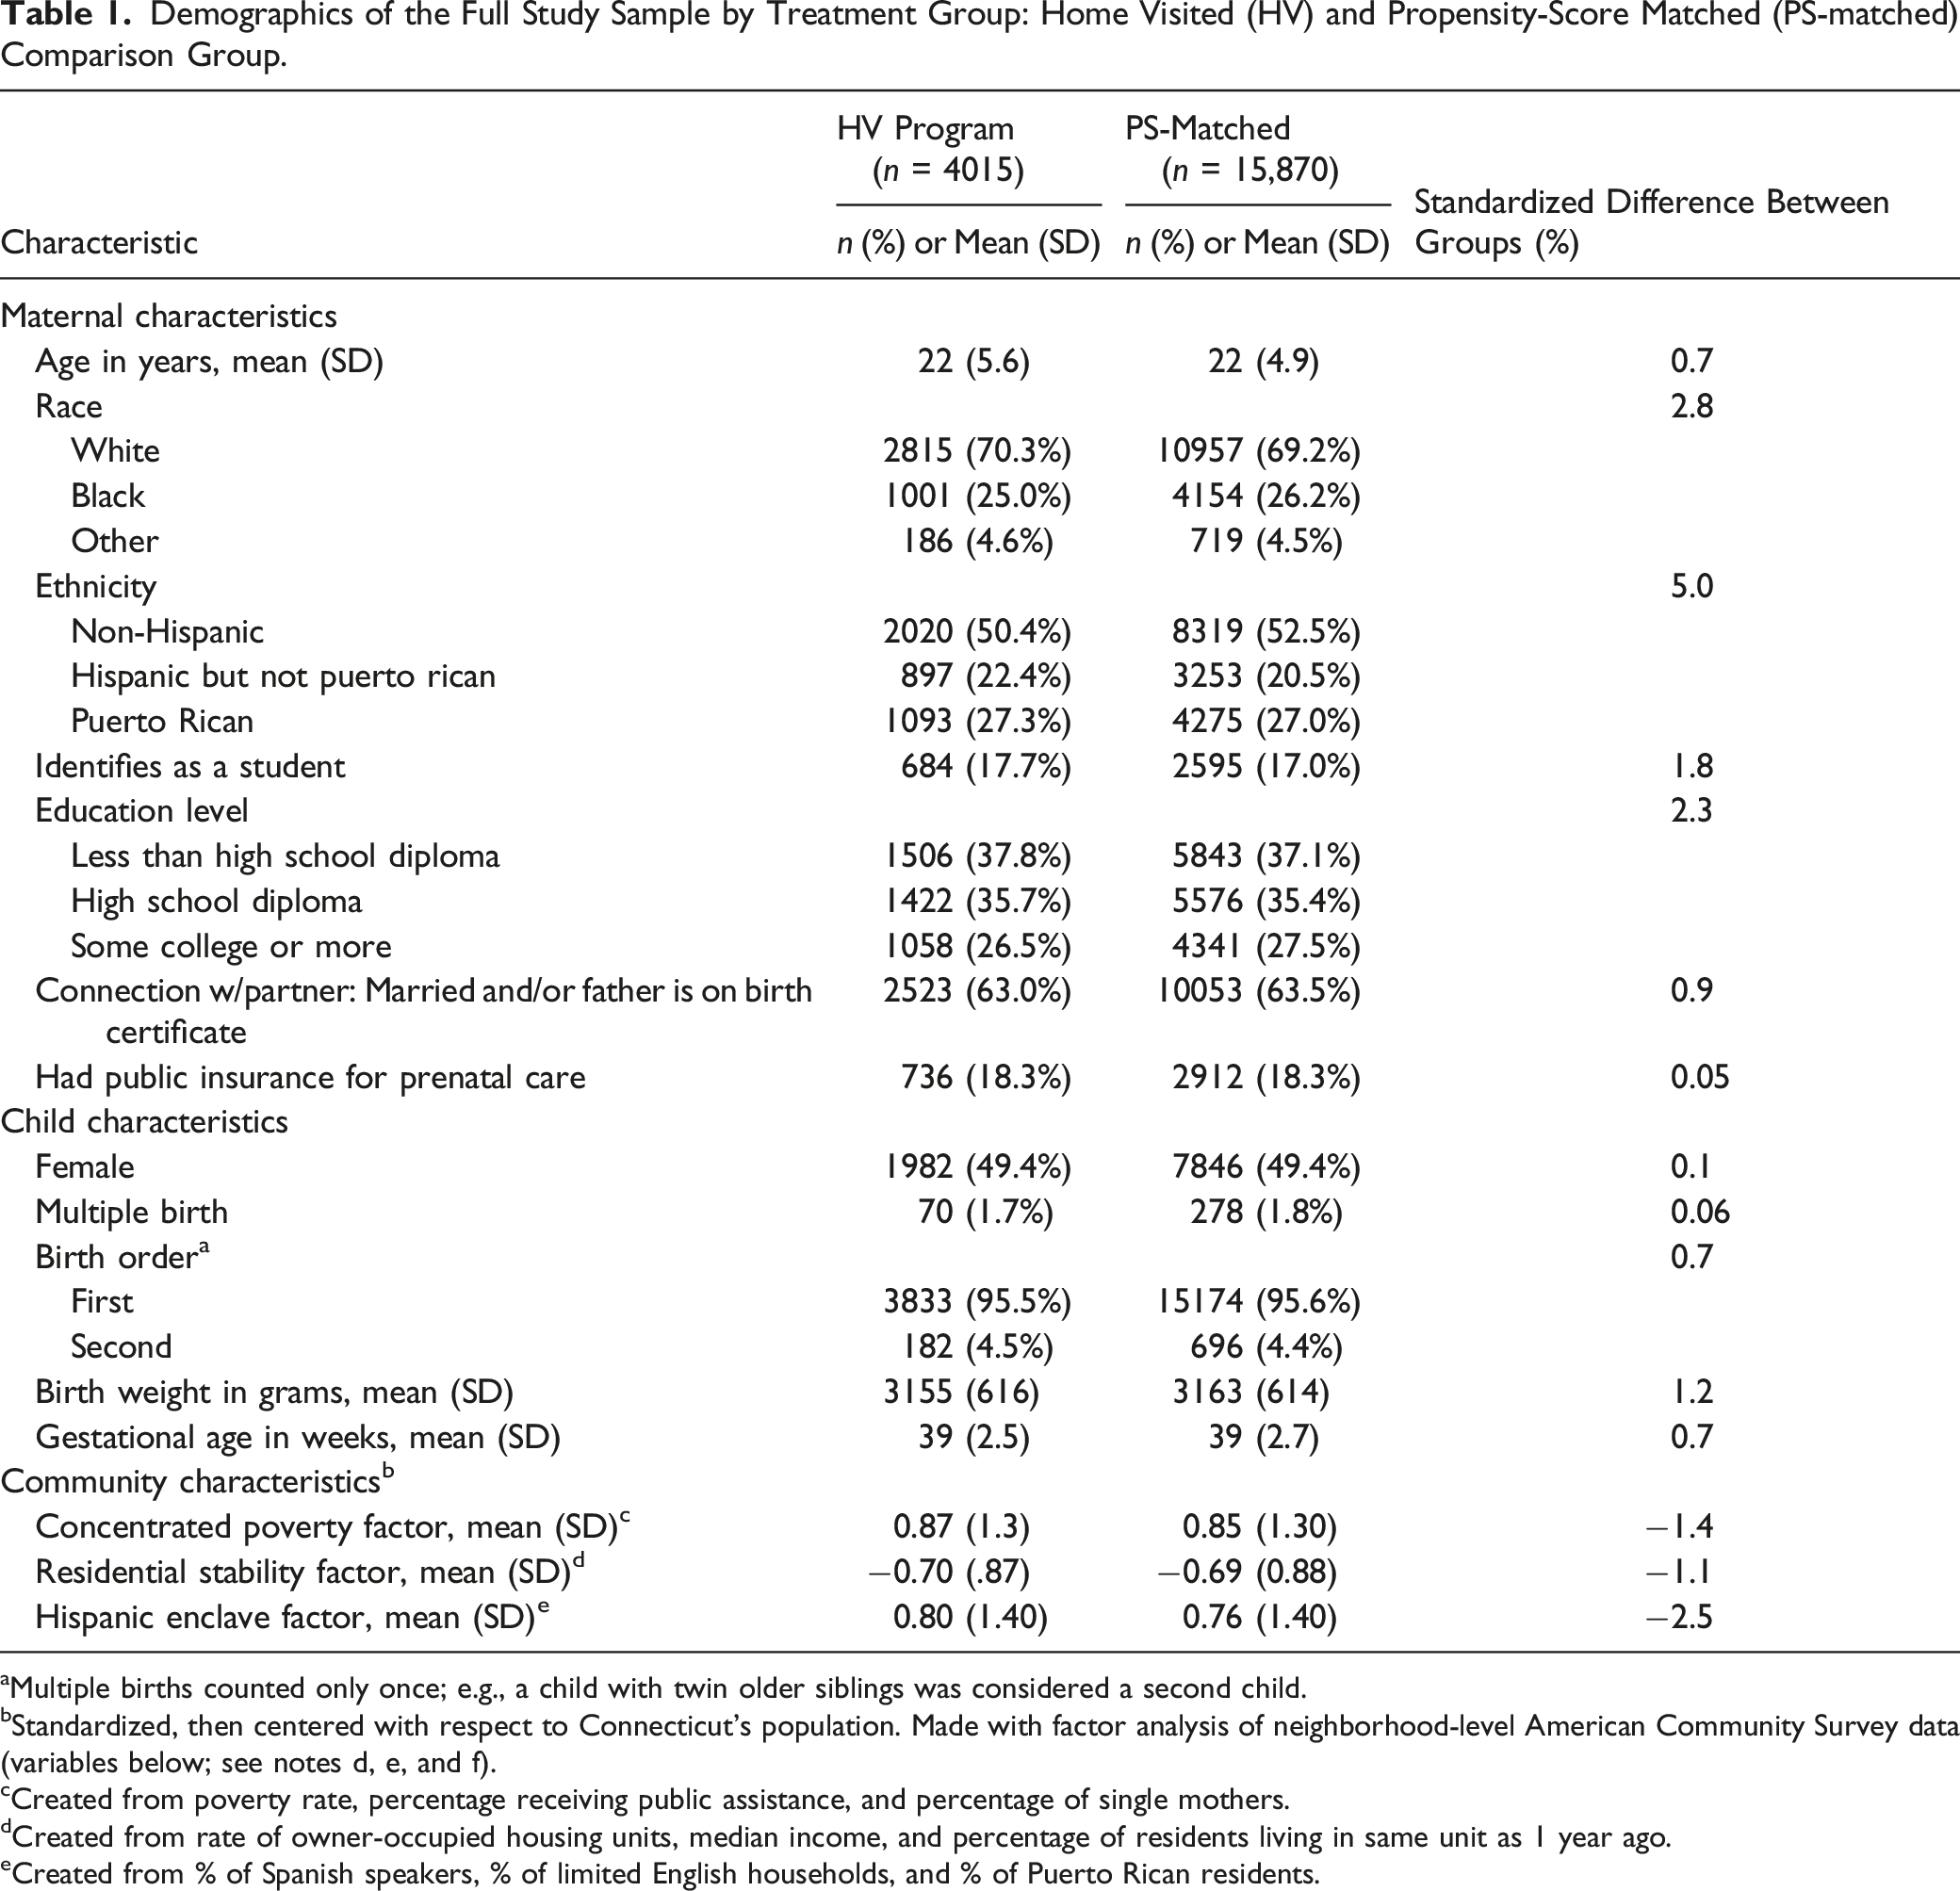
aMultiple births counted only once; e.g., a child with twin older siblings was considered a second child.
bStandardized, then centered with respect to Connecticut’s population. Made with factor analysis of neighborhood-level American Community Survey data (variables below; see notes d, e, and f).
cCreated from poverty rate, percentage receiving public assistance, and percentage of single mothers.
dCreated from rate of owner-occupied housing units, median income, and percentage of residents living in same unit as 1 year ago.
eCreated from % of Spanish speakers, % of limited English households, and % of Puerto Rican residents.
Quantitative CPS Data
Child Maltreatment Outcomes by Treatment Group: Home Visited (HV) and Propensity-Score Matched (PS-matched) Comparison Group.
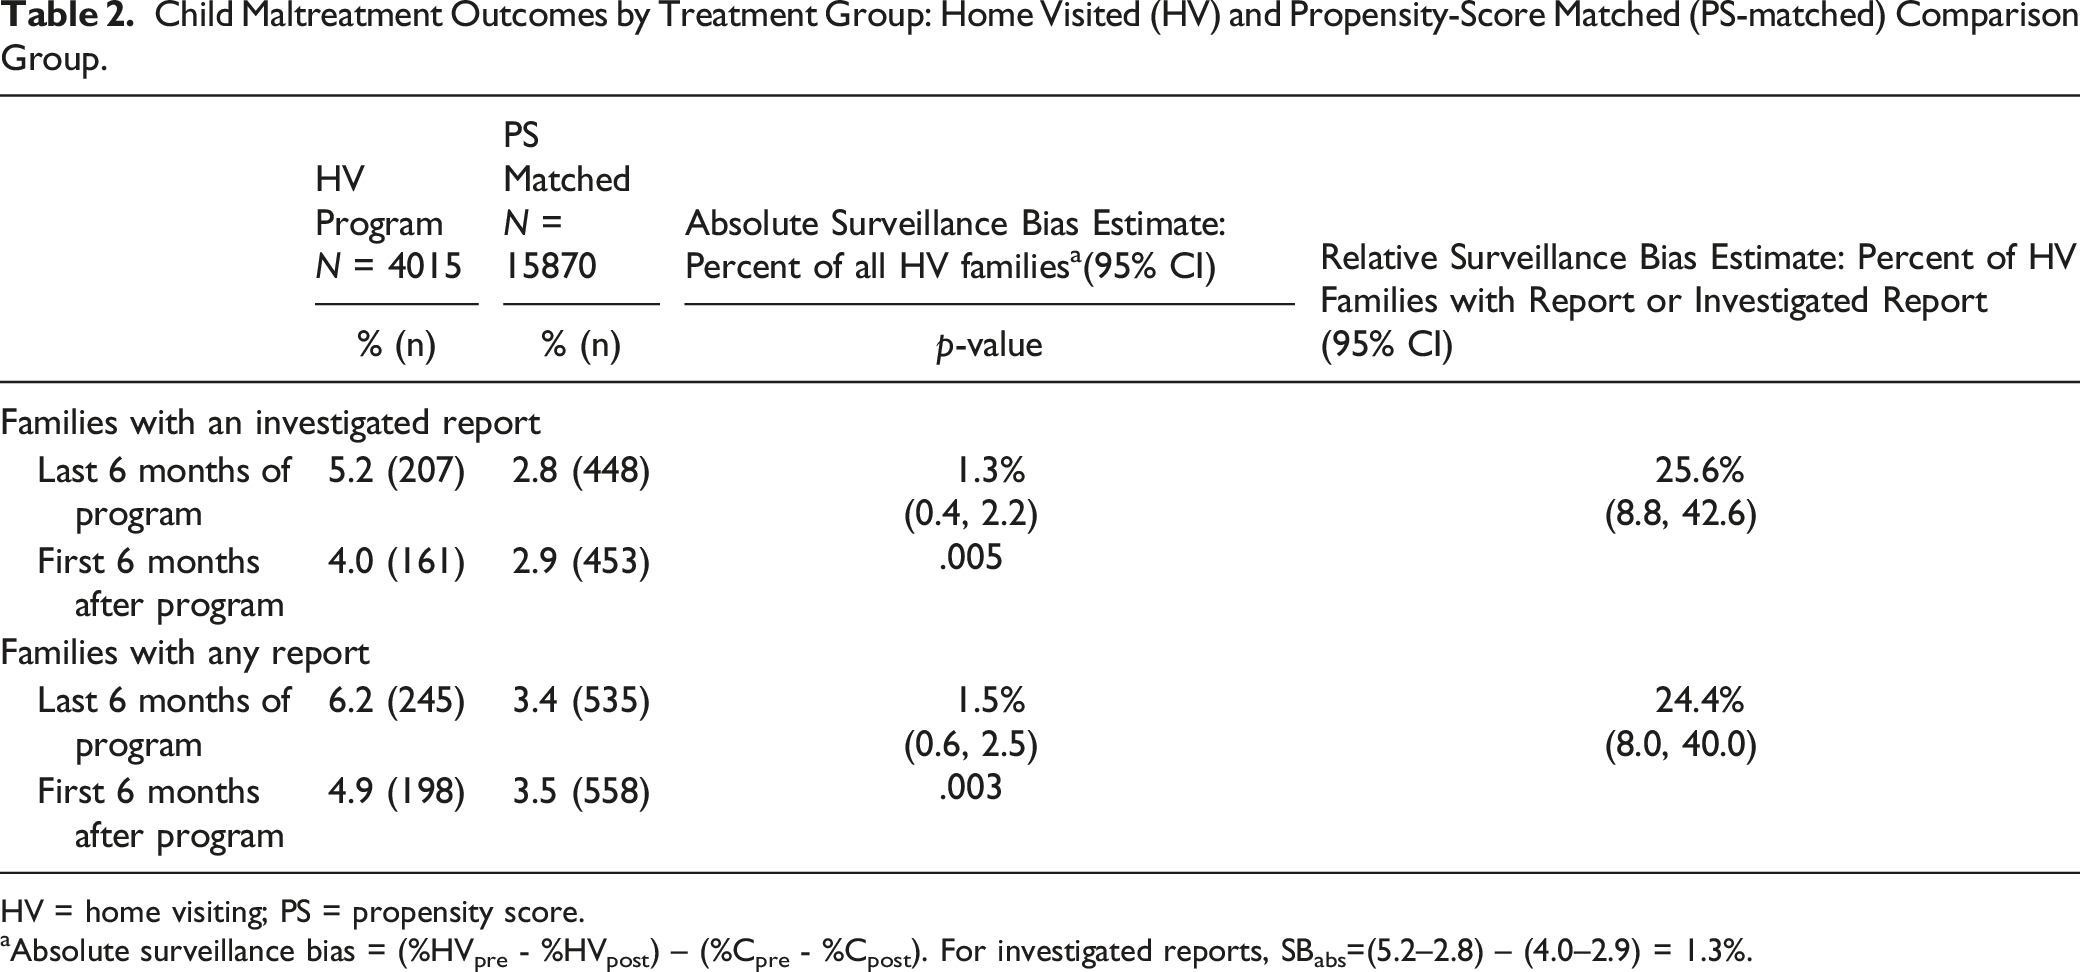
HV = home visiting; PS = propensity score.
aAbsolute surveillance bias = (%HVpre - %HVpost) – (%Cpre - %Cpost). For investigated reports, SBabs=(5.2–2.8) – (4.0–2.9) = 1.3%.
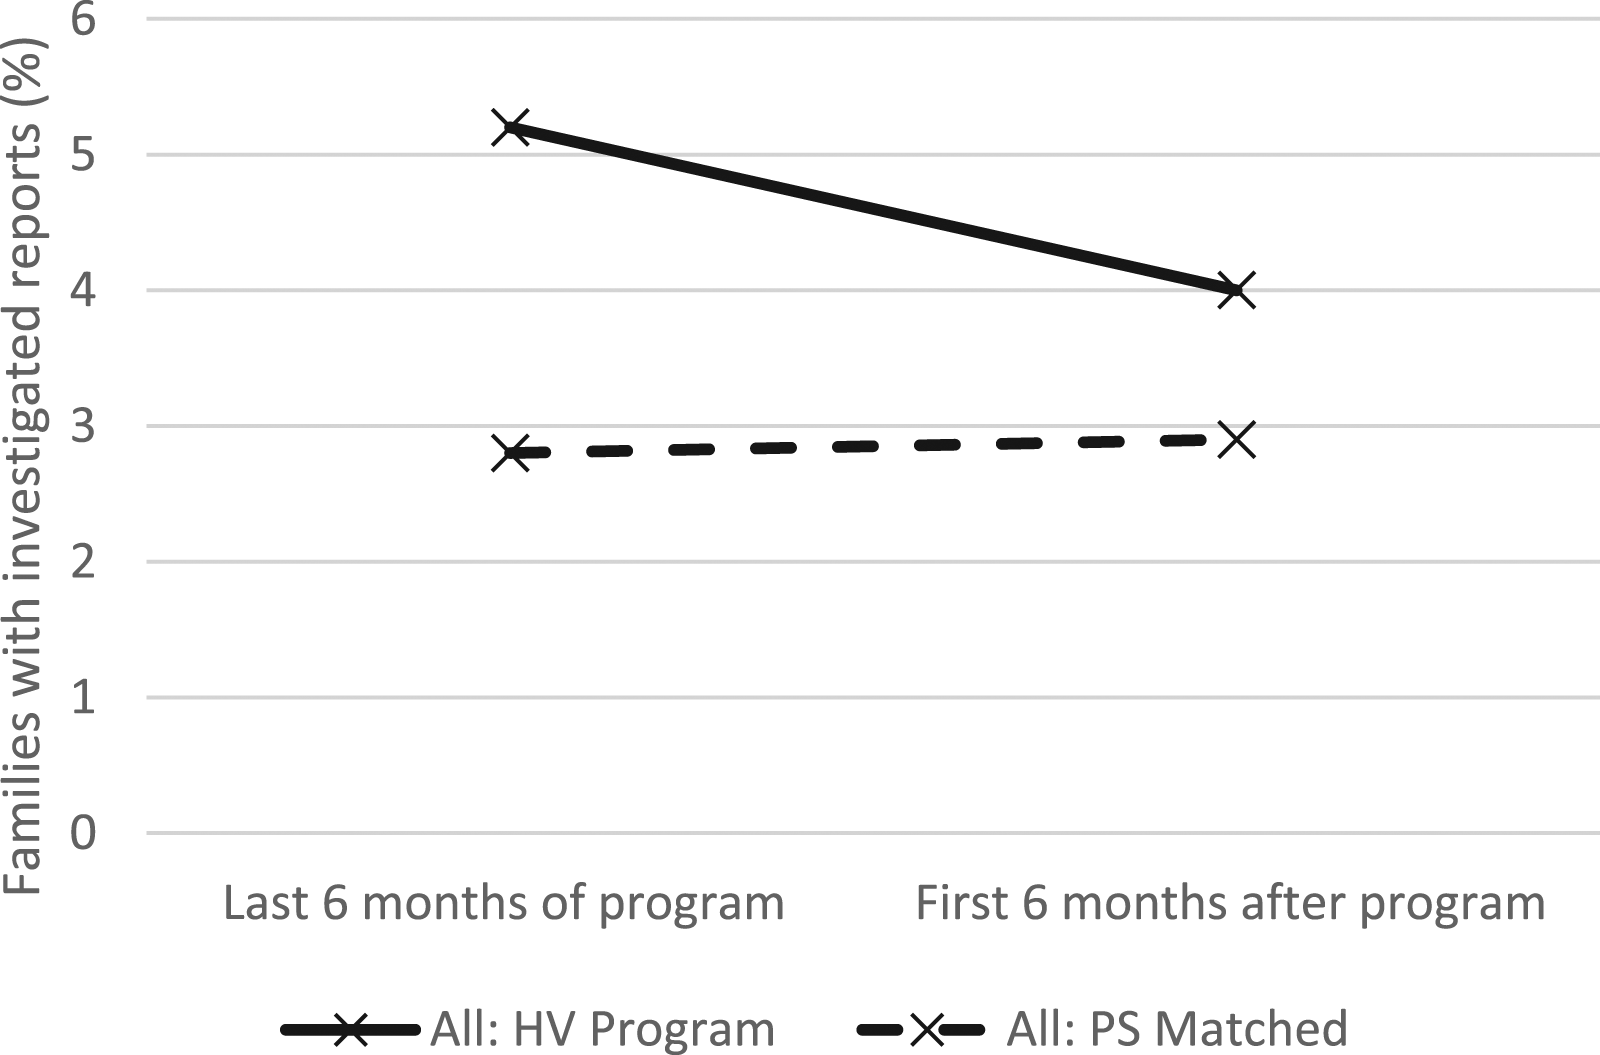
Percentage of families with investigated reports to child protective services in the last 6 months of HV and the first 6 months after program exit.
Over the full study period, more HV families had a substantiated CPS report (14%; n = 570) than comparison group families (11%; n = 1743; p < .001; RR:1.29; 95% CI: 1.19, 1.41). A similar pattern was seen for placements, with more HV families having a placement (2.8%; n = 111) than comparison group families (2.1%; n = 341; p < .001; RR:1.29; 95% CI: 1.04, 1.59).
Simulation
Figure 2 presents the estimated relative risks, comparing the HV group to the comparison group, for substantiated CPS reports and placements for varying simulated surveillance bias percentages from 0 to 70%, to identify the point at which the conclusions would differ. For substantiations, a surveillance bias percentage of higher than 60% (RR at 60%: 1.03; 95% CI: 1.004, 1.06) would be required for conclusions to change (i.e., for the treatment group to have equal or lower risk of substantiated CPS reports). For placements, the simulated relative risk favored the comparison group up to and including a surveillance bias percentage of 70% (RR at 70%: 1.18; 95% CI: 1.15, 1.22). Therefore, the level of surveillance bias necessary to explain the increased risk of substantiated CPS reports and placements in the HV group is over 60%, which is substantially higher than our estimates or previously published estimates (Chaffin & Bard, 2006; Duggan et al., 2007; MacMillan et al., 2005). Relative risk of substantiation of child maltreatment and child placement associated with HV involvement, compared to the comparison group, simulated at varying levels of surveillance bias, with 95% confidence intervals.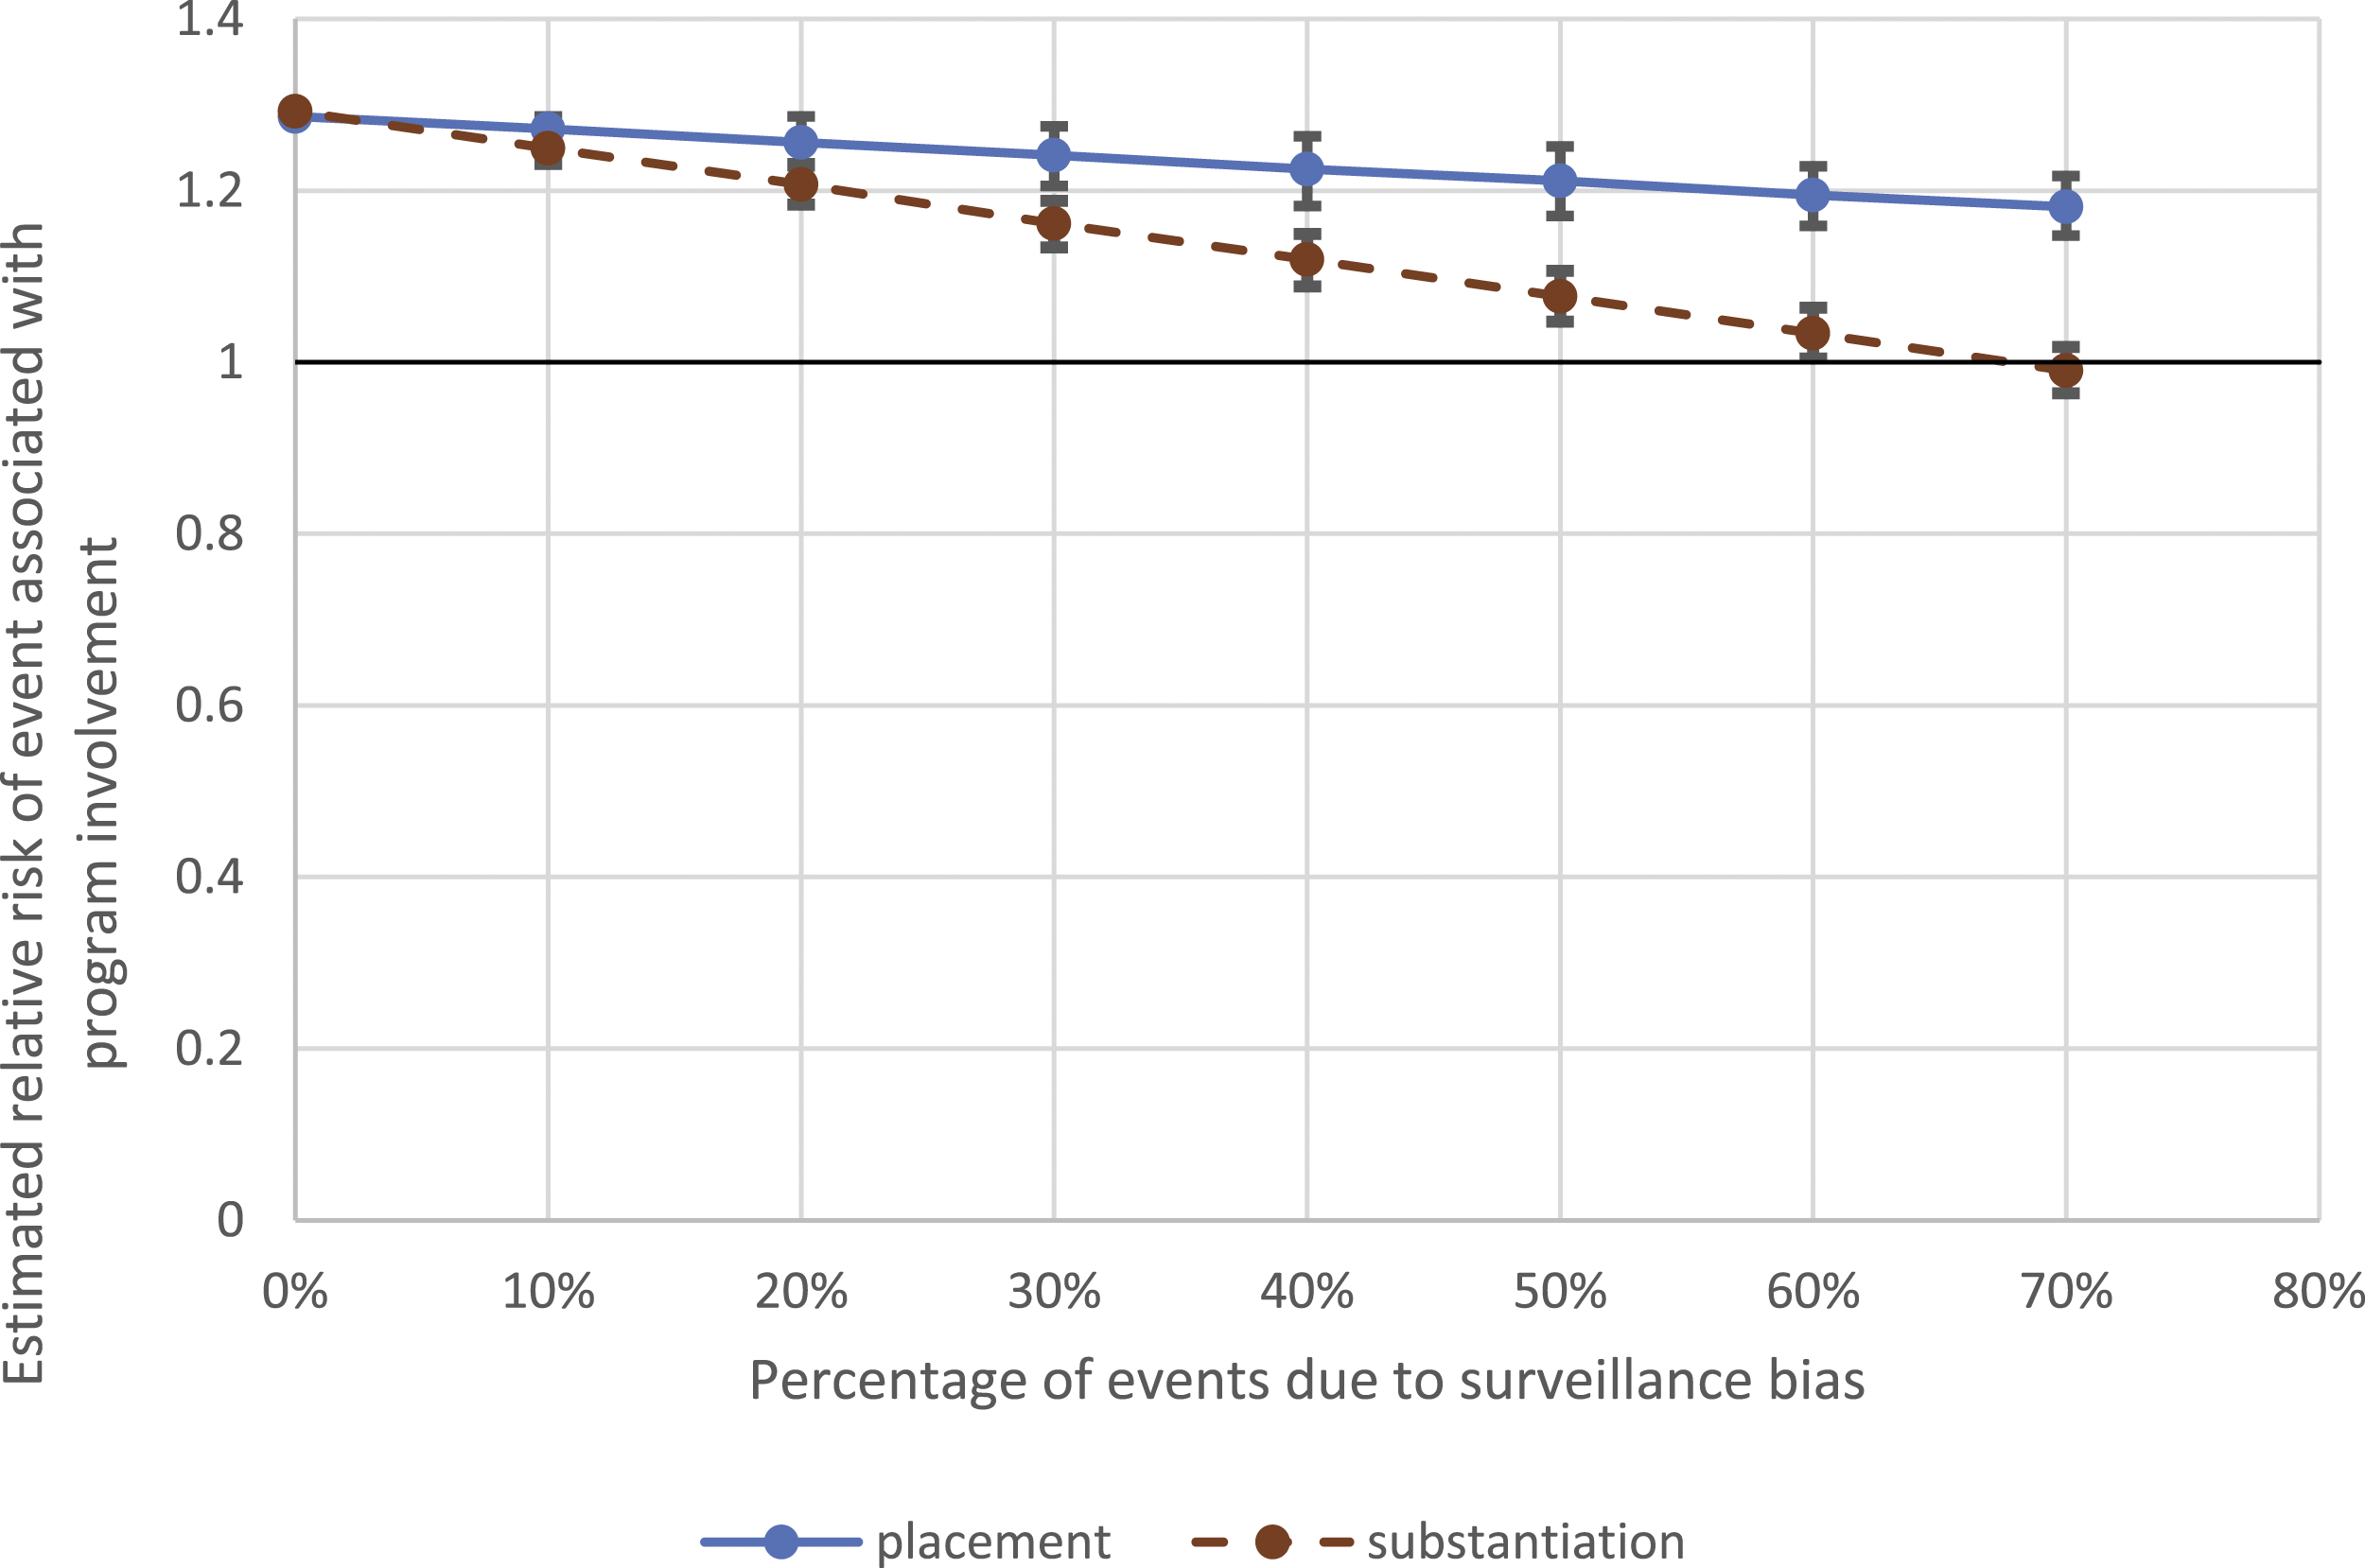
Survival Analysis
HV families had a shorter time to the first report (investigated or not; HR:1.40; 95% CI:1.31, 1.47; p < .001). When placement was included in the model, program involvement still predicted time to first report (p < .02) and the interaction between HV program involvement and family risk was not significant (p < .68). When family risk was included in the model, program involvement no longer predicted time to first report (p < .08) and the interaction between HV program involvement and family risk was not significant (p < .38).
Sensitivity Analyses
When we varied the time window for evaluating surveillance bias from 6 months before and after the end of the program to 3 months and 12 months, using our primary outcome of investigated reports, the findings were similar to the primary findings. Using 3 months, the surveillance bias estimate for investigated reports was 33.4% (95% CI: 10.7%, 54.2%; p < .002). Using 12 months, it was 23.2% (95% CI: 6.6%, 36.2%; p < .003). When we stratified the analysis to examine differences by length of time in the program, we found that the families who left the program before the child was 6 months old had significant surveillance bias (49.5%, 95% CI: 17.1%, 82.0%), while those who remained in the program for more than 6 months did not (13.9%; 95% CI: −6.8%, 34.6%). The likelihood of an earlier report was not substantially different for those in the program less than 6 months (HR: 1.38; 95% CI: 1.29, 1.47; p < .001) compared to those in the program at least 6 months (HR: 1.43; 95% CI: 1.27, 1.61; p < .01). Our estimates of surveillance bias did not change substantially when we adjusted for the total number of visits (25.0%; 95% CI: 9.6%, 42.3%; p = .003) or excluded families in the earlier years of the dataset who had expunged reports (28.8%; 95% CI: 9.6%, 50.0%; p < .004). When we included all possible participants (i.e., not excluding those in the program less than 60 days after the child’s birth; n = 4555 in the HV group; n = 18,009 in the comparison group), we estimated a similar surveillance bias (27.4%; 95% CI: 11.5%, 43.5%).
Quantitative Healthcare Utilization Data
For the first 3 years of life, 22.6% (4494) of the 19,885 children in the study had any injury that resulted in an ED visit or hospitalization, 0.9% (174) had a high-risk injury, and 0.2% (38) had an injury likely to be the result of maltreatment. HV program children were more likely to have any injury (RR: 1.15, 95% CI: 1.09, 1.23; p < .001). There was no significant association between HV involvement and either high-risk injuries (RR: 0.96; 95% CI: 0.66, 1.39) or injuries likely the result of maltreatment (RR: 1.61; 95% CI: 0.80, 3.24). Surveillance bias was not detected for any of the injury categorization approaches (Supplemental Table 1).
Narratives of CPS reports
Bivariate Associations Between Reporter Type (Home Visitor/Supervisor or not) and report Characteristic, of Those in HV.
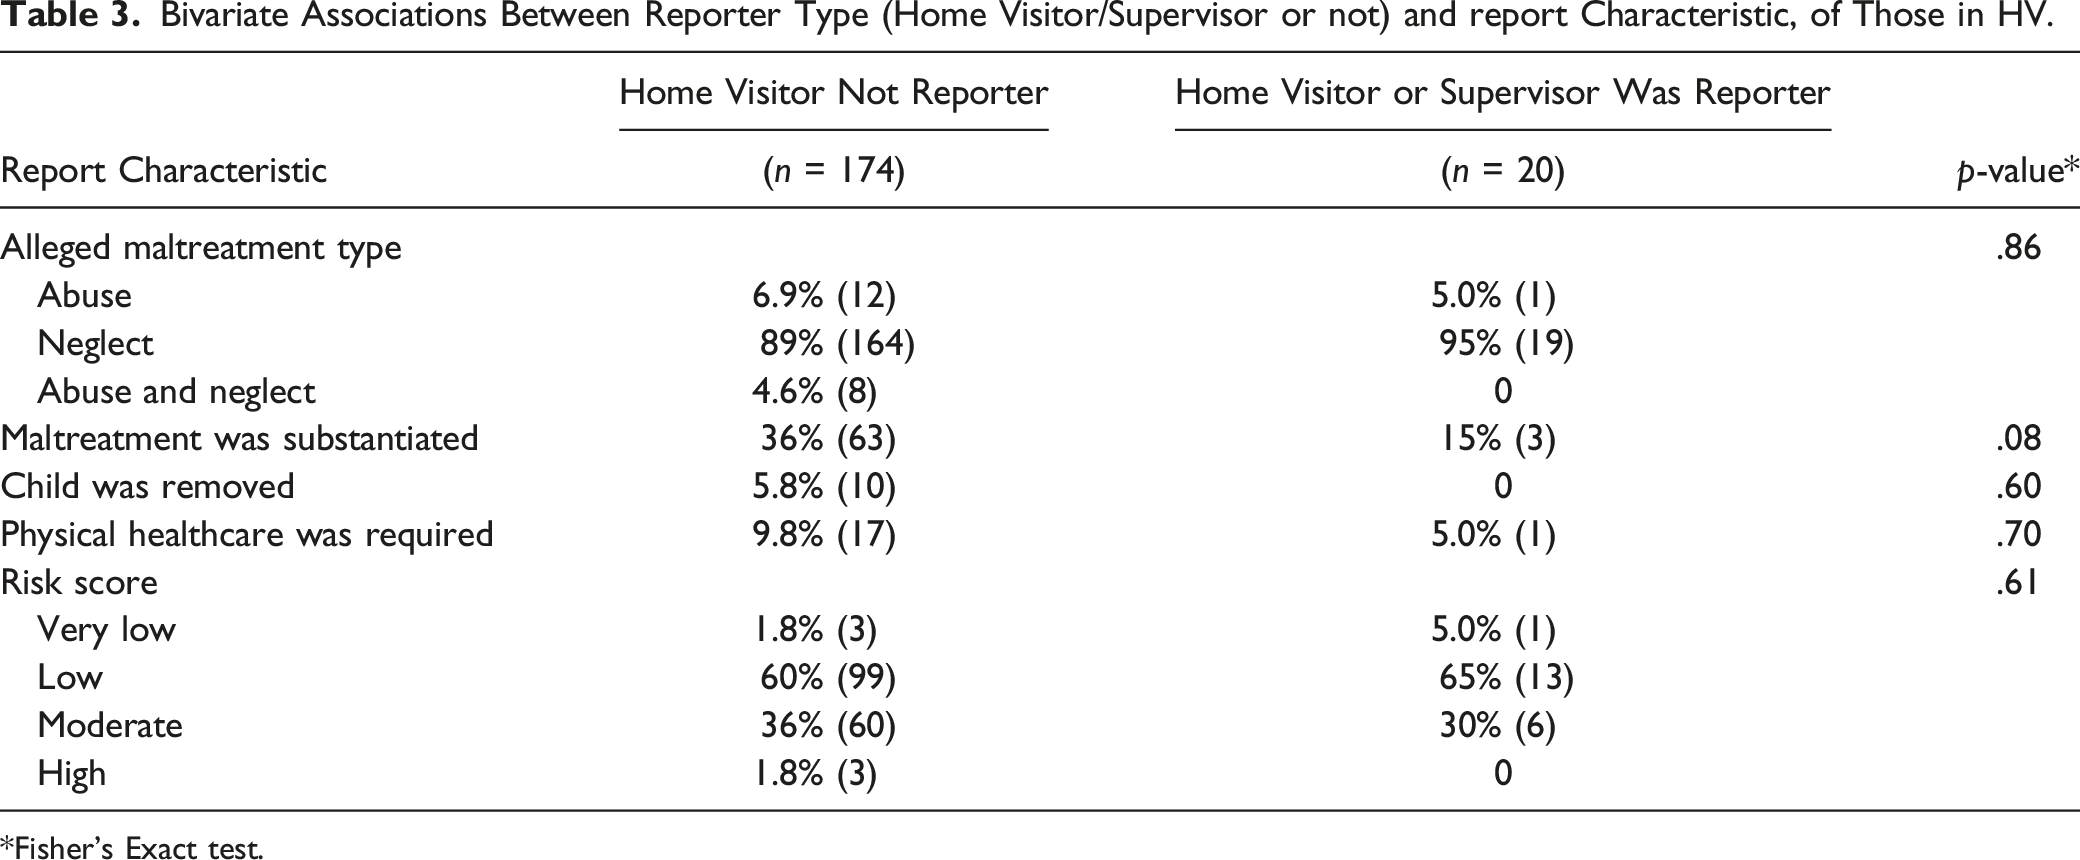
*Fisher’s Exact test.
Involvement in HV was mentioned in two cases of the 49 comparison families reviewed, and both of these were reported by the home visitor (4.1%; 95% CI: 0%, 9.6%). This is significantly fewer than in the HV group (4.1% vs. 16.0%; p = .03). The two home-visitor-reported cases were both for newborns. Reports at birth were infrequent across the full sample (11% in the HV group, 20% in the comparison group) and only one HV family had a report by a home visitor for a newborn. Because the statewide HV program most often began after birth in the study period and several smaller programs in the state began during pregnancy, these two instances were likely due to involvement in other HV programs in the state. This finding supports our assumption that reports that mentioned home visitors within the HV group were most likely from program home visitors, and not home visitors from a different kind of program. In addition, the finding of no HV-related reports in the comparison group for children other than newborns provide support to our assumption that HV-related reports in the HV group were likely due to involvement in the program of interest.
Combining the narrative report results (direct surveillance bias only) with the quantitative CPS data results (direct and indirect surveillance bias combined), we estimated that the percentage of investigated reports due to direct home visitor reporting (10.3%) is 40% of the percentage of investigated reports due to surveillance bias (25.6%; 10.3/25.6 = 40). The remaining 60% of surveillance bias is due to the indirect mechanisms.
Discussion
This is the first study, to our knowledge, to estimate surveillance bias using two independent methodological approaches and to use three sources of data from the same cohort of families. This is the first to use the DID approach to estimate surveillance bias, which is robust to the imperfections of propensity score matching. The comparison of surveillance bias estimates from the three sources of data (CPS reports, healthcare utilization, narrative reports) for the same families provides a unique, multi-perspective view of surveillance bias in this program. The first estimate of surveillance bias, based on a large quantitative analysis, was 25.6% and includes both direct and indirect surveillance bias. The second estimate, based on a subsample of narrative reports, was 10% (direct surveillance bias, with the home visitor as reporter). No surveillance bias was detected for healthcare utilization. HV families were found to have reports at earlier ages, but age was not related to placement or family risk, which does not support our hypothesis that earlier reports were protective. Taken together, these findings suggest that home visitors made reports that contribute to surveillance bias, but the reports contributing to surveillance bias were not related to incidents requiring medical attention. Therefore, evaluations of HV programs should take surveillance bias into account for CPS outcomes but may not need to for healthcare utilization outcomes.
The percentage of reports after program exit illustrate that even after involvement in a prevention program, children in the HV group had a higher occurrence of maltreatment. There are several potential explanations. First, the groups may not be equivalent on unmeasured factors. Second, there may be unintended consequences of the HV program, such as parents returning to work and leaving children in the care of less protective caregivers (Matone et al., 2018). Third, there may be lasting indirect surveillance bias (e.g., encouragement to seek care and help obtaining it). Other studies using propensity-score matched comparison groups have found a higher occurrence of injuries in the HV group (Folger et al., 2017; Matone et al., 2018; Matone et al., 2012) and one study identified a potential mechanism (non-client caregivers; Matone et al., 2018). We do not have evidence from this program to determine the likelihood of each mechanism.
Because of the potential mechanisms contributing to greater occurrence of maltreatment in the HV group, we cannot make conclusions about the effectiveness of the HV program on the occurrence of maltreatment. However, the finding that the HV group had fewer reports in the 6 months following program exit compared to the prior 6 months, while the comparison group had no substantial change between periods, is central to our surveillance bias estimate. The potential for non-equivalent groups highlights the shortcomings of propensity score matching and the use of an administrative dataset for the pool of potential comparison families. Birth certificate data includes important demographic data and we built on that by adding neighborhood-level information. However, we could not match on other risk factors for maltreatment, such as mental health and substance use (Austin et al., 2020), which were not measured in available data. Because of this concern about nonequivalence, we did not calculate an adjusted program effect. To do so, we would have calculated the expected number of investigated reports during the home visited period for the comparison group by multiplying the observed number by one plus the estimated surveillance bias percentage, and then compared this expected value with the observed number of investigated reports for the program group.
Several of our findings are consistent with previous literature. Our estimates of surveillance bias are similar to estimates previously reported by two studies that found that 24%–31% of reports were made by home visitors (Chaffin & Bard, 2006; MacMillan et al., 2005) and higher than one study that estimated surveillance bias at 3% (Duggan et al., 2007). These studies all focused on direct surveillance bias and the first two studied programs utilizing nurses as home visitors, while the third was a program that used paraprofessionals supervised by a social worker. Although we would expect our estimate to be higher than these previously reported estimates because ours included indirect surveillance bias, it was similar to the higher of the previous estimates, which either did not include indirect surveillance bias or included only some indirect sources. It is unclear how the home visitor background would impact the estimate, but training and experience may impact a home visitor’s recognition of maltreatment and decisions around reporting (Holland et al., 2021). The lower estimate by Duggan et al. may reflect differences in training and/or the method of detecting surveillance bias; these authors reviewed home visitor documentation while we relied on CPS records.
Most of the sensitivity analyses showed minimal change in our findings, suggesting that specific analytic decisions (e.g., the choice of 6 months as the period before and after program exit) did not have a strong influence on our conclusions. We did find that the estimate of surveillance bias was much higher when examining families who left the program before the child was 6 months old compared to those who stayed in the program for at least 6 months. A report could have resulted in the family leaving the program, especially if the family knew, or believed, that the home visitor was the reporter. This possibility is consistent with the higher surveillance bias estimate when a 3-month window was used and a lower surveillance bias estimate when a 12-month window was used, which suggested that reports shortly before the family exited the program contribute more to surveillance bias. Although it is possible that a family leaving the program could trigger a report by a concerned home visitor, we did not encounter this situation in a recent qualitative study of this program (Holland et al., 2021). It is more likely that a report contributed to the family exiting the program.
Based on our simulation results, the magnitude of surveillance bias would either have had to be much higher than the observed magnitude to explain the higher rates of CPS outcomes detected in the HV group versus the comparison group, or the indirect sources of surveillance bias would have had to persist long after HV ended to increase levels of CPS reporting after the family exited the program. It is more likely that the higher rates of CPS outcomes were due to the comparison group not being fully equivalent to the HV group, despite equivalence on measured factors. The factors that result in recruitment into the program and acceptance of the program by families are not fully captured by data available from birth certificates.
The review of narrative reports provides a lower estimate of surveillance bias, which suggests that surveillance bias may be acting through multiple mechanisms. Direct home visitor reporting only accounted for 40% of reports in this sample. The remaining 60% of reports were likely due to indirect mechanisms, such as reports from healthcare or social service providers who saw the families due to connections or referrals made by the home visitor.
There are two related biases that are distinct from the surveillance bias that we estimated in this study. The first, which has also been referred to as surveillance bias, is the potential for increased reporting after a family has an initial CPS report and, thus, is involved with CPS and other services. In that context of re-reporting, there is evidence that surveillance bias may be minimal (Drake et al., 2017). The second bias is underreporting that may occur if potential reporters choose not to make a report because the family is engaged in a prevention program (e.g., HV) or other services and therefore decide a report is not necessary, despite concerning observations (Davidov et al., 2012; Hélie & Bouchard, 2010; Holland et al., 2021). This underreporting could counteract the surveillance bias we focused on in our study, but the magnitude of this bias has not been estimated, to our knowledge.
Limitations
There are several limitations of this study. First, results of this study may not generalize to other HV models because the training and experience of the home visitors may lead to different reporting patterns. Second, detailed data on CPS reports made by home visitors were not available. These data may have provided a more precise estimate of direct surveillance bias (if all home visitor reports were assumed to be surveillance bias), but were not required for our approach in estimating the total surveillance bias (direct and indirect). Because CPS narrative reports did not consistently include the program name when a home visitor was mentioned, it was not possible to confirm that the reporter was from the HV program under study. Third, 32% of HV families were not linked to birth certificate data which reduced our sample size and potentially introduced bias. The primary reason for not matching was the lack of date of birth for the mother or child, which may be associated with a short time in HV and thus fewer opportunities to collect data. Such families, however, would have made up a very a small portion of the pool for propensity score matching (2.3%), and, therefore, would have had minimal effects on the results. Unfortunately, no alternative identifiers for matching were available. Fourth, although our comparison group was equivalent to the HV group on measured characteristics, comparison families may be at lower risk of child maltreatment. Therefore, the differences in maltreatment outcomes noted in this study cannot be interpreted as an evaluation of program effectiveness. Importantly, however, the method used to estimate surveillance bias is robust regardless of group differences. Finally, it was not possible to directly test the assumption of parallel trends in the DID analysis; families did not have an opportunity for reports before joining the program because both began at the child’s birth. We tested parallel trends for a subgroup that had low program exposure and, therefore, represented this group’s trends without intervention effects. Although this provided some support that the parallel trends assumption was not violated, it is an imperfect test and it is possible that the estimates from the difference-in-difference analysis are biased.
Future Directions
Other methods of creating a comparison group should be investigated to result in a well-matched group and such methods may require substantially greater data collection efforts to include factors associated with the risk of maltreatment. If possible, more detail on CPS reports should be collected by HV programs during evaluations, so that surveillance bias can be estimated directly. However, caution must be used to communicate the purpose of this information and neither discourage reports when they are appropriate nor encourage anonymous reports. Estimating direct surveillance bias through examination of narrative CPS reports may be a useful approach, and a larger sample would result in a narrower confidence interval. Although the reporter type may not be sufficient to identify if a report was made by a home visitor, using the reporter type may be useful to exclude some reports (e.g., if the reporter is recorded as “police”) and therefore reduce the number of records that need to be manually reviewed. If data use agreements allow, more detailed analysis of these narrative reports may produce additional insight into the experience of families and home visitors when these reports are made. It also would be helpful for CPS to add a “home visitor” category since these programs have expanded in recent years.
Conclusions
Using two new methods, we found evidence of a decrease in CPS reports after families exited a statewide HV program, which is likely due to surveillance bias; our estimate is similar to previous estimates from different HV programs using different methods. Although surveillance bias is not expected to be harmful to the families served, it makes accurate evaluation of programs more difficult, and the presence of surveillance bias may suggest that an effective program is not helpful. In our study, we could not determine if the HV program was effective due to the comparison group likely being non-equivalent. However, the methods described here to estimate surveillance bias were not dependent on equivalence between these groups. Therefore, surveillance bias should be accounted for during program evaluations when HV programs are compared to a control group and CPS reports are used as an indicator of child maltreatment.
Supplemental Material
Supplemental Material - Estimating Surveillance Bias in Child Maltreatment Reporting During Home Visiting Program Involvement
Supplemental Material for Estimating Surveillance Bias in Child Maltreatment Reporting During Home Visiting Program Involvement by Margaret L. Holland, Denise Esserman, Rose M. Taylor, Serena Flaherty, and John M. Leventhal in Child Maltreatment
Footnotes
Acknowledgments
We thank our colleagues at the University of Hartford Center for Social Research, Wes Younts and Allison Joslyn, who supported our access to HV program data and without whom this project would not have been possible. Research assistant Abigail Wilpers provided valuable contributions in the early stages of data management. We greatly appreciate the assistance of Fred North at the CT Department of Children and Families for assistance with CPS data and Karyn Backus at the CT Department of Public Health for assistance with birth certificate and healthcare utilization data. Finally, we would like to thank Kelley Fong for allowing us to access data from CPS that allowed inclusion of reports (Fong, 2019).
Declaration of Conflicting Interests
The author(s) declared no potential conflicts of interest with respect to the research, authorship, and/or publication of this article.
Funding
The author(s) disclosed receipt of the following financial support for the research, authorship, and/or publication of this article: This work was supported by the Connecticut Department of Public Health (DPH) Human Investigations Committee. Certain data used in this study were obtained from DPH. The authors assume full responsibility for analyses and interpretation of these data. This study was supported by a grant from the National Institutes of Health Eunice Kennedy Shriver National Institute for Child Health and Human Development (R03HD096114). This study was also partially supported by funds from the Yale Clinical and Translational Science Award (UL1TR001863).
Supplemental Material
Supplemental material for this article is available online.
References
Supplementary Material
Please find the following supplemental material available below.
For Open Access articles published under a Creative Commons License, all supplemental material carries the same license as the article it is associated with.
For non-Open Access articles published, all supplemental material carries a non-exclusive license, and permission requests for re-use of supplemental material or any part of supplemental material shall be sent directly to the copyright owner as specified in the copyright notice associated with the article.