
Abstract
Geographic Primary Care Health Professional Shortage Area (HPSA) designations drive the allocation of government resources to improve access to care, but designations are based only on physicians and therefore obscure the available primary care workforce. In this cross-sectional study, we linked 2025 data from the National Plan and Provider Enumeration System and state licensure data to estimate active nurse practitioners (NPs) providing primary care. We then used data from the Health Resources and Services Administration to estimate the number of counties that would continue to meet the HPSA threshold after including NPs in population-to-provider ratios. Including NPs as primary care providers reduced the number of counties with an HPSA by nearly 80% under conservative inclusion criteria and employment and patient capacity assumptions. This finding highlights the need to reconsider HPSA scoring to reflect primary care provider availability and effectively allocate resources to address persistent shortages.
Keywords
Introduction
The Health Resources and Services Administration (HRSA) designates geographic Primary Care Health Professional Shortage Areas (HPSAs) to identify counties and sub-county areas with an insufficient supply of primary care providers to meet community needs. These designations reflect the government’s recognition that strong primary care is fundamental to securing access to care and promoting better health outcomes (U.S. Department of Health and Human Services, 2023). As of 2025, there were 1,245 geographic Primary Care HPSAs, with approximately 30 million people living in them (Health Resources and Services Administration: Bureau of Health Workforce, 2025a).
In addition to geographic HPSAs, HRSA designates population and facility HPSAs to reflect different dimensions of primary care shortages. Population HPSAs focus on specific groups, such as low-income populations, and facility HPSAs apply to individual sites such as federally qualified health centers or correctional facilities (Health Resources and Services Administration: Bureau of Health Workforce, 2023). In contrast, geographic HPSAs capture shortages that affect entire communities and serve as a mechanism for directing federal resources to those areas. Geographic Primary Care HPSA designations determine eligibility for loan repayment incentives for clinicians through the National Health Service Corps (Health Resources and Services Administration: National Health Service Corps, 2025); 10% quarterly bonus payments for physicians providing services to Medicare patients (Centers for Medicare & Medicaid Services, 2025a); subsidies for rural health clinics (Centers for Medicare & Medicaid Services, 2025b); and graduate medical education funding (U.S. Government Accountability Office, 2021). HPSA designations also shape eligibility for foreign physicians seeking J-1 residence waivers (45 C.F.R. § 50.5, 2002). The precision of HRSA’s HPSA designation methodology is therefore important not only for understanding which communities have the most significant primary care needs but also for ensuring that resources are aligned with those community-level needs.
However, the HPSA designation methodology was developed in the 1970s, reflecting the data and primary care workforce available at that time, with the result that many HPSA designations are likely outdated (Finerfrock, 2024). HRSA does not analyze nationwide data to systematically update geographic Primary Care HPSAs—instead, state primary care offices apply for designations based on needs assessments or community requests (Health Resources and Services Administration: Bureau of Health Workforce, 2025b). Therefore, some areas that might meet HPSA criteria are not designated, as there was no application or review for designation. In addition, both designations and the scores HRSA uses to assign severity of need depend on the population-to-provider ratio, which is based only on physicians (42 C.F.R. pt. 5, 1980). This ratio does not include nurse practitioners (NPs), the most numerous type of primary care provider other than physicians, or physician associates.
The NP role has undergone substantial growth since its inception in 1965, not long before the development of the HPSA designation methodology (American Association of Nurse Practitioners, n.d.). As of 2025, there were an estimated 461,000 licensed NPs in the United States (American Association of Nurse Practitioners, 2025). Furthermore, the NP workforce is projected to continue growing by 40% between 2024 and 2034 (U.S. Bureau of Labor Statistics, 2025). The majority of NPs receive their initial certification in primary care (American Association of Nurse Practitioners, 2024). NPs provide high-quality primary care that is comparable to that of physicians (Kurtzman & Barnow, 2017; McMenamin et al., 2023; Turi et al., 2023). NPs also play a critical role in providing primary care in HPSAs (Bilazarian et al., 2022). Indeed, HRSA recognizes that NPs “alleviate the issues associated with the shortage of primary care physicians” (Health Resources and Services Administration: Bureau of Health Workforce, 2025c, p. 5). Thus, the exclusion of NPs from the HPSA designation methodology contributes to an increasingly outdated understanding of the primary care workforce and unmet need for primary care across U.S. communities.
The goal of this work is not to redesignate areas of need or to argue that access to care is sufficient in most currently designated HPSAs. Rather, our goal is to illustrate the necessity of updating the HPSA threshold and scoring criteria to reflect primary care workforce availability and more accurately identify areas of severe need not being met by both physicians and NPs in primary care. Not accounting for these additional clinicians shifts attention away from true care deserts where neither physicians nor NPs are available, leading to inefficiencies in incentive-based retention programs for providers.
New Contribution
This study provides novel empirical evidence of the potential effect of updating HRSA’s 1970s-era definition of primary care providers on HPSA designations. To our knowledge, there are no other studies that assess the limitations of using physicians as the sole primary care provider type in HRSA’s calculation of population-to-provider ratios, nor the potential effect of expanding the definition of primary care providers to include NPs. We also demonstrate the value of refining and linking national datasets to strengthen primary care workforce estimates. We validate the National Plan and Provider Enumeration System (NPPES) provider file with state licensure records and incorporate national survey data to produce more accurate estimates of active, full-time primary care NPs.
Method
This cross-sectional study was reviewed by the West Virginia University Research Office and determined to be exempt from human subjects research requirements and the need for full institutional review board review (Certificate #4128). Results reporting follows the Strengthening the Reporting of Observational Studies in Epidemiology (STROBE) guideline.
In this section, we first provide an overview of HRSA’s HPSA designation and scoring methodology, then an overview of our approach to recalculating designations and scores after including NPs. Next, we describe our analysis in three main steps: data extraction and file construction for county characteristics, data extraction and file construction for primary care NPs, and calculation of population-to-provider ratios that include NPs.
Overview of HRSA’s Primary Care HPSA Designation and Scoring Methodology
HRSA uses one set of criteria to designate Primary Care HPSAs and a related set of criteria to score designated HPSAs for severity of need. “Rational areas” for primary care delivery receive the designation if they have a population-to-primary care physician ratio greater than 3,000:1 (42 C.F.R. pt. 5, 1980). Rational areas for primary care delivery are geographic areas where people live and travel in ways that logically connect them to the same primary care providers (42 C.F.R. pt. 5, 1980). Once designated, HRSA scores Primary Care HPSAs using (a) the population-to-provider ratio (double-weighted), (b) the percent of the population below 100% of the federal poverty level, (c) the infant health index, and (d) the travel time to the nearest source of care (Health Resources and Services Administration: Bureau of Health Workforce, 2025d). The population-to-provider ratio can receive up to 10 points as HRSA double-weights the scores shown in Table 1 in the overall HPSA score. The other components can receive up to 5 points each, for a maximum total of 25 points (Health Resources and Services Administration: Bureau of Health Workforce, 2025d).
Population-to-Provider Ratio Scoring for Primary Care Geographic HPSAs (Health Resources and Services Administration: Bureau of Health Workforce, 2025d, p. 47).

Abbreviated: FTE is full-time equivalent. bPCP stands for Primary Care Physician in this ratio scoring. Other primary care providers are not included in the calculation. cThe population-to-provider ratio score is double weighted when aggregating the overall HPSA score.
For both designation and scoring, the population-to-provider ratio is measured in terms of full-time equivalent (FTE) primary care physicians (Health Resources and Services Administration: Bureau of Health Workforce, 2025d). Other than in regulation, HRSA’s documentation uses the term “provider” for this ratio, although it includes only physicians.
Overview of Approach to Recalculating Primary Care HPSA Designations and Scoring
We examine the effect of changing the status quo approach to counting primary care providers by including NPs in county-level population-to-provider ratios and estimating changes to Primary Care HPSA designations. We also recalculate the severity scores for areas that would retain an HPSA designation with updated population-to-provider ratios. We calculate these severity scores using the cutoff levels designated by HRSA for consistency. If this methodology were utilized in future HPSA designations, the population-to-provider ratio cutoffs and scores would likely need to be updated to reflect these new provider counts.
Step 1: Data Extraction and File Construction for County HPSA Status, Physician FTEs, and Population
We collected HPSA status, population, and physician FTE counts from HRSA’s HPSA Primary Care File (Health Resources and Services Administration: Bureau of Health Workforce, 2025e). We excluded non-geographic HPSAs and all withdrawn records (i.e., areas formerly designated as HPSAs), retaining those designated or proposed for withdrawal as of October 2025. We deduplicated records using geographic identification numbers, or geoids, which are composed of a component class, state FIPS code, county FIPS code, HPSA service area code, and service area component. We then aggregated all areas to the county level, categorizing counties as “full HPSA” if entire counties were designated as HPSAs and “partial HPSA” if only sub-county areas, such as census tracts, were designated. We are unable to use sub-county rational areas as the unit of analysis because NP location data are limited to the county level.
Step 2: Data Extraction and File Construction for Nurse Practitioners
To generate counts of primary care NPs, we created a county-level file of primary care NPs using the October 2025 NPPES National Provider Identifier (NPI) file (Centers for Medicare & Medicaid Services, 2025c). This is the same source used by HRSA to extract physician FTE data (Health Resources and Services Administration: Bureau of Health Workforce, 2025d). We included provider taxonomy codes for family, primary, community health, geriatric, and pediatric NP care, consistent with the taxonomy codes HRSA uses to identify primary care physicians (Health Resources and Services Administration: Bureau of Health Workforce, 2024, 2025d). We excluded NPs with a primary practice location outside the United States or in U.S. territories, NPs who did not list an NP code as their primary taxonomy code, and NPs listing any physician taxonomy code. Next, we geocoded each NP’s primary practice address to latitude, longitude, and county Federal Information Processing Standards (FIPS) code using the R packages sf, tigris, and tidygeocoder (Cambon et al., 2021; Pebesma & Bivand, 2023; Walker & Rudis, 2025).
Although HRSA also uses the NPPES as the data source for physicians, it contains NPIs for some providers who are not actively practicing or who have moved. Providers can deactivate their NPIs when they are no longer needed, but there is no fixed deadline (Centers for Medicare & Medicaid Services, 2025d). Therefore, to ensure accurate numbers and locations and to avoid overestimating NPs’ effect on HPSA designations, we matched NPs in the NPPES to NP licensure data collected from boards of nursing for all 50 states and Washington, D.C., from May–July 2025. Licensure data are updated frequently to support state boards’ oversight responsibilities and are publicly available for most states. We deduplicated licensure data first by license number and then by exact matches on name and address. We created a single composite licensure dataset with names, license numbers, active or inactive license status, and state board of origin.
We linked NPPES and licensure data by license number and state, allowing for one NP record per license–state pair. When multiple license numbers matched an NPI, we selected the board of nursing license that was active. We matched 247,593 of 306,638 NPPES records (77%) to licensure data. We excluded 8,277 (4.8%) records that matched NPIs with inactive licenses. Five states—Arkansas, Colorado, Connecticut, Kansas, and Oklahoma—had very large unmatched rates of >40%, likely due to formatting differences in license numbers between the state data and NPPES. To avoid inappropriately dropping large proportions of the NPPES records, we removed 4.8% of the records in these states, reflecting the percentage of inactive records we found in other states. In the other 45 states, we dropped records that did not match, in addition to the matched but inactive NPs. The final analytic sample comprised 238,915 primary care NPs, a significantly more conservative number than the total count of actively licensed NPs based on 2025 licensure data (American Association of Nurse Practitioners, 2025).
Step 3: Recalculation of County-Level Population-to-Provider Ratios
Next, we adjusted our count of primary care NPs in each county to reflect the percentage working full-time, defined as those working a 40-hour work week, and the percentage estimated to manage their own panel. Adjusting for FTEs aligns with HRSA’s methods for counting physicians. Adjusting for panel management is an extra step that is appropriate for NPs, given variation in practice patterns and care models. It is reasonable to treat NPs responsible for their own panel of patients as an addition to physicians when calculating population-to-provider ratios. However, some NPs practice in team-based models and counting them in an additive way may overestimate provider capacity. To ensure conservative estimates, we excluded the estimated proportion of primary care NPs without their own patient panel, although NPs working on teams arguably extend physician capacity in ways that are not accounted for in HRSA’s current approach.
We made two different estimates of the percentage of primary care NPs working full-time, one based on the American Association of Nurse Practitioners (AANP) 2024 workforce survey and one based on HRSA’s 2022 National Sample Survey of Registered Nurses (NSSRN; Health Resources and Services Administration: Bureau of Health Workforce, 2024; data from 2022). The AANP and NSSRN surveys estimate that 65% and 80% of primary care NPs work full-time, respectively. We focus our analyses on the 65% FTE estimate as the more conservative of the two. NPs working part-time averaged 21 and 23 hours per week. Therefore, we counted part-time NPs as 0.5 FTE, consistent with the fact that HRSA counts certain physicians as fractions of an FTE (Health Resources and Services Administration: Bureau of Health Workforce, 2025d).
The same national surveys also provide estimates of the proportion of NPs with primary care certifications who have their own patient panels. The NSSRN puts this proportion at 80% and AANP at 88%. Other research finds a lower proportion of NPs with “independent panel management” reflecting a graded measure of independence (co-managed, independent, mixed) rather than a binary indicator, which likely yields a lower share and limits comparability to national survey estimates (Martsolf et al., 2022). We focus on the 80% own-panel estimate from the NSSRN because it is the more conservative of the two survey estimates.
We then merged county-level NP counts with county-aggregated HPSA data, matching 970 of 1,109 counties. Unmatched counties had no active NPs who listed the county as their primary practice location, or the NPs in those counties were dropped because we were unable to match their NPIs to licensure data. After matching counties, a total of 54,156 NPs were retained out of the original 238,915 (22.7%). Finally, we recalculated the population-to-provider ratios for each county using FTE physicians plus FTE NPs, adjusted for the proportion of NPs with their own panel. We also recalculated HPSA severity scores based on the new ratios. We used Stata version 18.5 to calculate the new ratios and scores (StataCorp, 2021).
Results
After including NPs as primary care providers in the population-to-provider ratio, a large majority of counties no longer met the HPSA threshold. A provider ratio score of 0 reflects a ratio of less than 3,000 people to 1 primary care provider and does not meet the threshold for a Primary Care HPSA designation. Table 2 shows that of the 970 counties in our analysis, none received a score of 0 for the provider ratio based only on physicians. When assuming 65% of primary care NPs work full-time and all of the resulting FTEs can be added to the number of primary care physicians per county, 826 counties (85.2%) moved into the top row with a 0 score, no longer meeting the HPSA threshold (middle column). The right-hand column shows our results when assuming 65% of NPs work full-time and 80% of the resulting FTEs have their own patient panel: 80.2% of counties changed to a score of 0, no longer meeting the HPSA threshold.
Number of Counties Meeting the Shortage Threshold Based on Population-to-Provider Ratios With and Without NPs.
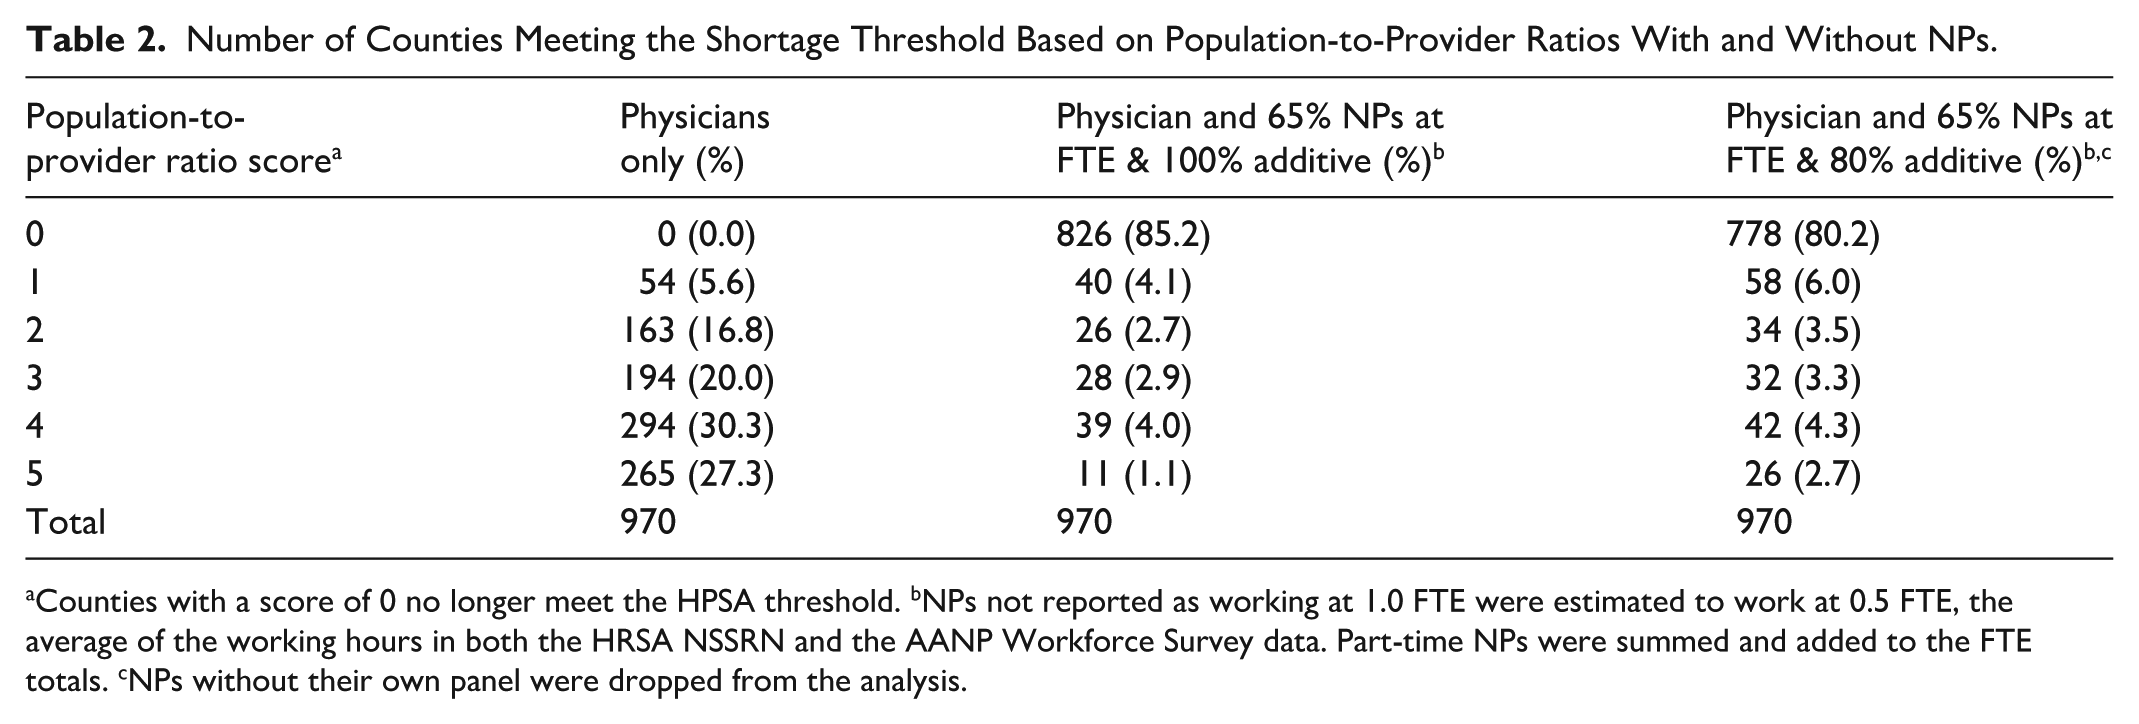
Counties with a score of 0 no longer meet the HPSA threshold. bNPs not reported as working at 1.0 FTE were estimated to work at 0.5 FTE, the average of the working hours in both the HRSA NSSRN and the AANP Workforce Survey data. Part-time NPs were summed and added to the FTE totals. cNPs without their own panel were dropped from the analysis.
When separating partial-county and full-county HPSAs, we found that larger proportions of partial-county HPSAs moved above the designation threshold than full-county HPSAs, under multiple full-time and own-panel assumptions (Supplemental Tables 1 and 2).
Figures 1 and 2 illustrate the difference in counties meeting the HPSA threshold based on the provider ratio when calculating the ratio using only physicians, as HRSA currently does, and when including primary care NPs at 65% full-time and 80% of the resulting FTEs as an addition to physicians, because they have their own patient panels.

Counties with population-to-provider ratios meeting the Primary Care HPSA threshold using physicians only.
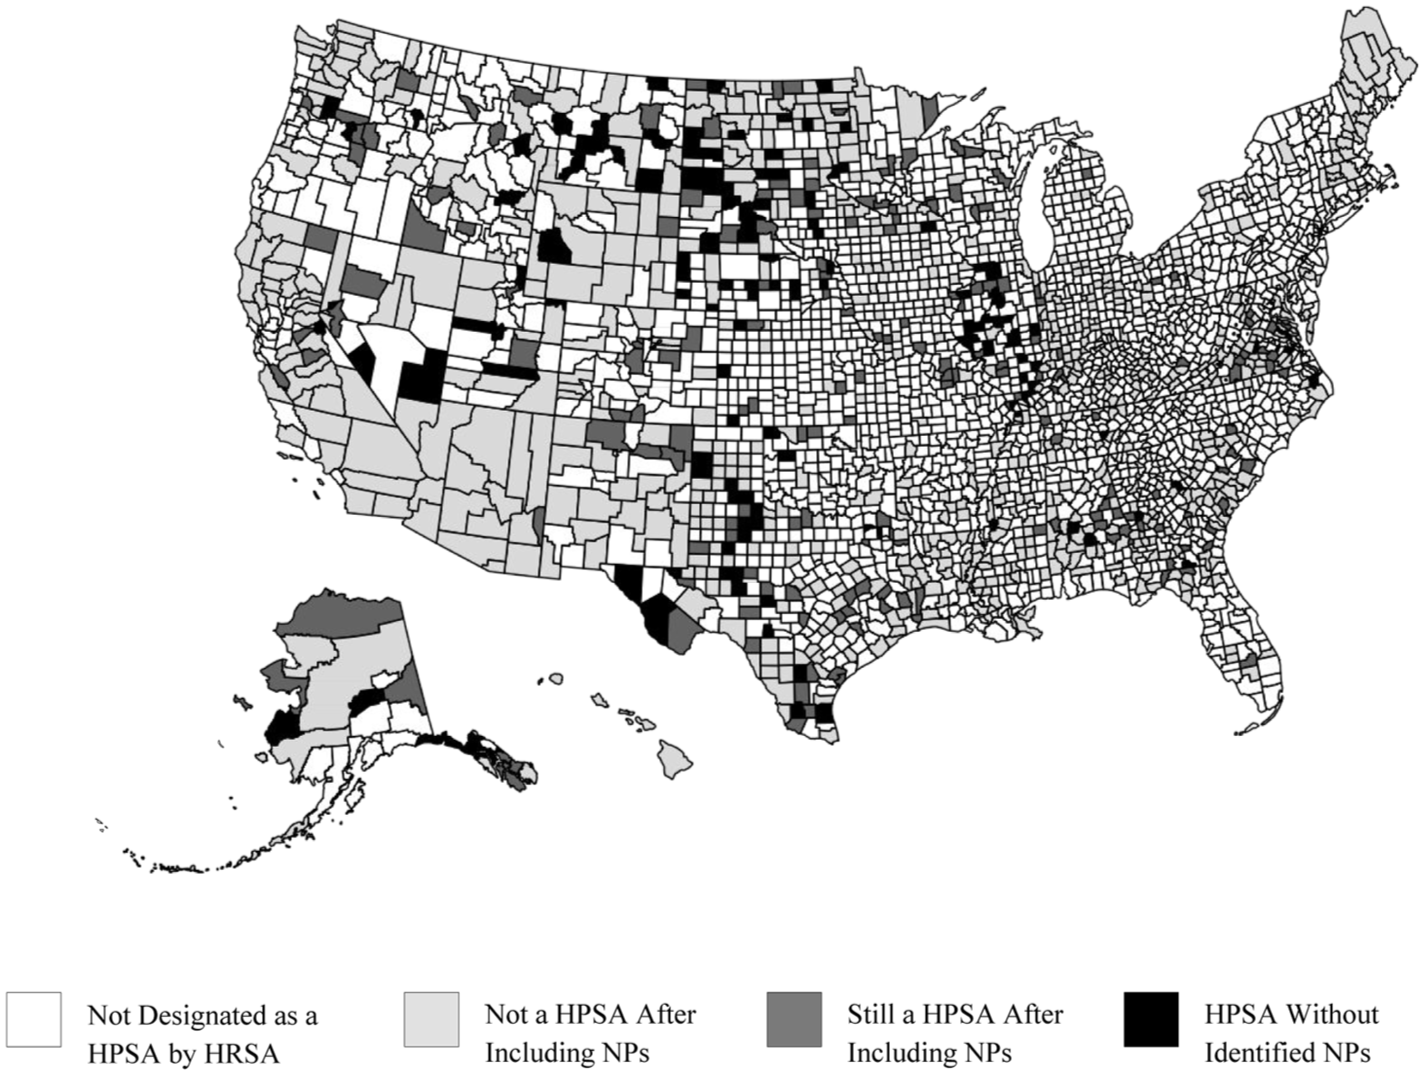
Counties with population-to-provider ratios meeting the Primary Care HPSA threshold using physicians and 65% of NPs at 1.0 FTE, and 80% with their own patient panel.
Next, we recalculated HPSA severity scores for the counties that continued to meet the HPSA threshold after including NPs as primary care providers. These were about 14.8% (144/970) and 19.8% (192/970) of the counties originally meeting the threshold, depending on the additive assumption for NPs. As in Table 2, estimates in Table 3 assume 65% of NPs are full-time. For illustrative purposes, we show results when assuming 100% of the resulting FTEs can be added to physicians and when restricting to 80% with their own panel. Focusing on the more conservative estimates in the right-most column of Table 3, 76.6% decreased their HPSA score between 2 and 8 points (out of a total possible score of 25, with the double weighting of the provider ratio used by HRSA). We also found that a larger proportion of partial-county HPSAs reduced their severity scores than full-county HPSAs.
Reduction in HPSA Severity Scores by Full- and Partial-HPSA Counties.
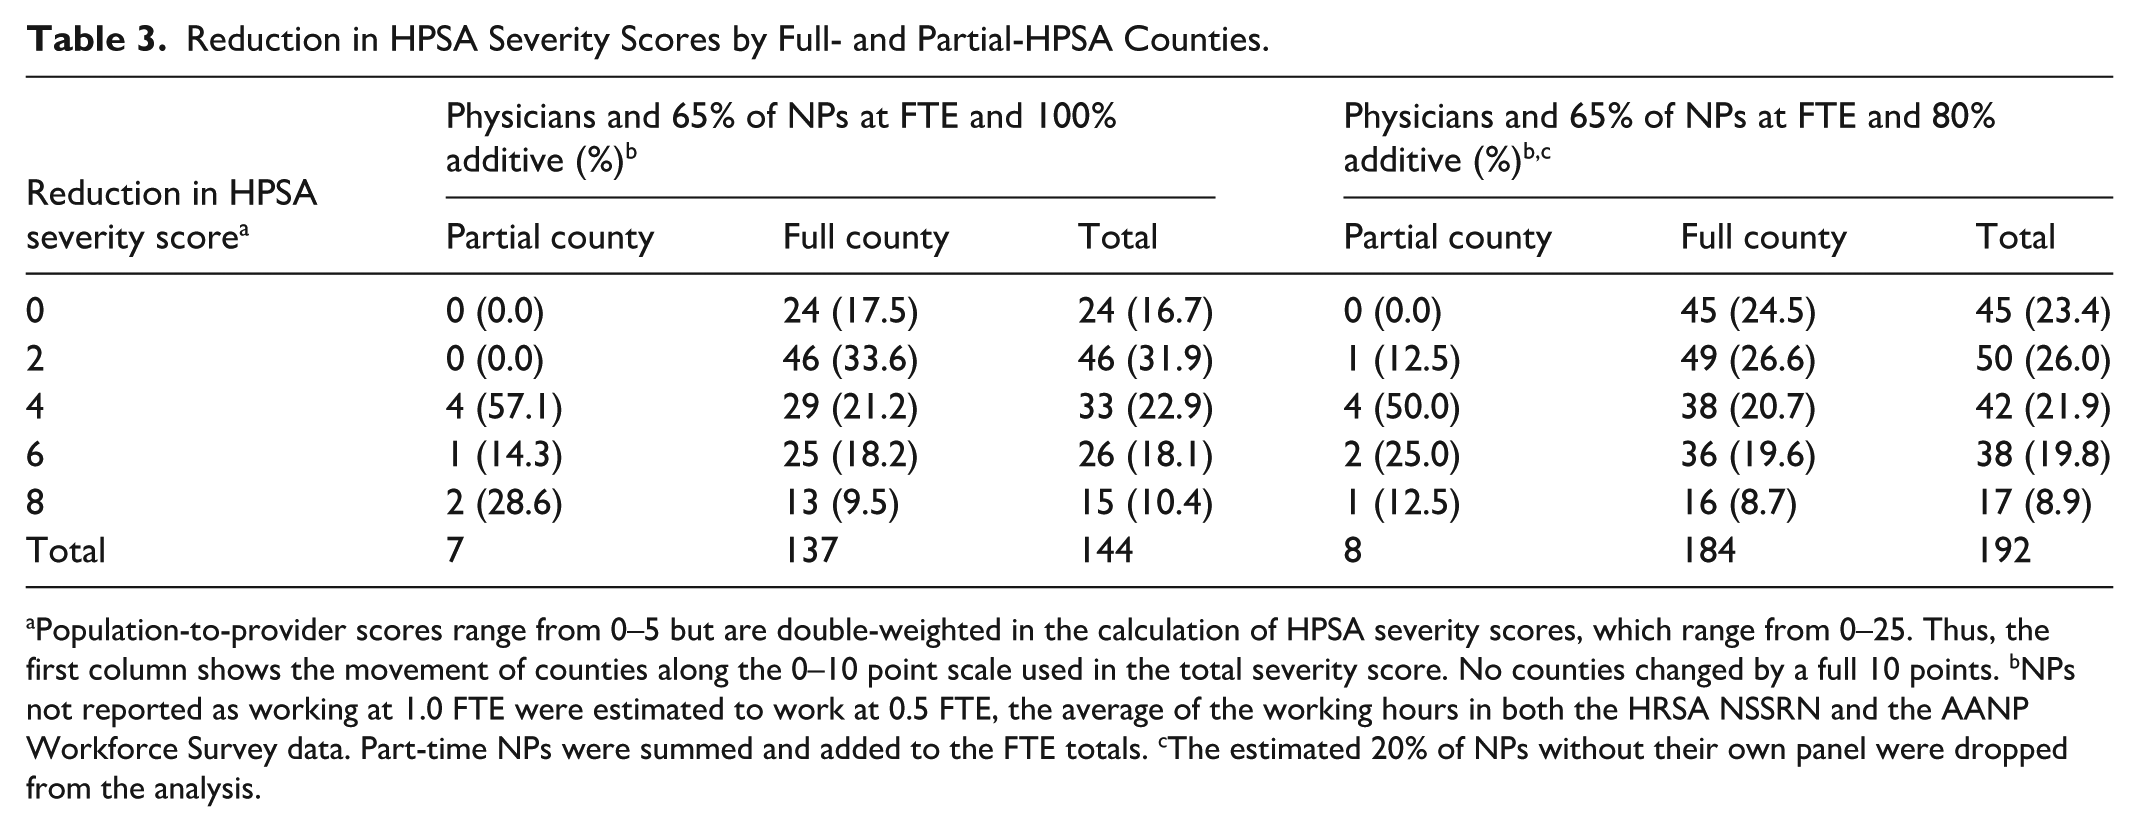
Population-to-provider scores range from 0–5 but are double-weighted in the calculation of HPSA severity scores, which range from 0–25. Thus, the first column shows the movement of counties along the 0–10 point scale used in the total severity score. No counties changed by a full 10 points. bNPs not reported as working at 1.0 FTE were estimated to work at 0.5 FTE, the average of the working hours in both the HRSA NSSRN and the AANP Workforce Survey data. Part-time NPs were summed and added to the FTE totals. cThe estimated 20% of NPs without their own panel were dropped from the analysis.
Alternative Inclusion Criteria for NPs
We conducted an additional analysis that removed inactive NPs and only 4.8% of unmatched records, equal to the percentage of inactive records in the NPPES that we found by matching licensure and NPI data. This is a less conservative approach than dropping all unmatched NPs. This resulted in a count of 294,950 primary care NPs and expanded the number of counties we could match in HRSA’s HPSA file, for which we could recalculate a population-to-provider ratio, from 970 to 1,004. After matching counties, the alternative inclusion criteria resulted in 66,145 NPs across all HPSA counties, compared to 54,156 in the main analysis.
As shown in Table 4, when assuming 65% of primary care NPs work full-time and 100% of NPs are added to physicians, the percentage of counties receiving a score of 0 and no longer meeting the threshold changed from 85.2% to 88.1%, an additional 2.9% over Table 2. The right-hand column shows our results when assuming 65% of NPs work full-time and 80% of the resulting FTEs have their own patient panel: the percentage of counties no longer meeting the HPSA threshold is 84.2%, an additional 4% compared to Table 2.
Number of Counties Meeting the Shortage Threshold Based on Population-to-Provider Ratios Without and With NPs, Using Alternative Inclusion Criteria.
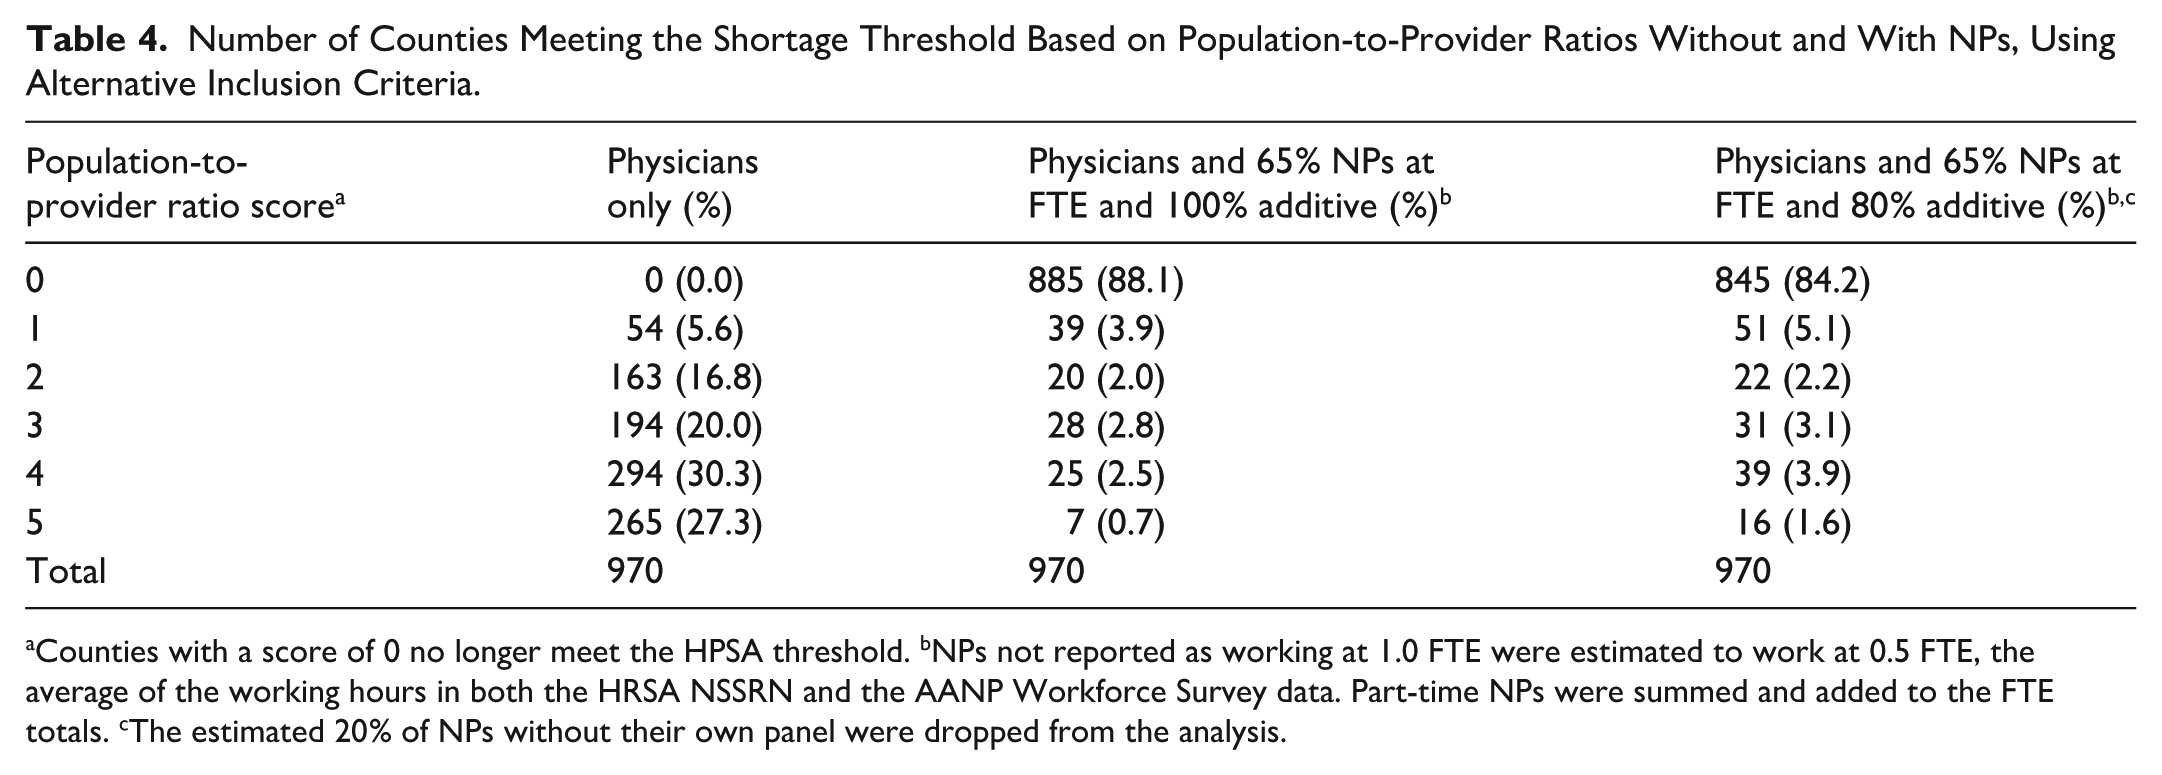
Counties with a score of 0 no longer meet the HPSA threshold. bNPs not reported as working at 1.0 FTE were estimated to work at 0.5 FTE, the average of the working hours in both the HRSA NSSRN and the AANP Workforce Survey data. Part-time NPs were summed and added to the FTE totals. cThe estimated 20% of NPs without their own panel were dropped from the analysis.
Discussion
This study found that including NPs in the population-to-provider ratio for Primary Care HPSA designation dramatically reduced population-to-provider ratio scores, such that a majority of counties no longer met the minimum threshold for an HPSA designation. Constructing county-level population-to-provider ratios comprising only physicians—following HRSA’s current criteria—resulted in scores of 1 or more for all counties (i.e., all counties met the threshold for a shortage area) and scores of 4 or 5 for nearly 60% of counties (reflecting extreme shortages). However, after combining physician and primary care NP FTEs, estimated at 65% full-time and counting 80% of the resulting FTEs as additive to physicians based on having their own patient panel, 80.2% of counties received a score of 0 and rose above the threshold for provider need and only 7.0% received scores reflecting severe need.
We found similar changes among counties coded as full-county and partial-county HPSAs. However, a relatively larger proportion of partial-county HPSAs rose above the designation threshold when we included NPs as primary care providers. It appears that partial-county HPSAs may disproportionally benefit from the inclusion of NPs. Although sub-county or partial-county HPSAs are less rural and have larger populations than full-county HPSAs, NPs are concentrated in the same population-dense areas and adding NPs therefore has a larger impact on their population-to-provider scores.
Under alternative inclusion criteria, we found that a marginal addition of approximately 56,000 NPs increased the share of counties scoring 0 (i.e., not meeting the threshold for designation) by an additional 2.9%, under otherwise conservative assumptions. These findings suggest that targeted programs to enhance NP supply might make a difference to HPSA severity.
We varied the assumed proportion of NPs working full-time between 65% and 80% based on findings from two different national surveys of NPs. Either way, these FTE assumptions are a generalization. NPs’ hours likely vary by location and are known to be mediated by whether states require NPs to have supervisory or collaborative agreements with physicians. Studies of the relationship between state scope of practice regulations and NP labor supply have consistently found that enabling NPs to practice without such agreements leads them to increase their hours, including in rural areas (Bhai & Mitchell, 2025; Dillender et al., 2024; Luo et al., 2021; Markowitz & Adams, 2022). States with shortage areas that continue to meet the HPSA threshold even after the potential future inclusion of NPs in provider ratios could consider adopting full practice authority to support increased NP labor supply and access to care.
Our calculations assume that 1 NP FTE equals 1 physician FTE if NPs manage their own patient panel. This assumption is based on extensive evidence that the quality of primary care provided by NPs and physicians is similar, and on findings that NP-to-physician panel size ratios range from 0.5 to 1.0 (Mayo-Smith et al., 2022). However, evidence on NP panel sizes in the United States is limited and mostly focused on the idea that NP involvement in care teams increases physicians’ panel sizes (Bazemore et al., 2024; Dai et al., 2019). Our primary results are based on survey evidence that 80% of NPs have their own panel; we discard the other 20% of NPs to ensure conservative estimates. Exploring alternative assumptions about NP‑to‑physician FTE equivalence and the extent to which NPs without their own panel expand physician capacity could help to inform future adjustments to HRSA’s designation and scoring methodology.
Importantly, although it is possible to make the majority of HPSAs disappear by including primary care NPs in the population-to-provider ratio, that does not mean there is sufficient access to primary care in all of those areas, and our work does not conclude that they should be de-designated as HPSAs. Instead, our results suggest HRSA’s population-to-provider calculations need modernization to include NPs and better reflect primary care availability across providers. Modernization could also improve government efforts to increase access to primary care by focusing resources on areas with severe or persistent shortages. At the same time, maintaining a physician-only measure may also be helpful for continuity and to illustrate the change in the population-to-physician ratio since HPSA designation methods were first developed.
Finally, as an extension to this work, physician associates could supplement a complete accounting of primary care provider availability. As of the end of 2024, there were 189,907 physician associates in the United States, with 22% or approximately 41,780 working in primary care (National Commission on Certification of Physician Assistants, 2025). NPPES speciality and location data are likely outdated for a substantial proportion of those physician associates. HRSA could consider accounting for those focused on primary care using licensure, certification, or claims data in combination with NPPES taxonomies, or could coordinate with the American Association of Physician Associates on demographic data.
Limitations
There are several limitations to this study in addition to those referenced in the discussion section. First, we successfully matched 77% of NPs from the NPI data to licensure data and removed NPs who were confirmed inactive or unmatched. Twelve states only provided a list of active NP licenses, preventing us from positively identifying inactive licenses in the NPI data and resulting in a higher unmatched rate for those states. Although this reduced our precision, the resulting counts of NPs are likely underestimates and changes to HPSA designations are therefore conservative rather than inflated. In addition, we limited our sample to one practice location per NP to avoid double-counting NPs, with the possible result that we undercounted the number of counties impacted by including NPs.
Second, some NPs may be licensed at the time of data collection but no longer actively practicing (the same could be true of physicians counted by HRSA). Some NPs may have retired or moved into non-clinical roles without updating the board of nursing or NPPES. However, using multiple exclusion criteria to ensure conservative estimates likely blunts the effect of this limitation on our findings.
Third, we analyzed only counties where NPs could be matched from the NPPES to HRSA’s Primary Care file. We matched 970 counties but were unable to match 139. Of those, 69 (50%) had no physicians in HRSA’s records, suggesting they may also lack NPs, and another 62 (44.6%) had fewer than 5 FTE physicians. It is possible that while NPs may live in these areas, they do not work there.
Finally, HPSAs include both county-wide and sub-county rational service areas. We aggregated sub-county rational service areas to the county level due to limitations of our data on NP locations. This aggregation may obscure within-county variation. Aggregating at the county level may also overestimate the provider supply by assuming individuals can access providers in any part of the same county.
Conclusion
This study is the first to estimate the impact of including NPs in the population-to-provider ratio calculations used for Primary Care HPSA designations. Holding all other HPSA criteria constant, adding NPs to existing population-to-provider ratios would reduce the number of counties that meet the current HPSA designation threshold by nearly 80% under conservative inclusion criteria and employment and patient capacity assumptions. This exercise illustrates the need to modernize the HPSA threshold and severity scoring methodology, which were established in the 1970s, to reflect updated primary care provider availability. Including NPs in HRSA’s population-to-provider ratios would be a positive step, along with updates to the scoring and interpretation of those ratios to generate a more precise understanding of persistent shortages and unmet needs for primary care.
Supplemental Material
sj-docx-1-mcr-10.1177_10775587261442035 – Supplemental material for Including Nurse Practitioners in the Calculation of Primary Care Health Professional Shortage Areas
Supplemental material, sj-docx-1-mcr-10.1177_10775587261442035 for Including Nurse Practitioners in the Calculation of Primary Care Health Professional Shortage Areas by L. David Wittkower, Katharine W. V. Bradley and Alicia Plemmons in Medical Care Research and Review
Footnotes
Acknowledgements
The authors gratefully acknowledge Yimin Wang, M.S., West Virginia University, for the creation of maps without financial compensation.
Ethical Considerations
This study was reviewed by the West Virginia University Research Office and determined to be exempt from human subjects research requirements and the need for full institutional review board review (Certificate #4128).
Consent to Participate
Not applicable.
Author Contributions
LDW: Data collection, cleaning, and analysis; manuscript writing; literature review. KWVB: Manuscript writing and editing; project oversight; literature review; corresponding author. AP: Project inception; manuscript editing; consultation.
Funding
The authors disclosed receipt of the following financial support for the research, authorship, and/or publication of this article: This project received no financial support for the research, authorship, or publication of this article, with the exception that the American Association of Nurse Practitioners purchased state board of nursing data from states that require a fee.
Declaration of Conflicting Interests
The authors declared no potential conflicts of interest with respect to the research, authorship, and/or publication of this article.
Data Availability Statement
L. David Wittkower and Katharine W. V. Bradley had full access to all the data in the study and take responsibility for the integrity of the data and the accuracy of the data analysis. HRSA data are publicly available at https://data.hrsa.gov/data/download. NPPES data are publicly available at https://download.cms.gov/nppes/NPI_Files.html. NSSRN data are publicly available at ![]() . State licensure data may not be shared. States require individual agreements and purchases, and not all states make location data publicly available. Therefore, the authors will not share analytic datasets. AANP survey data are proprietary and may not be shared.
. State licensure data may not be shared. States require individual agreements and purchases, and not all states make location data publicly available. Therefore, the authors will not share analytic datasets. AANP survey data are proprietary and may not be shared.
Supplemental Material
Supplemental material for this article is available online.
References
Supplementary Material
Please find the following supplemental material available below.
For Open Access articles published under a Creative Commons License, all supplemental material carries the same license as the article it is associated with.
For non-Open Access articles published, all supplemental material carries a non-exclusive license, and permission requests for re-use of supplemental material or any part of supplemental material shall be sent directly to the copyright owner as specified in the copyright notice associated with the article.