
Abstract
Hospital-physician vertical integration has become a defining feature of the health care landscape. While some evidence exists regarding integration’s effect on clinical outcomes, little has examined patient-reported experience. We used the 2021 Medicare Current Beneficiary Survey, constructing psychometric scales of care coordination and quality, communication, and accessibility from survey responses. We analyzed how patient experience with each scale differed by the proportion of care received from integrated physicians, adjusting for patients’ characteristics. Integrated care was significantly and positively associated with patients’ perceptions of coordination and quality. This relationship was driven by patients with high clinical complexity, with effects twice as large as for patients with low clinical complexity. However, integrated care was not significantly associated with communication or accessibility. These findings suggest a nuanced relationship between integration and patient experience. Policymakers, who often discuss integration in terms of outcomes and affordability, should also consider ways in which it shapes patients’ experiences.
Introduction
In recent years, hospital-physician integration has become a defining feature of the health care provider landscape. Hospitals have acquired physician practices and directly employed physicians in large numbers (Nikpay et al., 2018).
Today, over half of physicians are estimated to work for an integrated entity (Avalere Health, 2021, 2024). This surge in hospital-physician integration has inspired controversy. Critics and policymakers have pointed out sharp increases in prices and spending (Baker et al., 2014; Capps et al., 2018; Koch et al., 2017) without offsetting improvements in quality (Carlin et al., 2015). Advocates, however, have replied that integration across providers is needed to improve patient care. Care coordination from inpatient to outpatient settings has been essential to many health reform efforts, and hospital-physician integration may improve such care by allowing teams of primary care physicians, specialists, and surgeons to work more collaboratively under the same organizational structure. A number of studies have focused on clinical outcomes, and results have been largely mixed (Harris et al., 2025; Scott et al., 2017). However, research assessing the effect of integration on patients’ self-reported experiences has been conspicuously limited even though this metric would seem to be highly relevant for assessing improvements in care coordination.
In this study, we used a detailed survey of Medicare patients paired with medical claims to study the extent to which patient experience differed from exposure to integrated physicians. Specifically, we used the Medicare Current Beneficiary Survey (MCBS), and, drawing from scales in the existing literature, we addressed the research question, “do patients who receive relatively more of their care from integrated physicians report better experience with care coordination and quality, communication, and accessibility compared to patients who receive relatively more of their care from independent physicians?” Ultimately, our study provides policymakers with a much-needed and patient-centered perspective using information not available anywhere else.
Conceptual Framework
At the heart of our conceptual framework sits the relationship between a physician’s integration status and their patients’ care experiences. While a spectrum of hospital-physician integration exists, more recent literature has tended to focus on the form of integration that has become common today, which is hospitals directly employing physicians (Harris et al., 2025). This is the concept of integration that we adopted for this study; in our framework, we focused on the experience of patients whose physicians were hospital-employed (i.e., integrated), which we measured using methods established in the literature.
Integrated physicians can be expected to work in a practice environment that differs in a number of ways from that of independent physicians. In particular, integrated health systems have been shown to have more developed information technology systems and resources than do independent practices (Office of the National Coordinator for Health Information Technology, 2021; Winter et al., 2023). Integrated health systems are also more likely to have more developed management systems and greater staffing resources than independent physician practices (Bishop et al., 2016; Lin et al., 2021). Theoretically, such differences in practice environment can influence the practice style of physicians and, relatedly, the care experience of their patients. In this vein, studies demonstrate that physicians change their practice style when moving from one practice setting to another, as different practice settings have different technological, social, and financial characteristics (Molitor, 2018; Young et al., 2023).
As such, it is not surprising that prior studies have found physician integration status to be a predictor of several distinct clinical behaviors, ranging from diagnostic coding practices (Post et al., 2022) to the intensity of treatment approaches (Post et al., 2023). Consistent with such findings, we hypothesize that the practice environment in which physicians work (in the case of this study either integrated health systems or independent practices) influences the way in which they interact with patients, in turn coloring how patients perceive the delivery of their care. For instance, relative to the patients of independent physicians, those under the care of integrated physicians can be expected to experience better communication and coordination regarding their care, as their physicians’ practice environments are more likely to have advanced information technologies, including electronic portals and medical records with more up-to-date information. Patients of integrated physicians may also have better access to care than patients of independent physicians, as integrated health systems, in comparison to independent practices, may be more likely to offer weekend hours, a larger roster of clinical staff available for appointments, and easier scheduling of follow-up visits.
This study assesses the extent to which there exists a relationship between integration status and patients’ perceived care experience. We recognize that patient experience is a complex, multifaceted concept. As such, we conceptualized care experience as composed of three distinct components—coordination and quality, communication, and accessibility—and we controlled for factors known to influence experience independently of integration status, such as income and geography (Henning-Smith et al., 2021; Okunrintemi et al., 2019).
New Contributions
Our analysis offers three new contributions to the existing literature. First, to our knowledge, there are no other studies that examine the relationship between integration and patient-perceived experience in both inpatient and outpatient settings. Prior work that analyzed integration and patient-perceived experience has relied on data from the Hospital Consumer Assessment of Healthcare Providers and Systems survey, which is limited to patients with inpatient hospital stays and may not generalize to the full patient population. In using the MCBS, we were able to generalize our findings to a broader set of patients. Second, we extended and validated prior work on patient experience scales by conducting confirmatory factor analysis. Third, by accounting for patient clinical complexity in our analyses, we provide insight about how patient perceptions of care with integrated physicians vary by the level of patients’ clinical needs.
Method
Data and Sample
Our data sources were the 2021 MCBS, 2021 Medicare claims for each survey respondent, and the 2021 Medicare Data on Provider Practice and Specialty (MD-PPAS) data set. The MCBS is the most comprehensive and nationally representative Medicare patient survey in the country. It is conducted in person three times per year and contains over 900 data points on each of its more than 10,000 respondents. From this survey, we gathered patient age, sex, race, urban/rural residence, and household income. We linked patients’ survey responses to their Medicare medical claims, which detail the care delivered to patients, including which physicians they saw, which diagnoses they had, and which procedures, hospitalizations, and other care they received. The MD-PPAS data set, which links each physician with the tax identifier number of the organization from which the physician bills the majority of their Medicare services, was used to determine physicians’ integration statuses. The rich analytical data set that resulted from our merging of these data sources included patients’ social and demographic characteristics, health statuses, and perceptions of their care. In addition, we were able to determine with these data whether physicians were independent or hospital-integrated.
We applied several inclusion and exclusion criteria. First, we required patients to have 12 months of continuous coverage and at least one physician visit in 2021; this requirement allowed us to calculate the percentage of integrated care each patient received. To preserve a consistent sample across the three scales we constructed to measure patient experience, we also required patients to have complete responses to every survey item in each scale. We excluded patients who lived outside the 50 U.S. states or the District of Columbia. We followed the protocol of prior MCBS research and excluded patients 64 and under (Henning-Smith et al., 2021). Finally, we excluded patients with Medicare Advantage from our main analysis because we did not have medical claims for such patients. Our sample flow diagram can be found in Supplemental Appendix 1.
Independent Variable
Our independent variable—which we will refer to as the “integration index” going forward—measured the amount of a patient’s care that was provided by an integrated physician. We determined whether a physician was independent or integrated using a claims-based algorithm originally developed by Hannah Neprash and colleagues, supplemented by data from MD-PPAS (Neprash et al., 2015). For an extended discussion concerning the algorithm and the supporting data, please see Supplemental Appendix 2. Our denominator for the integration index was the total number of physician claims the patient had in 2021. Our numerator was the number of claims connected to an integrated physician. We excluded claims with physicians in radiology, anesthesiology, emergency medicine, and pathology because these specialties are always hospital-based, so there is no opportunity for comparison to independent physicians in these specialties.
Dependent Variables
From the MCBS, we adopted three scales for patient experience that we based on existing literature: care coordination and quality; communication; and accessibility. Each scale was constructed from a set of MCBS survey questions with Likert-type responses from 1 to 4, where higher numbers indicated a better experience. For each patient, we calculated a score for each scale that was the sum of their Likert-type responses.
The four survey questions comprising the care coordination and quality scale, along with the three questions comprising the accessibility scale, came from Bernal and colleagues’ analysis of MCBS data (Bernal et al., 2019). The four questions comprising the communication scale replicated the “How Well Providers Communicate with Patients” measure from the Consumer Assessment of Healthcare Providers and Systems Clinician and Group Survey 3.0 (Agency for Healthcare Research and Quality, 2020). The survey questions are shown in Table 1, and the distribution of patient responses to each question is shown in Figure 1.
Medicare Current Beneficiary Survey Items Mapped to Patient Experience Scales.
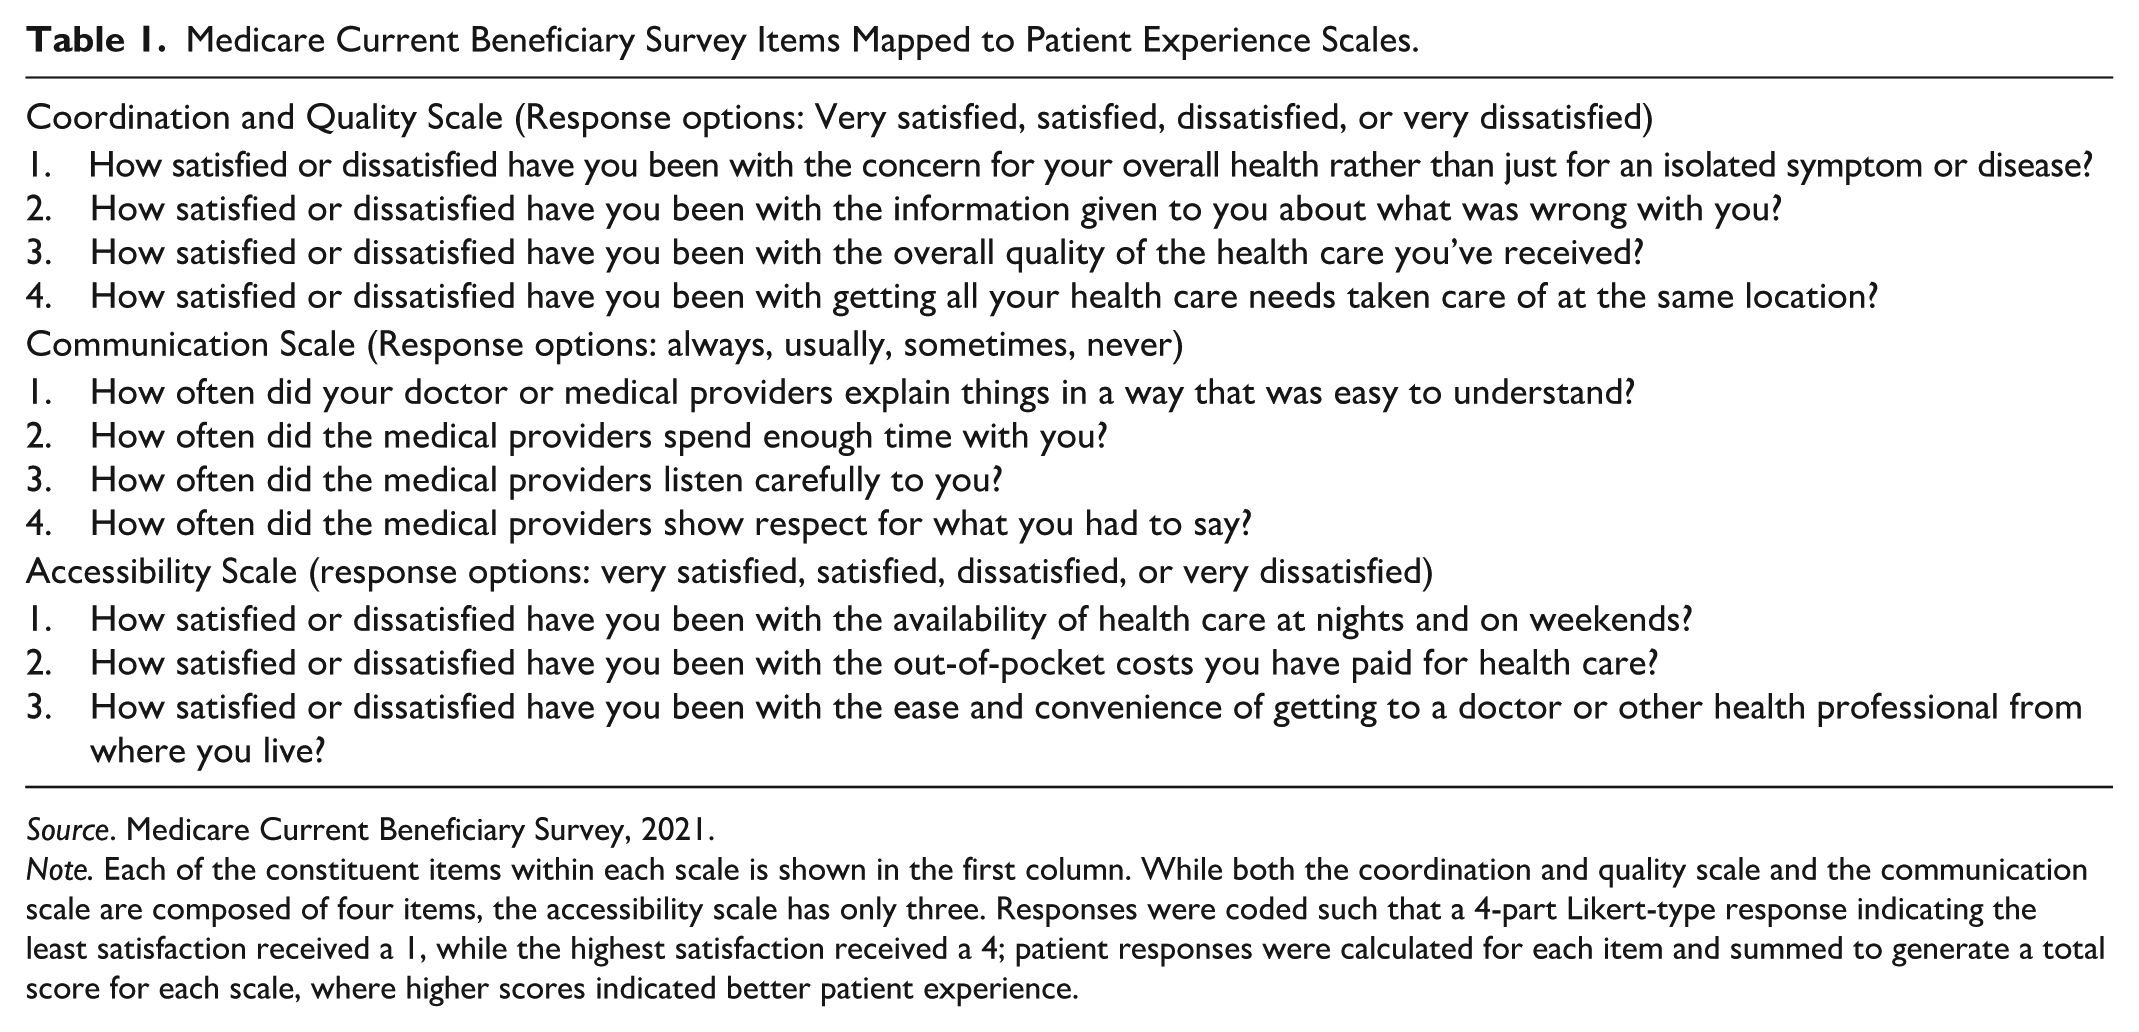
Source. Medicare Current Beneficiary Survey, 2021.
Note. Each of the constituent items within each scale is shown in the first column. While both the coordination and quality scale and the communication scale are composed of four items, the accessibility scale has only three. Responses were coded such that a 4-part Likert-type response indicating the least satisfaction received a 1, while the highest satisfaction received a 4; patient responses were calculated for each item and summed to generate a total score for each scale, where higher scores indicated better patient experience.
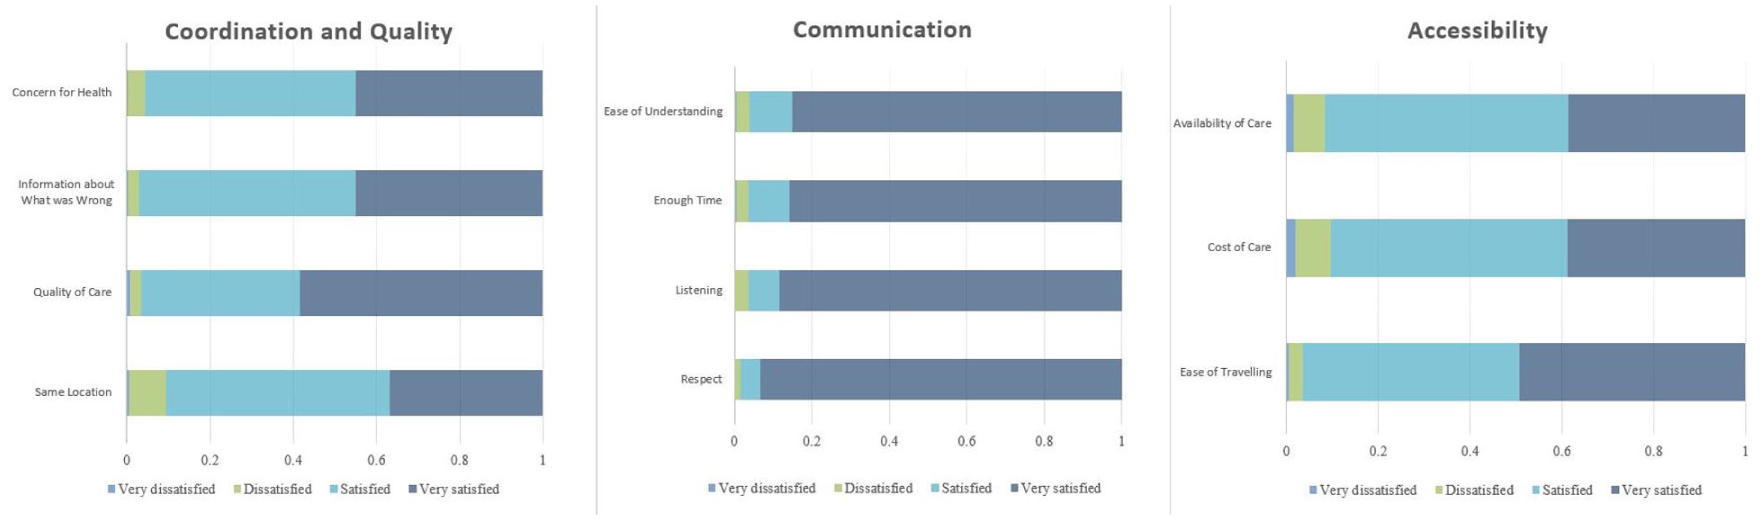
Patient Responses to Medicare Current Beneficiary Survey Items.
To test the validity of these scales for our study, we conducted confirmatory factor analysis on the survey questions that had been grouped together in the previously noted studies. As indicated by the root mean squared error of approximation (.044), comparative fit index (.980), Tucker-Lewis index (.973), and standardized root mean squared residual (.029), our mapping of survey items to latent variables (i.e., scales) was appropriate. We further calculated Cronbach’s alpha for each scale to assess internal consistency. The results indicated our scales were generally reliable, as our coordination and quality scale had an alpha of 0.83, our communication scale had an alpha of 0.78, and our accessibility scale had an alpha of 0.64. Taking these additional steps gave us confidence not only that the survey items were appropriately grouped together to measure the latent constructs of interest, but also that the items within each scale were measuring unique dimensions of patients’ care experiences and doing so consistently (see Supplemental Appendix 3 for additional detail regarding both our confirmatory factor analysis model and our Cronbach’s alpha calculations).
Covariates
Following prior work, we obtained from the MCBS patient age, sex, race/ethnicity, urban/rural residence, household income, and reason for Medicare eligibility—either on account of age or a qualifying disability such as end-stage renal disease (ESRD; Henning-Smith et al., 2021; Herrin et al., 2018; Loresto et al., 2017; Ndugga et al., 2024). From the Medicare claims, we calculated patients’ Charlson Comorbidity Index scores to quantify health status (Gasparini, 2018; Quan et al., 2011). We measured urban versus rural residence using Rural-Urban Commuting Area (RUCA) Codes assigned to each enrollee by the MCBS. RUCA codes range from 1 (most urban) to 9 (most rural), and researchers have often drawn a rural-urban distinction between codes 3 and 4, which we followed here (3 and under corresponding to urban; Friedman & Holmes, 2022; Patel et al., 2023; Wu et al., 2023). We included rurality because prior work has shown that rurality affects patient experience (Henning-Smith et al., 2021) and that rural markets have greater levels of hospital-physician integration than urban markets (Post, 2021).
Analysis
To test the relationship between integration and patient experience, we estimated separate linear probability models, controlling for covariates. For each scale, we identified top-scoring patients, defined as those whose aggregate score was at least 85% of the maximum possible score. We used the 85%-of-possible-score definition of highly satisfied because it fit the distribution of our data, in which many responses were near the maximum value on their respective Likert-type scales (see Supplemental Appendix 3D for detail). We compared this highly satisfied group of patients to all other patients. As with prior research on patient experience using the MCBS (Bernal et al., 2019; Bogner et al., 2015), this approach of comparing highly satisfied patients to all others generated dichotomous variables that took the value of 1 for highly satisfied patients and 0 for everyone else. In addition, we hypothesized that any benefits of integration—such as improved care coordination—would be especially valued by patients with more complex clinical needs. For this reason, we estimated linear probability models for patients in the highest quartile of Charlson scores and compared the results to those from patients in the lowest quartile.
We estimated the following multivariate linear probability models:


where the outcomes for our three scales of patient experience were denoted Coordination and Quality i , Communication i , and Accessibility i , each a dichotomous variable indicating whether respondent i reported high satisfaction with the relevant dimension of care experience. Our variable of interest, Integrationi, represents respondent i’s integration index, as discussed previously. Our regressions also controlled for several covariates: Race i is a categorical variable, taking on a value of “White,” “Black,” “Hispanic,” or “other” to denote a respondent’s race/ethnicity; Sexi denotes the respondent sex, either male or female; Comorbidityi, the means by which we controlled for health status, represents each respondent’s Charlson Comorbidity Index score; Incomei denotes the respondent income, measured in thousands of dollars; Geographyi is a dichotomous variable, taking on a value of either “urban” or “rural” according to the RUCA code of a respondent’s home address; Agei represents the respondent age; and Eligibilityi is a dichotomous variable indicating the means through which a respondent qualified for Medicare, either on account of age or for another reason (e.g., disability). Finally, our models include an intercept, β0, and an error term, εi. Our estimation results can be seen in Table 3. We also ran each of the above models for patients in the highest and lowest quartiles of Charlson comorbidity scores, with results presented in Supplemental Tables 9 and 10 of Supplemental Appendix 5.
Limitations
Our study had several limitations. First, we focused exclusively on patients in the traditional Medicare program. As such, our results may not reflect the experiences of patients with Medicare Advantage, Medicaid, or commercial health coverage; however, with over 30 million Americans currently enrolled in traditional Medicare, the implications of our findings are still broadly relevant.
Moreover, in looking at claims, we did not distinguish between patients who were seen in primary care settings and patients who were seen in specialty settings. It is possible that what patients value in their experience for primary care may be different from what they value in their experience for specialty care, and this has implications for the relationship between integrated care and patient experience.
Finally, our study design only allowed us to demonstrate associations, not causal relationships. While we adjusted for many covariates known to influence patient experience, there are still others we could not control for that other researchers have hypothesized affect patient experience, including the length of time between patients’ visits (Setodji et al., 2019) and an environment’s teaching status (Carvajal et al., 2014). Accordingly, further study is warranted to investigate the particular causal mechanisms by which hospital-physician integration might affect patients’ experiences with their care.
Results
Unadjusted Analysis
We identified 1,819 MCBS respondents for the study based on the inclusion and exclusion criteria. The sample was 51.95% female with an average age of approximately 77 years. Average household income was $83,929 and 73.67% of respondents lived in urban areas, while 26.33% lived in rural areas. The average percentage of patient-level claims attributable to an integrated physician was 42.81%.
Our measure of patient exposure to integrated physicians (i.e., the integration index) was continuous. However, to provide a general sense of the differences between patient groups, we constructed Table 2, in which we compare patients who received most of their care from an integrated physician (over 50%) to those who received most of their care from an independent physician (50% or under).
Medicare Current Beneficiary Survey Items Mapped to Patient Experience Scales.
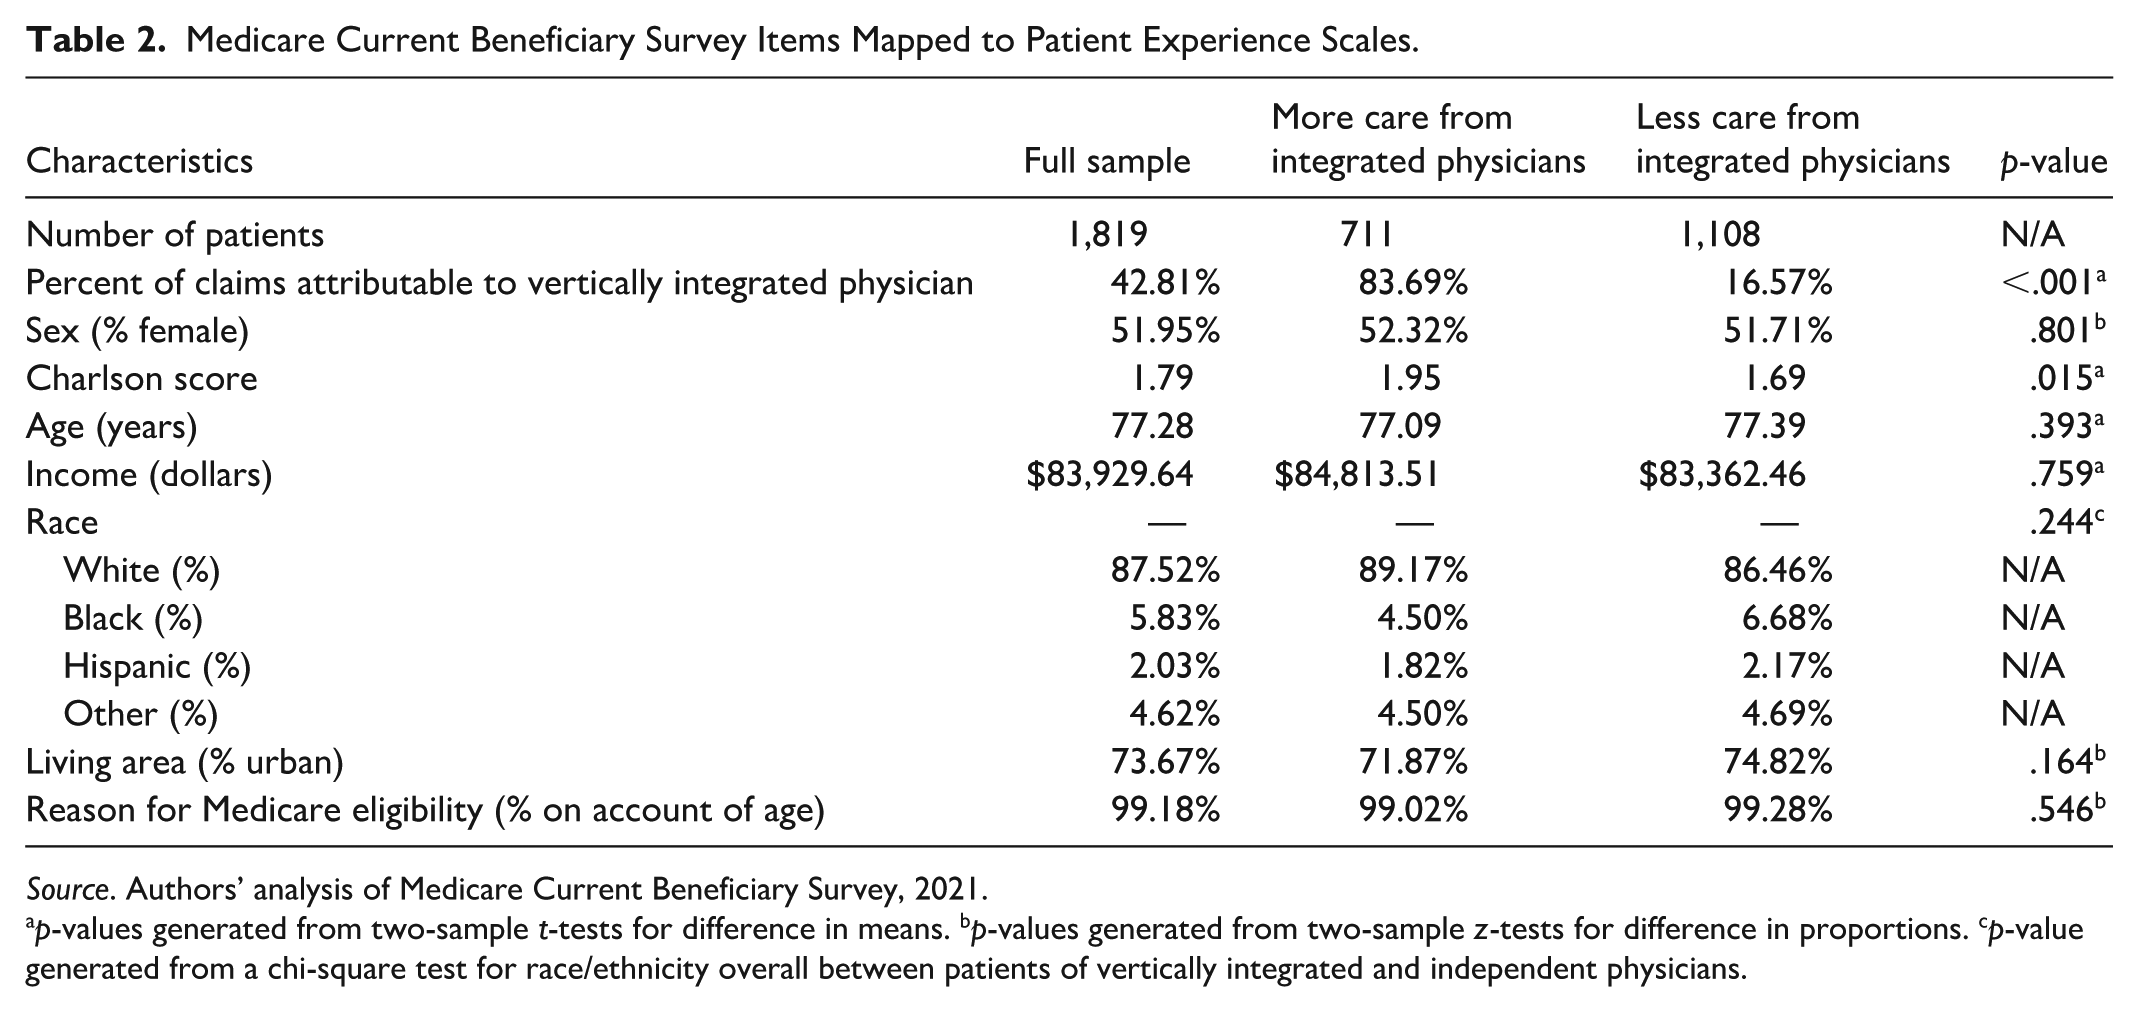
Source. Authors’ analysis of Medicare Current Beneficiary Survey, 2021.
p-values generated from two-sample t-tests for difference in means. bp-values generated from two-sample z-tests for difference in proportions. cp-value generated from a chi-square test for race/ethnicity overall between patients of vertically integrated and independent physicians.
Just over 60% of our sample was treated primarily by independent physicians, while the remaining patients received a majority of their care from integrated physicians. With respect to six of our seven covariates—sex, age, income, race, geography, and reason for Medicare eligibility—the group of patients who typically obtained care from an independent physician was, on average, not significantly different from the group of patients who normally saw an integrated physician. For example, the average age among patients of integrated physicians was 77.09 years (vs. 77.39 years among patients in the independent group, p = .393), and average income was $84,814 (vs. $83,362, p = .759).
The average Charlson Comorbidity Index score was larger for the patients of integrated physicians relative to those of independent physicians (1.95 vs. 1.69, p = .015). This suggests that on average, patients of integrated physicians in this sample had slightly more complex health conditions (e.g., an average of about 0.25 more chronic conditions, such as the presence of peripheral vascular disease or diabetes without complications), a finding that supported our decision to include clinical complexity (i.e., Charlson score) as a covariate. For an unadjusted analysis that compares patient responses to individual survey questions by preponderant integration status of care received, please see Supplemental Appendix 4.
Multivariable Linear Probability Models
Table 3 presents results from the multivariate linear probability models. We found that the integration index was positively associated with a patient’s experience with care coordination and quality. Specifically, a 1 percentage point increase in the integration index was associated with a .09 percentage point increase in the likelihood of a patient reporting very high satisfaction with the coordination and quality of care (95% confidence interval: .03 percentage points to .15 percentage points). However, the integration index was not associated with a patient’s experience with communication. A 1 percentage point increase in the integration index was associated with a .01 percentage point decrease in the likelihood of a patient reporting very high satisfaction (95% confidence interval: −.05 percentage points to .02 percentage points). Similarly, perceived accessibility was not significantly associated with integration. A 1 percentage point increase in the integration index was associated with a .01 percentage point increase in the likelihood of reporting very high satisfaction with accessibility (95% confidence interval: −.05 percentage points to .08 percentage points).
Association Between Medicare Beneficiaries’ Satisfaction With Care Coordination and Quality, Communication, and Accessibility and the Receipt of Care From a Vertically Integrated Physician, 2021.
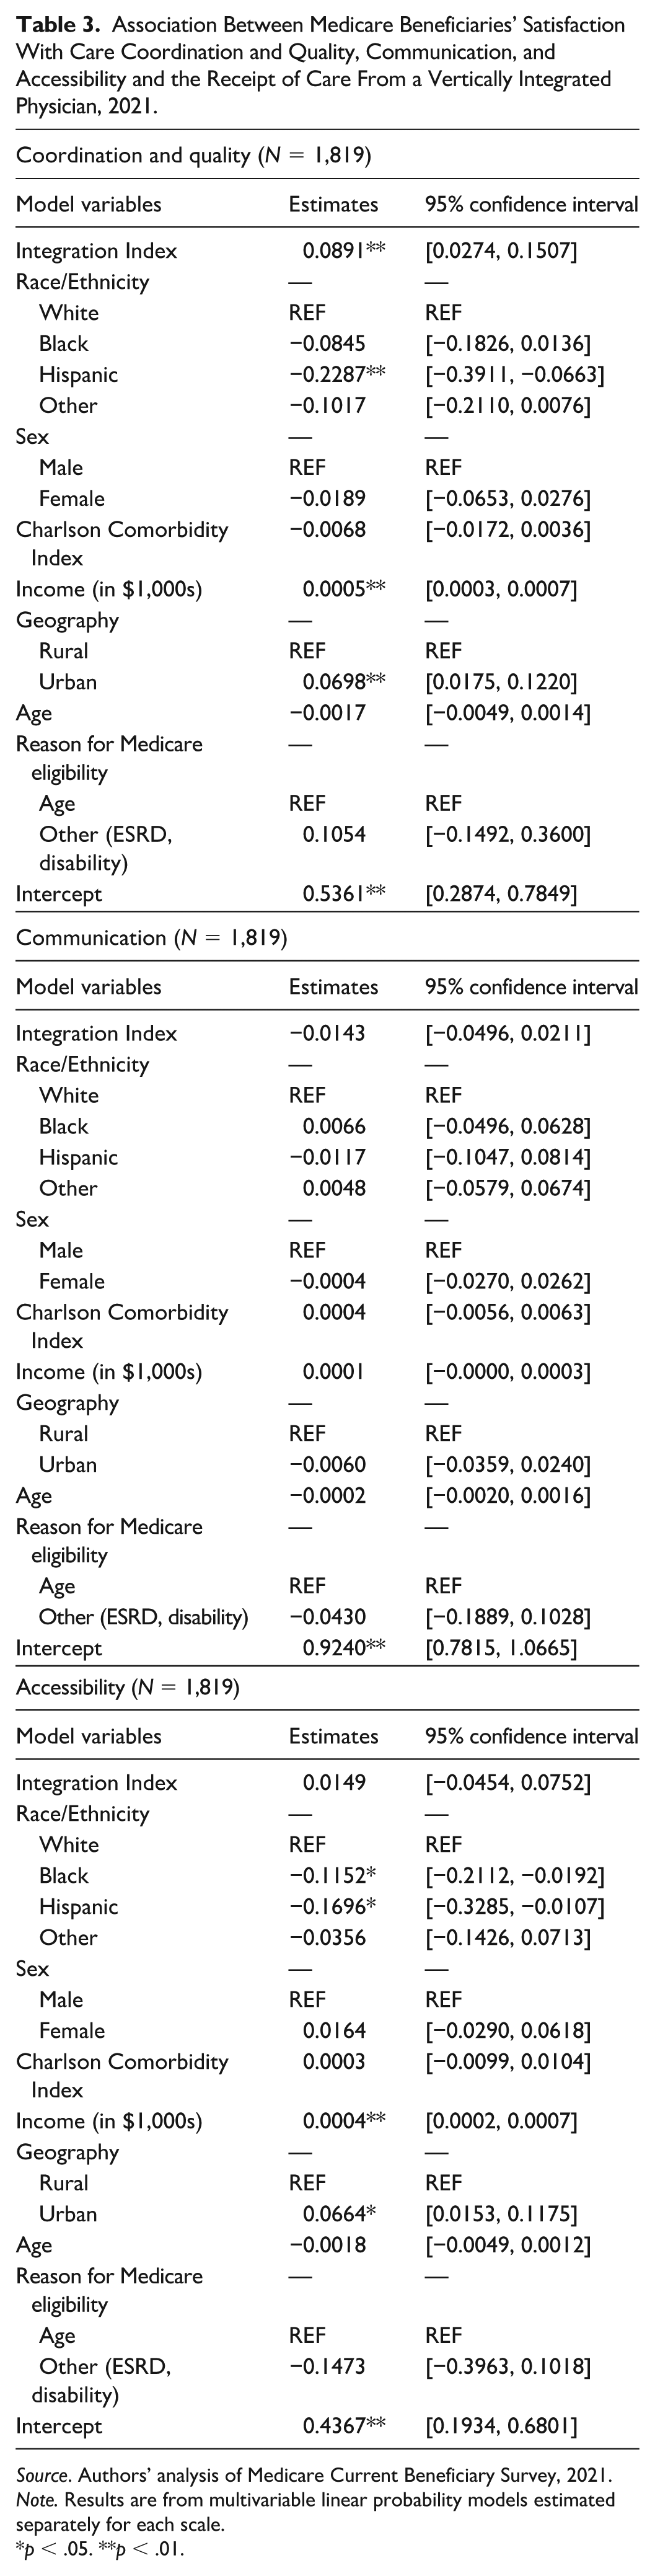
Source. Authors’ analysis of Medicare Current Beneficiary Survey, 2021.
Note. Results are from multivariable linear probability models estimated separately for each scale.
p < .05. **p < .01.
To put our estimates into perspective, patients in the 25th percentile of the integration index received 16.95% of their care from an integrated physician, while those in the 75th percentile received 77.78%. Each of our three scales in Figure 2 depicts the change in a patient’s probability of reporting very high satisfaction if that patient were to go from receiving 16.95% of care from an integrated physician to instead receiving 77.78% of care from an integrated physician, all else equal. As can be seen, while such a change in the receipt of integrated care would likely change little with respect to a patient’s reported experience with accessibility and communication, it would be expected that moving from the 25th to the 75th percentile of integrated care received would be associated with a 5.4 percentage point increase in a patient’s probability of being “highly satisfied” with coordination and quality based on our metric.
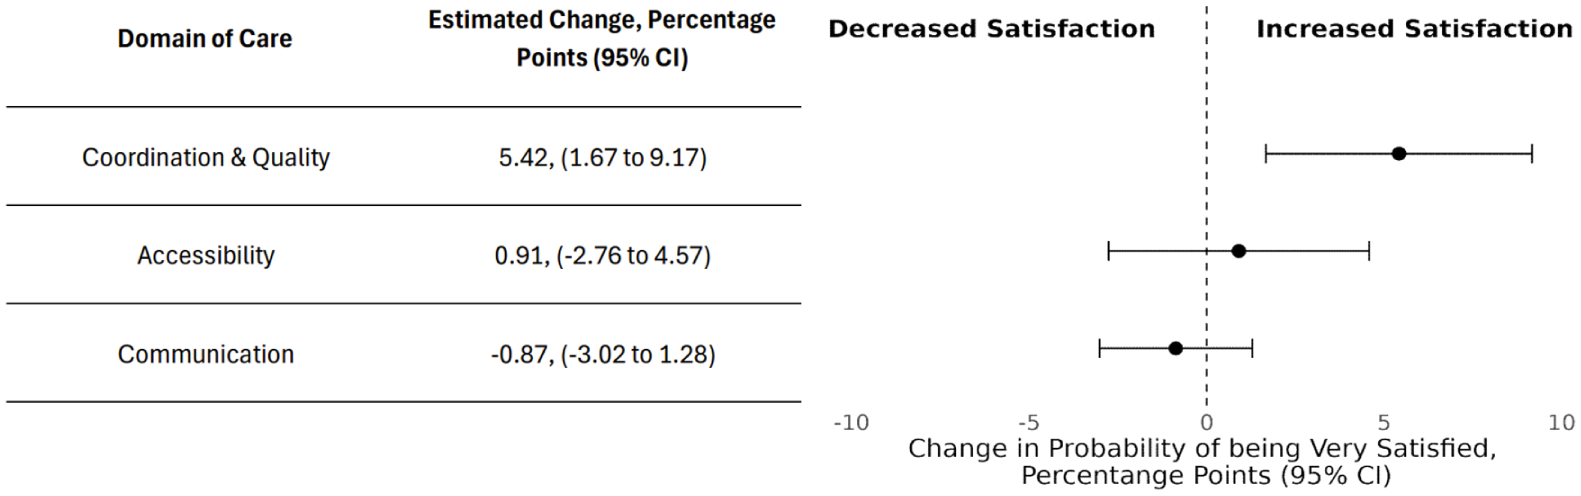
Change in Probability of Being Highly Satisfied With Each Dimension of Care Given an Increase From the 25th Percentile of the Integration Index to the 75th Percentile.
Finally, we tested whether integrated care had a different association with care experience for healthier patients compared to sicker patients. We found that sicker patients drove the positive association between integration and patient experience with coordination and quality of care. Specifically, our linear probability models for sicker patients showed that a 1 percentage point increase in the integration index was associated with a 0.15 percentage point increase in the likelihood of a patient being very satisfied with care coordination and quality (p = .024). This coefficient was nearly twice the size of the coefficient for the same model applied to patients in the healthiest quartile (.084, p = .091). However, as with the results from our full sample, neither the healthier nor the sicker patients showed any association between the integration index and care experience with respect to accessibility or communication (see Supplemental Table 9 and Supplemental Table 10 in Supplemental Appendix 5 for detail).
Sensitivity Analyses
We tested the robustness of our specification (linear probability models) to logit models (see Supplemental Table 5 and Supplemental Table 6 in Supplemental Appendix 5). For each of our three scales, the average marginal effect of a 1 percentage point increase in the integration index was substantially similar to the coefficients from our linear probability models (e.g., the logit marginal effect for the coordination and quality scale was .0895, p = .004, very similar to the estimated coefficient of .0891, p = .005). We also tested models in which the sample varied for each of the three scales (i.e., as long as all the questions from one scale were complete, we did not require patients to also have complete answers for the other two scales to be included). The results were qualitatively similar: an increase in the integration index was significantly associated with patients’ reported experience for coordination and quality, but not for care communication or accessibility. Specifically, a 1 percentage point increase in the integration index was associated with a .06 percentage point increase in the likelihood of a patient reporting a score reaching the threshold of high satisfaction (p < .01, see Supplemental Table 13 of Supplemental Appendix 5 for detail). In addition, we examined the sensitivity of our model to using different cutoff thresholds to define our satisfied and unsatisfied comparison groups. In Supplemental Table 7 in Supplemental Appendix 5, we used a 75%-of-possible-score threshold, as opposed to the 85% threshold we used in our primary analyses. The results were qualitatively similar. Integration was significantly and positively associated with patients’ reported experience for care coordination and quality, but it was not a significantly associated with either communication or accessibility. Specifically, a 1 percentage point increase in the integration index was associated with a 0.10 percentage point increase in the likelihood of a patient’s reported score reaching the threshold for high satisfaction with care coordination and quality (p < .01). As a further sensitivity test, we also lowered our threshold to 50% (i.e., comparing respondents who were more satisfied than not with their care to respondents who were less satisfied). The results of that analysis can be seen in Supplemental Table 8 in Supplemental Appendix 5. Integration was not significantly associated with any dimension of care; however, such a finding was expected given the top-heavy nature of our data. With over 95% of respondents reporting that they were more satisfied than not with the care they received, the lack of significance can be seen in large part as a consequence of the lack of variance in our dependent variable.
Discussion
In this study, we used patient survey data to examine the relationship between integrated care and patient care experience. We highlight several key findings. First, patients treated mostly by integrated physicians and patients treated mostly by independent physicians were similar across many demographic domains, including sex, age, income, race, geography, and reason for Medicare eligibility. Second, both wealthier patients and those residing in urban areas reported better experiences with accessibility and coordination and quality relative to their less wealthy and rural counterparts. After adjusting for confounders, we found that integrated care was significantly and positively associated with patients’ experience with care coordination and quality, and that this relationship was driven largely by patients at the highest levels of clinical comorbidities. Last, regardless of patient comorbidity level, we found no significant association between integration and patient experience with communication or accessibility.
Our findings confirm and expand the existing literature. Specifically, our finding that wealthier and urban patients report better care experience has precedent in prior analyses (Anderson et al., 2015; Henning-Smith et al., 2021; Hero et al., 2017; Okunrintemi et al., 2019). We add to the small body of research that considers patient-reported experience with hospital-integrated physicians. Relying on the Hospital Consumer Assessment of Healthcare Providers and Systems survey, which uses a sample of patients with inpatient encounters, Short and Ho (2020) found some evidence indicating that integration may be associated with a marginal decrease in patients’ satisfaction with their care. Our findings build on their research by examining the relationship between patient experience and integration for a sample of patients that received outpatient as well as inpatient care. We find—consistent with what some advocates of integration have argued—that improvements in care coordination appear to be associated with patients receiving more care from integrated physicians. Moreover, we add that clinically complex patients appear to benefit most from integrated care through better care coordination.
Integration, however, showed no relationship with improved provider-patient communication or accessibility. This may reflect certain dynamics of the patient care experience. First, as confirmed both by our own factor analysis and more broadly in the literature, patient experience is a multifaceted concept. In other studies, it is common for the independent variable of interest to be associated with some but not all scales measuring distinct dimensions of patient experience (Barnett et al., 2014; Bernal et al., 2019; Bogner et al., 2015). This reflects the underlying reality that patients may be pleased with some aspects of the care experience but not all. In the case of hospital-physician integration, larger budgets and better technology may improve clinical team collaboration, but such enhanced resources may not fundamentally change how physicians interact with patients. For example, integrated systems might offer patients more services at the same location or make better use of information technology systems to share medical information. Such features could improve patients’ experience with care coordination and quality. At the same time, physicians, regardless of the environment in which they work, might spend a similar amount of time with patients, explain things in a similar way, and take on a similar number of night and weekend appointments. This would cohere with our null findings with respect to accessibility and communication.
Our study adds important information to an active policy debate. Proponents of integration argue that its costs may be justified by improving care coordination, reducing administrative complications, and contributing to economies of scale. Our research supports such coordination-related assertions, and it does not rule out possible improvements in other respects. However, if such benefits exist, they are subtle enough to go largely unnoticed by patients who report no improvements in the communication of care they receive from integrated physicians or the accessibility of that care. Indeed, in recent years, antitrust authorities have scrutinized vertical relationships in health care, perhaps skeptical that such arrangements offer much value for patient care. The implication from our study is that while promises of integration’s positive influence on patients may be supported with respect to the coordination and quality of care, integration is not a cure-all for every dimension of patient experience.
Conclusion
Patients reported better care coordination from hospital-integrated physicians but did not report better accessibility or communication. Policymakers should note that even with improvements to a particular dimension of care experience, integration should be weighed against its well-documented adverse consequences for affordability.
Supplemental Material
sj-docx-1-mcr-10.1177_10775587251400535 – Supplemental material for Patient Perceptions of Care From Hospital-Integrated Physicians
Supplemental material, sj-docx-1-mcr-10.1177_10775587251400535 for Patient Perceptions of Care From Hospital-Integrated Physicians by Asa Hartman, Danielle Duran, Isabella Ratto, Gary Young and Brady Post in Medical Care Research and Review
Footnotes
Ethical Considerations
Our study was deemed IRB exempt.
Consent to Participate
Our study was IRB exempt.
Consent for Publication
Not applicable.
Funding
The authors disclosed receipt of the following financial support for the research, authorship, and/or publication of this article: This project was funded exclusively by Professor Brady Post’s AHRQ grant: K01HS029278.
Declaration of Conflicting Interests
The authors declared no potential conflicts of interest with respect to the research, authorship, and/or publication of this article.
Data Availability Statement
The data are available upon request and purchase from the Center for Medicare and Medicaid Services.
Supplemental Material
Supplemental material for this article is available online.
References
Supplementary Material
Please find the following supplemental material available below.
For Open Access articles published under a Creative Commons License, all supplemental material carries the same license as the article it is associated with.
For non-Open Access articles published, all supplemental material carries a non-exclusive license, and permission requests for re-use of supplemental material or any part of supplemental material shall be sent directly to the copyright owner as specified in the copyright notice associated with the article.