
Abstract
This study used three national data sources to estimate the size and distribution of Community health workers (CHWS) in the United States. CHWs were identified in the National Plan and Provider Enumeration System (NPPES; 2022), Bureau of Labor Statistics (BLS) data (2021), and American Community Survey (ACS; 2020). The rate of CHWs per 100,000 people was calculated and compared across states. Then, the study assessed if the rate of CHWS per the population varied in states with or without CHW certification or reimbursement in a series of one-way analyses of variance (ANOVAs). Nationally, the rate of CHWs per 100,000 people in NPPES is 7.44, 18.37 in the BLS, and 35.44 in the ACS. No significant differences in the mean number of CHWs per 100,0000 people in states with or without certification and/or reimbursement was found. Further exploration of available data sources is needed to provide new insights and potential solutions to employ, fund, and sustain the CHW workforce.
Keywords
Community health workers (CHWs) in the United States are an important workforce, and growing evidence demonstrates the effectiveness of including CHWs in interventions to reduce health disparities in vulnerable populations (Rosenthal et al., 2010; Sabo et al., 2017). While definitions of CHWs vary, the role often comprises frontline public health workers usually sharing the language, ethnicity, socioeconomic status, or life experience of the community members they serve (Scharff et al., 2022). Originally, the role of CHWs in the United States focused on improving maternal and child health outcomes (Glenton et al., 2021). Over the last two decades, the roles of CHWs have expanded and now include support for a broader set of populations (Glenton et al., 2021; Scott et al., 2018). The roles and tasks of CHWs can be organized into four categories: (a) health promotion (e.g., the provision of information and counseling to encourage communities to participate in safe sex, HIV testing, and family planning; Glenton et al., 2021); (b) disease prevention (e.g., the provision of immunization clinics; Wells et al., 2021); (c) facilitating resource connections for social needs (e.g., food security and access to healthy foods; Shah et al., 2015); and (d) community health surveillance (e.g., monitoring for infectious diseases such as COVID-19; de Deus e Méllo et al., 2022). Roles and functions of CHWs also likely vary by the setting in which they are employed. CHWs traditionally worked in community-based organizations and are increasingly working in hospitals and large health settings (Malcarney et al., 2017), as well as in health departments (Ignoffo et al., 2024).
As the role of CHWs expands and the importance of their contributions is further understood, more states are seeking to train and deploy this workforce (The National Academy for State Health Policy [NASHP], 2021). Increasingly, states are formalizing certification of CHWs and creating reimbursement mechanisms for CHWs. Credentialing or certification is a formal way to define a workforce’s roles and tasks, create a clear path to training and recruitment, and demonstrate professional credibility for reimbursement (Kissinger et al., 2022). While there are commonly recognized skills and competencies for this occupation identified by CHW national organizations (e.g., capacity building, advocacy, outreach, and individual and community assessment; CHW Core Consensus Project, 2022), states vary in training and certification requirements for CHWs (Kissinger et al., 2022). Among the states that offer CHW certification, some are regulated directly by the state, while others work with state organizations that offer a private certification process (Association of State and Territorial Health Officials [ASTHO], 2018; NASHP, 2021).
In addition to varied credentialing standards and practices across states, payment for CHW-delivered services also varies widely. There are four primary ways in which CHW roles and services are supported in the United States: (a) individual states’ Medicaid plans—typically for preventive-based services (Albritton et al., 2016; Haldar & Hinton, 2023; The Medicaid and CHIP Payment and Access Commission [MACPAC], 2022); (b) Section 1115 Demonstration waivers—which allow states additional flexibility in how to use Medicaid dollars to support CHW service delivery (Albritton et al., 2016); (c) Managed Care Organizations (MCOs)—which can either directly employ or contract CHWs (Albritton et al., 2016; Haldar & Hinton, 2023); and (d) Accountable Care Organizations (ACOs)—which provide coordinated care among health care providers and can cover services provided by CHWs (e.g., case management, care coordinators, or health care navigators; Albritton et al., 2016; Haldar & Hinton, 2023).
Lack of uniformity in how states support CHWs has important implications for how CHWs are paid, who is eligible for payment, whether CHWs are certified, and how health care systems and organizations integrate CHWs into their care teams (Albritton et al., 2016). However, because CHWs are a nonlicensed workforce and work across system settings with various job titles, it is difficult to estimate and characterize this workforce and accurately identify opportunities to create policies that support CHWs nationally and at the state-level (Jack et al., 2017; Rosenthal et al., 2010; Sabo et al., 2017).
New Contributions
Researchers and policymakers can typically estimate the size and distribution of various health workforces (e.g., nursing and physicians) across the United States through licensure data. However, estimating the size and scope of CHWs is challenging, as the United States lacks uniformed certification requirements and states reimburse CHWs in varied ways for the services provided. By understanding the current size of the CHW workforce, as well as the factors that may be associated with CHW workforce growth, policymakers can ascertain ways to expand and support CHWs in settings in which their contributions may not be fully utilized. Further exploration of trends in geographic distribution of and service setting types for CHWs could provide new insights and potential solutions to employ, fund, and sustain the CHW workforce. To address this knowledge gap, this study had two aims: (a) estimate the size of the CHW workforce and the state distribution of CHWs in the United States by comparing three national data sources; and (b) understand the association of state reimbursement and certification on the number of CHWs per the population in each state.
Methods
Data Sources
Three data sources were used to identify CHWs: the National Plan and Provider Enumeration System (NPPES), the Bureau of Labor Statistics (BLS) Occupational Employment and Wage Statistics (OEWS) (hereinafter referred to as “BLS”), and the American Community Survey (ACS). The NPPES is a database of providers who are eligible to bill the Centers for Medicare and Medicaid Services (CMS) through a national provider identifier (NPI). When providers register for an NPI number, they can select up to 15 taxonomy codes to characterize their specialty or area of practice. One code may be designated as the primary taxonomy code. The NPPES includes a practice state and practice address for each provider. For this study, all individuals with a primary taxonomy code of “Community Health Worker” (code 17200000X) from the September 2022 version of the NPPES file were selected (Research Data Assistance Center, 2018).
The BLS estimates state and national workforce employment and wage statistics via semi-annual survey of employers from nonfarm industries. The BLS uses the Standard Occupational Classification (SOC) system to classify workers into occupational categories according to their occupation’s definition. As estimates in the BLS are reported by employers, this likely represents the job titles of employees which may or may not represent their function/role. For this study, the SOC code specifically for CHWs (code 211094) was used (BLS, 2018) and data were drawn from the 2021 BLS file.
The ACS is administered yearly by the U.S. Census Bureau to collect nationally representative data for U.S. populations and includes information from respondents on a self-report of their occupation. State-level estimates of CHWs were derived from the ACS microdata 2020 5-year file (Ruggles et al., 2023). The ACS uses a standardized occupation classification system. To identify CHWs in the ACS, the occupation code “Miscellaneous Community and Social Service Specialists, including health educators and community health workers” (code 21-1090) was used. The ACS includes individuals who may identify as a CHW but may be inactive or work part-time.
Certification and Reimbursement
The status of each state’s certification requirements (e.g., public, private, or none) were identified from the NASHP (2021) and the ASTHO (2018). Discrepancies were reconciled by using other state-level data sources such as policy briefs and press releases. State reimbursement (e.g., yes, or no, and type) of CHWs was determined from the NASHP (2021), Medicaid Coverage of Community Health Worker Services (MACPAC, 2022), and ASTHO (2018), and discrepancies were reconciled through other state-level data sources such as Medicaid fee schedules. Table 1 presents each state’s status of reimbursement, the types of reimbursement received (e.g., through its state health plan, an 1115 waiver), and either a public (i.e., standardized through the state) or private (i.e., through private organizations or foundations) certification program for CHWs. In relation to reimbursement for CHWs, 31 states accessed funding streams and nine of those states were utilized more than one stream of funding for CHW reimbursement in 2023. States utilized the following funding streams: 16 states through MCOs, nine through 1115 waivers, eight through state health plans, five through fee for service, two through ACOs, and one through per member per month. Regarding certification, 26 states offered a CHW certification program, 16 of these states being state operated, and 10 of them being privately operated.
Medicaid Reimbursement and Certification Programs for Community Health Workers by State.
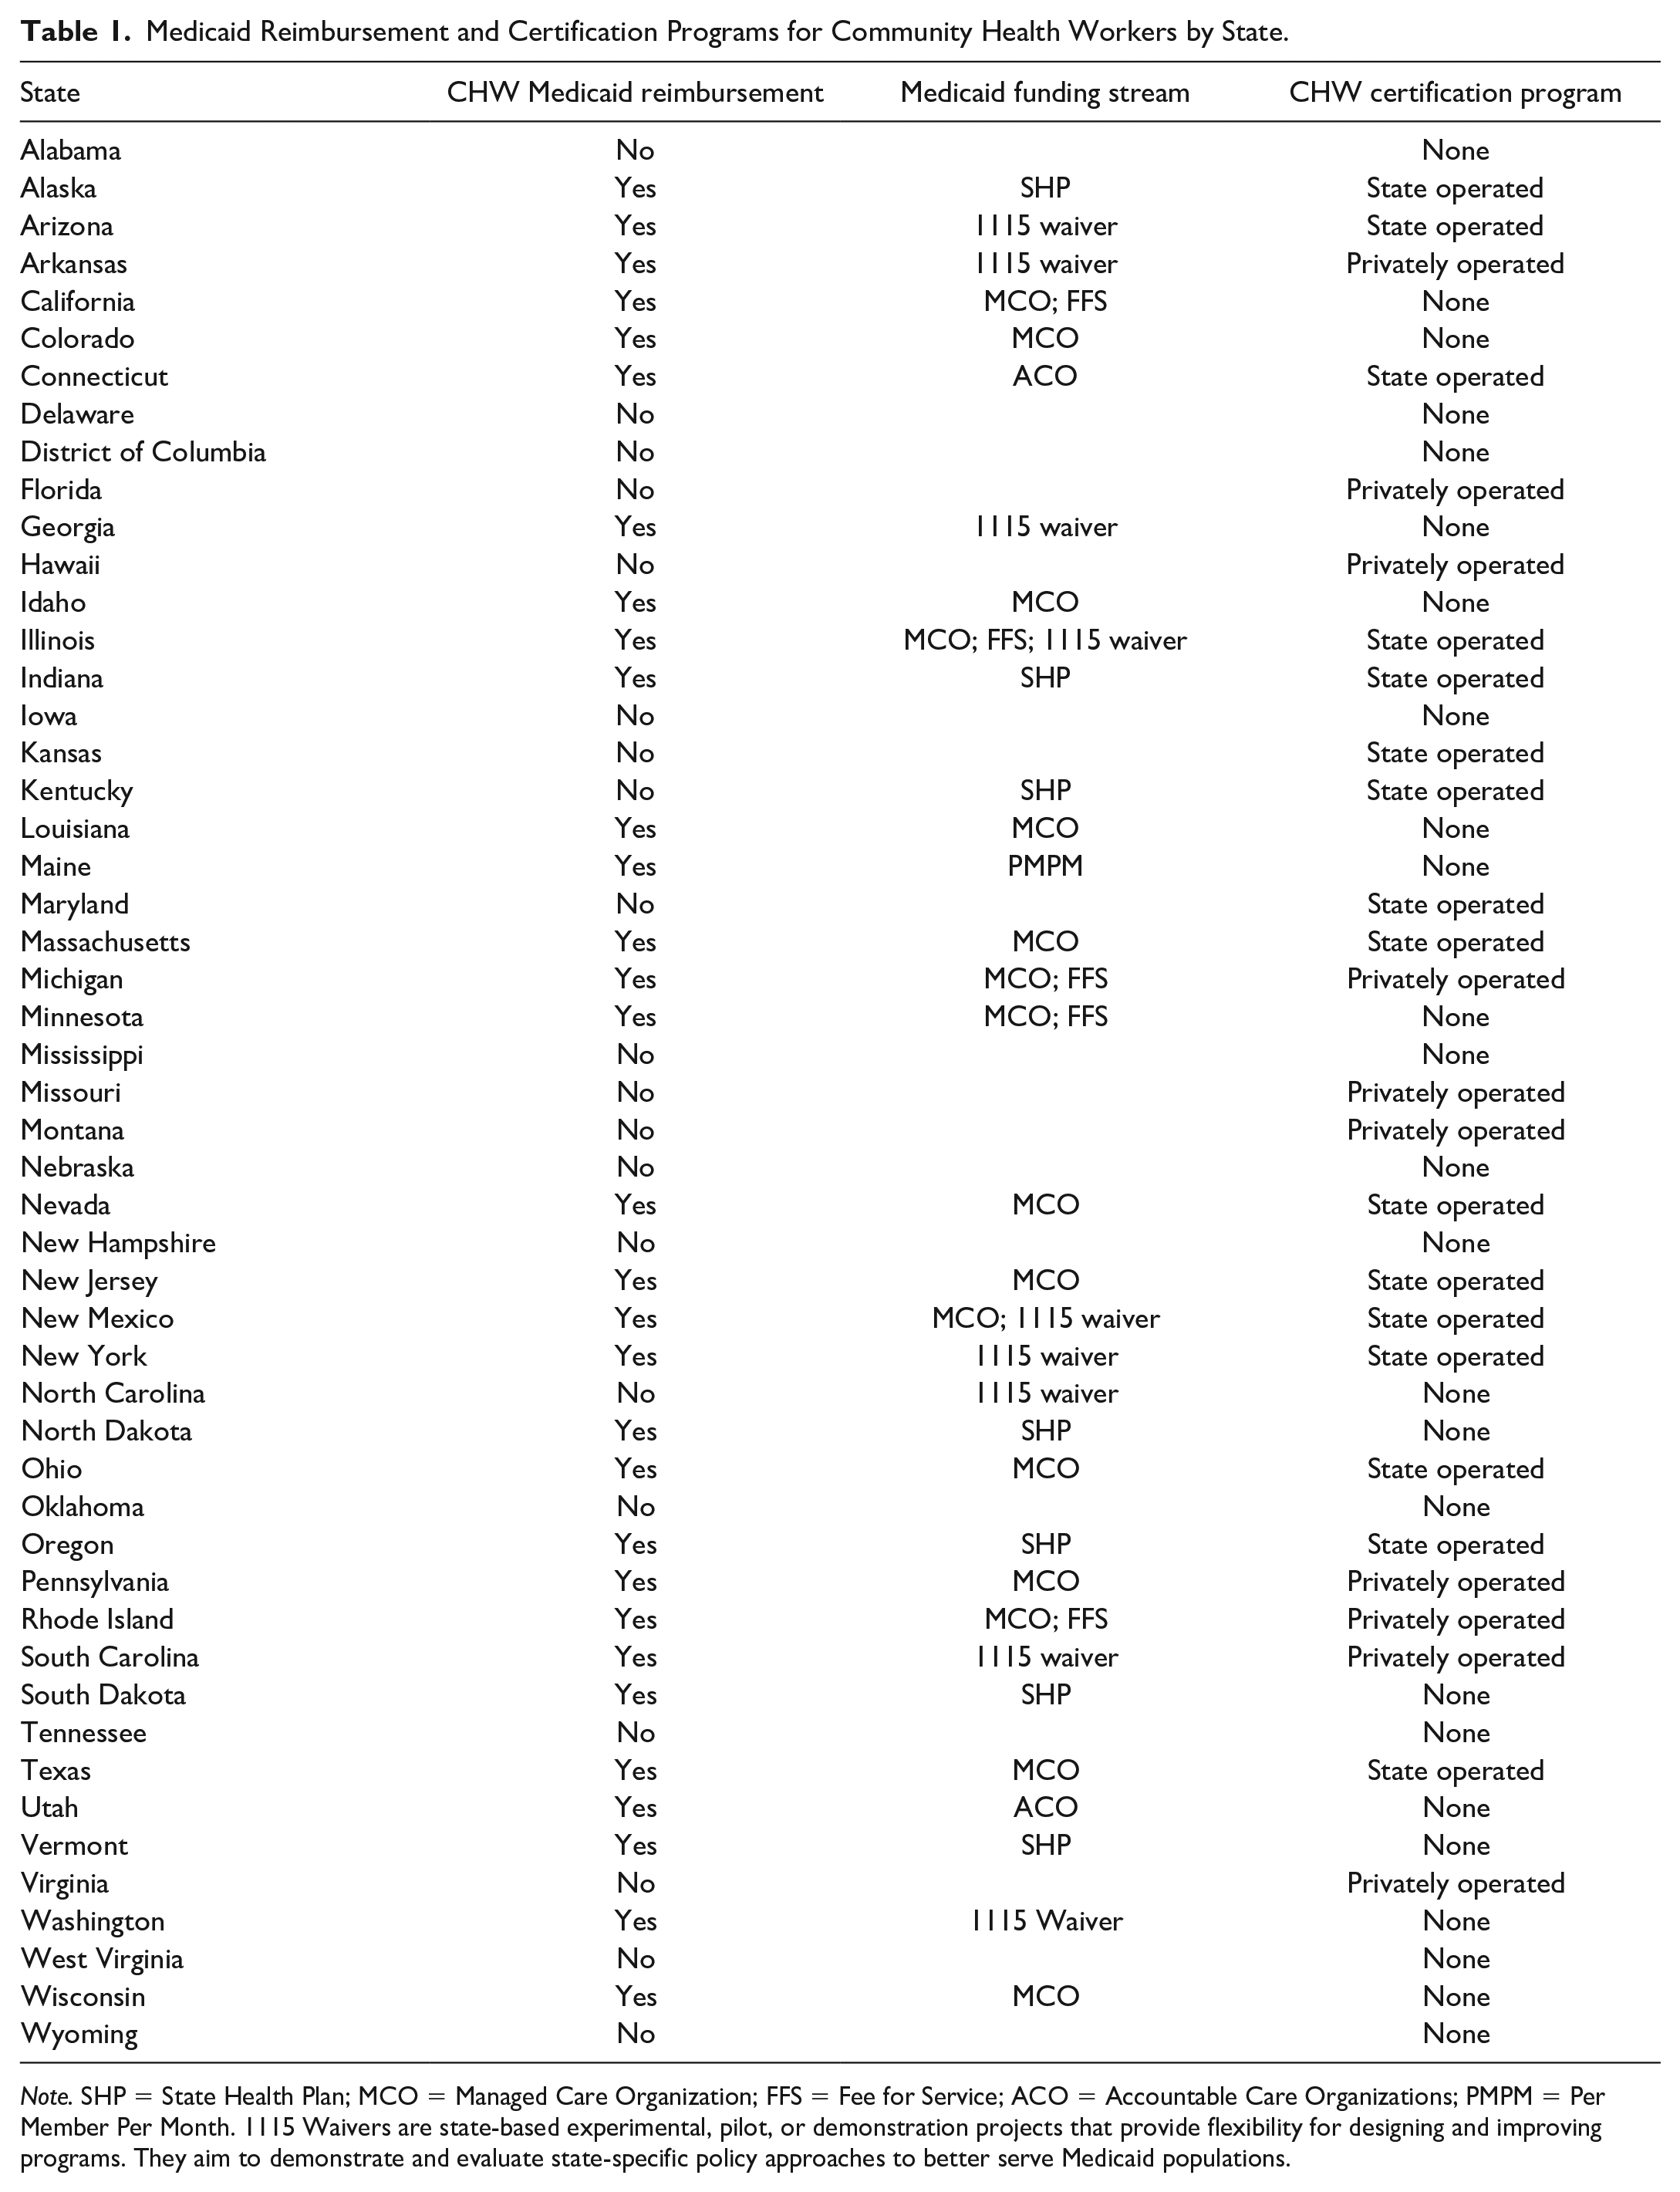
Note. SHP = State Health Plan; MCO = Managed Care Organization; FFS = Fee for Service; ACO = Accountable Care Organizations; PMPM = Per Member Per Month. 1115 Waivers are state-based experimental, pilot, or demonstration projects that provide flexibility for designing and improving programs. They aim to demonstrate and evaluate state-specific policy approaches to better serve Medicaid populations.
Analysis
Descriptive analyses were calculated using Stata (StataCorp, 2021) and compared across the three data sources to examine the total number of CHWs in the United States and the rate of CHWs per 100,000 people in each state. State population estimates were drawn from the U.S. Census Bureau (2021). A series of one-way ANOVAs were modeled to determine if there were significant differences in the rate of CHWs across the three data sources among states that had reimbursement mechanisms and/or CHW-specific certification. Maps were generated to show variation across the three data sources of CHWs per population.
Results
Across the three data sources described, there were between 24,708 and 117,638 CHWs working in the United States. The ACS data estimated the highest number of CHWs (117,638), followed by the BLS (60,980), and the NPPES (24,708). Nationally, this translates to 35.44 CHWs per 100,000 people in the ACS, 18.37 per 100,000 in the BLS, and 7.44 per 100,000 in the NPPES. Figure 1 provides an estimate of CHWs per 100,000 for each state across the three data sources.
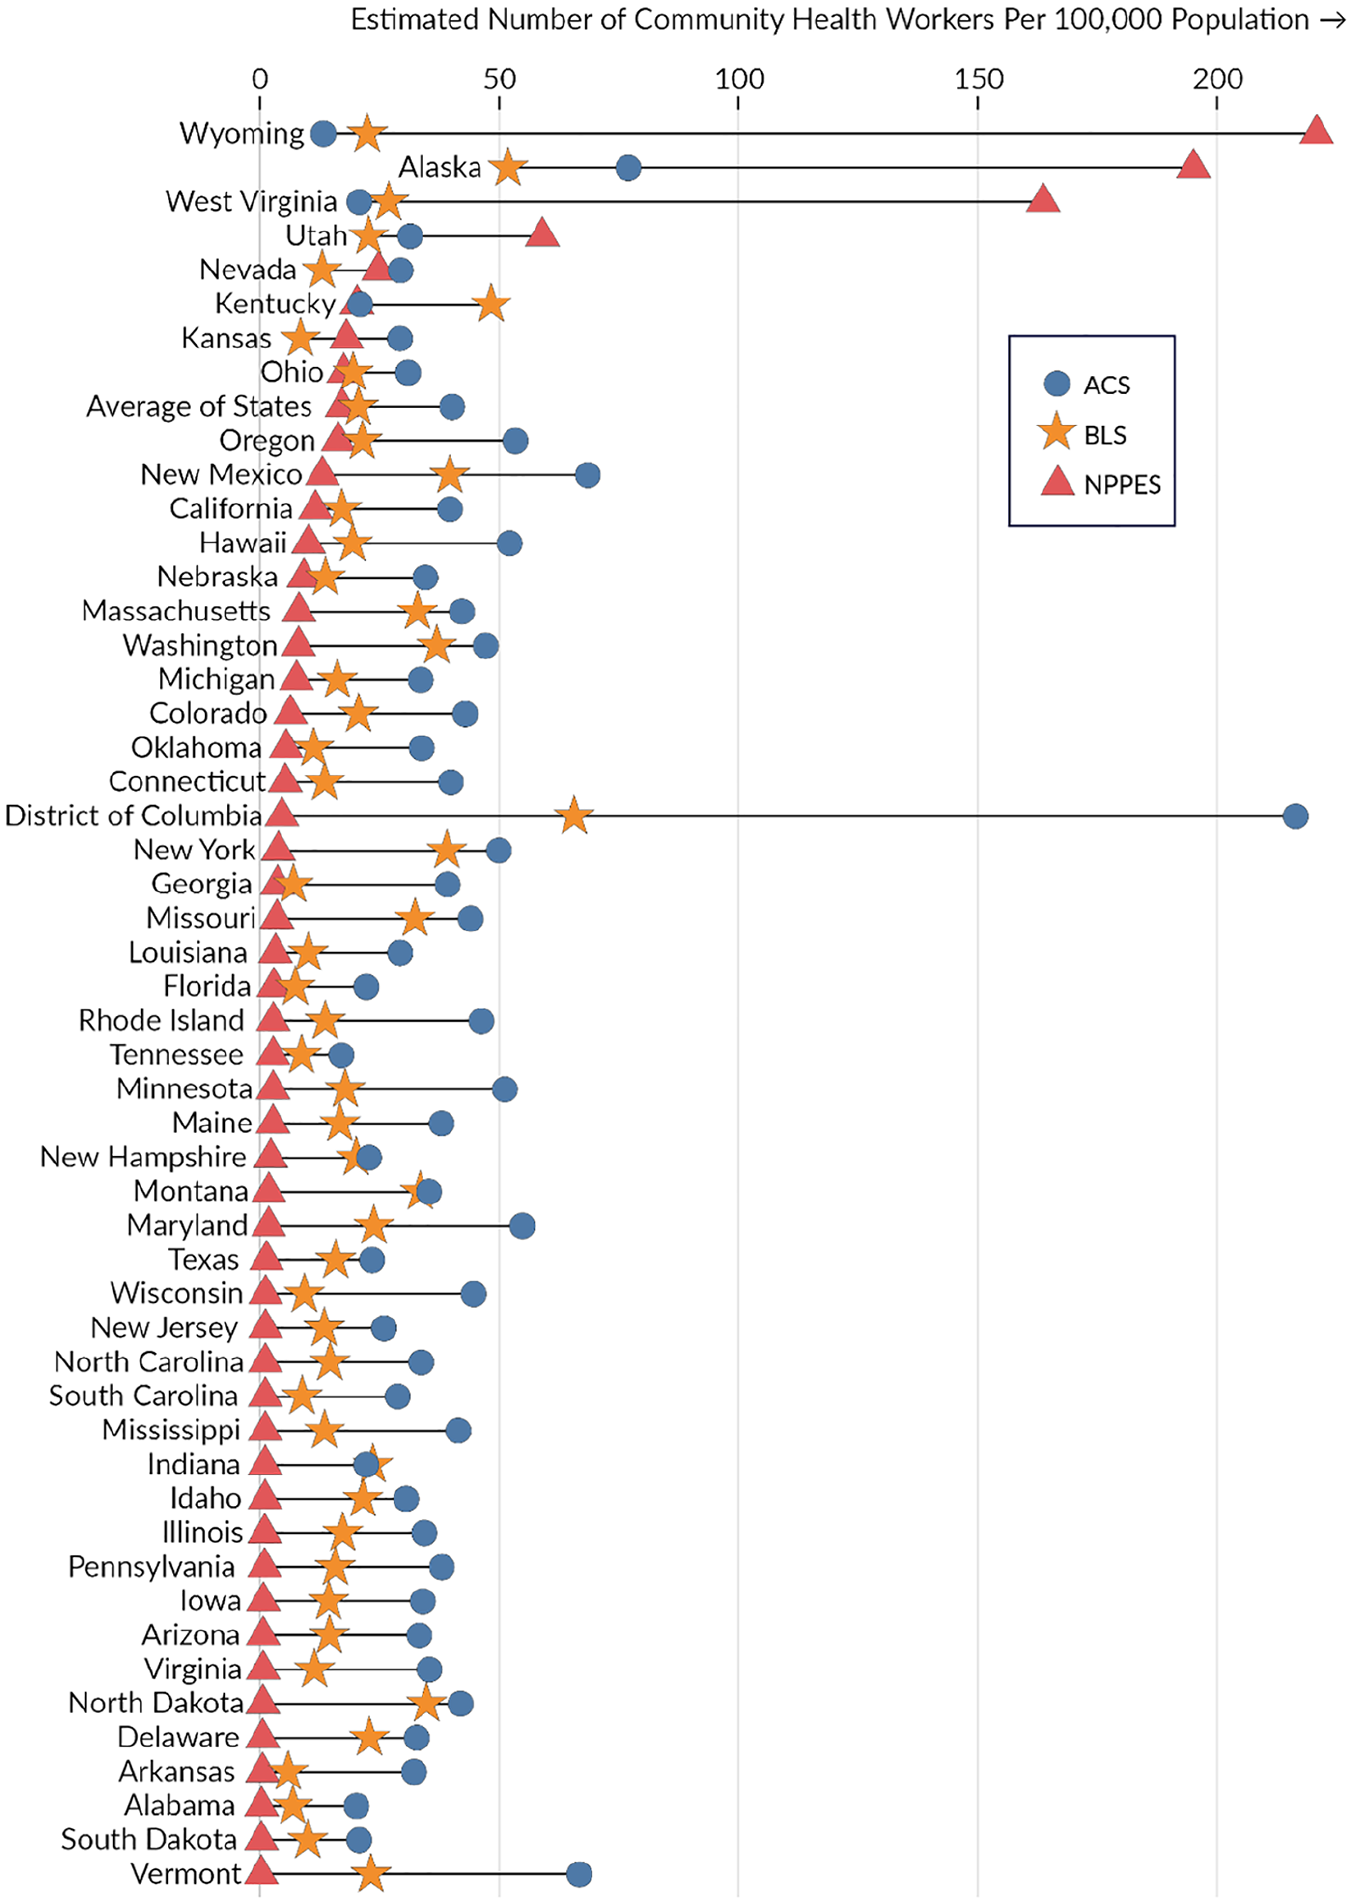
Average Rate of Community Health Worker per 100,000 State Population Comparison Across Data Sources.
Although the total number of CHWs per the U.S. population was highest in the ACS, there were state variations in the proportion of CHW per the population across the three data sources. For example, per 100,000 people in the state, the NPPES estimated the highest number of CHWs in West Virginia (163.66) and Wyoming (220.24), while the ACS estimated these states (20.81 and 13.3, respectively) as having the lowest number of CHWs per the population. The state average of CHW per 100,000 across all states was 40.17 CHWs in the ACS, 20.62 in the BLS, and 17.20 in the NPPES (see Figure 1).
To observe variation by state in the data sources, CHW rates per population were divided into quintiles for the NPPES, BLS, and ACS and presented in maps in Figure 2. States in the lowest quintile had as few as 0.31 CHWs per 100,000 people, whereas the states in the highest quintile had as high as 216 CHWs per 100,000 people. While there was state variation across each data set, these maps suggest an overall trend of the lowest ratio of CHWs clustered in states throughout the southeast, and the highest ratio of CHWs clustered in the Western United States.
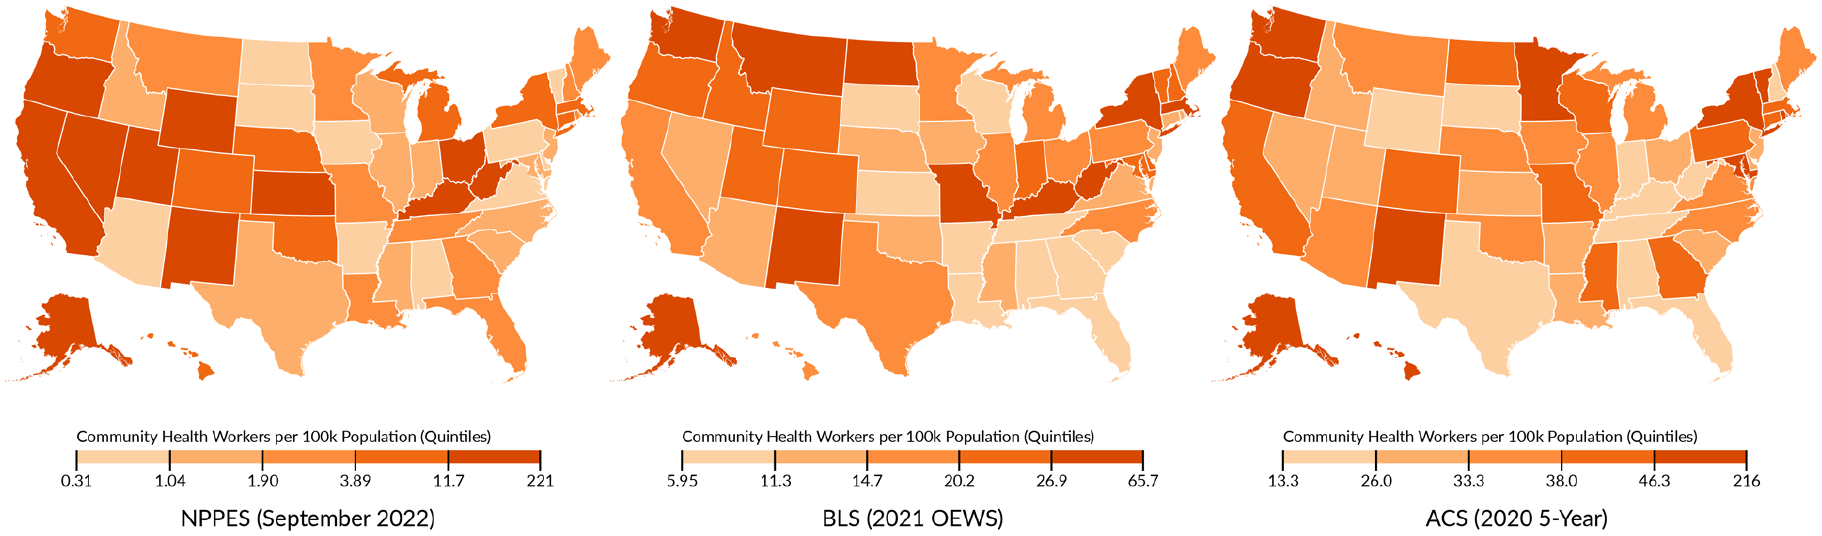
State Variation in Community Health Workers per 100,000 People by Data Source.
The state average rates of CHWs per 100,000 people were compared across the three data sources in states with certification and reimbursement, as compared with states without certification and reimbursement (see Table 2). Across states with CHW certification (n = 26) in 2023, the mean number of CHWs per 100,000 people was 13.96 in the NPPES, 21.6 in the BLS, and 38.62 in the ACS. Yet in states without certification, the mean number of CHWs per 100,000 people on average was 20.58 in the NPPES, 19.60 in the BLS, and 41.79 in the ACS (see Table 2). A series of three one-way ANOVAs revealed no significant differences in the mean number of CHWs in the NPPES (F = 0.26, p = .61), the BLS (F = 0.33 p = .57), or the ACS (F = 0.01, p = .91) comparing states with and without CHW certification. In states with reimbursement for CHWs (n = 31), the mean number of CHWs per 100,000 people was 13.05 in the NPPES, 20.16 in the BLS, and 39.78 in the ACS. Whereas in states without reimbursement the mean number of CHWs per 100,000 people was 23.63 in the NPPES, 21.32 in the BLS, and 40.77 in the ACS (see Table 2). A series of three one-way ANOVAs revealed no significant differences in the mean number of CHWs in the NPPES (F = 0.64, p = .43), the BLS (F = 0.10 p = .75), or the ACS (F = 0.01, p = .91) in states with or without reimbursement.
Rates of Community Health Workers in the NPPES, BLS, and ACS.
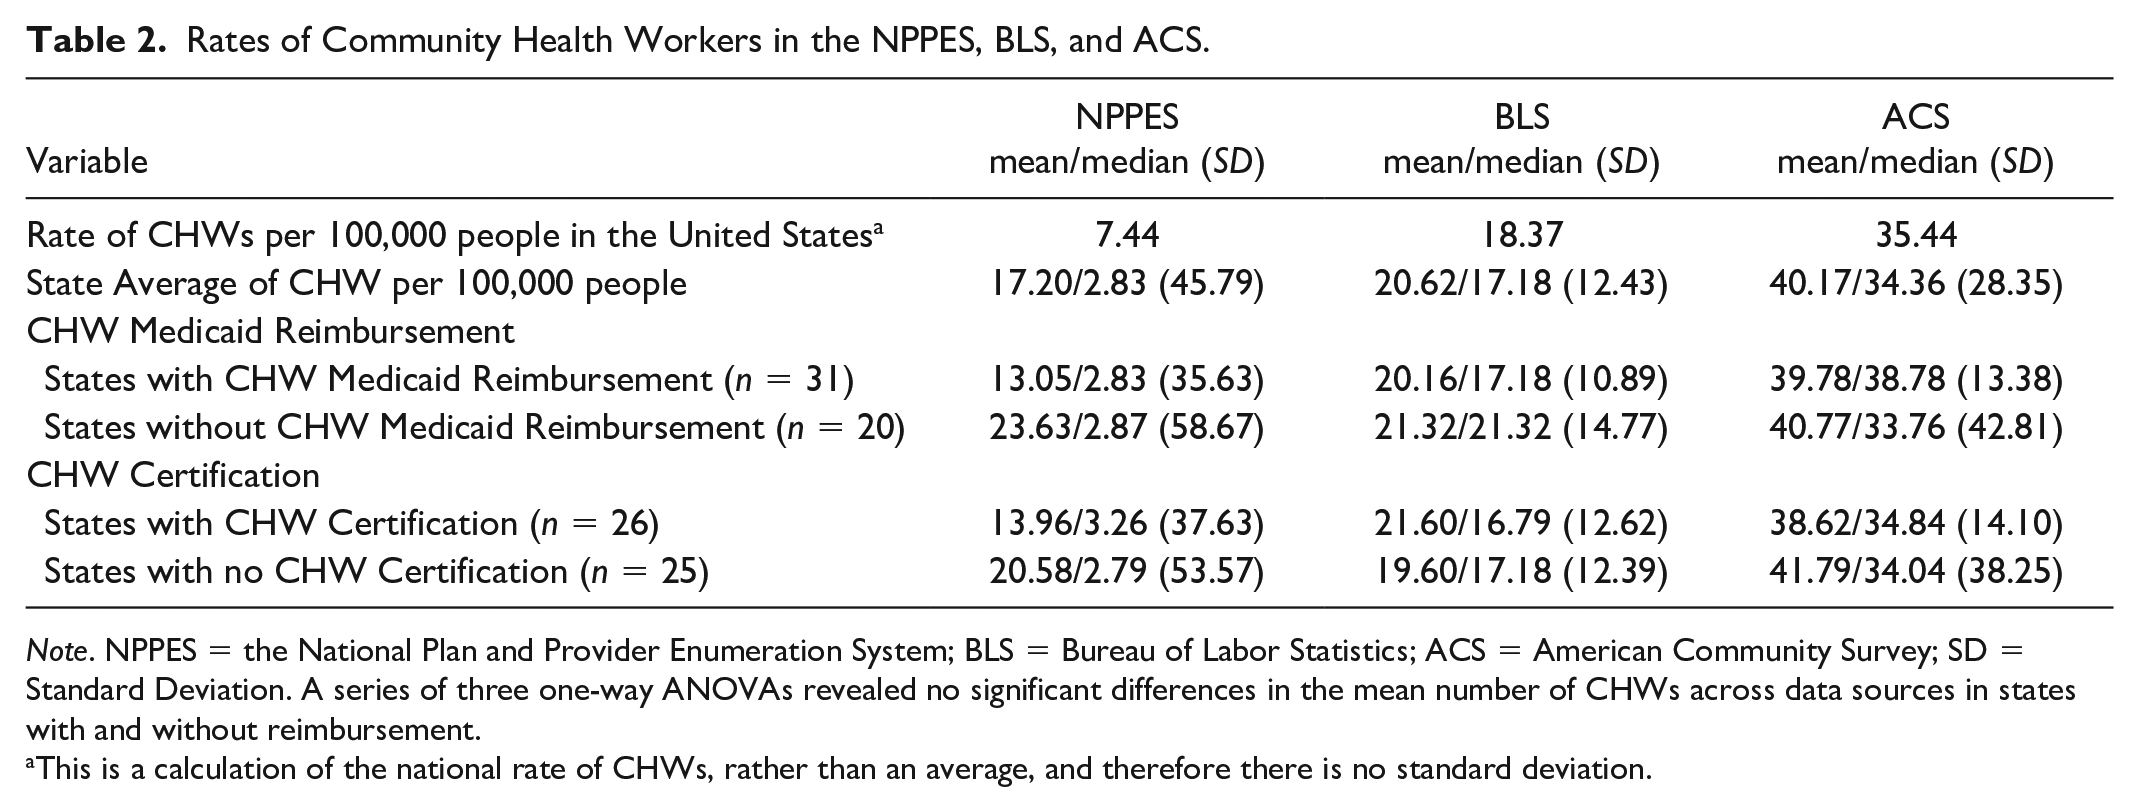
Note. NPPES = the National Plan and Provider Enumeration System; BLS = Bureau of Labor Statistics; ACS = American Community Survey; SD = Standard Deviation. A series of three one-way ANOVAs revealed no significant differences in the mean number of CHWs across data sources in states with and without reimbursement.
This is a calculation of the national rate of CHWs, rather than an average, and therefore there is no standard deviation.
Discussion
A lack of reliable health workforce data sources creates difficulty in discerning workforce supply and demand alignment (National Governors Association, 2020). This data issue is most apparent for nonlicensed and emerging health workforces like CHWs. As the role of CHWs continues to grow, it is increasingly important to have data sources that allow the CHW workforce, employers, educators, researchers, and policy makers to accurately assess CHWs trends over time, and to use this information in workforce planning efforts. Based on the differences in how each of the data sources collected and classified CHWs, it was not surprising that differences in workforce estimates were found in this study. However, the magnitude of differences between the three data sources in this study may be due to the variation in data collection methods and definitions of CHWs.
Because CHWs are not a licensed workforce, consistency in the method of enumerating this workforce is important to consider for future research. While the ACS and BLS are both national data sources, the ACS uses census data (i.e., self-reported data) to enumerate CHWs whereas the BLS uses employer-level data to enumerate CHWs. The NPPES is an administrative database and relies on individuals’ self-identification within a specific occupational taxonomy code for CHWs. The three data sources could also reflect different subsets of the CHW workforce. For example, those in the NPPES are likely working for a setting that is being reimbursed for service by the CMS, whereas those in the ACS may be more likely working across both community and health settings. Moreover, the ACS and BLS use two different occupational definitions for CHWs: the ACS broadly defines CHWs as inclusive of health educators and “other community and social service specialists,” whereas the BLS (2010) established a singular SOC code for CHWs in 2010. Establishing a singular SOC code for CHWs was an important step in more accurately enumerating this workforce. However, estimates on the size of the CHW workforce prior to the implementation of the CHW SOC code in 2014 cannot be compared with the results from 2021 found in this study. Specifically, the number of CHWs in the BLS in 2021 was 60,980, which is a decrease from the 115,700 CHWs in the BLS in 2014 identified prior to the creation of the singular CHW SOC code (Bureau of Health Professions, Health Resources and Services Administration, U.S. Department of Health and Human Services, 2007). Each data source presents strengths and limitations of observing the CHW workforce—a finding that is critical to keep in mind when using these data sources in future work.
There has been significant progress in payment policies to support CHWs’ roles, and similarly there has been a growth in state certification for CHWs. For example, prior work noted that in 2007, only six states successfully accessed funding streams for CHWs [CITATION]. In comparison, this study found that as of 2023 there are 31 states utilizing different sources to reimburse CHWs. In addition, a national survey from 2004 found only four states offered a CHW certification program (Kash et al., 2007) while this study finds that 26 states had a CHW certification program in 2023. While these advances show the momentum for CHWs, findings from this study suggest there was no association between certification and reimbursement and the size of the CHW workforce. Despite the progress being made to support and grow the CHW workforce, we do not have consistent and reliable data enumerating the workforce to effectively evaluate changes. Strengthening data sources is needed for future research to examine the impact of workforce policies on CHWs.
Although the certification of unlicensed workforces could aid in enumeration, this is not a reason to require certification; moreover, requiring certification of unlicensed workforces has mixed reactions. Some commonly discussed advantages to requiring certification among unlicensed workforces are to enhance the credibility of the workers, strengthening the quality of the services they provide, and ensuring a set of core competencies are being followed (Kissinger et al., 2022). However, opposition to certification is primarily attributed to the concern that certification standardization would threaten the identity of those from marginalized and historically oppressed populations (Adams, 2020; Kissinger et al., 2022; Young, 2021).
A final takeaway from this study reaffirms the importance of data sources in health workforce research and planning (Fraher, 2017; Freed et al., 2006). Other research has similarly identified that national and state-level data sources for health professionals produce varied estimates of the size and distribution of workforces (e.g., social workers, nurse practitioners, and physicians; Lombardi et al., 2024; Spetz et al., 2015; Staiger et al., 2009). As CHWs continue to impact care delivery, serve as members of health care teams, and work within health and community systems, knowing what data sources are being used to enumerate and track this workforce is necessary for current estimates and future analyses. Without considering these nuanced data systems, the field also loses the ability to track transitions in and out of the workforce, or how certification and training efforts support CHWs in their roles.
While this study has important implications for understanding the CHW workforce, there are limitations to consider. This study did not assess other factors that could influence the size of and distribution of the CHW workforce, such as states that have received grant funding to support CHW-delivered services, state-level Medicaid expansion, and states that have prioritized addressing social needs in communities. As noted, data sources have strengths and limitations that may be accounting for differences found in this study; future work is needed to refine CHW data.
Conclusion
Findings from this article establish the current ways in which the CHW workforce is enumerated and distributed across the country. Given the variability in the data sources and the range of ways to classify CHWs, understanding which data source is being used and for what purpose will be important to consider when attempting to understand how policy-related changes, like certification and reimbursement, impact CHW growth. Strengthening data on CHWs will be important as the workforce continues to grow and serve in important roles in healthcare.
Footnotes
Declaration of Conflicting Interests
The author(s) declared no potential conflicts of interest with respect to the research, authorship, and/or publication of this article.
Funding
The author(s) disclosed receipt of the following financial support for the research, authorship, and/or publication of this article: This project was supported by the Health Resources and Services Administration (HRSA) of the U.S. Department of Health and Human Services (HHS) under Cooperative Agreement U81-HP26495, Health Workforce Research Centers Program with 0% funded from nongovernmental sources.This information or content and conclusions are those of the author and should not be construed as the official position or policy of, nor should any endorsements be inferred by HRSA, HHS or the U.S. Government.