
Abstract
We conducted a secondary analysis of the evaluations of 22 sites participating in four primary care redesign initiatives funded by the Centers for Medicare and Medicaid Services or the Center for Medicare and Medicaid Innovation. Our objectives were to determine the overall impact of the initiatives on Medicare expenditures and whether specific site-level program features influenced expenditure findings. Averaged over sites, the mean intervention effect was a statistically insignificant US$26 per beneficiary per year. Policy implications from meta-regression results suggest that funders should consider supporting technical assistance efforts and pay for performance incentives to increase savings. There was no evidence that paying for medical home transformation produced savings in total cost of care. We estimate that in future evaluations, data from 35 sites would be needed to detect feature effects of US$300 per beneficiary per year.
Introduction
In response to concerns about continually rising health care costs, the past decade has been marked by the development of a variety of innovative payment and service delivery models in primary care designed to reduce the amount of care utilization and total expenditures. Advanced Primary Care Redesign (APCR) refers to efforts to reform traditional medical practice. APCR encompasses changes in payment methods, improvements in information technology, additional workforce training, and transformations in the way that care is delivered within the practice.
One of the most common transformation strategies is the patient-centered medical home (PCMH). Endorsed by American Academy of Family Physicians, American Academy of Pediatrics, American College of Physicians, and American Osteopathic Association (2007), key principles underlying the PCMH concept are that homes should promote strong physician–patient relationships, enhance access to services and coordination of care, and focus on safety and quality. The National Committee for Quality Assurance (NCQA) developed a formal PCMH recognition program for practices meeting nine medical home standards (www.ncqa.org). Several other organizations (including the Utilization Review Accreditation Commission, the Joint Commission for Primary Care, the Accreditation Association for Ambulatory Health Care, and numerous state bodies) also have PCMH accreditation programs. Accreditation is often required to participate in federal and state PCMH support activities and enables eligibility for patient-based capitation payments and incentive payments to health care organizations, medical practices, and physicians.
APCR has received strong support from the Center for Medicare and Medicaid Innovation (CMMI) and from the Centers for Medicare and Medicaid Services (CMS) which funded four multi-site primary care initiatives beginning in 2011. Like many studies involving multiple sites, a systematic review of these initiatives revealed a mixture of Medicare cost savings in some sites and comparative losses in others (Kennell and Associates & RTI International, 2018). This pattern of results raises the question of why certain sites fared better than others. Since there is considerable variation in the way that redesign strategies are implemented in individual medical practices, it may be that certain features of the practice sites or of the initiative itself contribute to cost-related performance. Understanding these features can be helpful for designing more effective reforms and for planning future evaluations.
Although many PCMHs have now been in operation for more than a decade, relatively little information is available about their impacts on Medicare expenditures compared to conventional non-PCMH practices. By 2017, the Patient-Centered Primary Care Collaborative’s annual report on practice transformation identified only seven studies that examined treatment costs (Jabberpour et al., 2017). Most reports have instead focused on quality and process outcomes. Three quantitative systematic reviews that considered expenditures have been published in recent years. Veet and colleagues (Veet et al., 2020) found lower patient costs in the PCMH group in half of 24 studies, and similar or higher costs in the other half. John and colleagues (John et al., 2020) examined 18 randomized controlled trials contrasting PCMHs vs. standard general practices. They found higher costs on average for PCMH patients (standardized mean difference = 0.17). Sinaiko and colleagues (Sinaiko et al., 2017) invited evaluators of seven initiatives to report cost data. Using a difference-in-difference regression model, they found a statistically insignificant savings of US$9 per month for these programs. None of these reviews conducted a statistical analysis of factors that may have affected the expenditure results.
Given the heterogeneity between sites in intervention impacts found in the Kennell and Associates report, our objective in this paper was to determine the extent to which site-specific structural characteristics and payment methods impacted the Medicare expenditure results reported by the four reform initiatives. To address this objective, we conducted a secondary analysis of the expenditure effects reported by each study site using meta-regression. Because of concerns about the utility of meta-regression for a comparatively small number of studies, we also examined the influence of the number of study sites on the precision of estimated feature effects.
New Contribution
Most research on the effects of APCR is limited to single sites or initiatives with qualitative assessments of factors that may have been important to the study results. When conflicting results about the impact of APCR are reported by different studies, it is not clear which programs or payment methods, if any, should be promoted by policymakers and funders. Our analysis addresses these shortcomings by making new contributions in three respects. First, we synthesize the results from multiple sites in four major federally funded APCR initiatives. These results were drawn from contractor reports that were not in the peer-reviewed published literature. Second, we use meta-regression to quantify the impact of specific study intervention features, such as payer type, technical assistance, and financial incentives on Medicare spending. Third, we make recommendations for the number of study sites that are needed to conduct informative APCR meta-analyses.
Conceptual Framework
A key conceptual question for our study is: “Which features of primary care redesign programs and their evaluations should be considered in a meta-analysis of these programs?” We are not aware of any single, unified conceptual framework that adequately addresses this question. We also note that none of the prior reviews we identified in the literature review section offered conceptual frameworks.
We suspect that at least three factors contribute to the lack of such a framework. First, most health-related frameworks involve hypothetical constructs like health status or illness burden or quality of life that are characteristics of individuals. In meta-analysis, however, the outcome is a group-level (site-level) effect size summarizing the overall impact of the intervention at a particular site. The outcome is the site’s effect size (the adjusted difference between intervention and comparison group means), not the actual amount of health care spending. The features incorporated in meta-regression indicate the extent to which that overall effect increases or decreases as a function of specified features. An adequate framework would then require a theory of intervention that relates program design and analytic method features to effect sizes. Furthermore, given the considerable variation in the types of interventions to be tested, it seems unlikely that any single framework would be appropriate for all interventions.
Second, many systematic reviews (including those cited in our literature review) are primarily concerned with deriving a summary estimate of the overall effectiveness of a particular type of intervention. Most of those analyses do not make it to the next stage, which is to explore the extent to which study and intervention features affected the summary estimate. As a result, these analyses do not advance to a meta-regression stage and therefore do require a conceptual framework for that subsequent stage.
A third factor is the widespread belief in the benefits of PCMH transformation. The dominance of this approach to primary care redesign may have reduced the need to consider other influences on PCMH effectiveness.
In the absence of a single comprehensive conceptual framework, we examined several conceptual frameworks in the literature to identify relevant study features that we should consider in our meta-analysis. The venerable Andersen/Newman model of medical care utilization (Andersen & Newman, 1973) stresses that the most important determinant of total care costs is the patient’s level of perceived illness. We used site-level Hierarchical Condition Category (HCC) risk scores (Pope et al., 2004) as a proxy for illness severity. At the system level, the comprehensive Primary Health Care Performance Initiative conceptual framework (Veillard et al., 2017) contains a domain for payment systems. Since the evaluations in this study occurred at time of active experimentation with new payment models, we recorded the models adopted by each site. One shortcoming of broad models for health expenditures is that they tend to focus on individual patient characteristics rather than the health network variables that can be used for meta-analysis. There is considerably less variation in characteristics aggregated to the site level than there is at the individual level.
Another framework that was influential in our choice of effect size moderators was described by Wilson and Lipsey (2001). In their meta-analysis work on juvenile delinquency interventions, they created domains for features of the interventions and features of the analytic methods. They show that these two domains plus sampling error and residual variability account for similar proportions of the variance in their outcome effect sizes. Although methodological differences were minor with regard to the way the sites in our study conducted their analyses, this perspective led us to include intervention features such as technical assistance, external transformation services, and staffing changes. Finally, one of the key tenets of PCMH approach is that the more advanced or transformed the medical practice, the greater the impact on health outcomes will be. To test this hypothesis, we included a brief measure of the extent to which a site’s practices functioned as medical homes.
Method
Study Sites
Our analysis was based on evaluation data aggregated from four CMS/CMMI-funded initiatives, each of which had multiple regional sites. The initiatives were the Multi-Payer Advanced Primary Care Practice (MAPCP) Demonstration (eight sites in eight states), the Comprehensive Primary Care (CPC) Initiative (seven sites in eight states), Primary Care Redesign (PCR) awardees from Round 1 of the Health Care Innovation Awards (HCIA) (six sites) and the Federally Qualified Health Center (FQHC) Advanced Primary Care Practice (APCP) Demonstration (all centers merged into one site). This yielded a total of 22 unique intervention sites. For our purposes, “site” refers to a set of medical practices in a specified geographic area. A site was the organizational unit funded by CMMI and the unit on which evaluation reports were based. A similar set of medical practices that did not participate in the initiative, usually from the same geographic region as an intervention site, served as comparison groups.
Each initiative shared the broad goal of transforming primary care to improve quality while reducing cost, but there were many differences in the reform strategies adopted by each initiative. Two initiatives (MAPCP and CPC) involved multiple payers in addition to Medicare. PCMH recognition was an important element of the MAPCP and FQHC-APCP models, but was not required by CPC. The FQHC-APCP was single-payer demonstration; the Health Care Innovation Awards Primary Care Redesign awardees (HCIA-PCR) focused on service delivery innovations. All of the sites received financial support in the form of either practice management fees or shared savings arrangements. Detailed comparisons of initiative characteristics may be found in Kennell and Associates and RTI International (2018) or in final reports (Kahn et al., 2016; Nichols et al., 2016; Peikes et al., 2016).
This secondary analysis of previously reported data was classified as exempt research by RTI International’s Institutional Review Board.
Outcome Measure
The initiatives received CMMI funding in 2011 or 2012 and continued their interventions for at least 3 years. We based our analysis on expenditure effects for the first 3 years of each intervention, as reported in Third Year Annual Reports submitted by independent evaluators (from Mathematica, NORC, RAND, and RTI International) for each site. The outcome in our analysis was the weighted mean annual effect of the reform intervention on Medicare Total Costs of Care (TCOC) over the 3-year follow-up period, where the weights were the relative number of demonstration beneficiaries in each year. All evaluators created propensity score matched or weighted comparison groups. The comparison groups for MAPCP consisted of practices that did not have NCQA recognition as medical homes. Intervention effects were estimated using difference-in-difference regression equations that included at least 1 year of pre-intervention data. Intervention effect estimates may be either negative (indicating savings because regression-adjusted intervention TCOC were lower in the intervention group than in the comparison group) or positive (indicating relative losses). Effect sizes were expressed as estimates per beneficiary per year (PBPY).
No formal assessments of risk of bias were conducted, but all sites used similar difference-in-difference regression models and propensity-score weighting or matching to balance the characteristics of intervention and comparison beneficiaries. Site-level TCOC impacts were highly correlated from 1 year to the next: r = .58 between the Year 1 and Year 2 effects and r = .68 between Years 2 and 3.
Study Characteristics
We assembled data regarding payment and policy-relevant site characteristics from two sources. First, information about some payment sources and program characteristics were abstracted from evaluator reports. These included indicators for multiple payers (Medicaid and commercial) and the amount of monthly Medicare payments paid per beneficiary. Each of these features was expected to be associated with negative (more favorable) expenditure effect sizes. The HCC risk score is the ratio of predicted annual Medicare expenditures based on a beneficiary’s chronic conditions to the mean expenditures for a beneficiary of the same age, gender, and disability status (Pope et al., 2004). It was included to test whether expenditure savings were greater for sites with sicker patients.
Second, to gather more detailed, standardized information about programs, we designed a survey questionnaire that was administered to the independent evaluation staff at each site. In the survey, evaluators were asked to rate the extent to which practices within the site hired new front-line staff to support initiative activities (1 = not at all (0%–24% of practices), 4 = to a great extent (75%–100% of practices). Respondents reported whether their site made payments to external organizations (community health teams, physician support organizations or health information technology vendors) to provide care coordination, analytic support, or other services to support initiative activities. The survey also collected data on sources of Technical Assistance.
To obtain a uniform estimate of medical home transformation, we adapted the Safety Net Medical Home Scale (SNMHS; Birnberg et al., 2011; The MacColl Center for Health Care Innovation at the Group Health Research Institute and Qualis Health, 2014) by using global ratings for each of the scale’s six domains (access and communication, care management, external coordination, patient tracking/registry, test and referral tracking, and quality improvement). Evaluators rated each domain on a 4-point scale (1 = not at all to 4 = to a great extent). Item responses were combined and converted into a 0 to 100 scale where higher values indicate more complete medical home transformation.
Our abbreviated 6-item version of the SNMHS is shown in Supplemental Appendix 1. In initial testing in 65 clinics, the mean SNMHS score was 61 (SD = 13; Birnberg et al., 2011) for the full scale. The scale demonstrated high reliability (Cronbach’s alpha > .68 for all domains) and acceptable convergent validity (correlations of .56 or higher with two other measures of medical homeness).
Data Accessibility
As described above, we compiled a site-level database for this study by abstracting information from annual site reports and an evaluator survey. Database variables are shown in Table 1. To the extent possible, our data abstraction process followed the Preferred Reporting Items for Systematic Reviews and Meta-Analyses guidelines (Page et al., 2021). A copy of the database can be made available on request.
Descriptive Statistics for TCOC Meta-Analysis and Explanatory Variables, by Initiative.
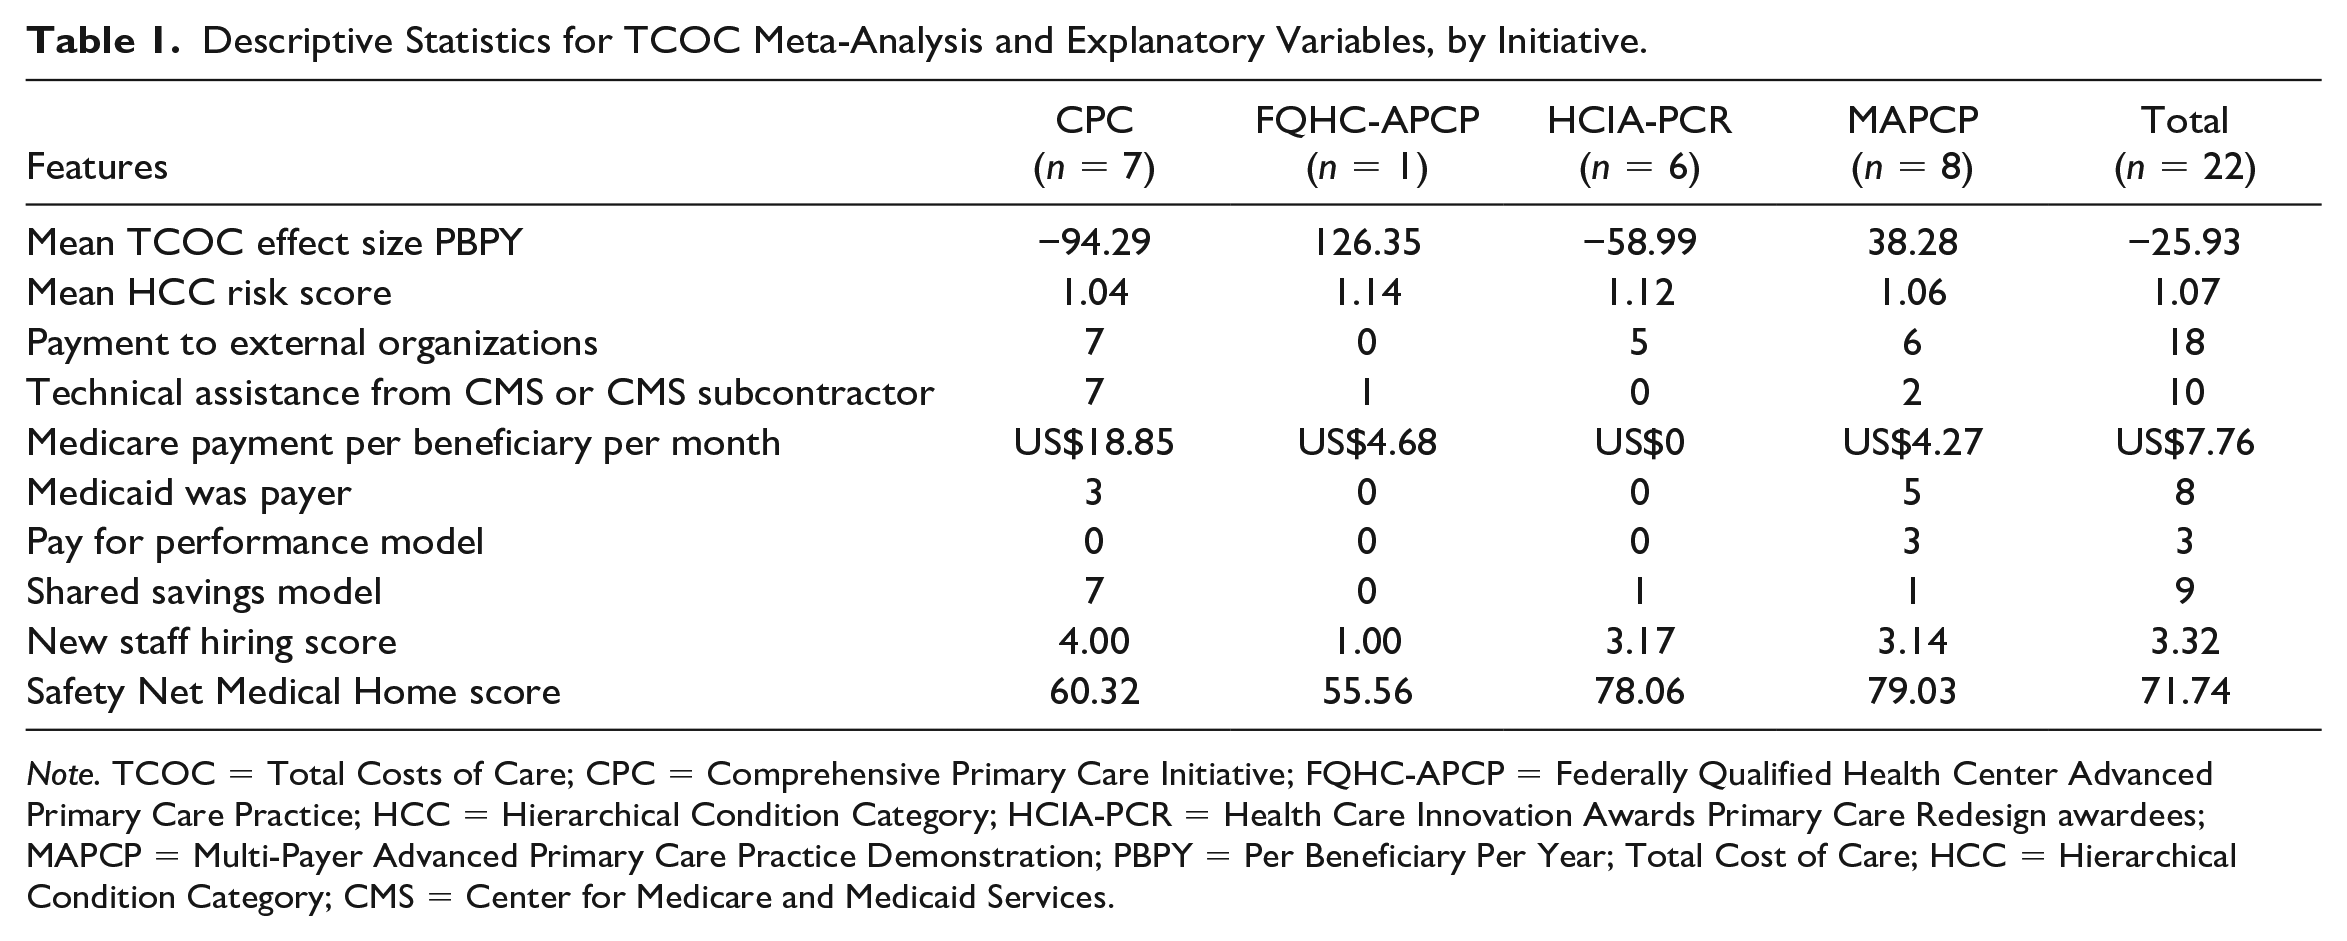
Note. TCOC = Total Costs of Care; CPC = Comprehensive Primary Care Initiative; FQHC-APCP = Federally Qualified Health Center Advanced Primary Care Practice; HCC = Hierarchical Condition Category; HCIA-PCR = Health Care Innovation Awards Primary Care Redesign awardees; MAPCP = Multi-Payer Advanced Primary Care Practice Demonstration; PBPY = Per Beneficiary Per Year; Total Cost of Care; HCC = Hierarchical Condition Category; CMS = Center for Medicare and Medicaid Services.
Statistical Analyses
We conducted our analysis of APCR TCOC effects in three stages (Borenstein et al., 2009). The first step was to calculate a cross-site estimate of the overall demonstration effect. This mean value was derived by weighting the individual site effects by the precision of each estimate so that more precise estimates from larger sites are given greater weight. The results were arrayed in a forest plot showing the estimated TCOC impact and associated confidence interval for each site.
The second step was to determine the extent to which the variance of the overall effect represents random measurement error or systematic between-awardee differences. This is tested formally by the Q and I2 statistics. The Q statistic estimates the probability that the site effects were drawn from a single underlying population. I2 partitions the total variability of effect sizes contributing to an analysis by estimating the proportion of the variance that is associated with between-site differences (Higgins et al., 2003; Higgins & Thompson, 2002). When I2 values are large, meta-regression may be useful for examining the between-site variation.
The third stage was to conduct a meta-regression of the site outcomes. In this stage, the TCOC impacts were regressed on site payment and program characteristics to determine the extent to which these features independently affected savings performance. A random effects model was specified for the meta-regression. Statistical analyses were conducted using the meta and metareg procedures in Stata 14.
Sample Sizes for Meta-Regression
Some investigators are reluctant to use meta-regression techniques due to concerns about small numbers of studies available for analysis. This was also a concern for our APCR analysis. We used our meta-regression results to evaluate the broader implications of sample size for multi-site demonstration projects.
The adequacy of a set of demonstration sites for meta-regression depends on the relationship between the magnitude of substantively important policy effects and statistical significance. In the absence of other guidelines, we assumed that policymakers would be interested in any binary site characteristic that produced savings of US$300 per beneficiary per year (3% of an average annual expenditure of US$10,000 per beneficiary). The corresponding standard error of the regression coefficient for a characteristic would then need to be US$150 PBPY or less in order for a US$300 effect to be significantly different from zero in statistical testing.
The standard error of a regression coefficient depends on several elements, including the variance of the measures, the explained variance in both the outcome and explanatory variables, and the sample size. To explore the influence of sample size on standard errors assuming that feature effects remained the same, we replicated the original data set of 22 sites two times and three times and re-estimated the meta-regression model for each replication.
Results
Descriptive Statistics
Descriptive statistics for the 22 sites are summarized by initiative in Table 1. Altogether, the four initiatives supported approximately 3,200 practices in delivering services to nearly 1.5 million Medicare beneficiaries as well as other patients served by the practice. The mean expenditure effect was a savings of US$26 PBPY (95% confidence interval = −US$135 to US$84). Savings were greatest in the CPC sites (mean of −US$94 PBPY), while comparative losses were the largest for the FQHC-APCP.
All but four sites made payments to external organizations to support initiative activities. All CPC sites participated in Shared Savings models and received Technical Assistance from CMS or its subcontractors. Medicare payments per beneficiary per month were considerably higher in the CPC sites than in the other initiatives. SNMHS scores reflected each initiative’s emphasis on medical home transformation, with the highest scores for the MAPCP and HCIA-PCR sites.
Impacts on TCOC and 90% confidence intervals for all 22 sites are displayed in the forest plot in Figure 1. In this plot, negative values represent cost savings while positive values indicate costs higher than those observed in the comparison group. In general, these effects were uniformly distributed across a range of −US$449 PBPY to +US$673 PBPY. The mean weighted effect, depicted by the dashed vertical line, was −US$26 PBPY. Most TCOC effect estimates did not differ significantly from zero at p < .10. Five sites had estimated savings exceeding the criterion of −US$300 PBPY. In seven sites, the standard error of the effect size estimate was below the criterion of US$150.
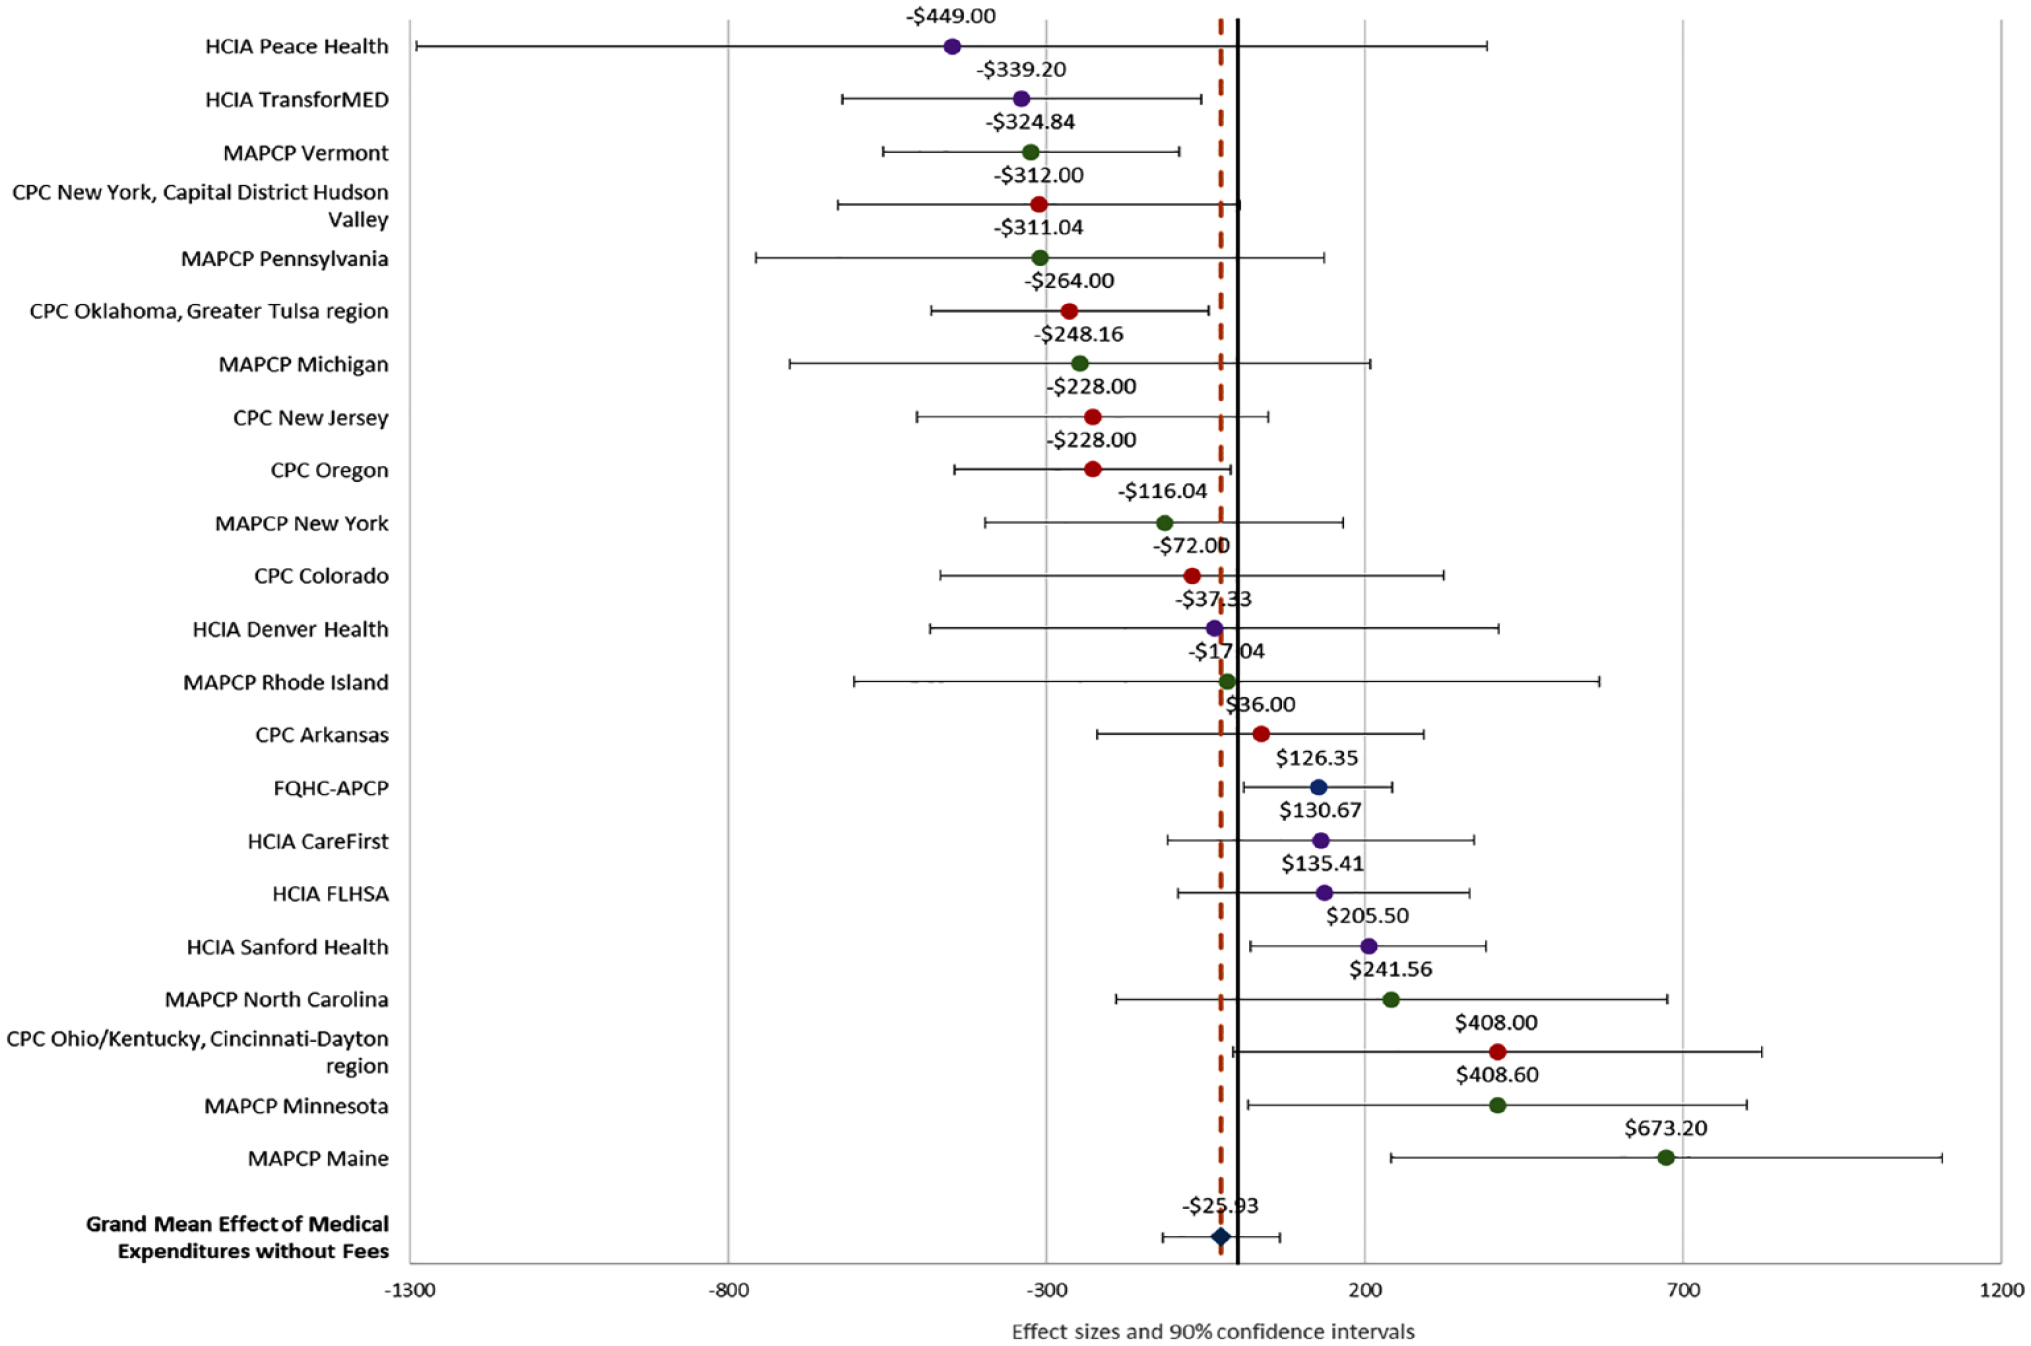
Forest Plot of TCOC Effect Sizes by Site (n = 22 Sites).
Meta-Regression Results
The Q statistic for the site data (Q = 45.53) was significantly different from zero (df = 21, p = .0008). This suggests that the site effects were very unlikely to have come from a single underlying population. The I2 value for expenditure effect sizes was 53.7%, indicating moderate inconsistency between sites that could not be attributed solely to sampling error. Based on this result, we proceeded to estimate the meta-regression model. The coefficient estimates are shown in Table 2. The model explained 40.6% of the between-site variation in TCOC impacts. Receiving CMS-supported Technical Assistance and making payments for external support were both associated with comparative cost savings. Among the payment models, the most favorable effect was found for Pay for Performance (savings of US$292 PBPY), while shared savings participation had little impact. The extent of new staff hiring had a favorable effect on TCOC. Higher monthly Medicare payments per beneficiary did not improve TCOC performance, and comparative cost effects were higher when Medicaid was a payer. SNMHS scores measuring the extent of medical homeness had little influence on cost results.
Meta-Regression Results for Impacts on TCOC Effect Size PBPY (n = 22 Sites).
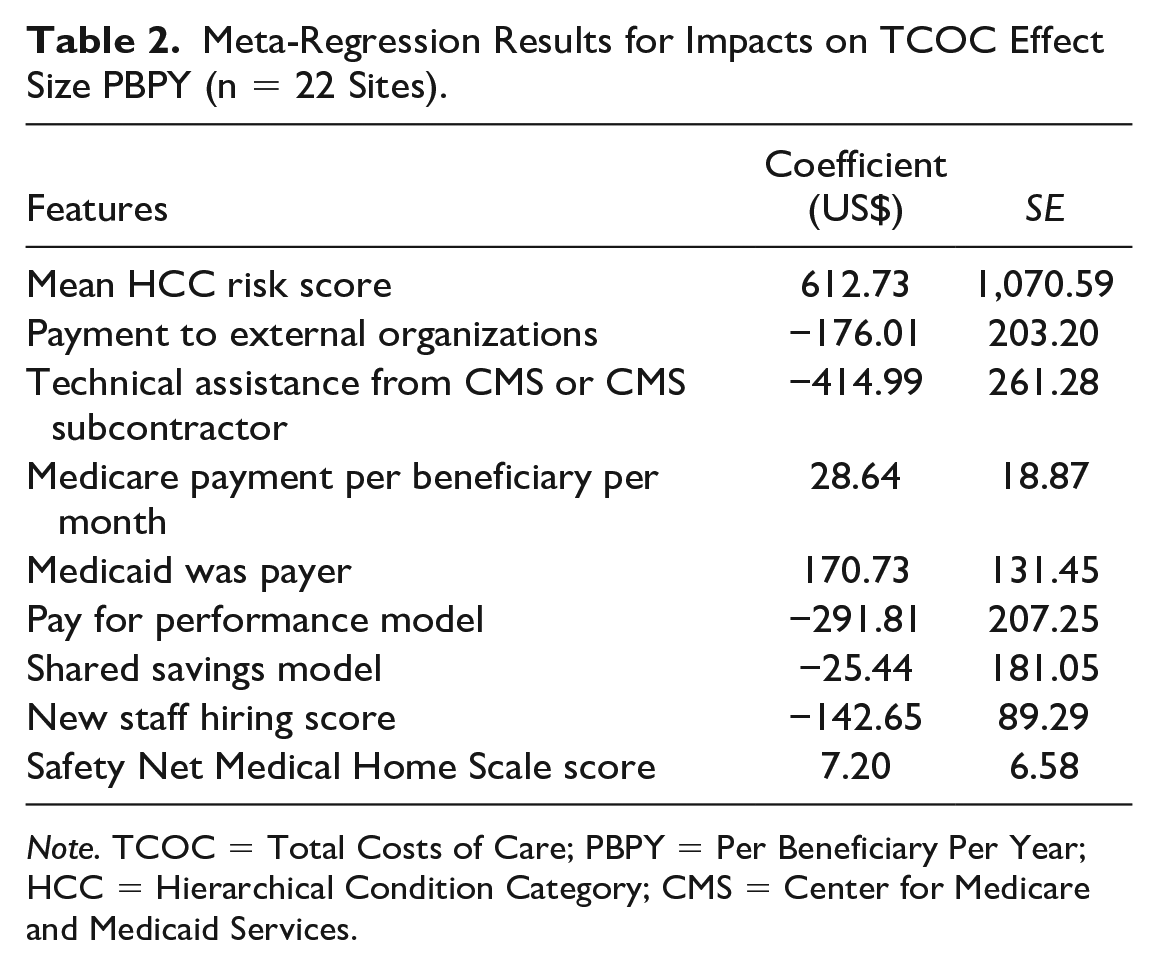
Note. TCOC = Total Costs of Care; PBPY = Per Beneficiary Per Year; HCC = Hierarchical Condition Category; CMS = Center for Medicare and Medicaid Services.
The effects of all site features were relatively modest, and none exceeded conventional levels for statistical significance. Of the five binary features, only Medicaid as a payer had a standard error below US$150 and only the effect of CMS-supported TA exceeded the US$300 criterion (although the Pay for Performance effect was just below this threshold).
Sample Size Analysis
The results of our sample size analyses are displayed in Figure 2, which compares the standard errors for each of five binary features for N = 22 sites (the original sample), N = 44 sites (adding one replication of the original data), and N = 66 (adding two replications). Standard errors decline as sample size increases.
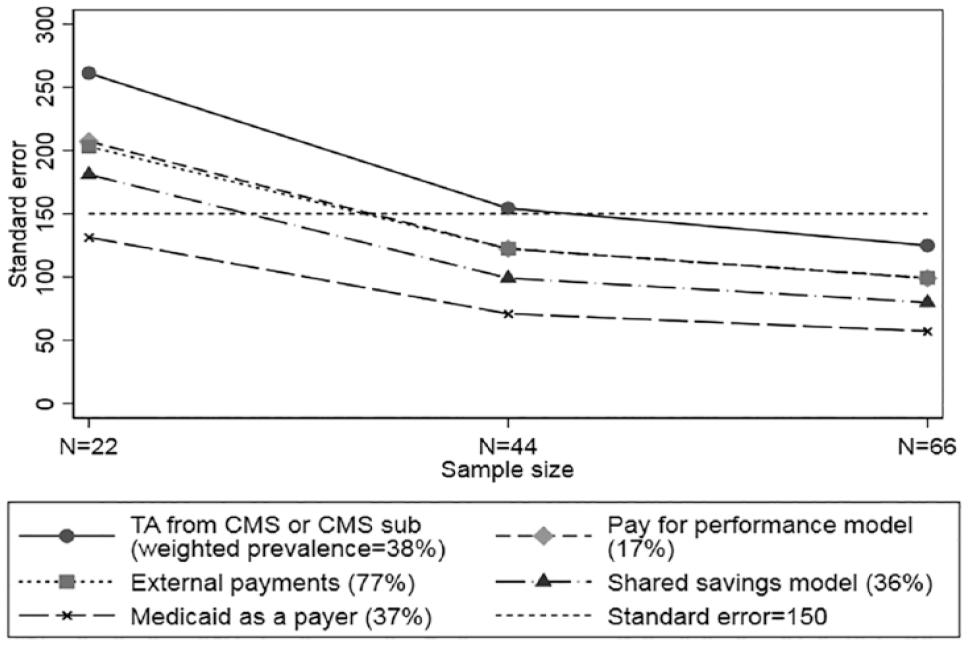
Meta-Regression Standard Errors for Binary Site Characteristic Coefficients by Sample Size.
Interpolating from the plot suggests that for these initiatives a sample of at least 35 sites is needed to push meta-regression coefficient standard errors below the desired US$150 per year target for the effects of all but one of the binary site characteristics. The SEs are different for each of the characteristics we examined because they are affected by both prevalence of the characteristic and the intercorrelations among characteristics.
Discussion
The overall weighted impact of the APCR initiatives in our meta-analysis was an estimated savings of only US$26 PBPY with a 95% confidence interval ranging from −US$135 to US$84. This near zero effect is similar to three earlier reviews (John et al., 2020; Sinaiko et al., 2017; Veet et al., 2020), which also found negligible expenditure effects for PCMHs.
Despite the widespread promotion of PCMH transformation, SNMHS scores measuring the extent of medical homeness had little influence on costs. Other studies have found few practice-level PCMH activities that were associated with total costs of care (Burton et al., 2020; Stockbridge et al., 2014). Taken together, these findings suggest that increasing levels of PCMH transformation is unlikely to produce greater cost savings.
Our analysis was designed to identify features of APCR initiatives that produced greater Medicare savings in these demonstrations. One of the strengths of meta-regression is that coded design features frequently represent policy options. One policy implication of our analysis is that certain payment mechanisms appear to be more likely to produce savings than other options. Among the various payment options, the meta-regression results indicated that the most favorable effect was for Pay for Performance (P4P) models (estimated savings of US$292 PBPY). Since being advocated by the Institute of Medicine and Board on Health Care Services (2007), most P4P evaluations have focused on quality of care. The few studies that have examined the costs of primary care have yielded mixed results (Eijkenaar et al., 2013; Mendelson et al., 2017). The effects in our analysis were driven by three MAPCP sites that offered P4P incentives. This effect in MAPCP was also noted in a qualitative analysis by Burton et al. (2018). The impact of participation in shared savings programs, however, was close to zero.
Higher monthly Medicare payments per beneficiary did not improve TCOC performance, suggesting that a policy of raising payments is unlikely to achieve greater savings. Relative costs were higher when Medicaid was a payer.
Medicare savings were more likely if the site received Technical Assistance (TA) provided by CMS (US$415 PBPY). The impact of TA may be due to its comprehensiveness or extensiveness. In CPC, sites received extensive TA through multiple channels, including webinars, regional learning collaboratives, and on-site coaching. FQHC-ACPC sites also received intensive support focused on the PCMH transformation process. TA in MAPCP was developed by the individual sites and generally appeared to be more variable and less intensive than in CPC. HCIA-PCR sites did not receive TA. These results suggest that savings performance can be enhanced by providing TA, especially if the support comes from CMS or a CMS subcontractor.
Eighteen of the sites paid external organizations for redesign services. These payments may have been cost-effective if they were less than the estimated savings (US$176 PBPY) they generated. The extent of new staff hiring had a small but favorable effect on TCOC, which may reflect greater service levels and care coordination provided by these staff.
One of the shortcomings of meta-analysis is that the impact of beneficiary-level characteristics may be underestimated when they are aggregated to the site level (Morton et al., 2004). Aggregation bias may have diluted the effect of average HCC risk, the only beneficiary-based measure in our model for which the site means had a narrow distribution in our data. The net association, however, implies worse TCOC performance for demonstrations with sicker patients.
We chose thresholds of US$300 in annual savings per beneficiary (roughly 3% of annual Medicare expenditures) and a corresponding standard error of US$150 for meta-regression coefficients to interpret the magnitude of impacts on TCOC. In our sample of 22 sites, none of the site features exceeded conventional levels (p < .05) for statistical significance. However, only one feature (CMS-supported TA) exceeded the US$300 impact threshold, suggesting that the issue is as much one of substantively small effects as it is of inadequate sample size.
Our exploration of the number of study sites suggests that samples of 35 studies or more are needed to achieve the US$150 precision threshold in studies of Medicare costs. This target assumes that the variation in site effect sizes is similar to that in our evaluation of APCR initiatives. Meta-regression coefficient precision will also be affected by the prevalence of individual site features and by their intercorrelations. Meta-analysts should carefully consider coefficient precision when accumulating individual studies. Funding agencies might also consider the optimal number of sites needed for meta-analysis when they fund future initiatives or cooperative agreements.
Research reports or published studies for multi-site studies will rarely contain a common set of variables measured in a standard way. One way to address this problem is to augment primary report data about intervention characteristics with supplementary data from other sources. In our study, half of the moderators we analyzed were taken from a survey we designed and administered to site evaluation staff. This might encourage researchers to develop new, more sophisticated measures of study features and encourage CMMI to facilitate cross-site comparisons by requiring standardized reporting procedures. A longer term goal would be to compile a compendium of measures that can be used in future meta-analyses.
One limitation of our study is that we relied on site evaluator ratings of features such as the extent of staff hiring and medical homeness. Some evaluators were uncomfortable making these assessments if they were familiar with only a subset of the practices. This uncertainty may have introduced measurement error into the ratings which would in turn lead to underestimates of the influence of these features in the meta-regression.
In the absence of an overarching conceptual model, we developed measures suggested by three different frameworks as well as the hypothesis that greater PCMH transformation would produce better outcomes. The Primary Care Performance Initiative framework (Veillard et al., 2017) contributed four payment-related measures to our meta-regression model. The only variable derived from the Andersen/Newman utilization model was the HCC risk score serving as proxy for patient health status. Four moderators, all of which were incorporated into our site survey, were suggested by the Wilson–Lipsey domains. With regard to future conceptual development, we believe that refinements of the Wilson–Lipsey model hold the most promise, largely because of its focus on intervention-level features. There is clearly much work to do to categorize the many possible components of health care interventions. Some aspects of the model, such as statistical analysis methods and sampling procedures, had little variation among the sites we examined but are likely to be important in other evaluations. We hope that the measures we developed here will contribute to the compendium of design features investigated in future meta-regressions.
Conclusion
In summary, our meta-regression analysis of expenditure effects in APCR demonstrations identified several program features associated with relative Medicare savings, including CMS-sponsored Technical Assistance, pay for performance opportunities, and payments to external organizations for redesign services. However, the magnitude of the impacts on expenditures was modest with only one feature exceeding savings of more than US$300 per beneficiary per year. To be able to reliably detect effects at the US$300 per year threshold, we estimate that data from approximately 35 sites would be needed for meta-regression. Our ability to conduct meaningful meta-regression will grow in the future as we accumulate data from more initiatives and refine our measurements of key program features.
Supplemental Material
sj-docx-1-mcr-10.1177_10775587231194658 – Supplemental material for Meta-Analysis of the Impact of Four Advanced Primary Care Redesign Initiatives on Medicare Expenditures
Supplemental material, sj-docx-1-mcr-10.1177_10775587231194658 for Meta-Analysis of the Impact of Four Advanced Primary Care Redesign Initiatives on Medicare Expenditures by Kevin W. Smith, Eva Chang, Elliott Liebling and Anupa Bir in Medical Care Research and Review
Footnotes
Acknowledgements
We are grateful for comments provided by Patricia Markovich, Martin Cohen, Allison Russo, David Kennell, Jim Derzon, Kyle Emrey, Ben Koethe, and Julia Cohen.
Declaration of Conflicting Interests
The author(s) declared no potential conflicts of interest with respect to the research, authorship, and/or publication of this article.
Funding
The author(s) disclosed receipt of the following financial support for the research, authorship, and/or publication of this article: This analysis was supported by Centers for Medicare and Medicaid Innovation contract No. HHSM-500-2011-000081.
Supplemental Material
Supplemental material for this article is available online.
References
Supplementary Material
Please find the following supplemental material available below.
For Open Access articles published under a Creative Commons License, all supplemental material carries the same license as the article it is associated with.
For non-Open Access articles published, all supplemental material carries a non-exclusive license, and permission requests for re-use of supplemental material or any part of supplemental material shall be sent directly to the copyright owner as specified in the copyright notice associated with the article.