
Abstract
This study examined if greater insurer market power was associated with consistently lower negotiated prices within each hospital for 44 shoppable and emergency procedures, using price transparency data disclosed by 1,506 hospitals in metropolitan areas. We used multi-level fixed effects models to estimate the within-hospital variation in plan-level insurer-negotiated prices (from the largest insurer, the second largest insurer, other major insurers, and nonmajor insurers) and cash-pay prices as a function of insurer market power. For shoppable services, relative to nonmajor insurers, the largest, second largest, and other major insurers negotiated 23%, 16%, and 3% lower prices, respectively, while cash prices were 17% higher. For emergency room visits, while the largest insurers paid 5% less than nonmajor insurers, the second largest and other major insurers did not pay lower prices. Stratified analyses by type of shoppable services found varying magnitudes and patterns of price discounts associated with insurer market power.
Introduction
Spending on hospital care in the United States has increased by almost 60% over the past decade (Centers for Medicare & Medicaid Services, 2021a). In 2020, it reached a total of 1.3 trillion, accounting for 31% of national health care expenditure and 6% of GDP (Centers for Medicare & Medicaid Services, 2021b). A key driver of this spending is the high prices paid by commercial health insurance plans to hospitals, which are often double what Medicare pays for the same service (Anderson et al., 2019; Chernew et al., 2020; Cooper et al., 2019). High commercial prices contribute to an affordability crisis where 23% of patients with insurance cannot afford necessary medical care, and commercial premiums have more than tripled over the past two decades (Kaiser Family Foundation, 2021; Ollove, 2022). Moreover, increasing commercial insurance prices may further place pressure on public insurance programs to increase their payment rates to maintain access to providers (Medicare Payment Advisory Commission, 2009, 2011; Wang & Anderson, 2022).
Stronger insurer market power may serve as a countervailing force to curb rising prices for hospital care. Prior studies found that markets with higher insurer market concentration were associated with lower commercial negotiated rates for hospital services and that greater insurer market share (e.g., major insurers) was associated with heavier price discounts (Cooper et al., 2019; Craig et al., 2021; Roberts et al., 2017; Scheffler & Arnold, 2017). However, these studies might not be necessarily generalizable to the entire US health insurance market given that they have primarily used a limited sample of insurers and/or markets (e.g., three insurers from an administrative claims database, all-payer claims database for a single state), or have examined a limited set of (mostly inpatient) procedures. Moreover, prior studies were unable to incorporate cash prices, which may determine the out-of-pocket (OOP) cost for uninsured patients and insured patients choosing to pay the full price OOP (e.g., patients enrolled in high deductible plans before reaching their deductible) (Wang, Meiselbach, et al., 2023).
Furthermore, these studies used data from 2016 or earlier. Over the past 7 years, commercial prices have continued to rise, despite the fact that 75% of health insurance markets in metropolitan areas are already highly concentrated (American Medical Association, 2022). This raises the question of whether the relationship between insurer market power and commercial prices remains valid. Moreover, the vast majority of the commercially insured population is enrolled in employer-sponsored health insurance, where 65% of them are covered by self-insured administrative service-only (ASO) plans (Kaiser Family Foundation, 2022). In these plans, insurers only administer claims without bearing any risk, which may diminish their incentive to negotiate lower prices on behalf of employers, and there is no evidence that, on average, risk-bearing employers were able to effectively negotiate lower prices themselves (Craig et al., 2021; Eisenberg et al., 2021). In addition, a recent study found that cash prices, paid by individual patients with virtually no market power, are cheaper than the median commercial negotiated rate 47% of time for shoppable services (Wang, Meiselbach, et al., 2023). Collectively, these findings raise concerns as to whether insurers are still effectively leveraging their bargaining power to negotiate lower rates for their beneficiaries.
To address the empirical gaps identified above, we leverage the current hospital price transparency data where all US hospitals are required to disclose their insurer-negotiated prices at individual plan levels (Centers for Medicare & Medicaid Services, 2019). We examine variation in insurer-negotiated prices within each of the 1,506 hospitals in metropolitan areas located in 312 metropolitan statistical areas (MSA) across 135 insurers with different levels of market power, over 44 common shoppable and emergency hospital services. We also included cash prices as an additional price category, which has been little explored in prior work on this topic.
This study empirically examines the extent to which insurers with stronger market power obtain lower prices, relative to smaller insurers and cash-pay patients accessing care at the same hospitals for the same procedures. Our results provide the most up-to-date, nationwide, and comprehensive evidence on if insurer market power still affects hospital price negotiation. Our findings provide insights for individual patients and employers exploring options to contain their health care spending, and policymakers interested in lowering hospital prices by encouraging price competition, and price shopping.
Methods
Data and Sample
Our primary data source was Turquoise Health data (as of February 3, 2023), which collects current price information disclosed by US hospital facilities under the Price Transparency Rule (Turquoise Health, 2022). We extracted cash prices at the hospital level and commercially negotiated rates at the plan level for the 70 CMS-specified shoppable services and 5 emergency room (ER) visits (Centers for Medicare & Medicaid Services, 2019; Henderson & Mouslim, 2022). To measure insurer market power, we linked Turquoise data with the American Medical Association’s (AMA) competition in health insurance report (2022 update) by insurer name. The AMA report identified the largest and second-largest insurer in each MSA. We also categorized six major insurance carriers (CVS Health, Anthem, Blue Cross Blue Shield, Cigna, Kaiser Permanente, and UnitedHealthcare), according to their nationwide commercial insurance market share. To identify hospital characteristics, we further merged the Turquoise data with the American Hospital Association’s annual hospital survey of 2021 (Wharton Research Data Services, 2023).
Using the merged data, we started with 1,664 hospitals that disclosed both insurer-negotiated rates and cash prices for any of the 70 CMS-designated shoppable services and 5 ER services. Due to variations in the disclosure rates across different procedures, we focused on 44 procedures (39 shoppable and 5 ER) disclosed by at least 50% (832) of the disclosing hospitals (Supplemental Appendix Exhibit A1). To address potential data anomalies, we further excluded the top 1% highest and lowest price values for each procedure. Our final sample included a total of 1,044,264 prices from 1,506 hospitals located in 312 MSAs, representing 60% of general acute-care hospitals located in 81% of MSAs in the United States. See Supplemental Appendix Exhibit A2 for the sample selection process.
To evaluate the representativeness of our hospital sample, we assessed the differences between our hospital sample and 1,014 general acute-care hospitals located in MSAs that were identified in the AHA 2021 annual survey but not included in our study for a set of key hospital characteristics. Using t-tests and chi-square tests, we did not find statistically significant differences between the two groups in census region, teaching status, insurer market concentration, county-level uninsured rate, or median household income. Our sample had slightly higher proportions of hospitals with nonprofit ownership, larger bed size, system affiliation, and lower hospital market concentration (Supplemental Appendix Exhibit A3).
Insurer Market Power
We classified commercial insurers and cash prices into five groups of varying market power: the largest insurer, the second largest insurer, a major insurer that was neither the largest nor second largest insurer in the local MSA (hereafter, other major insurers), a nonmajor insurer, and cash-pay. We measured insurers’ market power by their market shares from all products in the commercial markets (combined products measures in AMA report Supplemental Table A-1), including both employer-sponsored plans (self-insured and fully insured) and individual plans sold in the ACA Marketplace, but not plans from Medicare Advantage or Medicaid managed care organizations. We hypothesized that the largest insurer would have the strongest bargaining power and, therefore, obtain the lowest negotiated prices (Fronsdal et al., 2020; Roberts et al., 2017). As insurers’ market power weakened, we hypothesized that price discounts, relative to nonmajor insurers with the least negotiating leverage, would diminish. We further hypothesized that cash-pay patients may pay even higher prices since they have virtually no market power, unless other factors influence a hospital’s cash-pay pricing mechanism (Wang, Meiselbach, et al., 2023). We used the MSA-level insurer market share information from the AMA report as a proxy measure for the largest and second largest insurers for each hospital located in the corresponding MSA, the geographic unit that is commonly used to define the health insurance market (Eisenberg et al., 2021; Fulton, 2017).
Statistical Analysis
We first summarized the negotiated price (average, median, and interquartile range) by procedure. To show the distribution of major insurers’ market power, we then summarized the number of MSAs where each of the six major insurers were the first or second largest insurers. To assess price variation across insurer market power categories, we calculated the average price for each of the 44 procedures (measured in 46 current procedural terminology [CPT] codes), stratified by the five payer categories. Using the nonmajor insurer’s average price as the benchmark, we calculated the relative prices for the largest insurers, the second largest insurers, other major insurers, and cash-pay, and plotted them in scatter plots, separated for shoppable services and ER visits.
We implemented multi-level regression models with hospital and procedure fixed effects to estimate the price variation within a hospital across payers as a function of differing market power for the 39 shoppable services and 5 ER visits in two regression models, respectively. The outcome was the log-transformed insurer-negotiated rates and log-transformed cash prices due to the right skew distribution of health care prices (Cooper et al., 2019; Craig et al., 2021; Fronsdal et al., 2020; Scheffler & Arnold, 2017). The key explanatory variable was the 5-category insurer market power variable, using nonmajor insurers as the reference group. We also incorporated service-setting fixed effects (i.e., inpatient, outpatient, emergency department, or unspecified) to ensure that our estimates were not subject to heterogeneity across different hospital departments. The hospital fixed effects also controlled hospital characteristics and hospital market power that could influence commercially negotiated prices. Standard errors were clustered at the hospital level. Stata 14 was used for data analysis.
To evaluate the potentially heterogeneous patterns across different types of service, we further stratified the 39 shoppable services into 13 radiology, 13 laboratory and pathology, 10 medical and surgical, and 3 evaluation and management services, and separately estimated the above model for each subtype of shoppable services. To evaluate the association between market power and the negotiated price at a more granular level, we further regressed log-transformed prices on insurer market share at the MSA level for the largest and second largest insurers only. For sensitivity analyses, we re-estimated our models after excluding the top 10% highest and lowest price values and filtered hospital samples among those that disclosed prices for all five insurer categories.
Results
Descriptive Results
Table 1 summarizes the price variation for each of the 44 procedures, where sleep study (CPT code: 95810) had the highest average price ($2,638) and automated urinalysis test (CPT code: 81002) had the lowest average price ($21). Regarding insurer market share, Blue Cross Blue Shield, followed by UnitedHealth Group, and Anthem, had the highest number of MSAs where they accounted for the largest or second largest insurers (Supplemental Appendix A5). For the 39 shoppable services, Figure 1 Panel A showed a clear upward price trend as insurer market power weakened. The largest and second largest insurers negotiated the lower rates ranging between 64% to 98% and 59% to 109% of the nonmajor insurers’ rates, depending on the service, respectively. With relatively weaker market power, other major insurers negotiated rates ranging from 79% to 107% of the nonmajor insurers, depending on the service. Cash-pay patients generally paid more than insurer-negotiated prices, ranging from 90% to 121% of nonmajor insurers’ prices. For the 5 ER visit services, while the largest insurer paid lower rates than nonmajor insurers (82%–98%), the second largest insurer, other major insurers, and cash-pay patients all paid higher rates (104%–129%, 114%–124%, and 105%–110%, respectively) than the nonmajor insurers (Figure 1 Panel B).
Summary of Price Variation by Procedure.
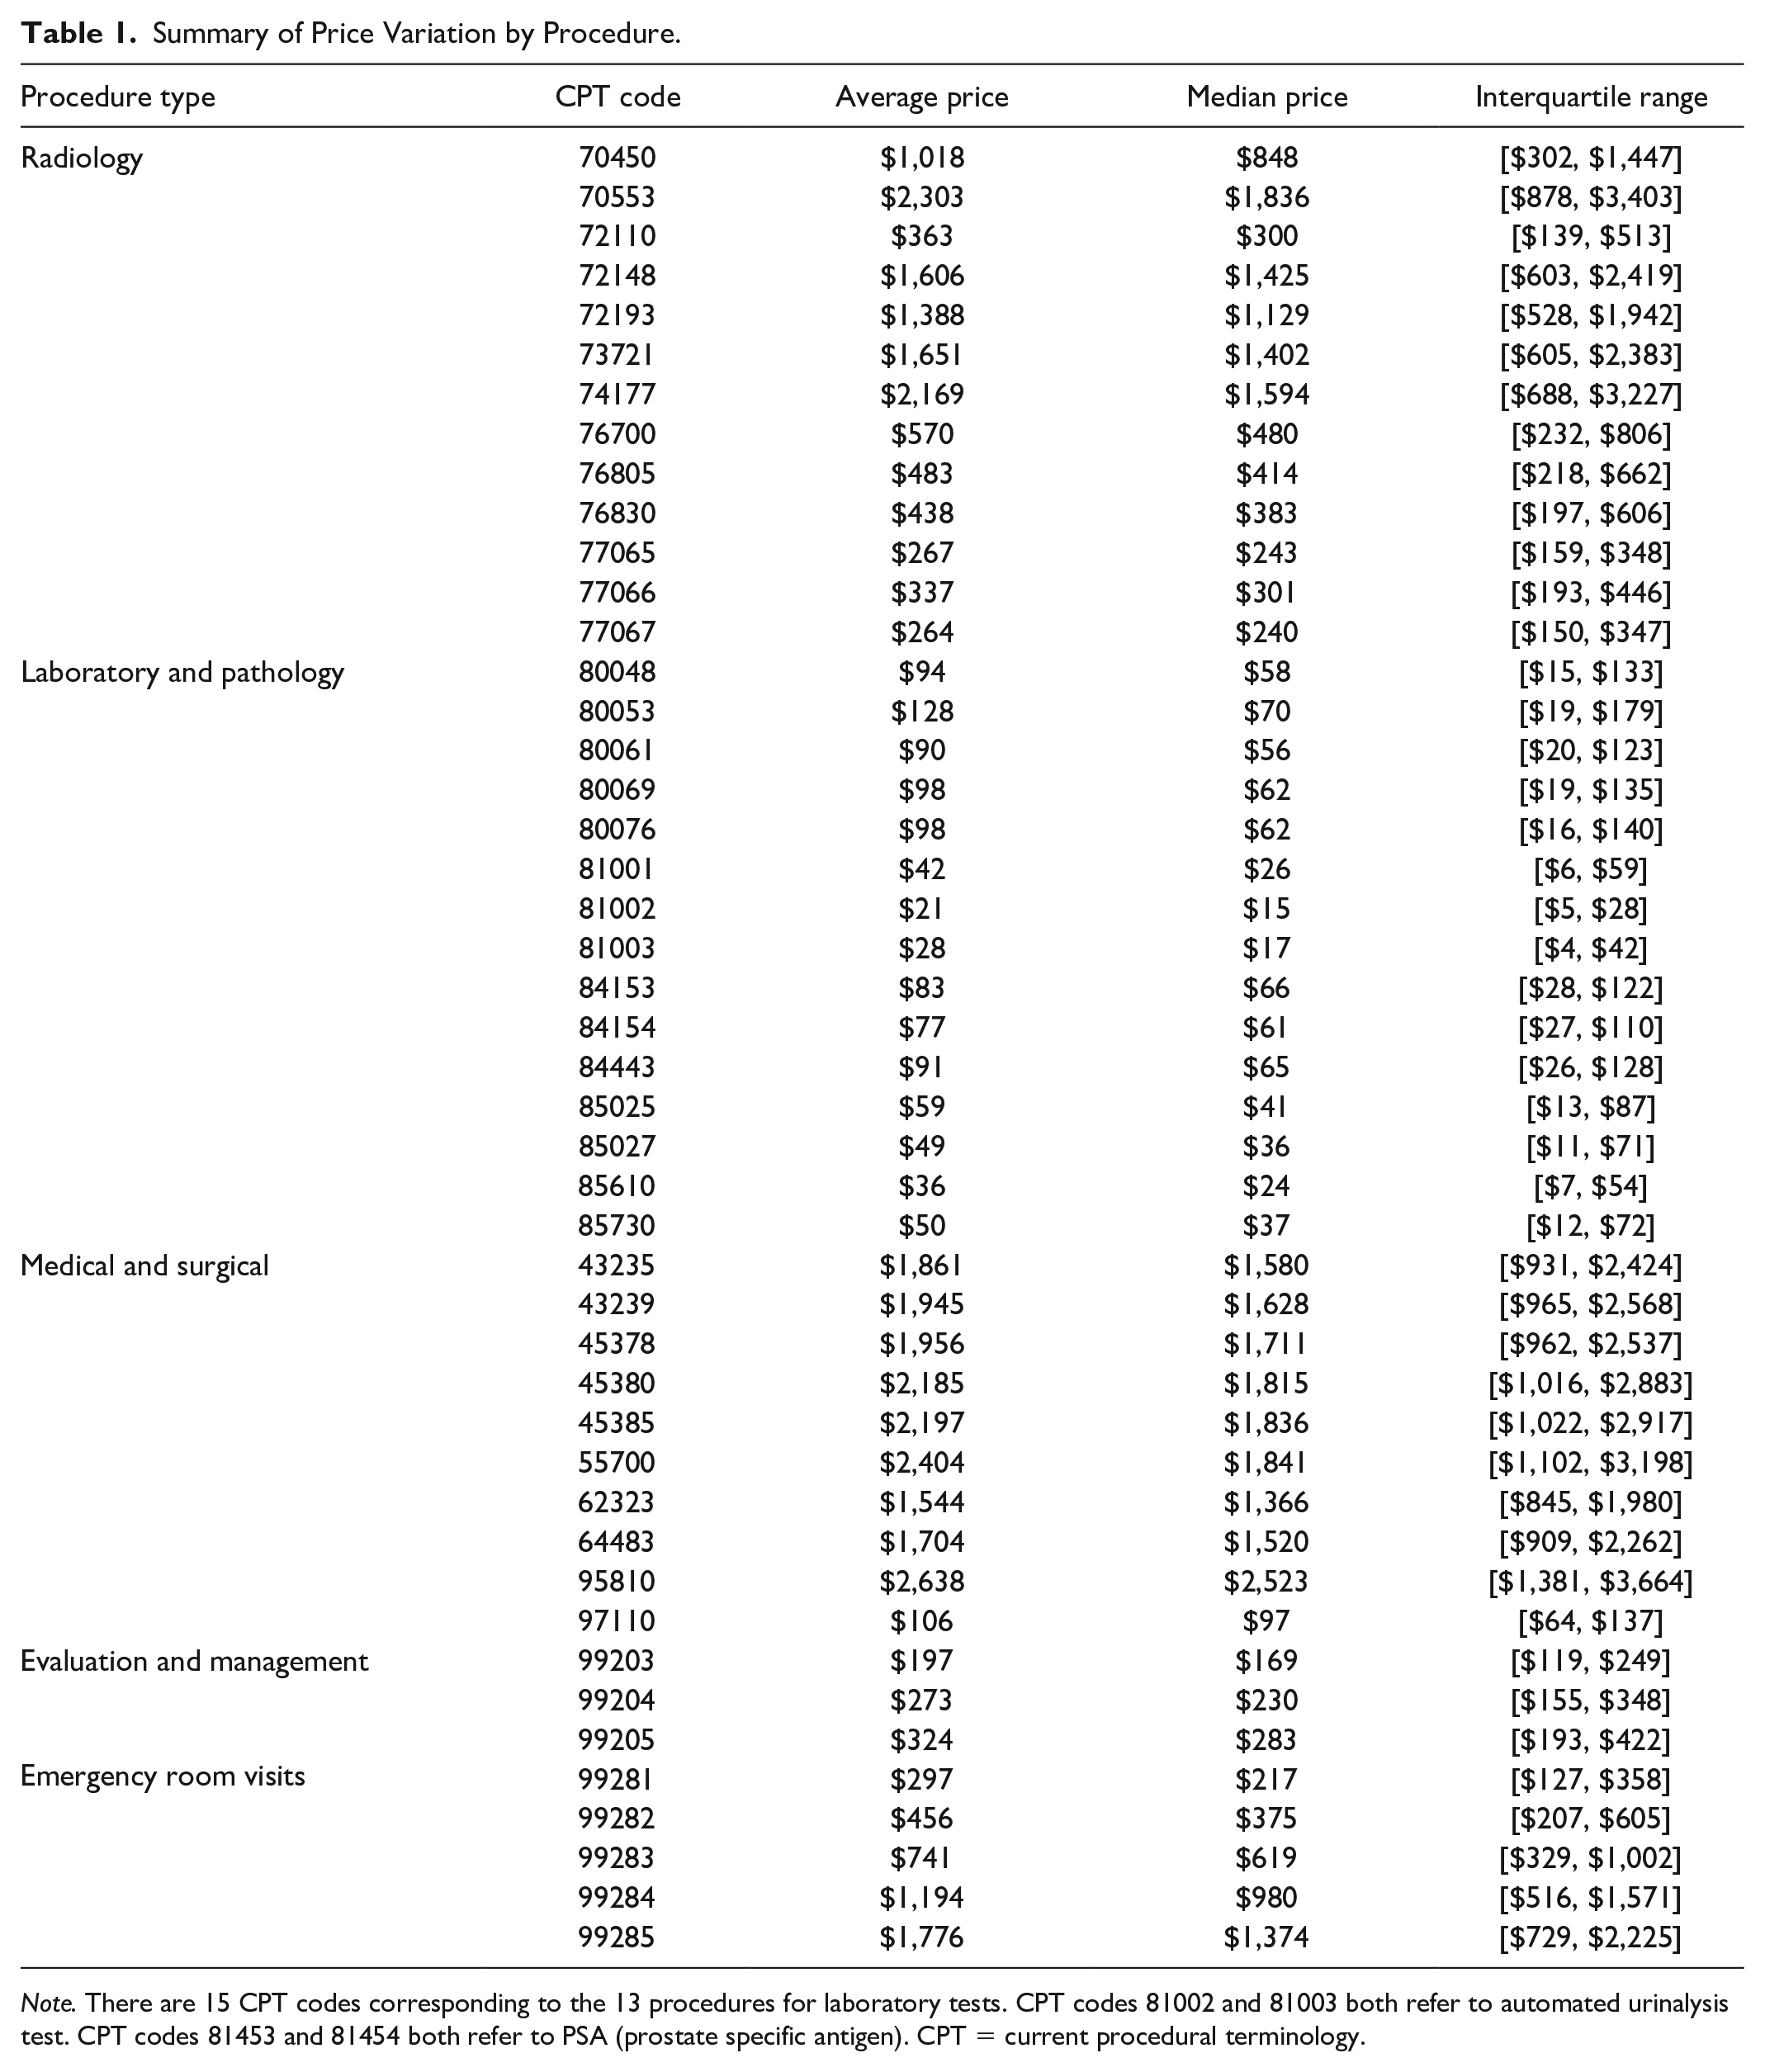
Note. There are 15 CPT codes corresponding to the 13 procedures for laboratory tests. CPT codes 81002 and 81003 both refer to automated urinalysis test. CPT codes 81453 and 81454 both refer to PSA (prostate specific antigen). CPT = current procedural terminology.
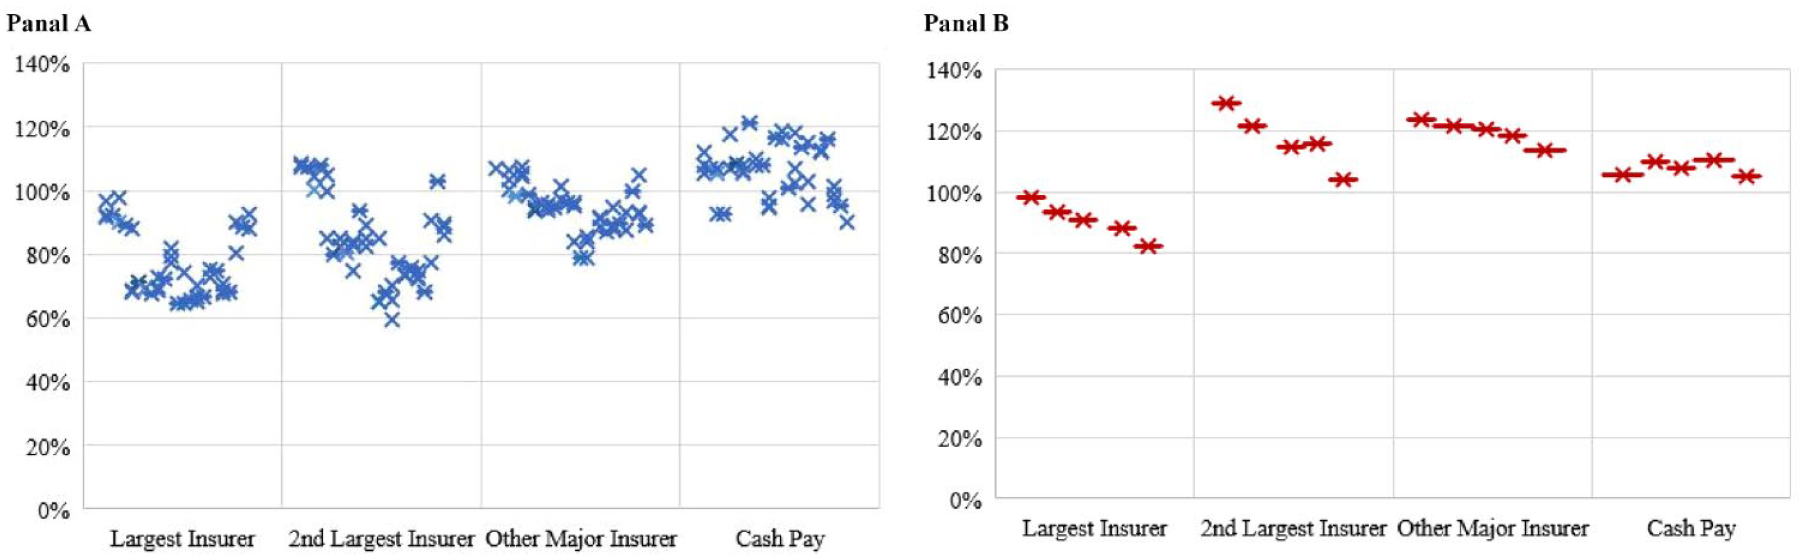
Average Prices by Insurer Market Power, Relative to the Nonmajor Insurer’s: (Panel A) 39 Shoppable Services; (Panel B) 5 Emergency Room Visits.
Regression Results
Figure 2 and Supplemental Appendix Exhibit A6 present the main regression results. For shoppable services, compared to nonmajor insurers, the largest, second largest, and other major insurers were associated with negotiating 23%, 16%, and 3% lower prices, respectively (p < .01). Cash-pay patients paid 17% higher prices than nonmajor insurers (p < .001). For ER visits, while the largest insurers paid 5% less than nonmajor insurers (p < .05), the second largest and other major insurers paid 13% and 12% more, respectively (p < .001). Cash prices were not significantly different from nonmajor insurers’ prices.
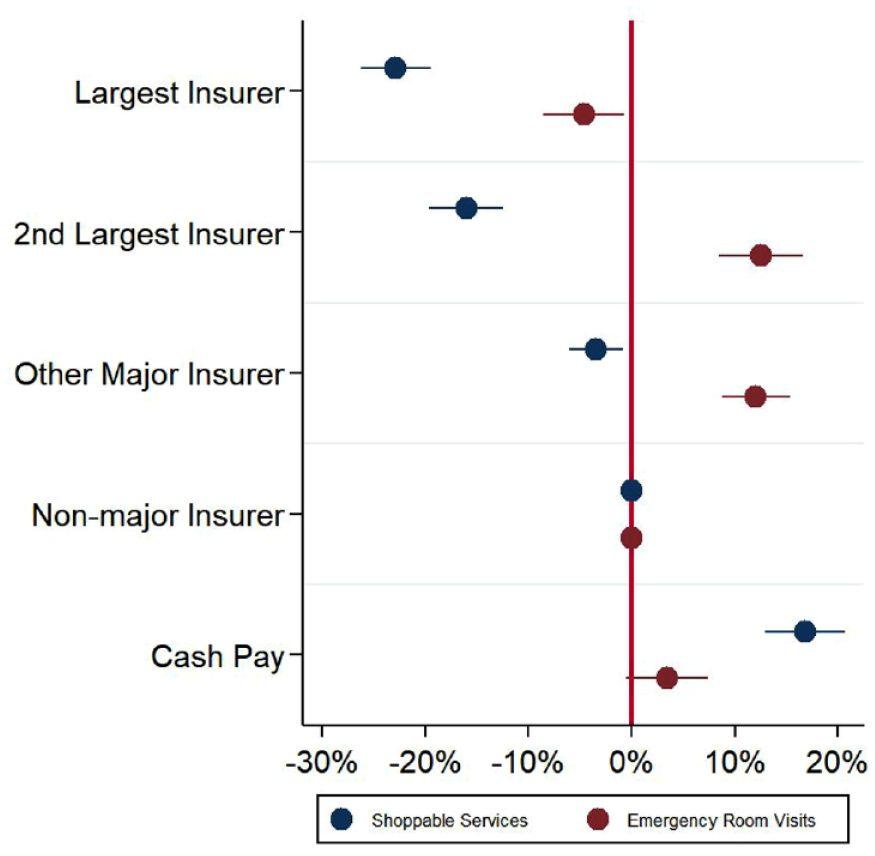
Association Between Within-Hospital Price Variation and Insurer Market Power, Shoppable and Emergency Services.
Figure 3 and Supplemental Appendix Exhibit A7 present regression results stratifying shoppable services by their four subtypes. Overall, payers with stronger market power were typically associated with negotiating lower prices. The largest insurers received the largest price discounts for all subtypes: laboratory and pathology tests (31% lower than nonmajor insurers; p < .001), followed by radiology (24% lower than nonmajor insurers; p < .001), evaluation and management (12% lower than nonmajor insurers; p < .001), and medical and surgical procedures (9% lower than nonmajor insurers; p < .001). For evaluation and management services, while price discounts diminished as insurer market power decreased, cash prices were 7% (p < .001) lower than negotiated prices for the nonmajor insurers, a discount of similar magnitude to that of the second largest insurers. For medical and surgical procedures, the price differential among the second largest insurers, other major insurers, nonmajor insurers, and cash prices were not statistically significant or economically meaningful.
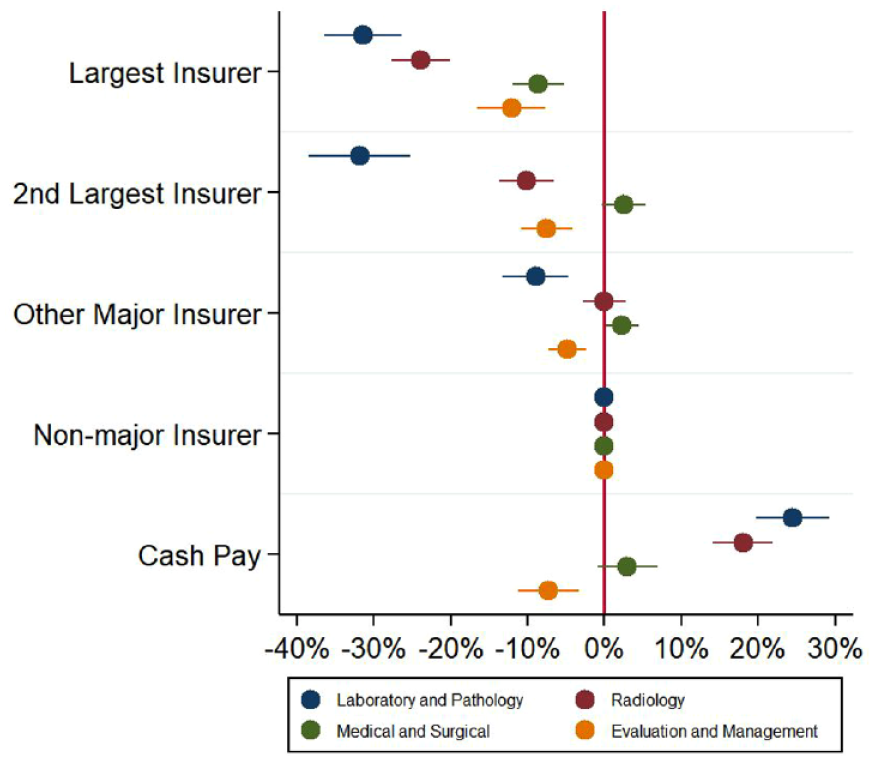
Association Between Within-Hospital Price Variation and Insurer Market Power, Stratified by Type of Shoppable Service.
Consistent with the main regression model, additional analyses among the largest and second largest insurers show that a 1% higher market share (at the MSA level) was associated with 0.22% (p < .001) and 0.53% (p < .001) lower negotiated prices for shoppable care and ER visits, respectively (Supplemental Appendix Exhibit A8). The results from the main model were also robust to regressions excluding top 10% highest and lowest price values and using hospital samples that disclosed prices for all five insurer categories (Supplemental Appendix Exhibit A9, A10).
Discussion
Using the most recent price transparency data disclosed by hospitals nationwide, this study found evidence that, within each hospital, the largest insurers in the MSA, where the hospital is located, paid the lowest negotiated rates compared to other insurers or cash-pay patients across a range of services. While this finding is consistent with prior research, our study found varying magnitudes in the size of price discounts and heterogenous pricing patterns across different payers and types of procedures. For shoppable hospital care, laboratory and pathology tests and radiology services followed a (nearly) monotonic dose–response relationship where increasing levels of insurer market power were consistently associated with additional price discounts. However, this pattern was weaker among evaluation and management services and less consistent for medical and surgical procedures. For ER visits, while the largest insurer still paid the lowest rates, the second largest and other major insurers did not pay lower prices than the nonmajor insurers. In contrast, cash-pay individuals with little market power, paid lower prices than nonmajor insurers for ER visits and evaluation and management procedures. In addition, the larger discounts off the higher-severity services (e.g., CPT 99285) might be a technique used by insurers to combat severity creep, a hypothesis that warrants future research.
In addition to payers’ market power, commercial prices for hospital care can be influenced by many other factors, such as growing hospital market concentration and attenuated incentives for insurers to negotiate lower prices for their ASO plans (Cooper et al., 2019; Eisenberg et al., 2021; Wang & Anderson, 2022). It is also possible that competition from providers outside the hospital setting and varying hospital charge markup rates (i.e., charge-to-cost ratios) might be additional factors that could influence the varying pricing patterns we observed across different procedure types. For example, insurers may have greater leverage in price negotiations with hospitals for services that are more frequently delivered outside the hospital setting (e.g., evaluation and management services that are usually delivered in physician’s offices). Moreover, radiology and laboratory tests, which had the largest price discounts from large insurers, have the highest charge-to-cost ratios, while medical and evaluation services typically have lower charge-to-cost ratios (Bai & Anderson, 2016). It is possible that higher charge markups could potentially allow for greater room for large insurers to negotiate greater price discounts. These two hypotheses remain less explored and warrant future research.
Prior studies found that hospitals may offer lower prices for cash-pay patients, compared to the median insurer-negotiated rates across all plans, in response to their lower willingness (and ability) to pay, especially in lower-income communities (Henderson & Mouslim, 2022; Wang, Meiselbach, et al., 2023). We found that cash prices were typically lower than (or the same as) insurers’ prices (except the largest insurers’) for ER visits, evaluation and management, and medical and surgical services, consistent with this evidence. However, we found that cash prices were typically higher for radiology services and laboratory and pathology tests, which may be more frequently accessed by patients with greater disposable income, on average, than those seeking emergency care.
In the context of lowering health care prices, our findings provide insights for patients and employers shopping for health plans for lower hospital prices. In particular, our study suggests that choosing plans from the largest insurer in the local market is more likely to result in lower negotiated rates than from other plans or paying cash. Recently, a growing number of self-insured employers engaged in direct contracts with hospitals, or formed employer coalitions, to strengthen their negotiating leverage (Eisenberg et al., 2021; Moran, 2021; White, 2017). Our results suggest that they could use the rates from the largest insurer in their local market as benchmarks in price negotiation.
This study had several important limitations: First, our sample was contingent on hospitals’ price disclosure, as close to half of hospitals had not fully disclosed their prices for the 70 CMS-designated shoppable services or ER visits yet. Therefore, our results might be subject to potential sample selection biases where hospitals did not disclose, or fully disclose their prices (e.g., only reporting prices for some contracting plans or procedures), and should be interpreted as associations instead of causal relationships. Second, hospital price transparency data may contain potential reporting inaccuracies. Due to the cross-sectional nature of the data, we were not able to examine price variation associated with changes in insurer market share over time. Third, our results were confined to hospitals’ facility prices for the 44 shoppable (and mostly outpatient) procedures that were commonly reported and may not be generalizable to other procedures or provider settings (Horný et al., 2021; Wang, Xu et al., 2023). Finally, this study focused exclusively on hospital facility pricing in metropolitan areas. We were unable to incorporate additional information on patient characteristics, diagnosis, care utilization, network, type of payment mechanism (i.e., bundled payment), or quality outcomes. These are important gaps and potential opportunities for future research.
Supplemental Material
sj-docx-1-mcr-10.1177_10775587231193475 – Supplemental material for Do Insurers With Greater Market Power Negotiate Consistently Lower Prices for Hospital Care? Evidence From Hospital Price Transparency Data
Supplemental material, sj-docx-1-mcr-10.1177_10775587231193475 for Do Insurers With Greater Market Power Negotiate Consistently Lower Prices for Hospital Care? Evidence From Hospital Price Transparency Data by Yang Wang, Mark K. Meiselbach, Jianhui Xu, Ge Bai and Gerard Anderson in Medical Care Research and Review
Footnotes
Declaration of Conflicting Interests
The author(s) declared no potential conflicts of interest with respect to the research, authorship, and/or publication of this article.
Funding
The author(s) disclosed receipt of the following financial support for the research, authorship, and/or publication of this article: This research was supported by Arnold Ventures.
Supplemental Material
Supplemental material for this article is available online.
References
Supplementary Material
Please find the following supplemental material available below.
For Open Access articles published under a Creative Commons License, all supplemental material carries the same license as the article it is associated with.
For non-Open Access articles published, all supplemental material carries a non-exclusive license, and permission requests for re-use of supplemental material or any part of supplemental material shall be sent directly to the copyright owner as specified in the copyright notice associated with the article.