
Abstract
Extended periods of driving, lasting up to 8 hours, can have a severe impact on a driver's health due to the presence of low-frequency vibrations caused by uneven road surfaces. This paper presents a novel biodynamic system modelling method for investigating how the human body responds to low-frequency vibrations. The lumped biodynamic parameter model predicts time-domain head acceleration and frequency-domain transmissibility ratio. This paper's design innovation involves a three-dimensional printed cushion composed of honeycomb cells and a seating suspension system featuring six double-diamond isolators. Using the Design of Experiments, Response Surface Method, and Genetic Algorithm methods, the structural parameters of the seating suspension system and cushion in the model are optimized for the minimum peak transmissibility ratio. The uniqueness of this paper's approach lies in its sensitivity analysis and optimization of the seat cushion and seating suspension system design parameters within a quarter-vehicle suspension system environment, which sets it apart from other literature. Furthermore, this paper explores the connection between the negative Poisson's ratio and quasi-zero stiffness as a means of reducing vibration transmission.
1. Introduction
With vehicles now a fundamental aspect of modern life, enhancing the vibration isolation capability of vehicle seats has emerged as a critical research avenue.
Adam et al. (Adam et al., 2020) presented the effect of sitting posture on the vibration transmissibility of the seat suspension system of an agricultural tractor. The dynamic characteristics of the seat, the input vibration, and the dynamic characteristics of the human body, and other factors affected the vibration amplitude of the passenger in the seat suspension. Eleven subjects took part in the tests for the study where they performed the tests in the suspension system in four different postures ‘relaxed’, ‘slack’, ‘tense’, and ‘with back support’. The vertical random vibration frequency of the tests was identified in the range of 1–20 Hz. Studies have shown that there are three distinct peaks in the transmissibility of the seat system, and the main resonance frequency of each of the sitting postures is 1.75–2.5 Hz. The results of the study show that changes in posture and excitation amplitude affect the vibration transfer through the suspension system, indicating a nonlinear effect of the interaction between the human body and the suspension system. However, the design parameter sensitivity analysis and optimization have not been done. If the design of the seating suspension cushion system is optimized through the Design of Experiments (DOE) or machine learning, a lower transmissibility ratio will be obtained.
Zhang et al. (Zhang et al., 2021) studied the effect of foam thickness at the seat panel and backrest on the vibration transmissibility of a seat in the direction of back and forth. In this study, 12 subjects were tested with or without a vertical backrest. Subjects were exposed to random back-and-forth vibrations with an amplitude of 0.5 ms−2 r.m.s and a frequency between 1 and 15 Hz. The test results found that there is no significant difference in the vibration transmissibility amplitude in the main resonance frequency in the directions of the front-to-back, vertical and transverse axes of the seat pan and backrest. Moreover, the resonant transmissibility amplitude of the seat pans and the backrest in the front-to-back direction will decrease as the thickness of the foam at the seat pan and the backrest increases. Changing the foam thickness of the seat pan is more effective than changing the foam thickness of the backrest. However, further optimization of the foam material and structural parameters of the seat pan has not been done, which should further reduce the transmissibility.
Maciejewski et al. (Maciejewski et al., 2022) proposed a multi-degree-of-freedom model capable of simulating the biodynamic response of a seated human body. The model consists of a damper and three masses connected by linear springs. The unknown model parameters were identified from the proposed optimization procedure. These optimized model parameters minimized the errors between the numerically simulated and experimentally measured transmissibility amplitudes in the selected frequency range. Although the complexity of the human system was simplified in this study, promising results were obtained for vibration exposure in the x, y, and z directions. The model thus also enabled the modelling and simulation of many issues related to the vibration safety of operators and drivers of working machines. However, the system parameters were not optimized to minimize the peak transmissibility. Similarly, if the response
‘A design for seat cushion and back-supporter using finite element analysis for preventing decubitus ulcer’ by Hunhee Kim et al. (2017).
‘Design and Manufacture of Domestic Sofas with Ergonomic Indices’ by M. Gofrani and H. Noori.
‘Active Suspension of Truck Seat’ by Masaaki Kawana and T. Shimogo (1996).
Comment on ‘Musculoskeletal computational analysis on muscle mechanical characteristics of drivers' lumbar vertebras and legs in different sitting postures’ by Xu Zhang et al. (2021).
This paper applies the RSM method to optimize the combination system of the seat suspension and the seat cushion. The resulting transmissibility values for the seat suspension cushion system optimized by the RSM method are compared with those optimized by the DOE or Taguchi method. The optimization results obtained by the Taguchi method are shown to be superior to those using the RSM method. The 7-degrees of freedom (7-DOF) model is simulated by Matlab to obtain the peak transmissibility results in the two methods. In the DOE Taguchi method, seven system parameters are selected, of which three parameters are from the seat suspension system and four parameters from the seat cushion. These parameters were identified in our previous studies as having a significant impact on transmissibility. However, the optimal combination of these selected parameters, and their sequence of sensitivity to transmissibility, remains unknown. The three selected structural parameters and their specific configuration of the double-diamond isolator of the seat suspension system are illustrated in detail in Appendix A.
2. A new seat suspension system design and its model
A novel seating suspension system design is proposed to have top and bottom panels connected through six double-diamond isolator structures as shown in Figure 1(b) where a seat cushion of honeycomb cells is placed on the top panel as shown in Figure 1(a). (a) The schematic diagram of the honeycomb seat cushion placed on the double-diamond seat suspension structure and (b) CAD model of the seat suspension system design of the six double-diamond structures.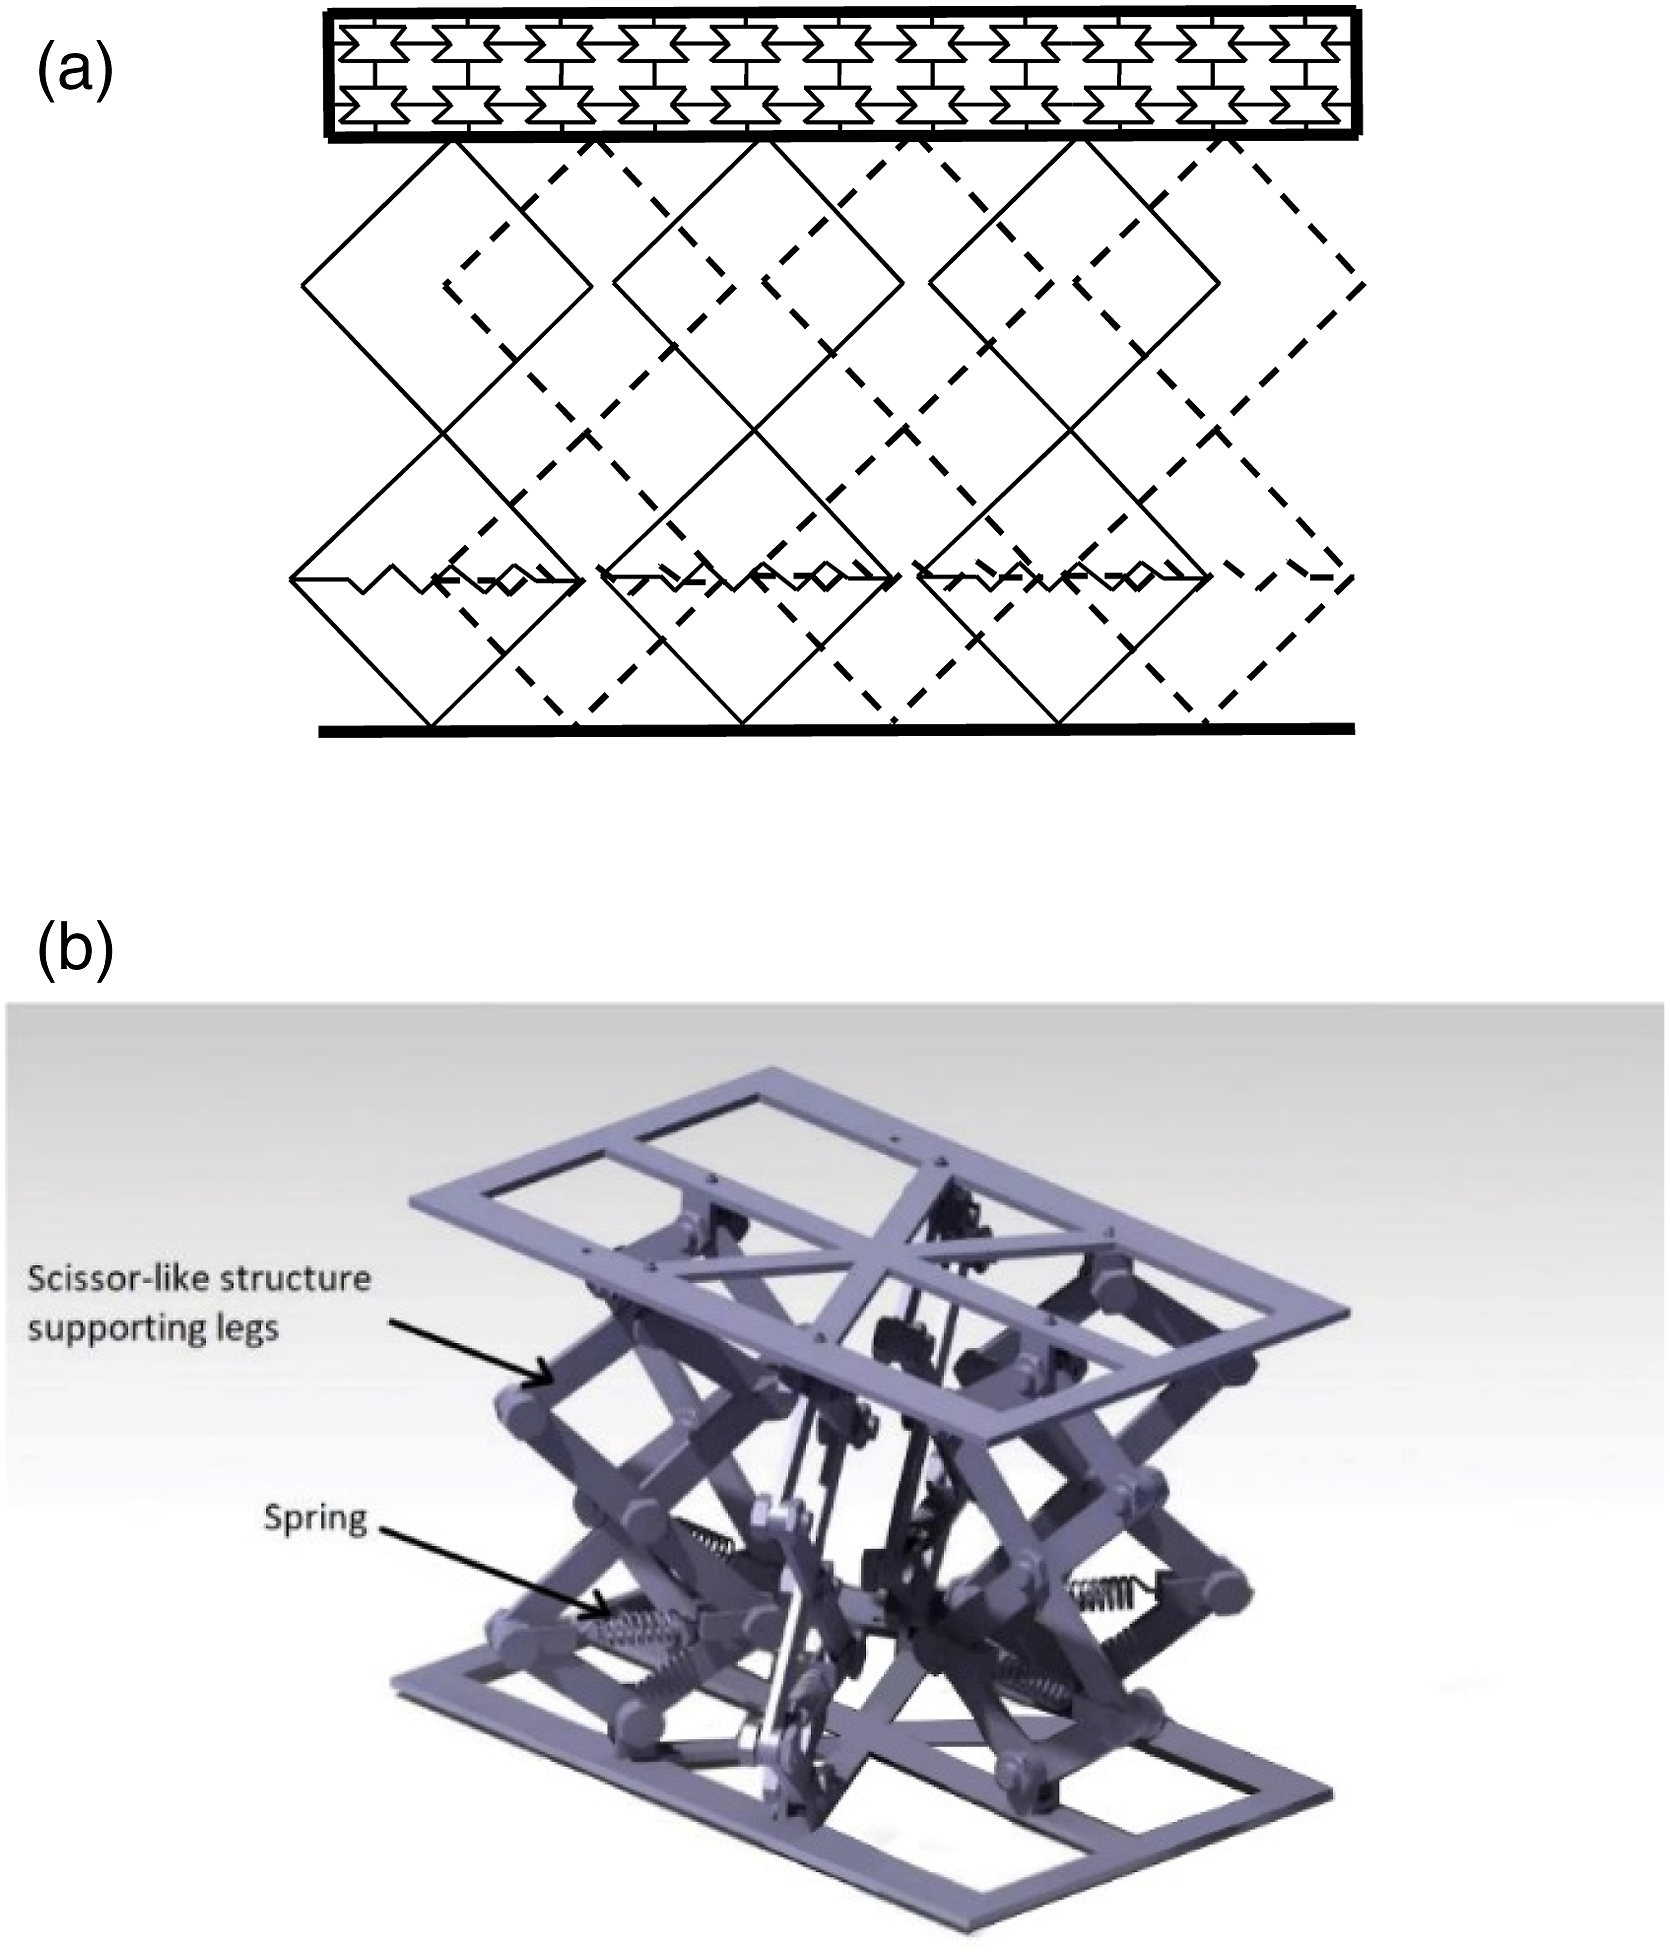
Wang et al. (Wang et al., 2018) simplified a seating suspension system using a 5-DOF lumped parameter mass-spring-dashpot system. In this paper, the 5-DOF lumped parameter system is merged to a quarter-vehicle suspension lumped parameter model to form a 7-DOF lumped parameter vehicle and seat suspension system to study its transmissibility and its sensitivity to the seat design parameters.
3. A 7-DOF lumped parameter vehicle and seat suspension system model and its parameter identification
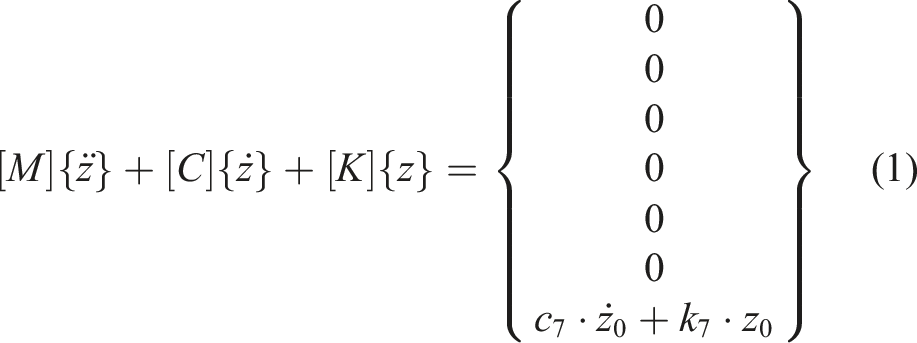
A 7-DOF lumped spring-mass-damper model combining a 5-DOF seat suspension system with a quarter-vehicle suspension system will be used to simulate the vibration transmissibility performance of the seat suspension system in the vertical direction under road excitations. This 7-DOF model can predict the vibration transmissibility performance of the seat suspension system in the vehicle vibration environment. Matlab has been used to simulate and evaluate the vibration transmissibility performance of a vehicle seating suspension system in the frequency-domain. Different design parameters are changed and evaluated for their influences on the vibration transmissibility performance. The transmissibility from the driver's head to the seat base will be calculated separately from these different parameters.
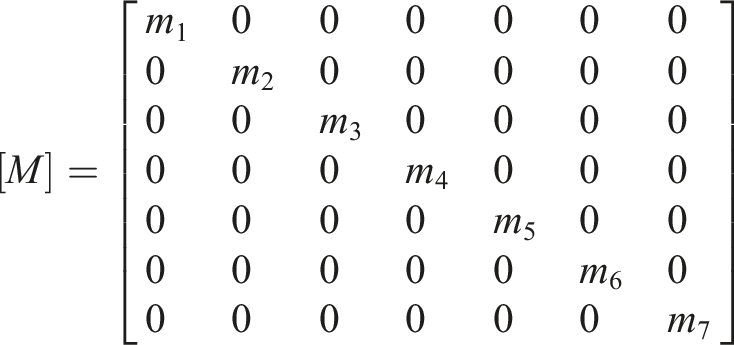
In Figure 2, m1 is the mass of the seat structure and cushion; m2 is the mass of the driver's pelvis; m3 is the mass of the driver's upper body; m4 is the mass of the driver's internal organs; and m5 is the mass of the driver's head. k1 is the seat structure stiffness; k2 is the driver's pelvic stiffness; k2c is the seat cushion stiffness; k3 is the upper torso stiffness; k4 is the visceral stiffness; and k5 is the driver's neck stiffness. c1 is the seat structure damping coefficient; c2c is the seat cushion damping coefficient; c2 is the driver's pelvic damping coefficient; c3 is the driver's upper body damping coefficient; c4 is the driver's visceral damping coefficient; and c5 is the driver's neck damping coefficient. m6 is a quarter of the vehicle mass; k6 is the stiffness of the vehicle suspension spring, and c6 is the damping coefficient of the suspension. In addition, m7 is the mass of the wheel and tyre, k7 is the stiffness of the wheel and tyre, and c7 is the damping coefficient of the wheel and tyre. A 7-DOF lumped spring-mass-dashpot parameter model consisting of the human body, seat, and vehicle chassis suspension (Zhao et al., 2021a).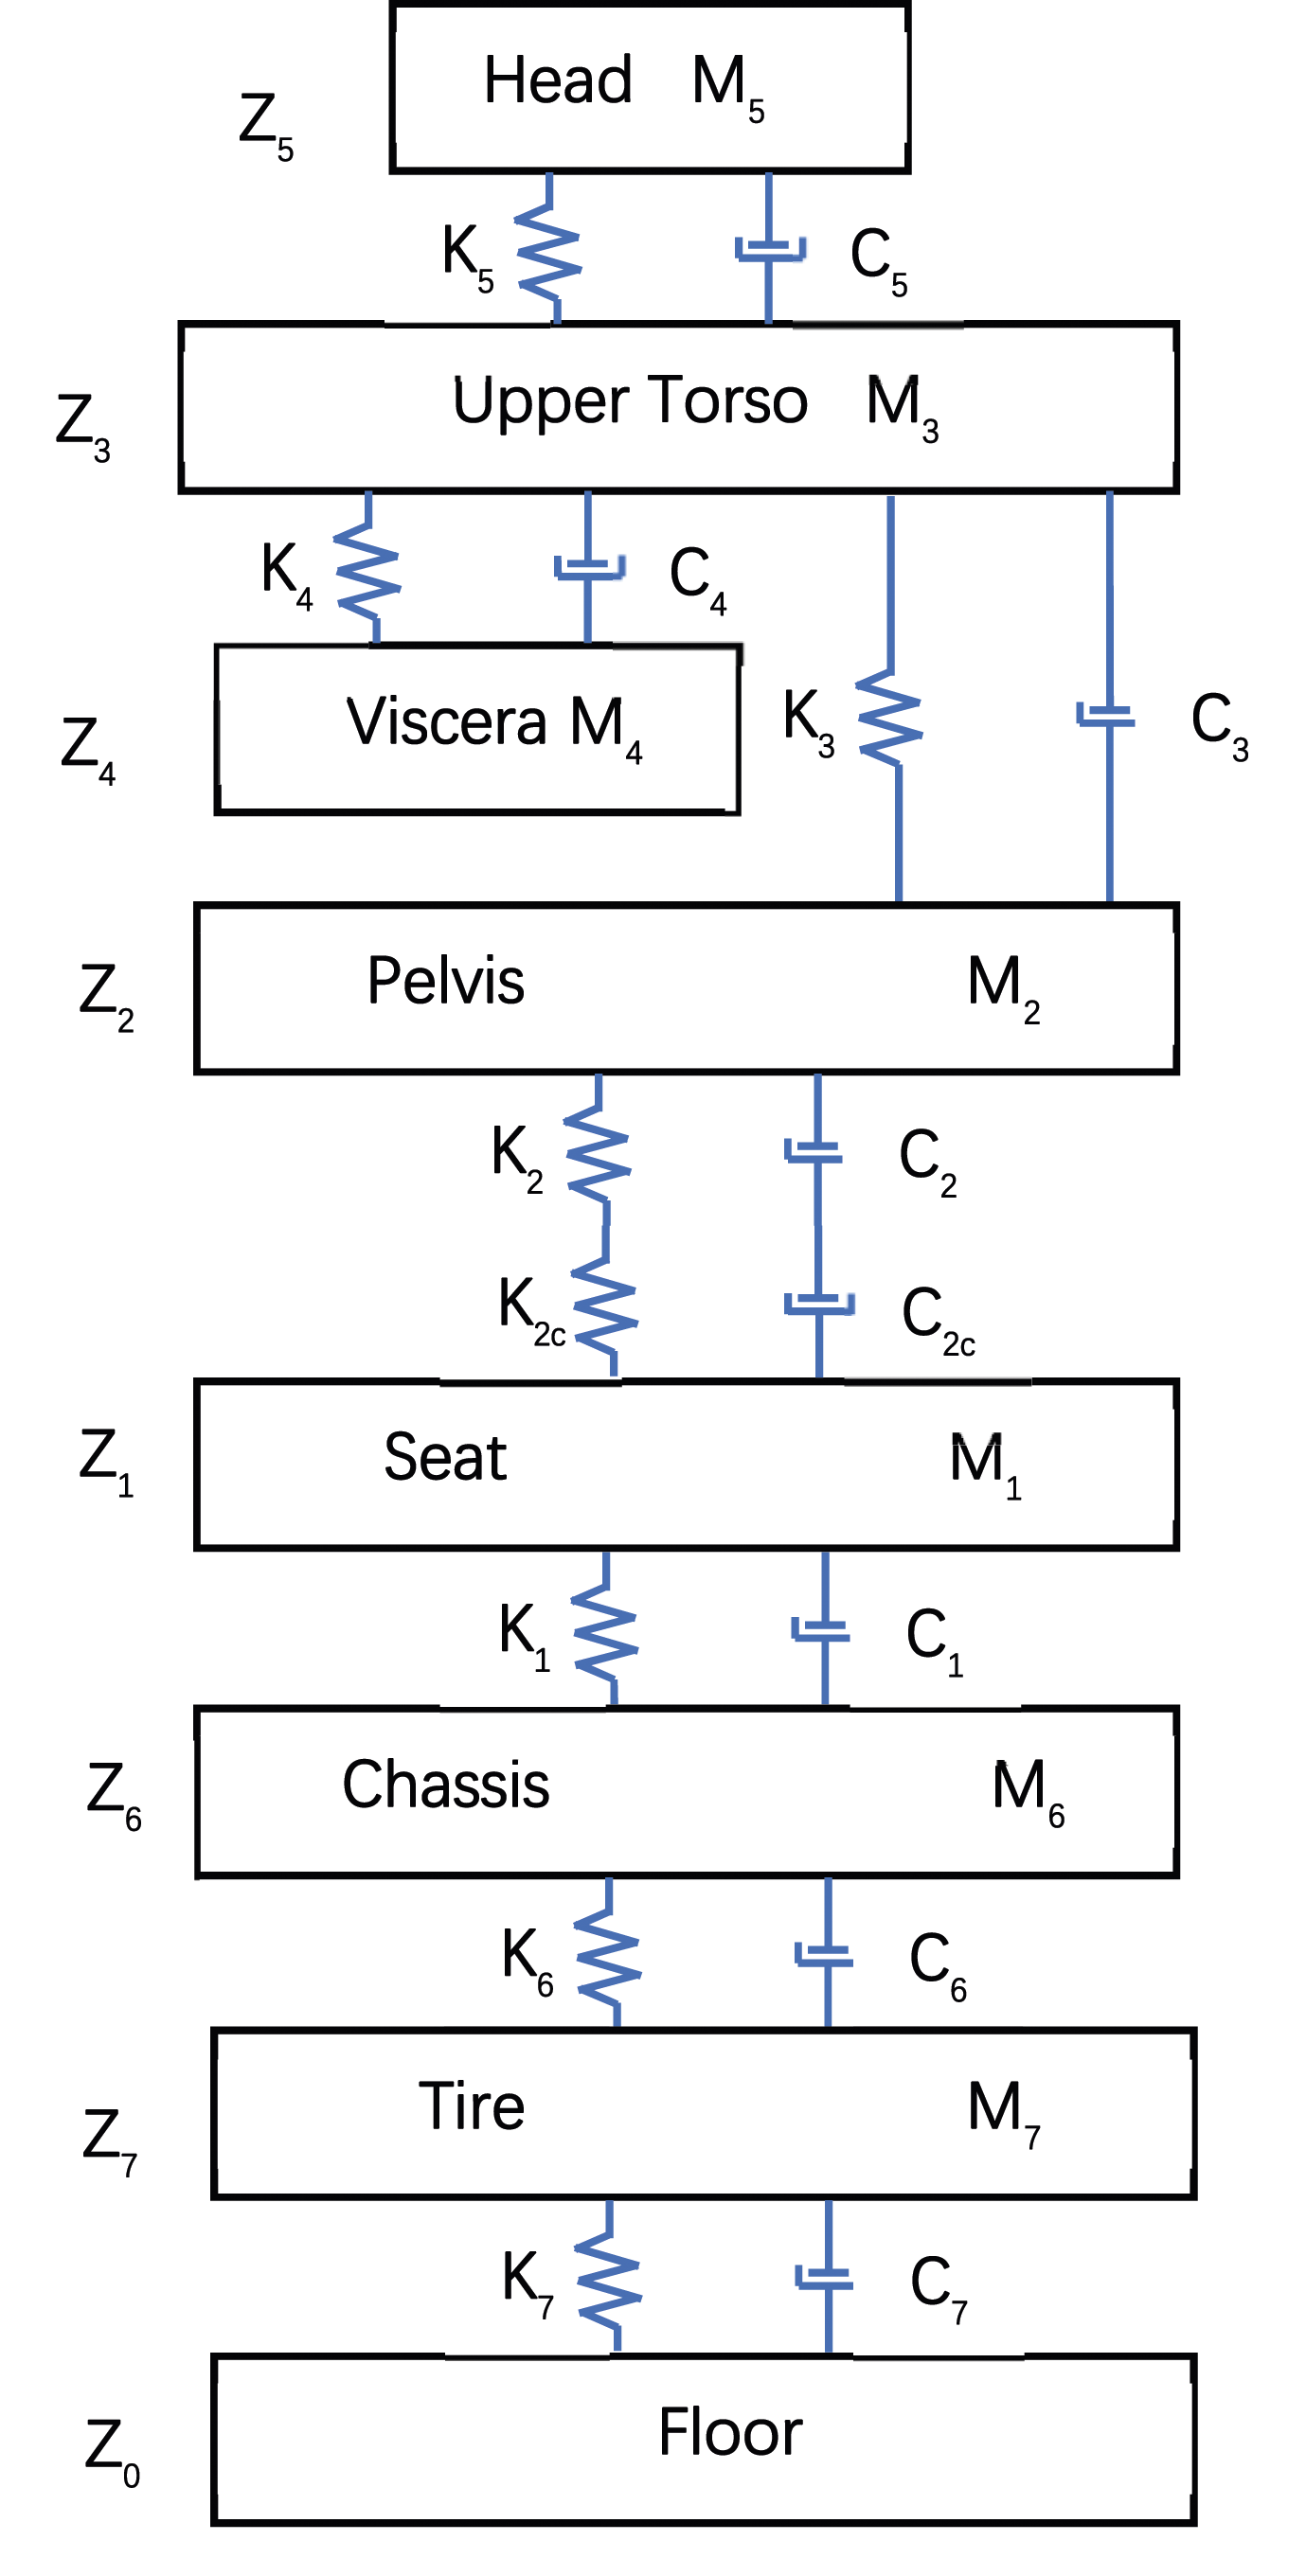
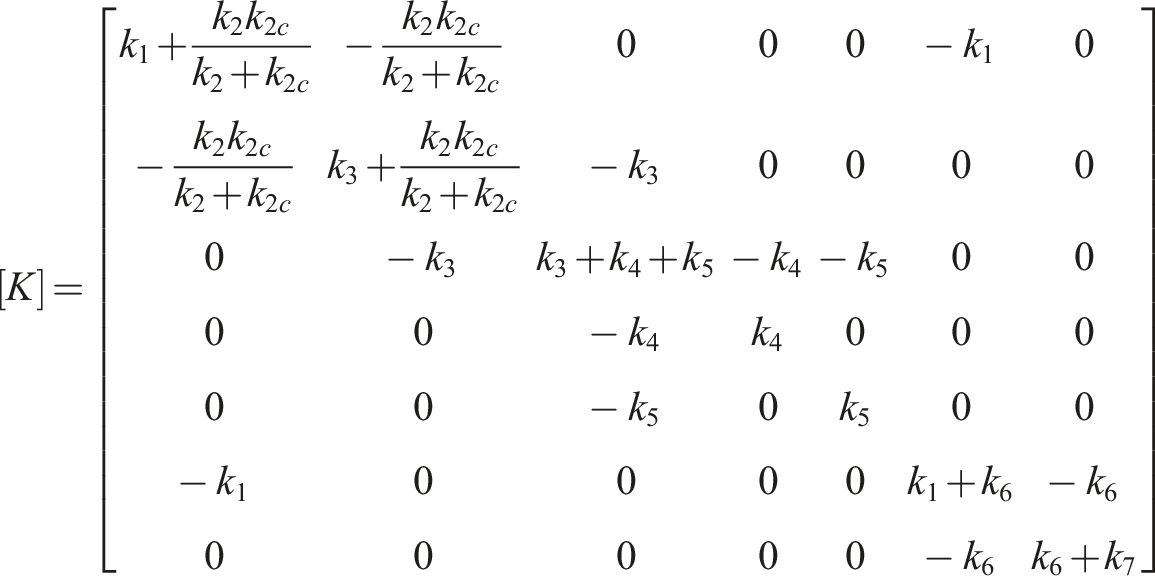
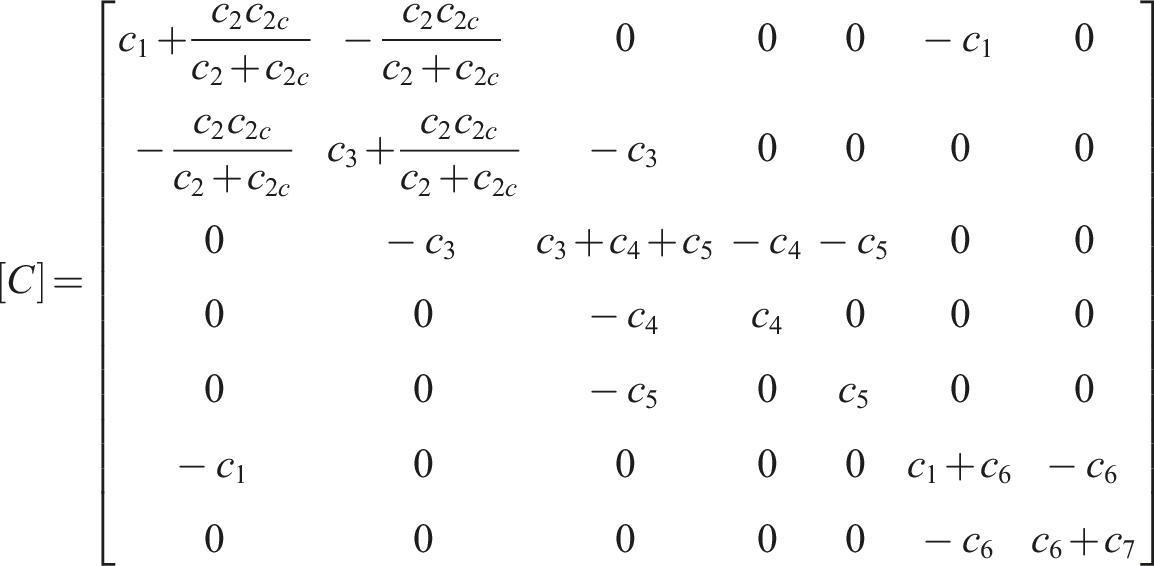
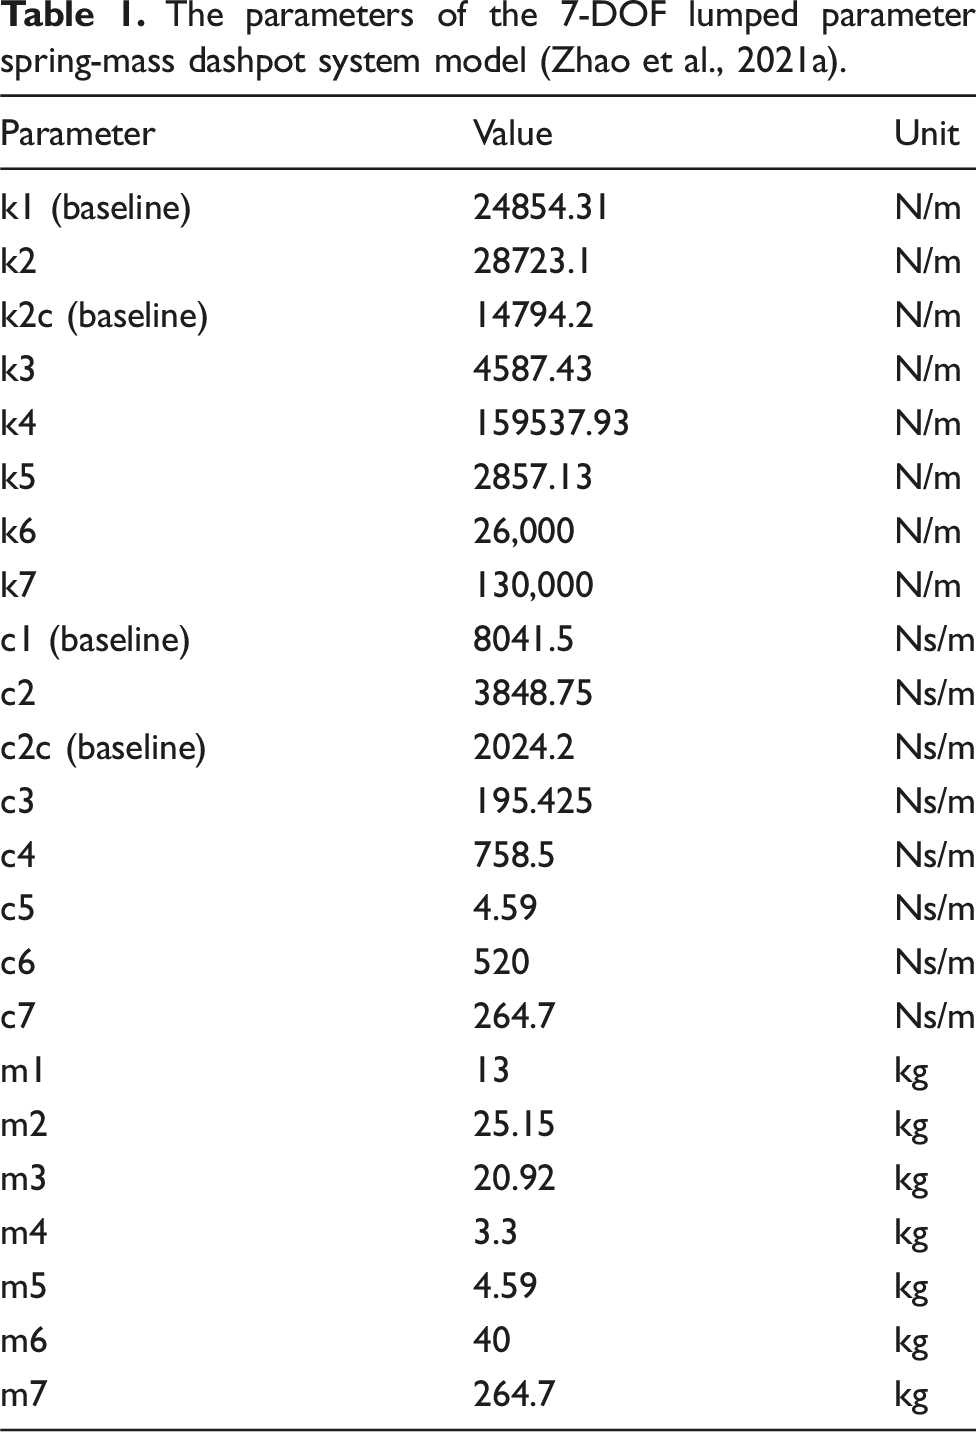
The parameters of the 7-DOF lumped parameter spring-mass dashpot system model (Zhao et al., 2021a).
Fourier transform is applied to Equation (1), which gives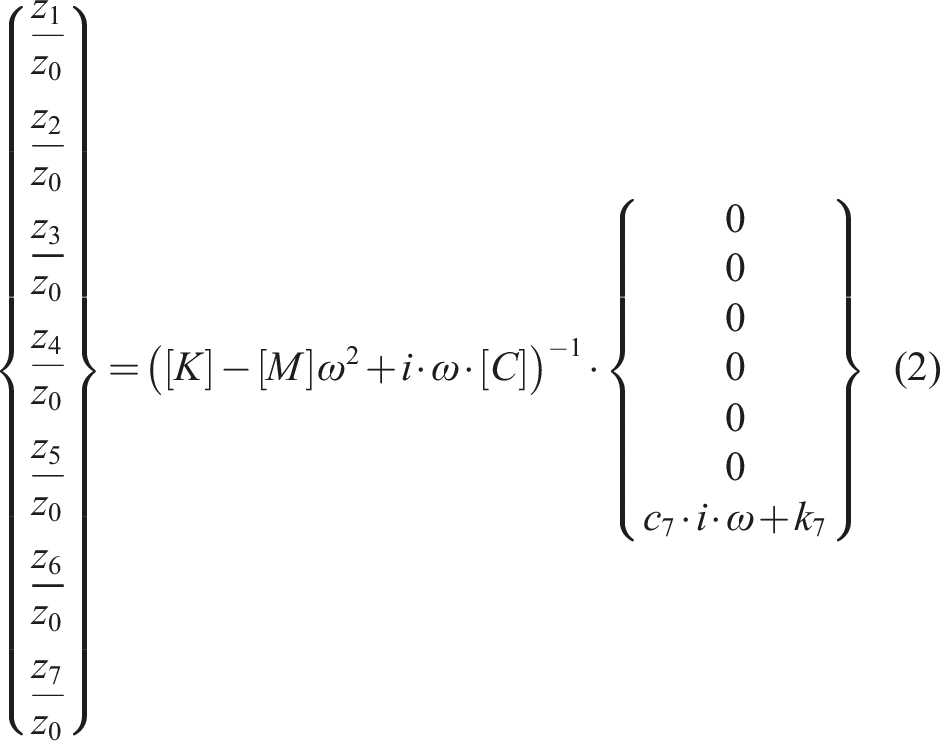
The transmissibility ratios of the seven lumped mass points in the model (z1/z0, z2/z0, z3/z0, z4/z0, z5/z0, z6/z0, and z7/z0) can be calculated from Equation (2), where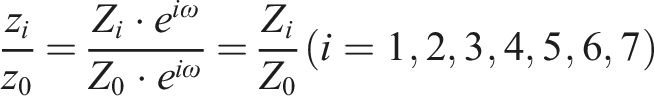
For detailed derivation, please see the dynamic equation derivation in Ref. Zhao et al., 2021a; Wang et al., 2018.
By applying the 7-DOF lumped parameter mass-spring-damper system parameters in Table 1 of (Zhao et al., 2021b) to Equation (2), The amplitude of the ratio Z5/Z0 can be calculated and plotted in a blue curve in Figure 3, where the first peak frequency is determined to be 1.39 Hz and the peak amplitude value is determined to be –16.8276 (dB). Figure 3 shows the baseline peak transmissibility amplitude in a blue curve at 3.98 Hz is –14.1768 dB. Figure 3 has two mode peaks instead of three because the head displacement response may happen to be the node of the third resonance mode. The transmissibility is negative because the displacement transmissibility ratio in Figure 3 is on a logarithmic scale and the ratio of the head vibration amplitude over the floor vibration amplitude is less than 1. In other words, the head vibration amplitude is less than the floor vibration amplitude. The peak transmissibility amplitude from the floor to the head at 4 Hz is selected as the target response to be studied. The first resonant peak frequency is close to the natural resonant frequency of the vehicle suspension bounce mode. The second resonant peak frequency is close to the natural resonant frequency (4 Hz) of the human body of the driver. The mode peaks in higher frequencies do not show. This may be because the damping coefficients of the seat suspension system and the human body of the driver are much larger than those of the vehicle suspension system. The modes of the seat suspension system in higher frequencies are hidden. Therefore, the vehicle suspension bounce mode determines the ride comfort, which is consistent with common senses and the conclusions in the literature (Zhao et al., 2021a). The second mode peak at 4 Hz is related to the human body mode, which also influences the ride comfort of the human driver. Moreover, the frequency-domain method was validated by the time-domain method in Ref. Zhao et al., 2021a. The floor to seat transmissibility of the baseline and after the Taguchi optimization.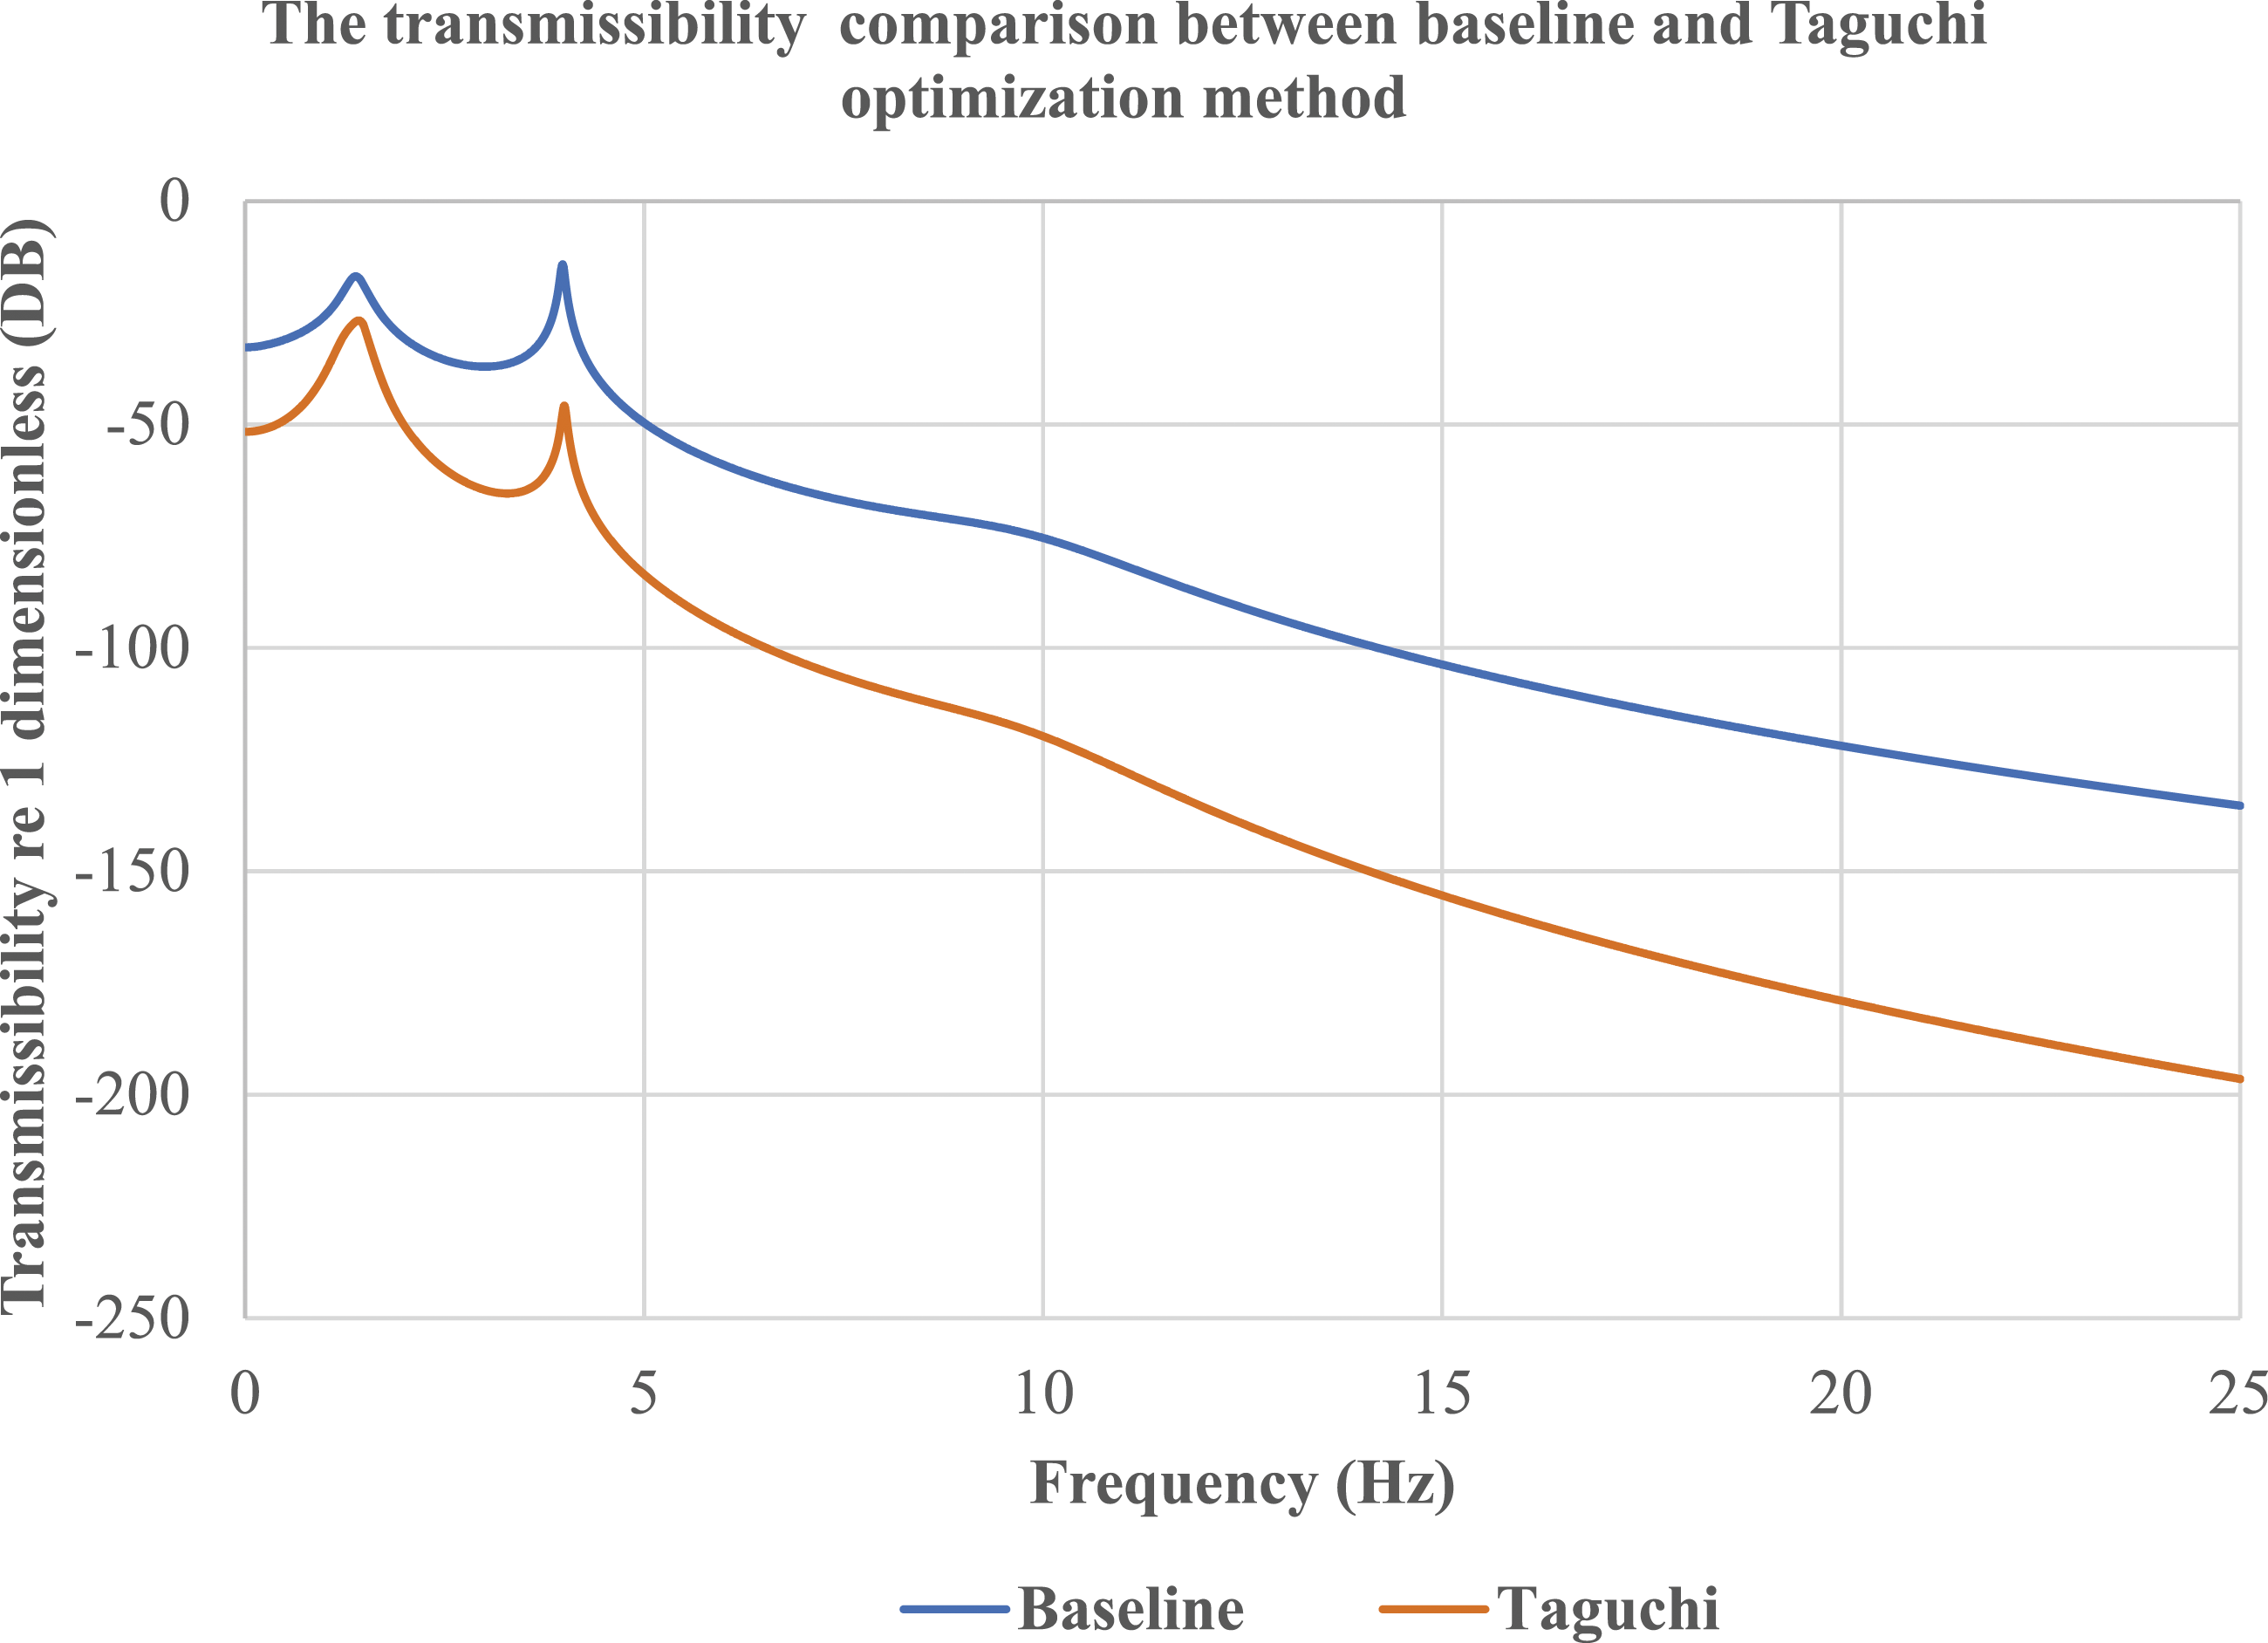
While our model provides significant insights into the dominate effects of the vertical vibrations on the transmissibility and ride comfort of the seated humans, it's essential to recognize its limitations concerning multi-directional vibrations. In real-world scenarios, a seated individual, especially in a moving vehicle, experiences vibrations from various directions—lateral, longitudinal, and even rotational motions. These multi-directional vibrations, when combined, can lead to a different human response than what's predicted by considering vertical vibrations alone. Our model, in its current form, does not capture the intricacies of such combined vibrations. As vehicles move through various terrains and encounter different obstacles, the influence of these multi-directional vibrations becomes increasingly pronounced. Hence, while our findings offer valuable information about the vertical vibrations, a holistic understanding would necessitate a more comprehensive model that accounts for vibrations from all directions, which will be our future work.
4. Predictive modelling using the response surface method
4.1. Parameter identification for the seat cushion and seating suspension system
In this paper, it is assumed that Young's modulus and damping loss factor of the Honeycomb seat cushion are the same as those of a single Honeycomb cell according to Guo et al., 2023. The formula for calculating the stiffness of the seat cushion is given by

In the DOE Taguchi method and RSM modelling, the parameters k2c, c2c k1, and c1, in Table 1 are the baseline values. The seat cushion stiffness k2c and damping coefficient c2c change with the cushion honeycomb structural parameters. In this case, changes of k 2c and c 2c are not identified from the vibration test data of the running vehicles using the genetic algorithm (GA) (Zhao et al., 2021a), but are calculated by Equations (3) and (4). The seat stiffness k1 and damping coefficient c1 change with the double-diamond structural parameters of the seat suspension.
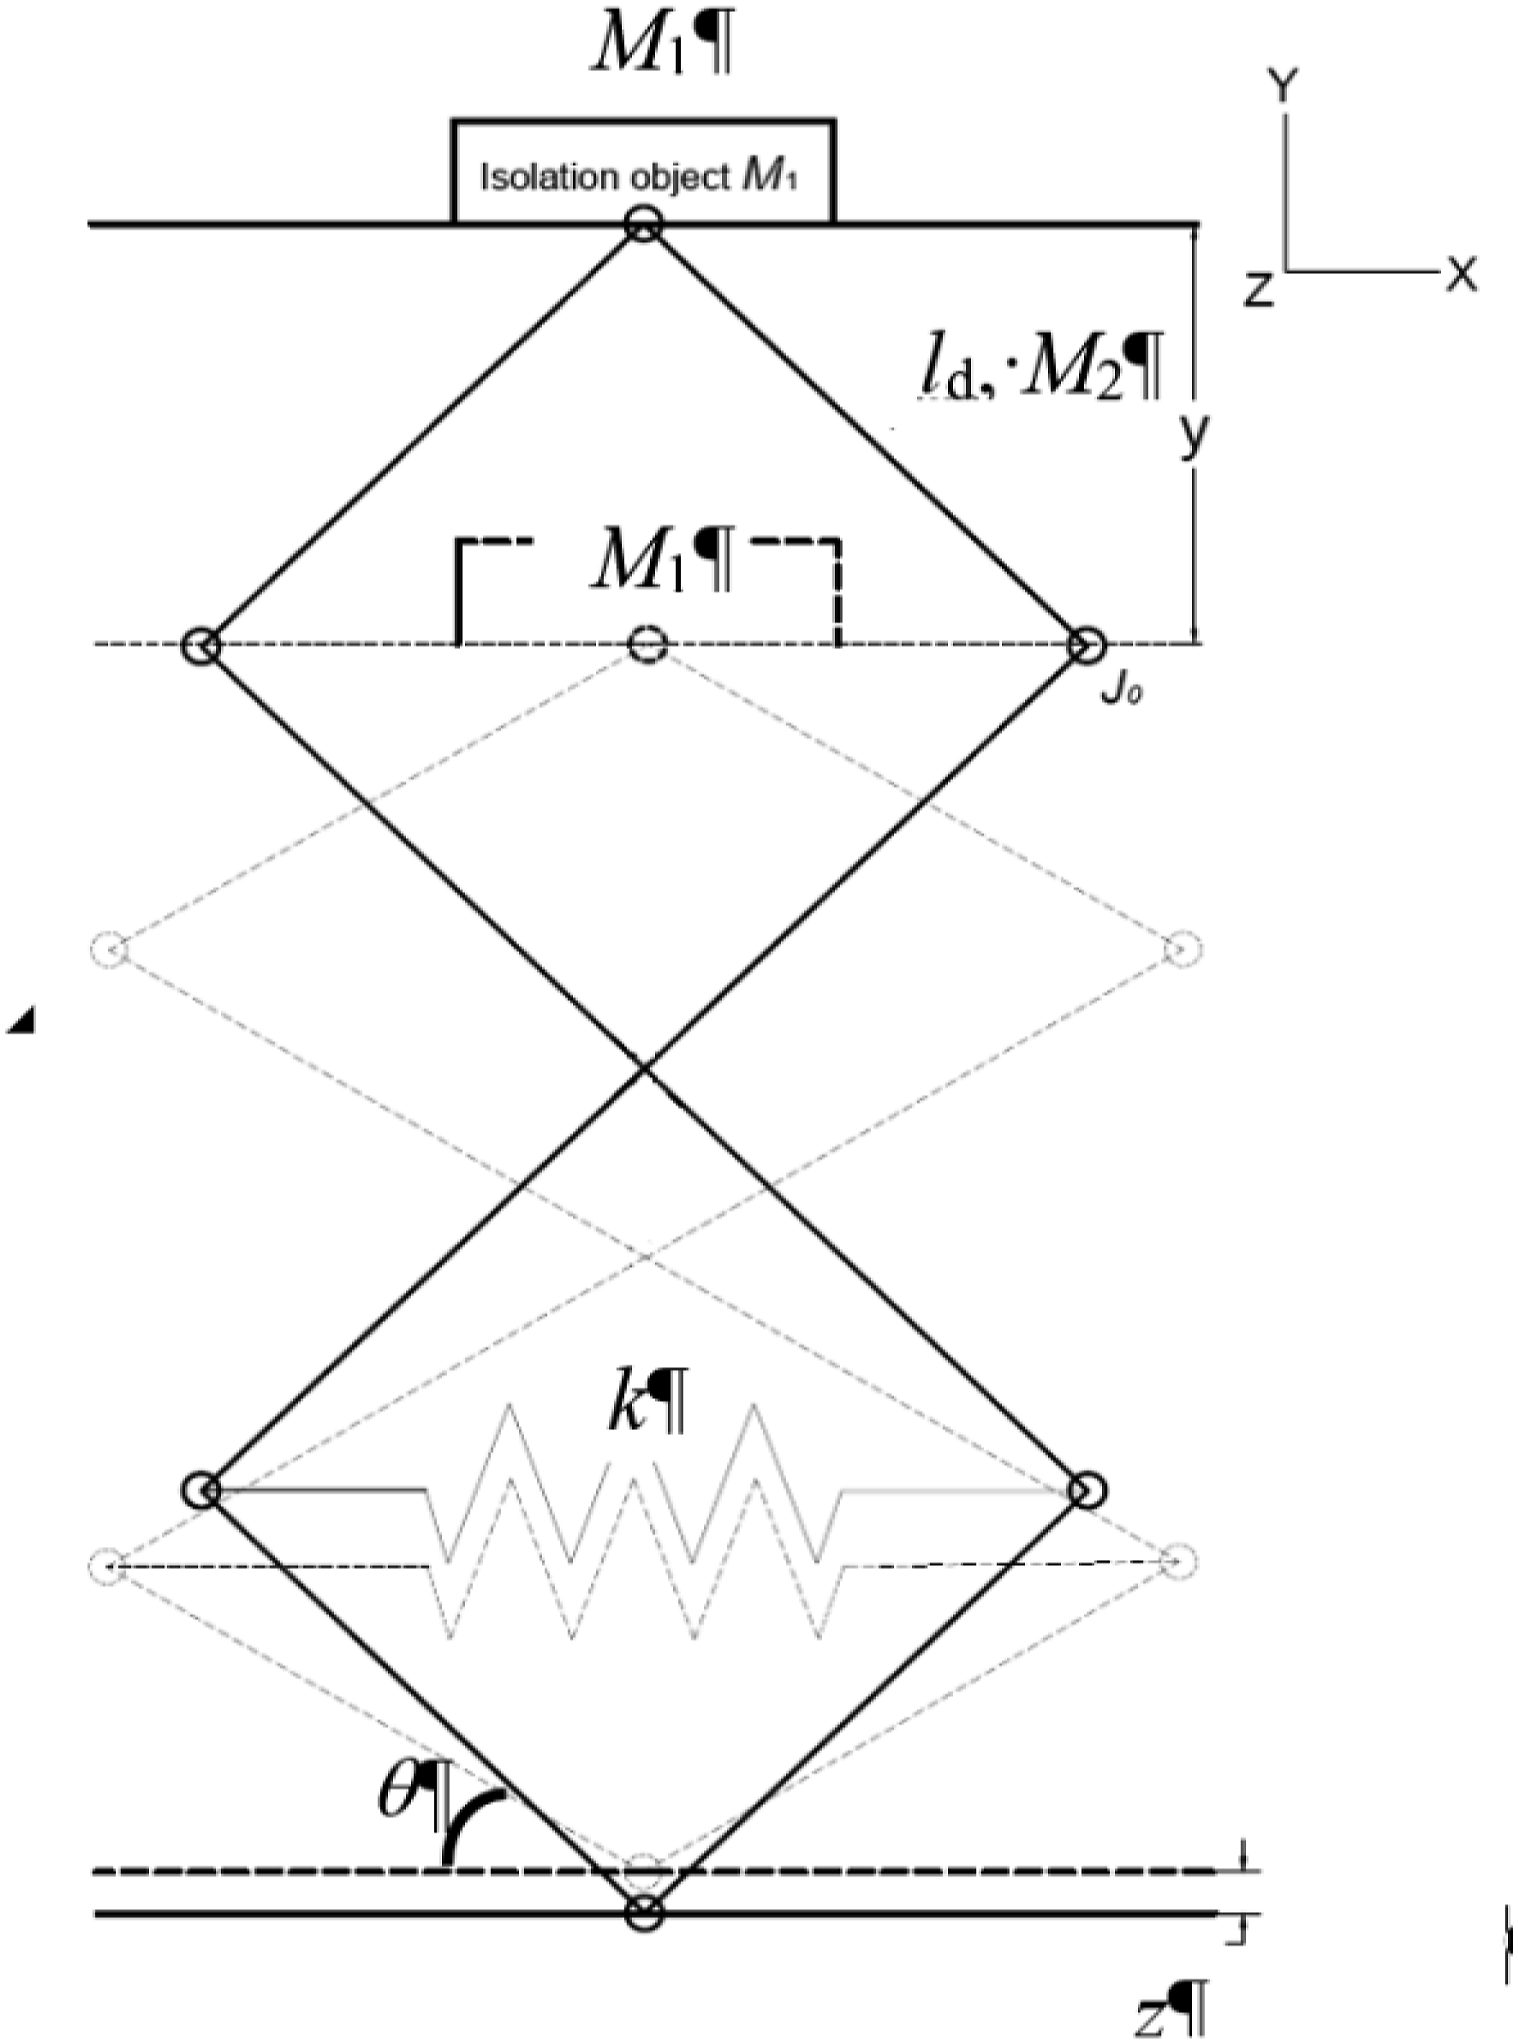
If the six double-diamond isolator structures as shown in Figure 1 are used as the suspension structure of the seat, the seat stiffness of the six double-diamond isolator structures in parallel is calculated according to Equation (A6) in Appendix A multiplying a six and given by A double-diamond isolator structure.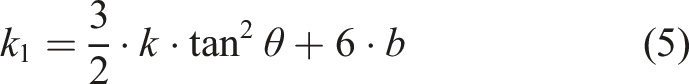
The seat damping coefficient of the six double-diamond isolator structures in parallel is calculated according to Equation (A7) in Appendix A multiplying a six and given by
The non-baseline seat stiffness k1 and damping coefficient c1 are not identified from the vibration test data of the running vehicles using the genetic algorithm (Zhao et al., 2021a) but are calculated by Equations (5) and (6) and are six times of the stiffness and damping coefficient of a single double-diamond isolator structure
The change of the cushion honeycomb cell structural parameters will lead to the change of Young's modulus of the cushion of the honeycomb structure, which will lead to the change of the value of k 2c . The change of the double-diamond seat suspension isolator structural parameters will lead to the change of the seat stiffness k1 and seat damping coefficient c1. The changes in the structural parameters of the cushion honeycomb cell and double-diamond seat suspension will also lead to changes in the peak transmissibility amplitude of the seating suspension system in the vehicle suspension model.
In the following sections, the peak transmissibility amplitude at 4 Hz will be related to the structural parameters of the cushion honeycomb cell and double-diamond seat suspension isolator using the RSM method and Taguchi method. The peak transmissibility amplitude at 4 Hz will be predicted from the structural parameters of the cushion honeycomb cell and double-diamond seat suspension isolator using the RSM model. The structural parameters of the cushion honeycomb cell and double-diamond seat suspension isolator will be optimized for the minimum peak transmissibility amplitude at 4 Hz using the RSM and Taguchi modelling, leading to the best vibration isolation performance.
4.2. Predictive modelling for the peak transmissibility amplitude of the 7-DOF system with the seat cushion of the honeycomb structure using RSM
In order to improve the vibration isolation performance of the seat cushion, an RSM model was established to predict the peak transmissibility amplitude of the 7-DOF system with the seat cushion of the honeycomb structure from different input structural parameters. The design optimization aims to find the best parameter combination for the minimum peak transmissibility amplitude that the system can achieve within the specific ranges given for four sets of input parameters.
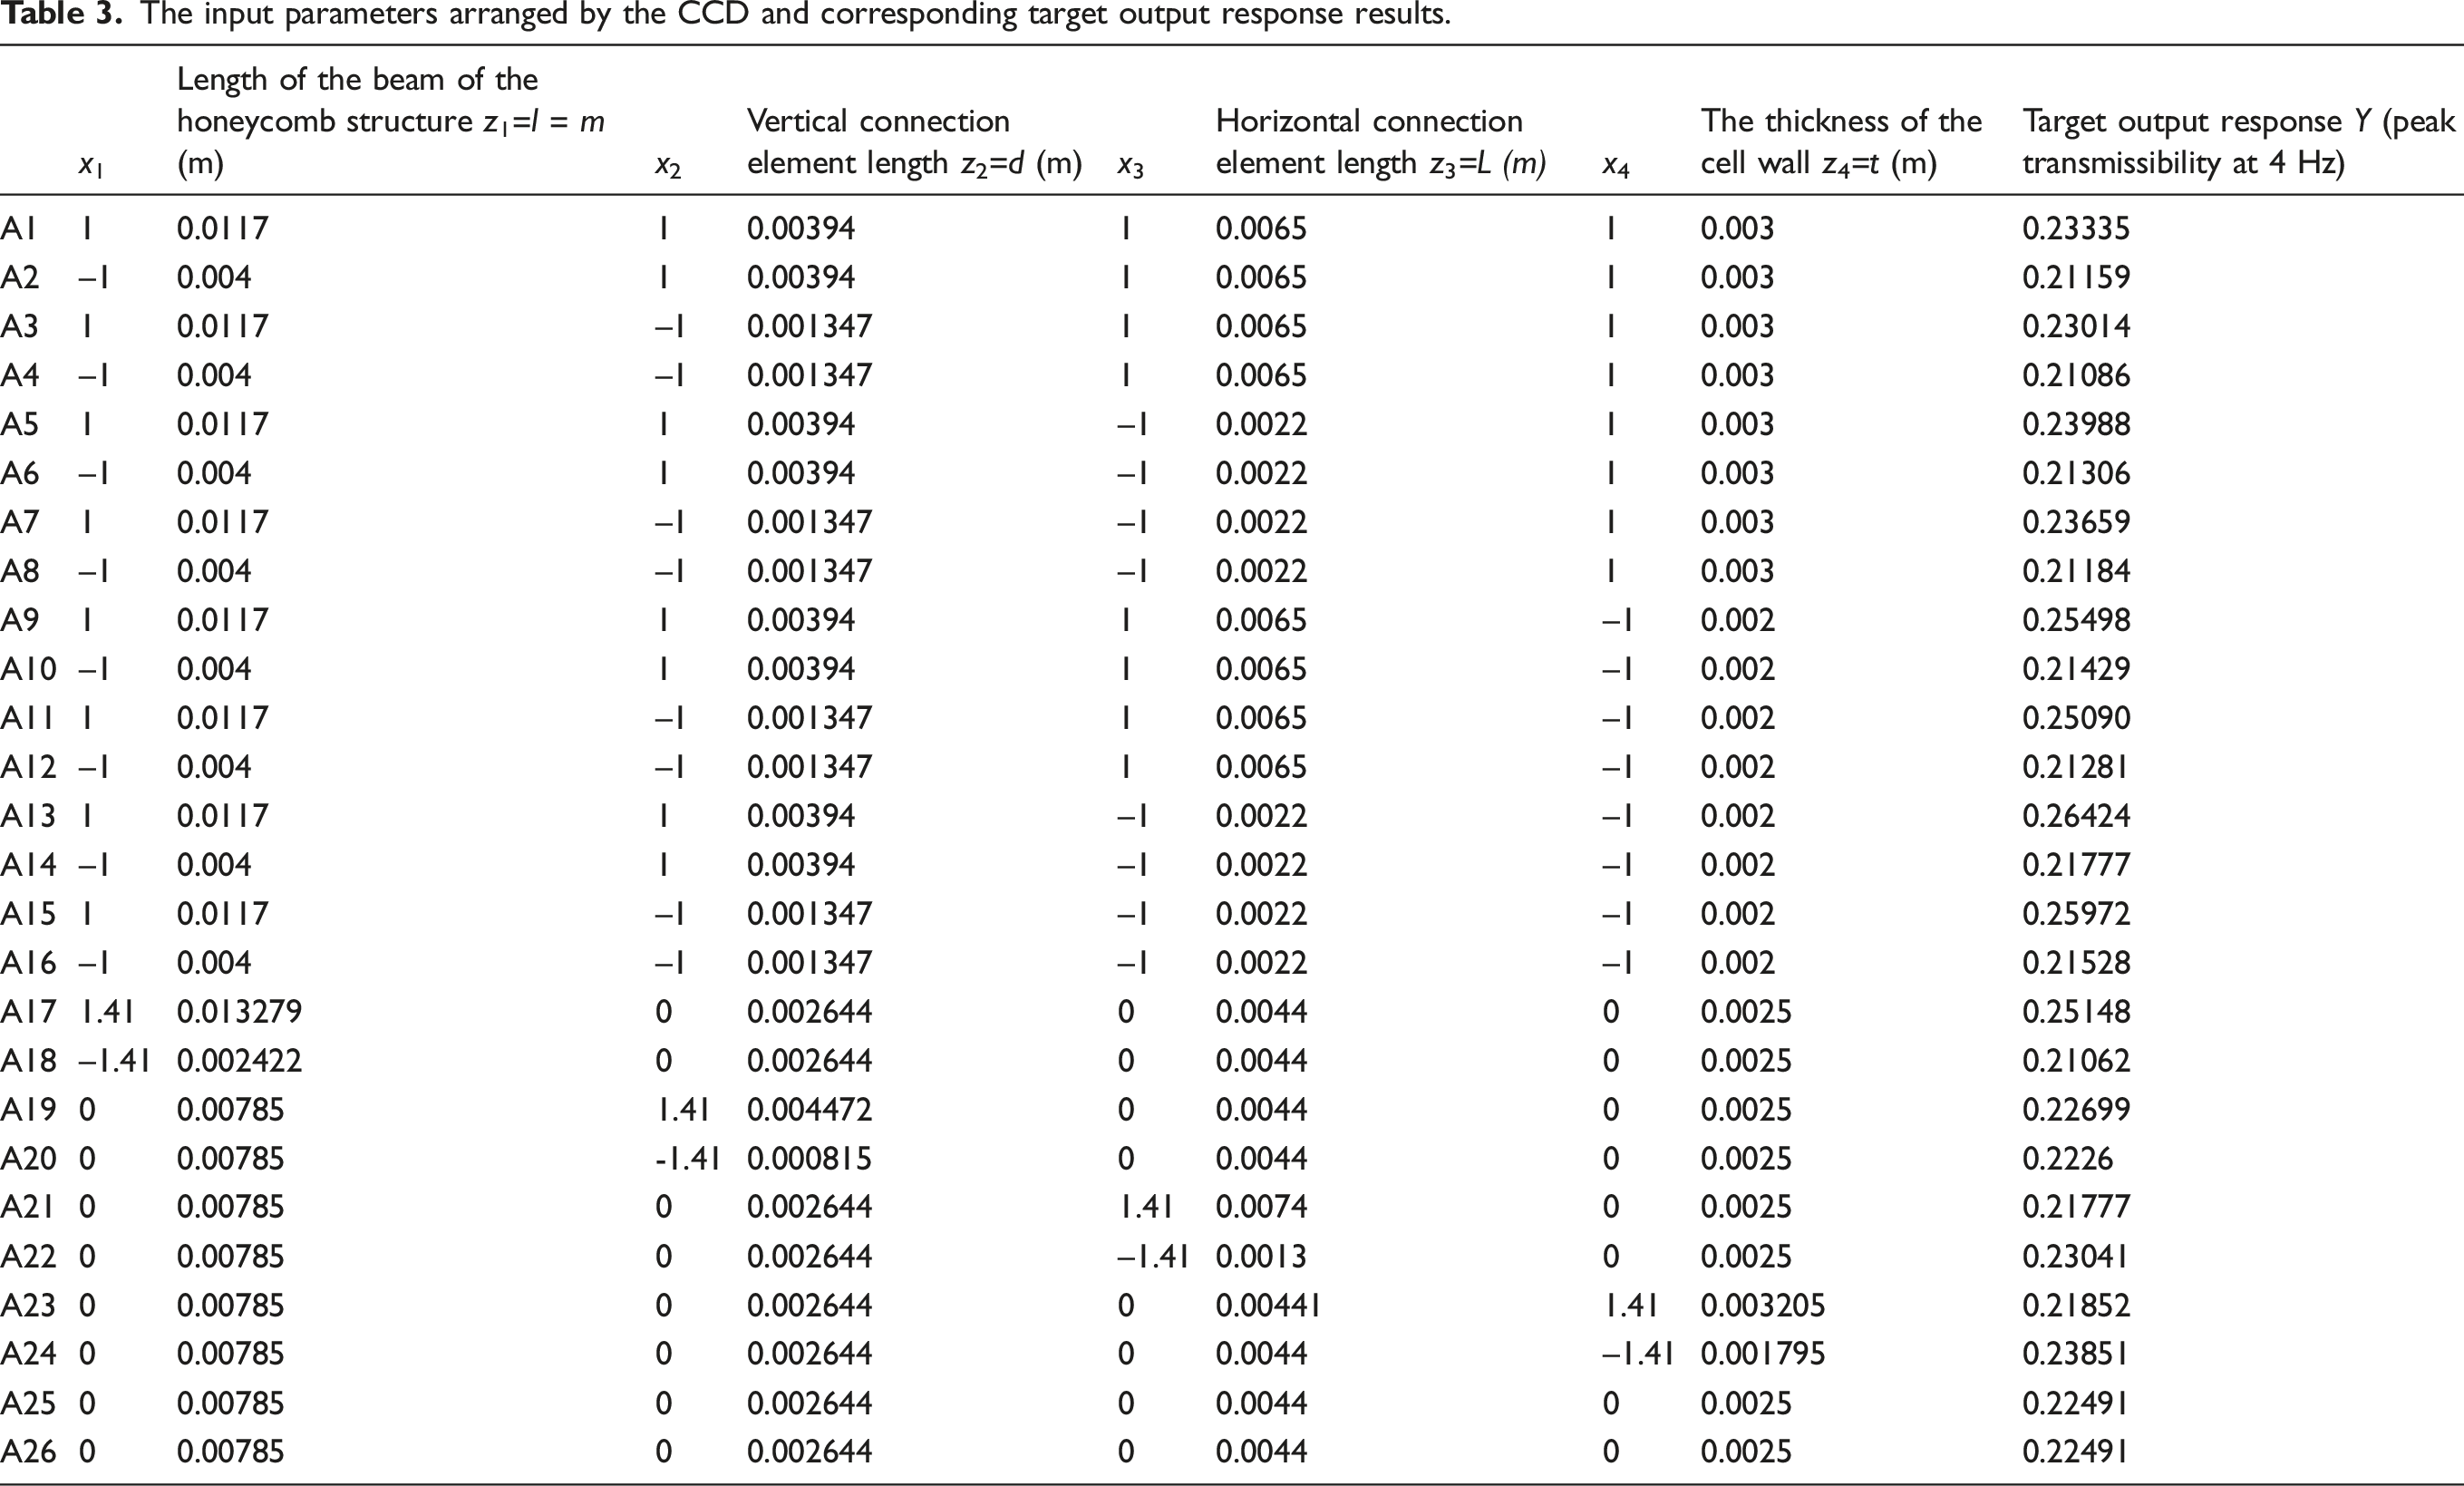
In this paper, the central compositional experimental design (CCD) has been used to arrange the input parameters.
As shown in Figure 5, l and m, the length of the beam of the honeycomb structure cell (z1), d, the vertical connection element length between each structure cell (z2), L, the horizontal connection element length of each structure cell (z3), and the thickness of the cell wall t (z4) are selected as input parameters for the RSM model. These four parameters have synergistic effects on the response target of the peak transmissibility amplitude at 4 Hz. The length of the beam of the honeycomb structure z1=l=m is changed in the range from 0.004 m to 0.0117 m, whereas the connection beam between each cell structure z2=d is changed in the range from 0.00254359 m to 0.00744 m, the horizontal connection element length of each structure cell z3=L is changed from 0.0022 m to 0.0065 m, and the thickness of the cell wall z4=t is changed from 0.002 m to 0.003 m. Table 2 shows the bound setting of the RSM input parameters. Analytical structure model for the honeycomb structure cell. The bound setting for the RSM input parameters (Zhang and Wang, 2019).
The uncoded variable zi (i=1-4) can be converted to the coded variable xi (i=1–4) by
The input parameters arranged by the CCD and corresponding target output response results.
Based on the validated analytical model of Equation (2), the target output response 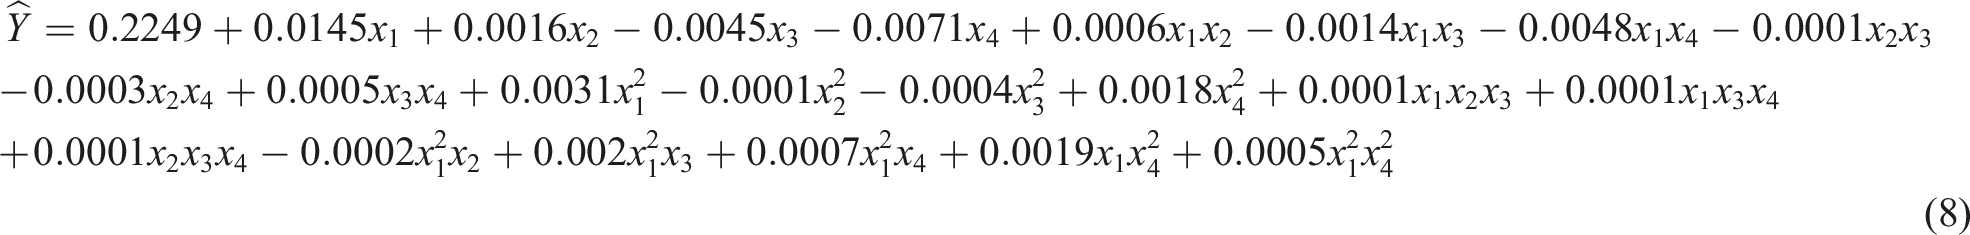
It can be seen from Equation (8) that the coefficient of x
1
has the largest absolute value of +0.0145, which means that x
1
of the length l and m of the beam of the honeycomb structure cell has the largest influence on the peak transmissibility amplitude; decreasing the length will decrease the transmissibility amplitude. The coefficient of x
4
has the second-largest absolute value (–0.0071), which means that x
4
of the thickness t of the cell wall has the second-largest influence on the peak transmissibility amplitude; increasing the thickness will decrease the transmissibility ratio. The coefficient of x
3
has the third-largest absolute value (–0.0045), which means that the horizontal connection element length L (x3) between the two adjacent structure cells has the third-largest influence on the peak transmissibility amplitude. Increasing the length will decrease the peak transmissibility amplitude. It is seen from Equation (8) that the coefficient of x
1
is positive, which means decreasing the length of l and m bar will decrease the peak transmissibility amplitude. It is seen from Equation (8) that the coefficient of
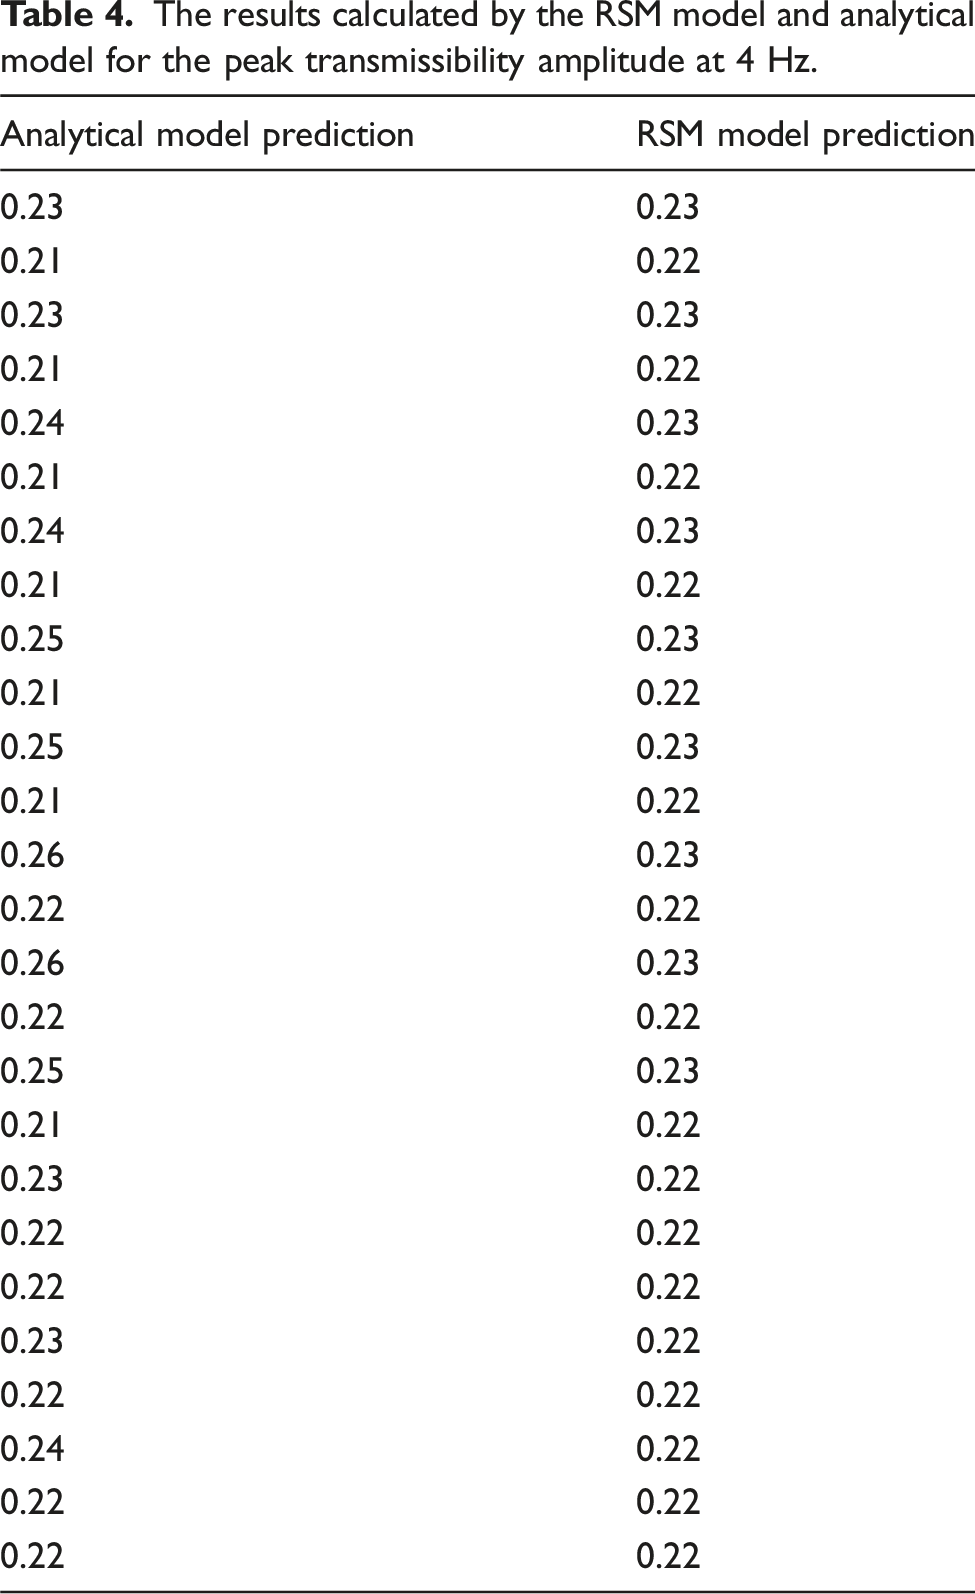
The results calculated by the RSM model and analytical model for the peak transmissibility amplitude at 4 Hz.
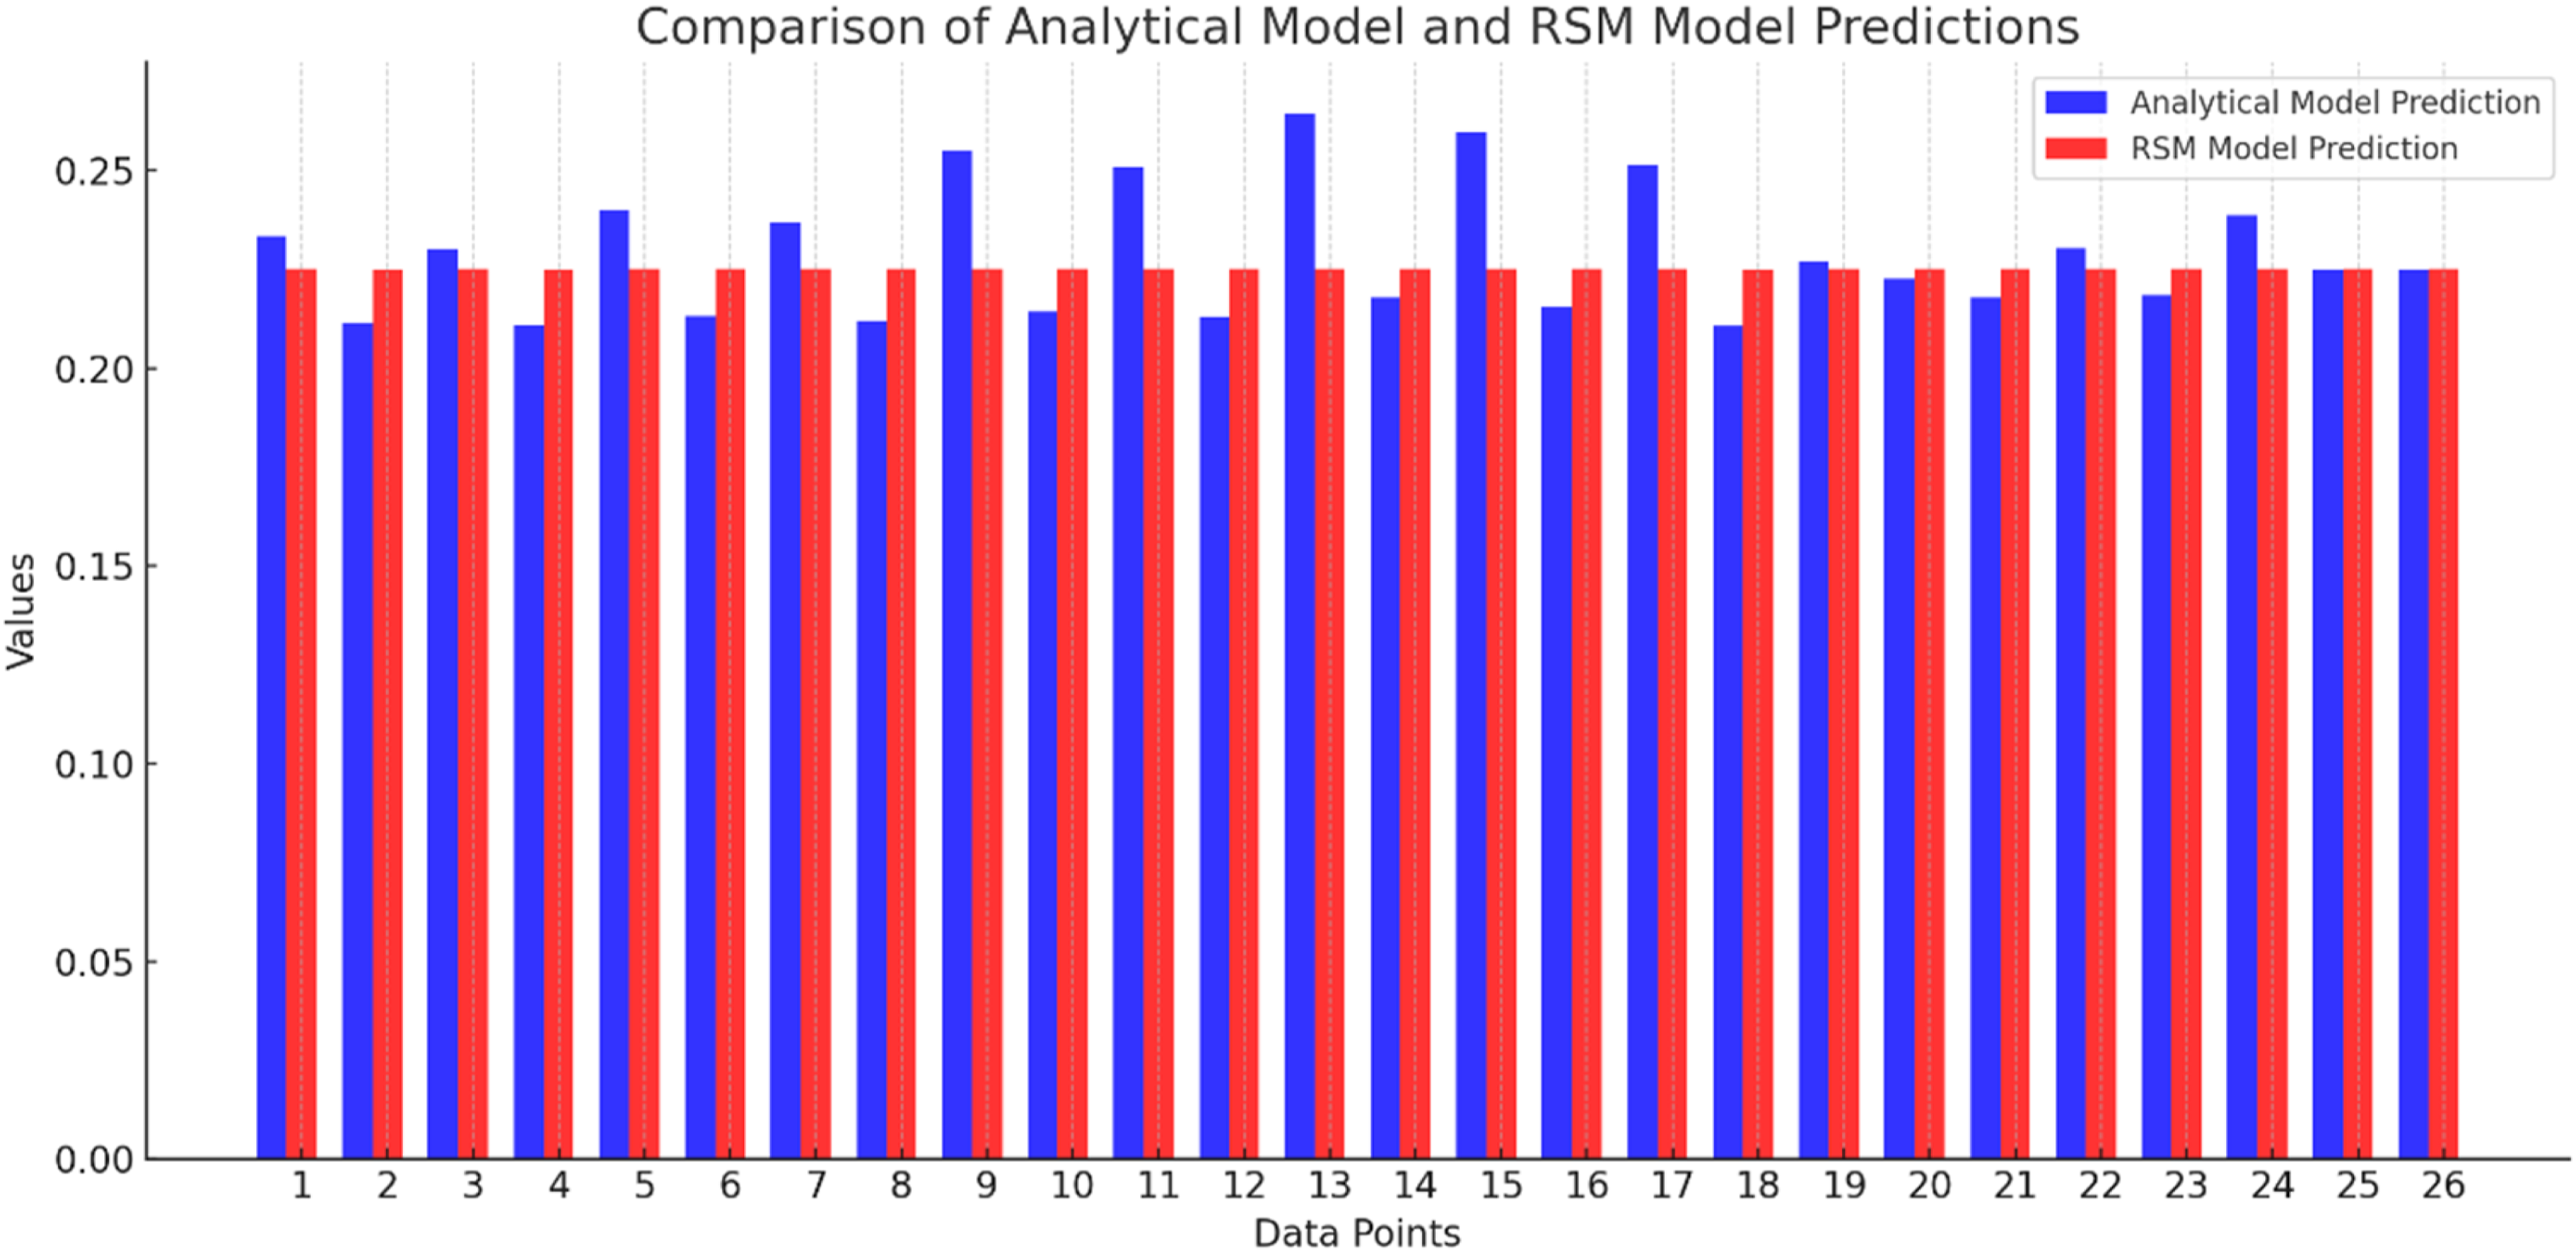
Comparison of the predicted peak transmissibility amplitudes at 4 Hz using the analytical and RSM Models.
The results of the peak transmissibility amplitude at 4 Hz calculated by the RSM model and analytical model are listed in Table 4. The differences of the results calculated by the RSM model and analytical model are caused by the model accuracy of the RSM model, which will be evaluated by Analysis of Variances (ANOVA) below.
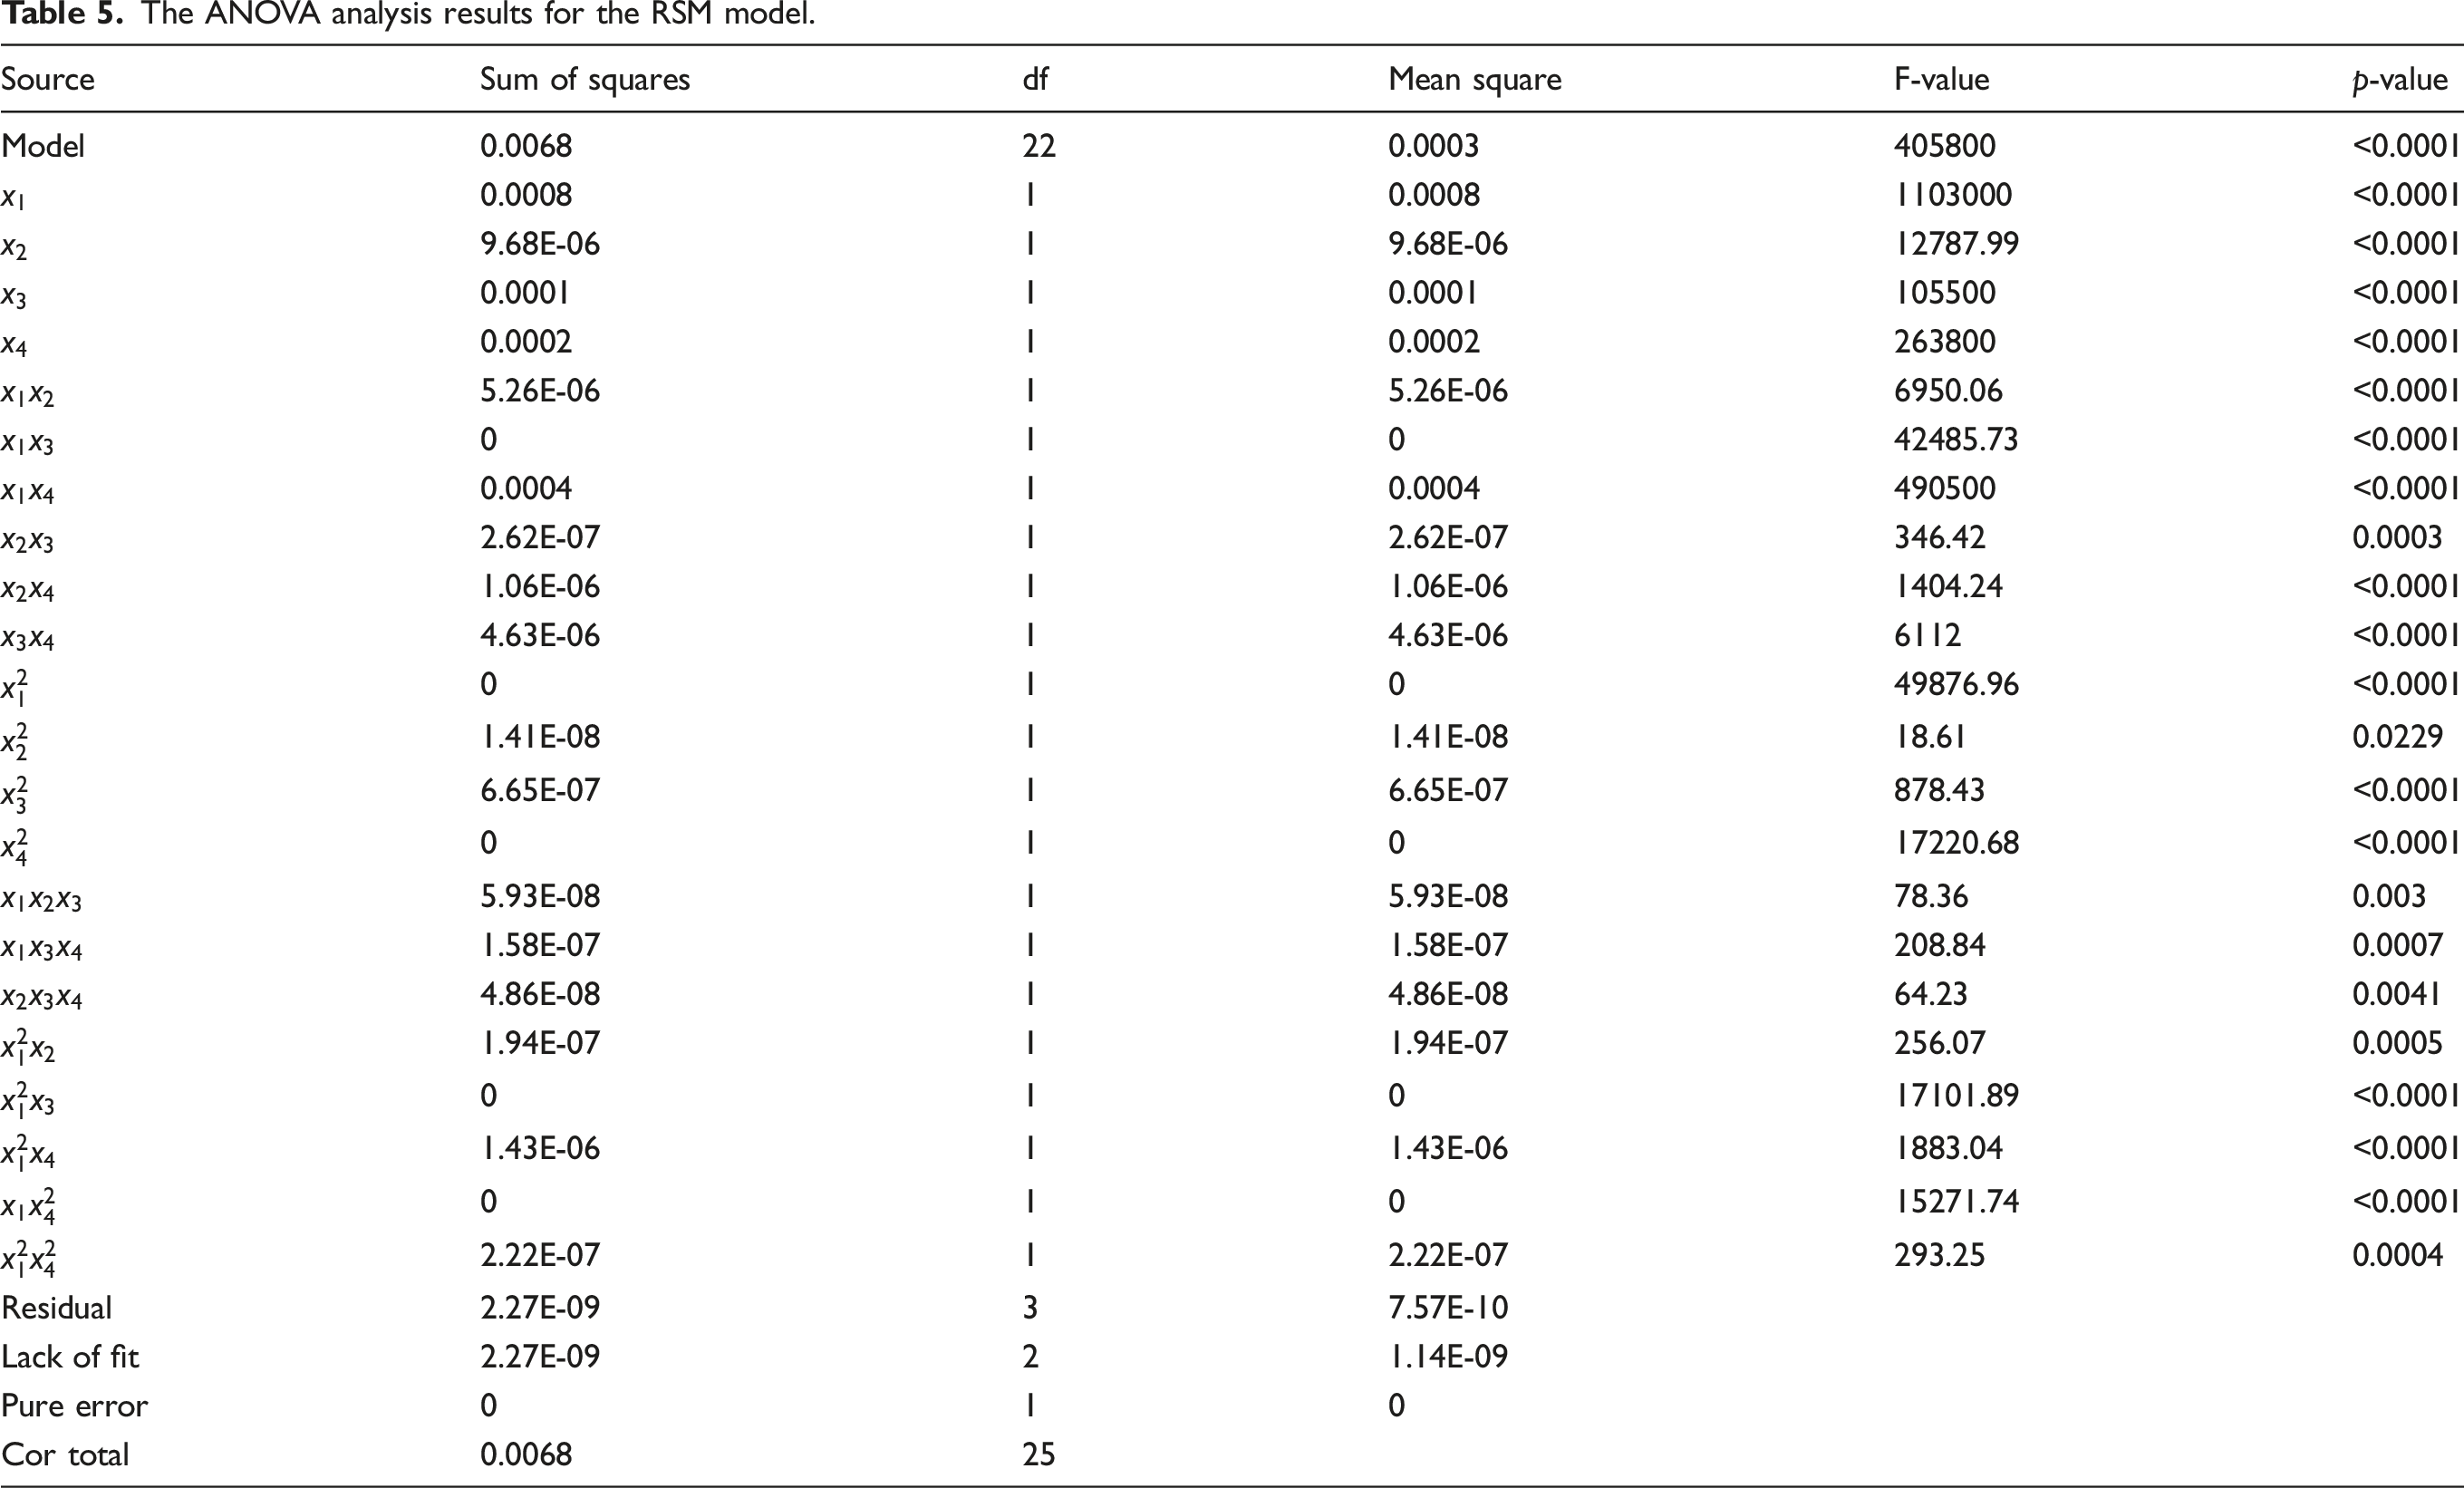
4.3. ANOVA analysis of the RSM model
In order to validate the RSM model of Equation (8), an analysis of variance (ANOVA) is conducted. In the ANOVA analysis, the F-value is used as a measure or test for comparing the source’s mean square errors to the residual mean square errors. The p-value is calculated from the F-value and the degrees of freedom (df). In order to validate a regression model from a statistical perspective, the F-value must be as high as possible, and the p-value should be as low as possible. If the p-value is less than 0.05, it means that the model is statistically significant and reliable for prediction.
The ANOVA analysis results for the RSM model.
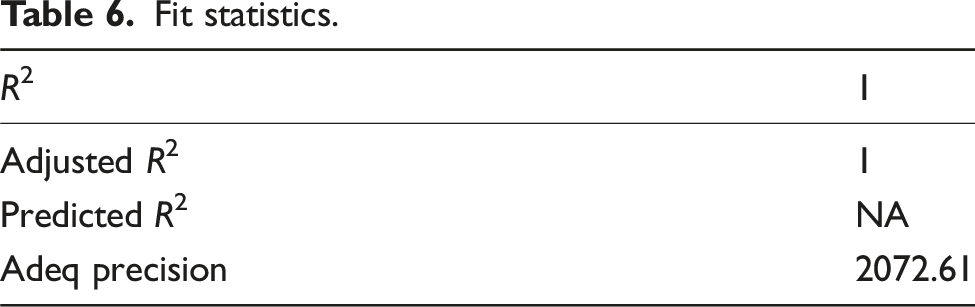
Fit statistics.
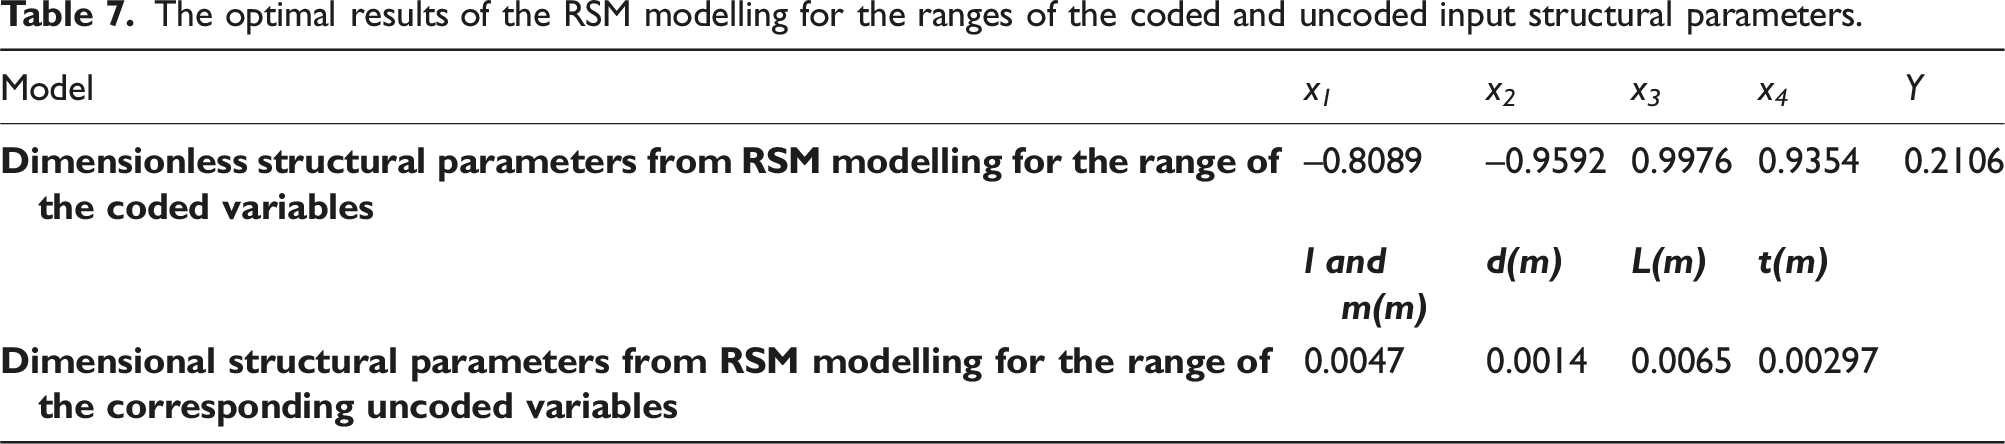
The optimal results of the RSM modelling for the ranges of the coded and uncoded input structural parameters.
4.4. Taguchi analysis and design optimization
Taguchi optimization method is then applied to improve seating suspension system vibration isolation performance in a vehicle environment.
From the results of the RSM and analytical models in this paper and Appendix A, it can be seen that the combination of the seat cushion of the honeycomb structure cells and six double-diamond seat suspension structure isolators can achieve better vibration isolation. This is because that the honeycomb structure cells have negative Poisson’s ratio, while the six double-diamond seat suspension structure isolators have the quasi-zero stiffness structure. There are connections between the negative Poisson’s ratio and the quasi-zero stiffness. The honeycomb structure cells of negative Poisson’s ratio may have the property of the quasi-zero stiffness or negative stiffness. If the top and bottom half of the double-diamond structure isolator are removed, the double-diamond isolator structure becomes X-shaped suspension structure which is widely used in automotive seat suspension application. The X-shaped suspension structure is the quasi-zero stiffness structure. If the X-shaped suspension structure is scaled down and used as cells of the seat cushion, it most likely has a negative Poisson’s ratio.
The seat suspension structure of the six double-diamond isolators first reduces a part of the vibration. After the vibration wave is attenuated through the seat suspension of the double-diamond isolator structure, it can be further reduced by the honeycomb structure cushion. Thereby, the overall vibration isolation effect of the seat can be improved. In Appendix A, a 20 kg mass is used for mass the loading on a single double-diamond isolator structure to calculate the peak transmissibility amplitude. In Figure 3(b), six double-diamond isolator structures are used to support the driver of 120 kg through the cushion, which is consistent with the loading of Appendix A. In this case, the seat suspension stiffness is assumed to be six times that of a single double-diamond isolator structure, as shown in Equation (A6). The seat suspension damping coefficient is assumed to be six times that of a single double-diamond isolator structure, as shown in Equation (A7).
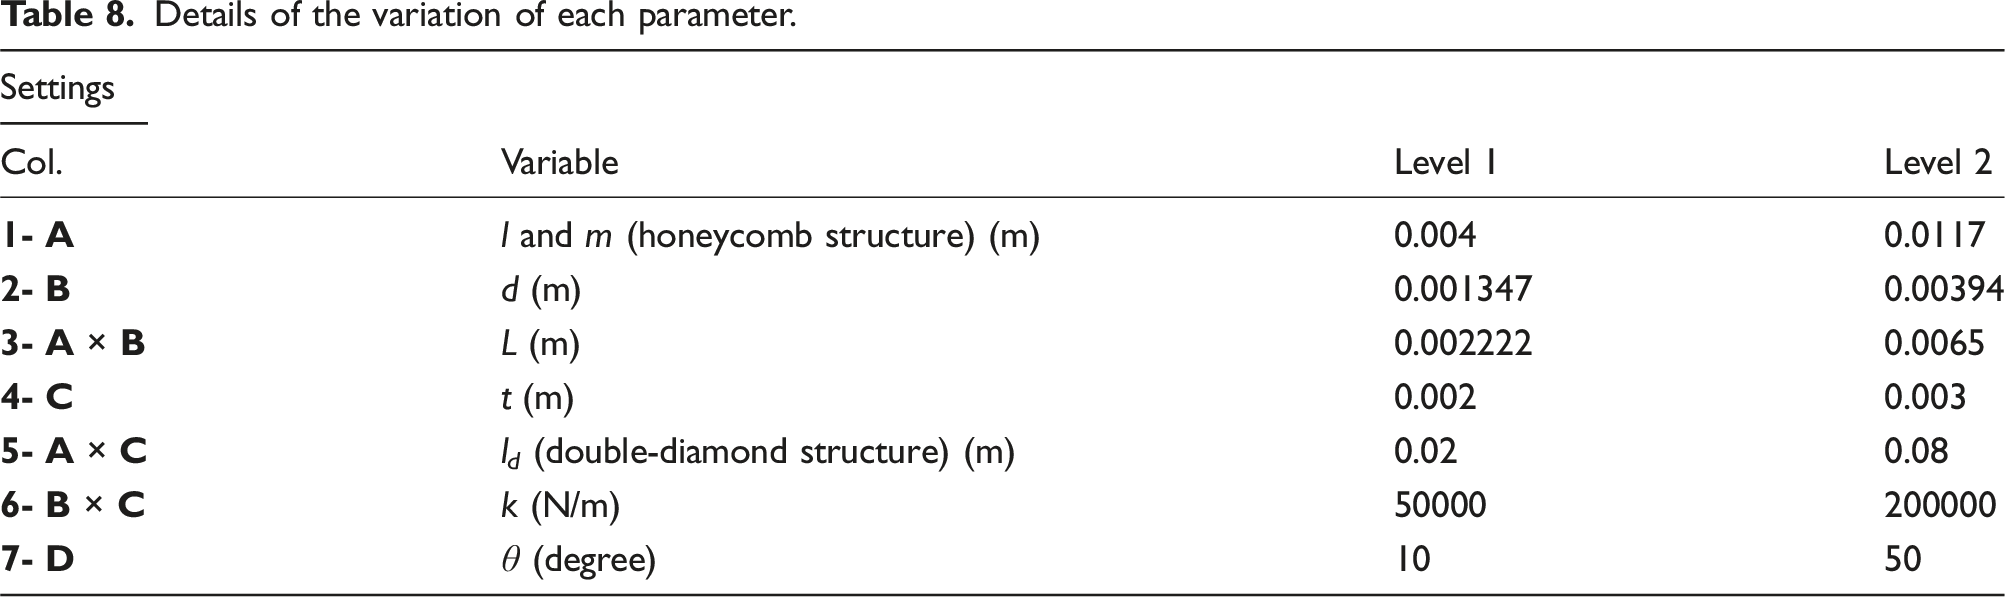
For the automotive seat and cushion system proposed in this paper, it is important to understand the effect of each seat and cushion structure parameter on the peak transmissibility amplitude. Using a validated simulation model, the sensitivity of the peak transmissibility amplitude to the seat and cushion structural parameters can be assessed using the Taguchi method, where the target output variable is chosen as the peak transmissibility amplitude at 4 Hz.
Details of the variation of each parameter.
The results of the Taguchi modelling (Zhao et al., 2023).
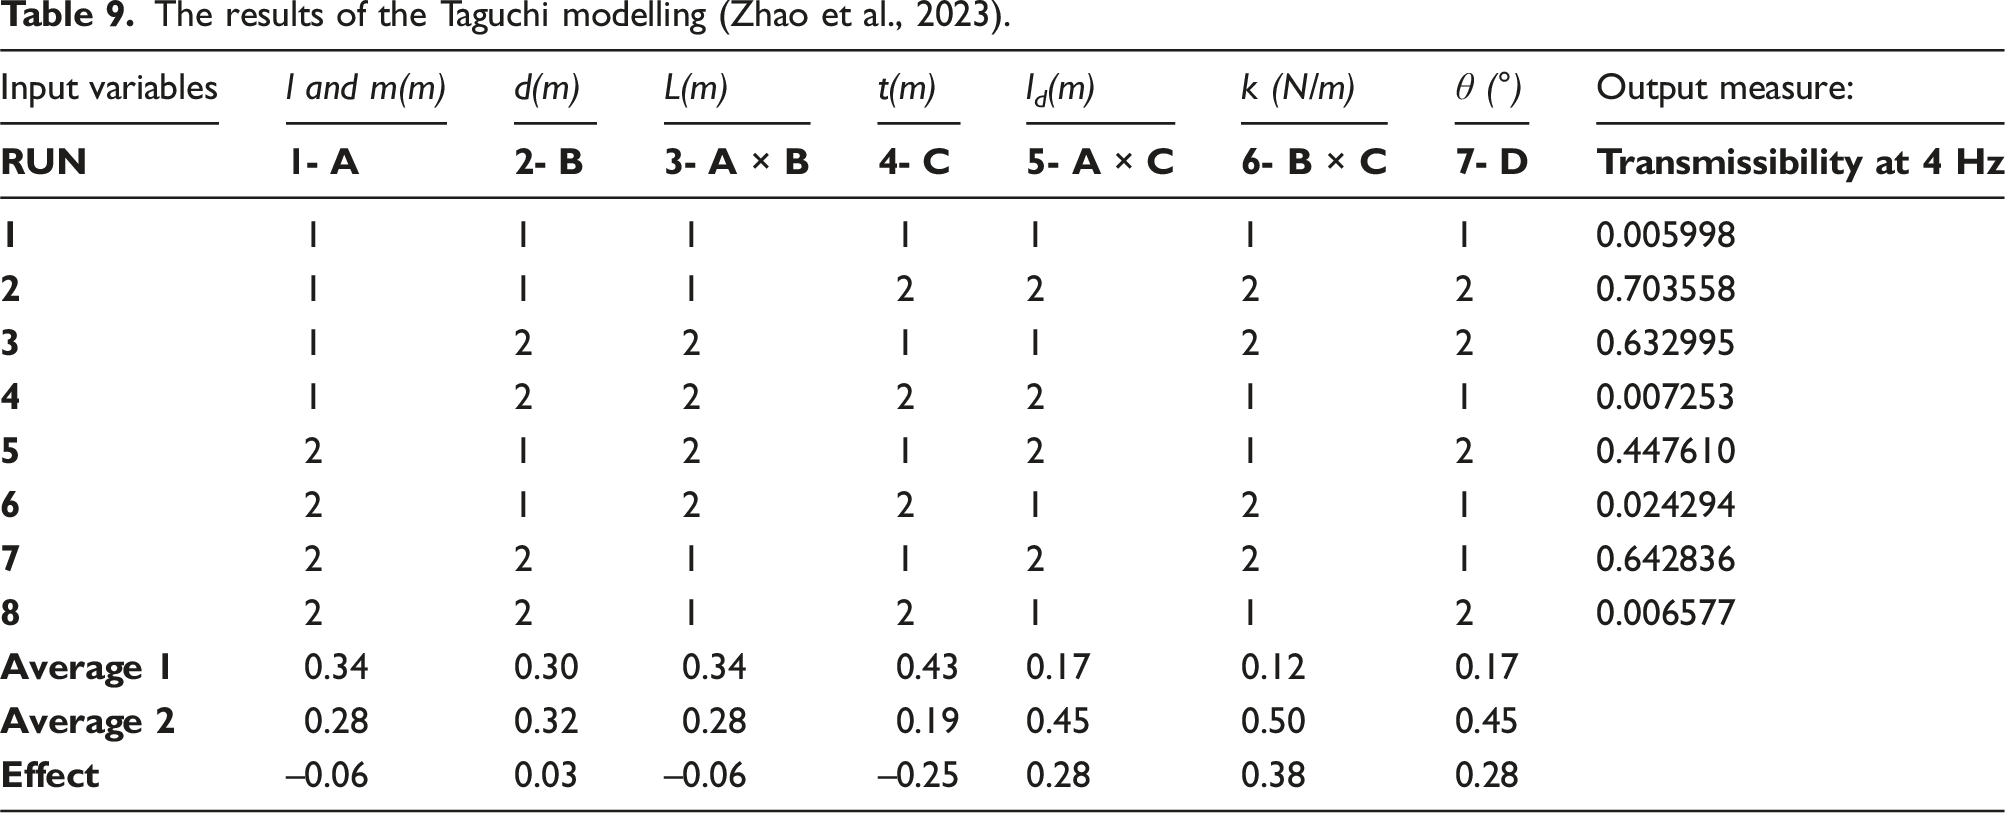
As shown in Table 9, the double-diamond isolator structure spring stiffness k has the most significant impact on the peak transmissibility amplitude, and its effect is 0.38. This shows that decreasing k will decrease the peak transmissibility amplitude. The bar length of the double-diamond isolator structure l d has the second-largest impact on the peak transmissibility amplitude, and its effect is 0.28. Decreasing the bar length will decrease the peak transmissibility amplitude. The double-diamond isolator structure assembly angle θ has the same impact as l d on the peak transmissibility amplitude, and its effect is 0.28. This shows that decreasing θ will decrease the peak transmissibility amplitude. The thickness of the cell wall t has the third-largest impact on the peak transmissibility amplitude, and its effect is –0.25, which indicates that increasing t will reduce the peak transmissibility amplitude. The effects of the length of the beam of the honeycomb structure cell l and m, the vertical connection element length between two cells d, and the horizontal connection element length of each cell structure L are –0.06, 0.03, and –0.06, respectively, which means that influences of these three parameters on the peak transmissibility amplitude are relatively small, similar, and close. Increasing the length of the beam of the honeycomb structure l and m and the horizontal connection element length of each cell structure L will reduce the peak transmissibility amplitude while decreasing the vertical connection element length between two structure cells d will decrease the peak transmissibility amplitude. In general, the structure parameters of the double-diamond isolator structure are more sensitive to the peak transmissibility amplitude than those of the honeycomb cushion cell.
As seen in Table 9, the first of the eight runs has the smallest peak transmissibility amplitude of 0.0059979, which is less than the minimum peak transmissibility result of 0.210612 optimized by the RSM method as shown in Table 7. It clearly shows that the Taguchi method has produced better peak transmissibility amplitude results than the RSM. This is because the parameters of the seat suspension of the double-diamond isolator structure are much more sensitive to the peak transmissibility amplitude than those of the seat cushion of honeycomb structure cells. As shown in Tables 9, in the Taguchi method, the optimal parameter combination of Run 1 is the length of the beam of the honeycomb cell structure l and m of 0.004 m, the vertical connection element length between each cell structure d of 0.001347 m, the horizontal connection element length of each cell structure L of 0.002222 m, the thickness of the cell wall t of 0.002 m, the bar length of the double-diamond isolator structure l d of 0.02 m, the double-diamond isolator structure spring stiffness k of 50000 N/m, and the double-diamond structure assembly angle θ of 100. As shown in Tables 7, in the RSM method, the optimal parameter combination is the length (l & m) of the beam of the honeycomb cell structure of 0.0047 m, the vertical connection element length d of 0.0014 m, the horizontal connection element length L of 0.0065 m, and the thickness t of the cell wall of 0.00297 m. The RSM method only optimized four parameters of the seat cushion cell, while Taguchi optimized the seat cushion and double-diamond seat suspension isolator structure together. Therefore, the larger value of the L parameter in RSM's optimization results compared to Taguchi's maybe because the RSM method only considered the optimization of the seat cushion cell parameters, while Taguchi considered more factors. This comparison may vary depending on the optimization objectives and constraints considered. The values of the other three parameters of the seat cushion cell in both the methods are very similar, which means that the optimization results of the RSM and Taguchi methods are similar in these seat cushion cell parameters. Therefore, it can be said that in terms of seat cushion parameter optimization, the optimal parameters of the Taguchi method are close to those of the RSM method for the cushion cell structure.
It is also proved that if the seat cushion cell and the seat suspension isolator structure share the same set of optimized structure parameters, the vibration isolation performance of the seat can be significantly improved, which means that the parameters of the honeycomb cell structure (seat cushion) and parameters of the double-diamond isolator structure (seat suspension system) are not independent. They are coupled/interact with each other.
Figure 2 compares the baseline transmissibility and the transmissibility after the Taguchi optimization. The baseline transmissibility amplitude peak (blue curve) at 3.98 Hz is –14.1768 dB, while the Taguchi optimization method yields a transmissibility amplitude peak (red curve) of –45.755 dB at 4 Hz. This improvement in the transmissibility demonstrates the effectiveness of the Taguchi optimization method in enhancing ride comfort.
In our study, the primary objective was to optimize the structural parameters of the seating suspension system and cushion for the minimum peak transmissibility ratio at 4 Hz which was identified to have a major contribution to the ride comfort and have the largest peak vibration amplitude from the field vibration test results in the trucks. Our study only focuses on reducing the dominant peak transmissibility amplitude at 4 Hz. This was based on the understanding that the peak transmissibility ratio represents the worst-case scenario where the human body would experience the maximum discomfort due to the vertical vibration. By focussing on minimizing this peak value, we aimed to ensure the highest level of comfort for the driver under the most adverse conditions. After the design optimization using the Taguchi method, the peak transmissibility amplitude has been significantly reduced as shown in Figure 3. The same method can be applied to reduce the peak transmissibility amplitude at the other frequencies.
However, it's important to note that real-world vibrations are complex and encompass a range of frequencies. While our model optimally addresses the peak transmissibility ratio at one frequency, discrepancies at the other frequencies could arise due to several reasons:
Non-linearity of Materials: The materials used in the seating suspension system and cushion, especially the 3D-printed honeycomb structure, exhibit non-linear behaviour, which can affect their response at different frequencies.
Human Body Dynamics: The human body itself has various resonance frequencies based on the biomechanical properties of tissues, bones, and organs. This can lead to varying transmissibility across different frequencies.
Interactions and Couplings: The interactions between the seat, cushion, suspension system, and the human body can lead to complex dynamic behaviours that are difficult to capture entirely in any model.
Limitations of the Optimization Algorithm: While the optimization algorithm was effective in minimizing the peak transmissibility ratio at one frequency, it is not able to account for the entire frequency spectrum's nuances.
While our model provides a significant improvement in addressing the challenges of seat design and vibration transmissibility, we acknowledge that there is room for further refinement, especially in capturing the complete frequency response. Future work can delve deeper into these discrepancies and aim for a more holistic optimization across the entire frequency spectrum.
5. Conclusions
This paper focuses on the prediction of performance and sensitivity analysis of structural parameters related to the seat cushion cell and suspension isolator structures. The central composite design (CCD) method is employed to design the simulation experiments to achieve this objective. The 7-degree-of-freedom (7-DOF) system equations of motion, as developed in Ref. Zhao et al., 2021a, are utilized to predict the peak transmissibility amplitude at 4 Hz from the input parameters of the CCD array. The response surface methodology (RSM) model is subsequently created using the input parameters and their corresponding peak transmissibility amplitude. The RSM and Taguchi models are used to optimize the structural parameters of the seat cushion of honeycomb structure cells and seat suspension of double-diamond structure isolators for the best possible vibration isolation performance. • For the RSM model of the cushion of the honeycomb structure cell simulated on the 7-DOF quarter-vehicle suspension model, the lengths l and m of the honeycomb beam have the largest influence on the peak transmissibility amplitude; decreasing the length will decrease the peak transmissibility amplitude. The thickness t of the cell wall has the second-largest influence on peak transmissibility amplitude; increasing the thickness will decrease the peak transmissibility amplitude. The horizontal connection element length of each cell structure L between the two adjacent cell structures has the third-largest influence on peak transmissibility amplitude. Increasing the length will decrease the peak transmissibility amplitude. • For the RSM model of the honeycomb cushion cell structure simulated on the 7-DOF quarter-vehicle suspension model, the minimum peak transmissibility amplitude is predicted to be 0.210612. The corresponding optimal structural parameters are the length (l & m) of the beam of the honeycomb structure of 0.0047 m, the vertical connection element length d of 0.0014 m, the horizontal connection element length L of 0.0065 m, and the thickness t of the cell wall of 0.00297 m. • For the Taguchi model of the honeycomb seat cushion cell and double-diamond seat suspension isolator structure simulated on the 7-DOF quarter-vehicle suspension model, the double-diamond structure spring stiffness k has the most significant impact on the peak transmissibility amplitude; Decreasing k will decrease the magnitude of the peak transmissibility. The bar length of the double-diamond structure l
d
and the double-diamond structure assembly angle θ have the second-largest impact on the peak transmissibility amplitude. Decreasing these two structural parameters will decrease the peak transmissibility amplitude. The thickness of the honeycomb cell wall t has the third-largest impact on the peak transmissibility amplitude. The effect is negative, which means that increasing t will reduce the peak transmissibility amplitude. • For the Taguchi model of the honeycomb seat cushion cell and double-diamond seat suspension isolator structure simulated on the 7-DOF quarter-vehicle suspension model, the minimum peak transmissibility amplitude is predicted to be 0.006. The corresponding optimal structural parameters are the length of the beam of the honeycomb cell structure l and m of 0.004 m, the vertical connection element length between each cell structure d of 0.001347 m, the horizontal connection element length of each cell structure L of 0.002222 m, the thickness of the cell wall t of 0.002 m, the bar length of the double-diamond structure l
d
of 0.02 m, the double-diamond structure spring stiffness k of 50000 N/m, and the double-diamond structure assembly angle θ of 100. • The peak transmissibility amplitude results predicted by the analytical models have verified those predicted by the RSM model (as shown in Table 4). The RSM model has been validated by the ANOVA results in Table 5. • The optimal structural parameters of the cushion cells for the minimum peak transmissibility using the RSM method are close to those using the Taguchi method. • A smaller peak transmissibility amplitude result has been predicted using the Taguchi method than using the RSM method, as the structure parameters of the seat suspension of the double-diamond isolators are much more sensitive to those of the cushion of the honeycomb isolator structure.
Future studies could expand upon our model by integrating the effects of multi-directional vibrations. This would involve not just a simple addition of the effects from different directions but a more intricate understanding of how these vibrations interact with each other and how the human body responds to such combined motions. Advanced simulation tools and experimental setups that can mimic real-world scenarios would be instrumental in such endeavours.
Footnotes
Acknowledgements
We would like to acknowledge Australia Research Council Linkage Project grant LP160100132 for financial support.
Declaration of conflicting interests
The author(s) declared no potential conflicts of interest with respect to the research, authorship, and/or publication of this article.
Funding
The author(s) disclosed receipt of the following financial support for the research, authorship, and/or publication of this article: This study is supported by Australian Research Council (LP160100132).