
Abstract
Studies on recycled materials emerged during recent years. This paper investigates the properties of sound absorption and transmission loss of the structures of the perforated plastic panel (PPP) backed with the rubber granule panel (RGP). Under production conditions, such a structure could be produced using only waste. The normal incidence sound absorption and transmission loss of the structure was measured using ISO 10534-2 and ASTM E2611-17 standard methods, respectively. In this study, the plastic panel perforation holes were tilted in steps of 15°–45° compared to the vertical axis of the sample. Different thickness rubber panels were used as backing (12 mm, 22 mm and 27 mm). The results showed that the sound absorption and transmission loss increased with the angle of the perforation pore. To compare the different structures, the multi-criteria analysis using the technique for order of preference by similarity to ideal solution (TOPSIS) approach was done. The RGP thickness, sound absorption coefficient (SAC) and sound transmission loss (STL) were weighted as a criterion. The results of the multi-criteria analysis showed that the optimal structure for a possible application is PPP45°+ RGP 22 mm, which was ranked highest of all alternatives. The first peak of SAC reached 0.97 at 1000 Hz. In the frequency range of 250–1000 Hz, STL values reached up to 10.4 dB and in the frequency range of 1–4 kHz – 20.1 dB. The results obtained using RGP and PPP show promising development potential for sound absorption and insulation applications.
1. Introduction
Sound-absorbing materials are one of the main approaches to controlling environmental noise. Traditionally, such materials are made of non-renewable raw materials such as mineral wool, polyurethane foams, etc. Such materials often provide high sound absorption coefficients and are often used in the construction sector.
The interest in sound-absorbing materials recently shifted towards natural materials. This motivation for looking for such new materials came from the European and other countries’ legislations, which set requirements for product reusability or recycling. The most common approach to control noise is to use natural materials such as kenaf, hemp or other fibrous materials (Berardi and Iannace 2015; Taban et al., 2020; Gomez et al., 2023). Such materials fit well within the concept of a circular economy. Fibrous materials often provide good sound absorption and heat insulation properties.
Studies on recycled materials are emerging as well. The circular economy principles suggest to reuse or recycle materials, and recycling processes reduce the generated waste. The transportation sector produces different kinds of waste: tyres, oils, metal parts, filters, etc. Several studies tested the sound absorption of rubber granules made from used tyres (Pfretzschner and Rodriguez 1999; Asdrubali et al., 2008b; Xu et al., 2018). The results showed that such wastes function as granular media and could be used for sound absorption or insulation applications. Recent studies have increased interest in cement composites with tyre rubber. This approach provides better sound absorption compared to traditional cement composites, reducing the negative impact of the specific smell of rubber. Such composite sound absorption varies between 0.3 and 0.4 (Svoboda et al., 2021; Bala and Gupta 2021).
Polyurethane (PU) resin is commonly used as a binder for materials which has to have high mechanical resistance such as asphalts or concrete (Lei et al., 2022; Sun et al., 2022). PU resin is used as a binder for rubber granules in several studies (Semlali Aouragh Hassani et al., 2020; Seibel et al., 2021). Binding techniques with rubber granule often include a hot press around 100°C in the manufacturing process. Rubber tiles bound with PU already made in the industry. Products produced include ground tiles to make it softer on playgrounds or outside courts (Revelo et al., 2021).
Plastic waste is often mentioned as one of the most generated wastes in total. Plastic waste recycling is fundamentally known, and with 3D printing technologies, it is easier to create different structures or plastic parts using recycled plastics. The studies concerning plastic recycling in applications for sound absorption pay a lot of attention into the composite materials with different binders such as cement, wood and chalk (Daeipour et al., 2017; Oancea et al., 2018; Kairytė et al., 2020; Sekar et al., 2021). More affordable 3D printing technologies have motivated studies of acoustic metamaterials. Such engineered materials often have resonators that provide nearly perfect or in some cases perfect sound absorption (Jiménez et al., 2017; Shao et al., 2019). Such a move toward metamaterials shows good possibilities for the application of plastic waste in the future.
Recently, perforated and micro-perforated panels have been interesting topics in the field of acoustic research (Yang et al., 2020; Liu et al., 2021). With such an approach using 3D printing technologies, plastic waste could be recycled into the perforated panel (Sailesh et al., 2022). The construction of perforated panels with porous material backing is quite well known (Bansod et al., 2017; Yuvaraj and Jeyanthi 2020). Most of such composites are based on micro-perforated or perforated panels backed with porous materials which are not environmentally friendly (foams, mineral fibres).
The technique for order preference by similarity to an ideal solution (TOPSIS) method is often used for multi-criteria analysis when the system needs optimization and there are several non-dependent variables (Yadav et al., 2018). In acoustics engineering, this approach is used to optimize sound-absorbing materials, noise barrier designs or evaluation of different sound sources (Garg et al., 2015; Kucukali-Ozturk et al., 2017; NANDI et al., 2017). Such an approach allows to evaluate and compare the performance between the different designs of the structure or material while taking into account technical or non-technical parameters (Kucukali-Ozturk et al., 2017; Gokulkumar et al., 2020).
In this paper, we propose the use of perforated plastic panels with recycled rubber granules for sound absorption and insulation applications. Such an acoustic system would be made using only recycled materials waste plastics and used tyre rubber granules. This paper aims to propose a layered structure of a perforated plastic panel backed with a used tyre rubber granule panel for sound absorption as well as insulation applications.
The paper is organized as follows. In the Materials and methods section, the methods and materials are presented. The Results and discussion section presents and discusses the main results of the study. In the Conclusions section, the main conclusions of the study are presented.
2. Materials and methods
In this section, the methods of the study and materials used are presented. The section is divided into two: the methods of experimental study and the method of multi-criteria analysis.
2.1. Methods of experimental study
The sound-absorbing system in this study consists of two main components: rubber granule panels (RGP) and 3D printed perforated plastic panels (PPP). The rubber granule panel is made of different size rubber granules. Rubber granules were obtained by grinding the used tyres. To determine the size of the rubber granules, 4 sieves were used (mesh size: 5 mm, 2.5 mm, 1 mm, 0.4 mm). The tyre rubber granule in the panel consists mainly of even sized granules that are larger than 5 mm (84.6%), and the smaller part (15.4%) consists of smaller grains. The RGP was binded using polyurethane resin. The mixture of resin and rubber granules was mixed and left in a form to dry for 24 hours. In the first 8 hours of the drying cycle, the samples were flipped every 30 minutes to ensure that the resin is evenly distributed throughout the sample. The resin consists of 30% of the total mass of the panel. The bulk density of loose rubber granules is 315 ± 11 kg/m3.
The 3D printed PPP was made of polylactic acid. The pore size of the perforated panel was 1 mm. The perforation holes were changed by their tilt from 0° to 45° in steps of 15° compared to the vertical axis of the sample. This tilting was done to increase the tortuosity of the perforated panel, thus increasing the potential sound absorption of the combined RGP and PPP system. The PPP is perforated with square holes of 1 × 1 mm in a square lattice. The gap between the perforated holes is 0.4 mm. The test samples used in this study are presented in Figure 1. The samples used in the study. (a) rubber granule panels; (b) perforated plastic panels; (c) schematic representation of the PPP pore angle of 15°.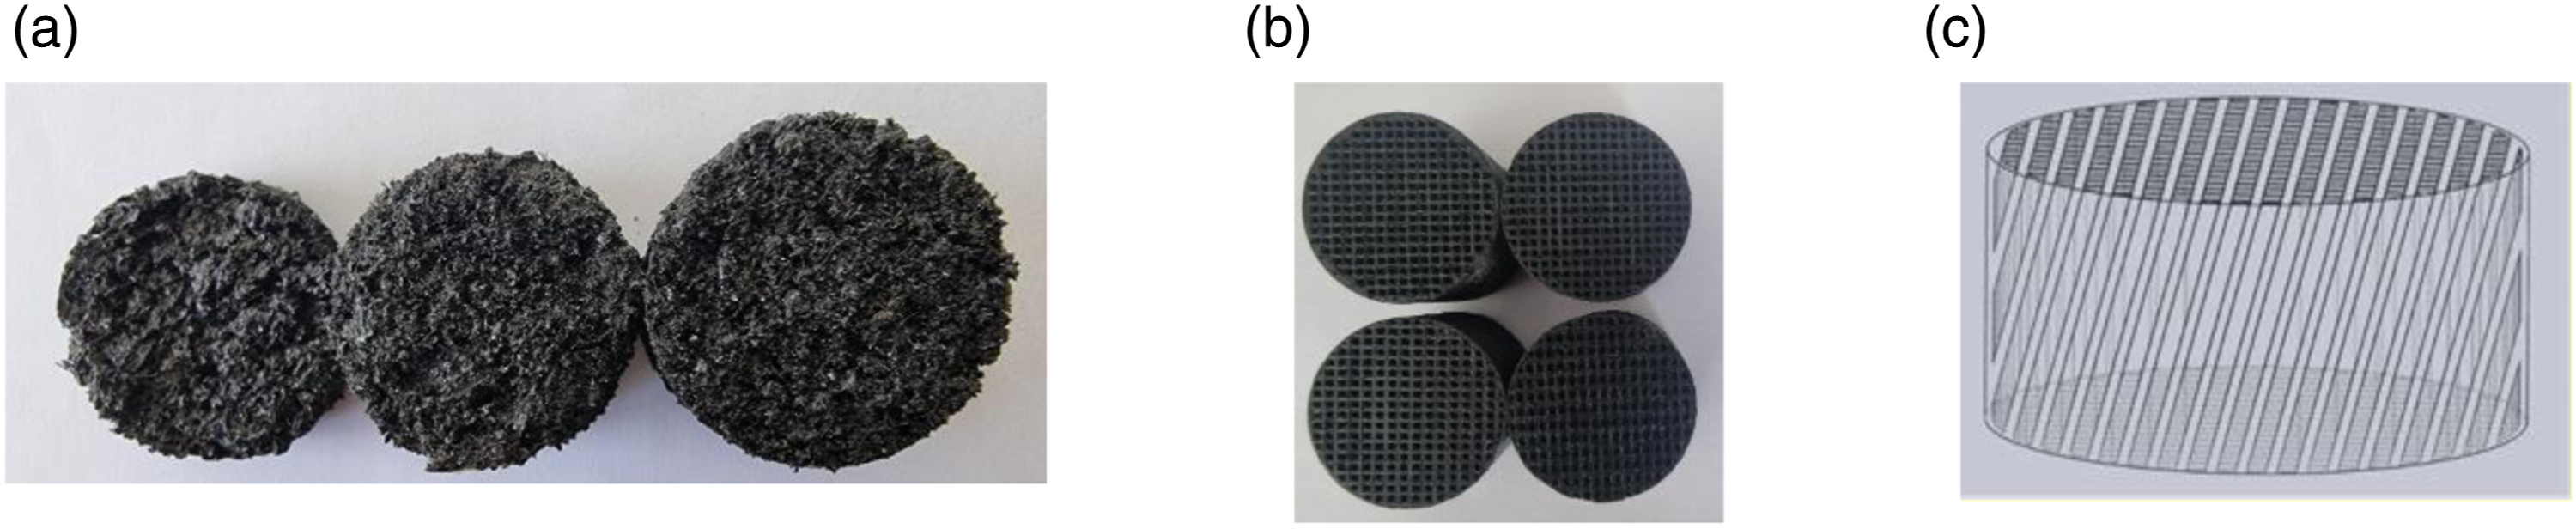
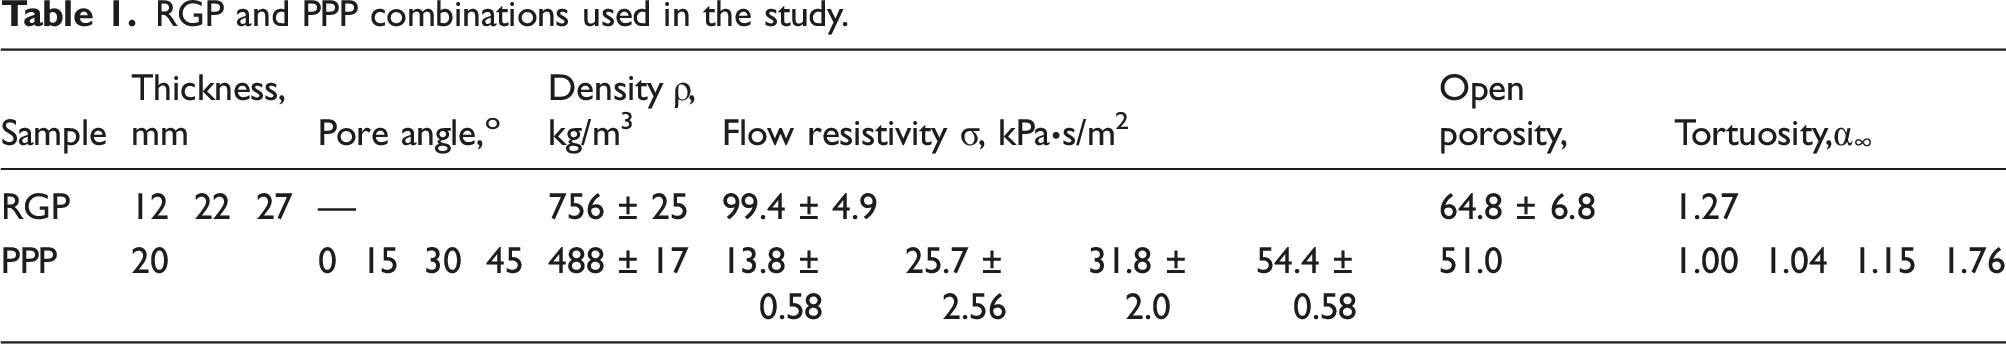
RGP and PPP combinations used in the study.
To determine open porosity of RGP, the water absorption was tested. The ratio of volume of water absorbed by the sample divided by the volume of the sample was considered as open porosity of the sample. The test method was adopted from EN 13369 annex F and used for RGP.
Since the pore volume of PPP is known from the drawing for 3D printing, the open porosity of PPP was calculated during the design stage. The open porosity is the ratio between the pore volume and the total volume of the sample.
The tortuosity of the RGP presented in table no. 1 was estimated using the formulation proposed by (Umnova et al., 2000).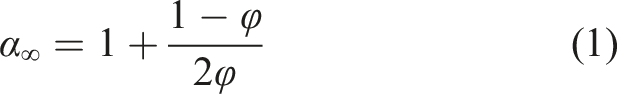
The tortuosity of PPP was calculated according to the formula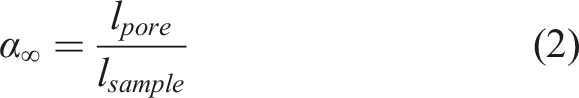
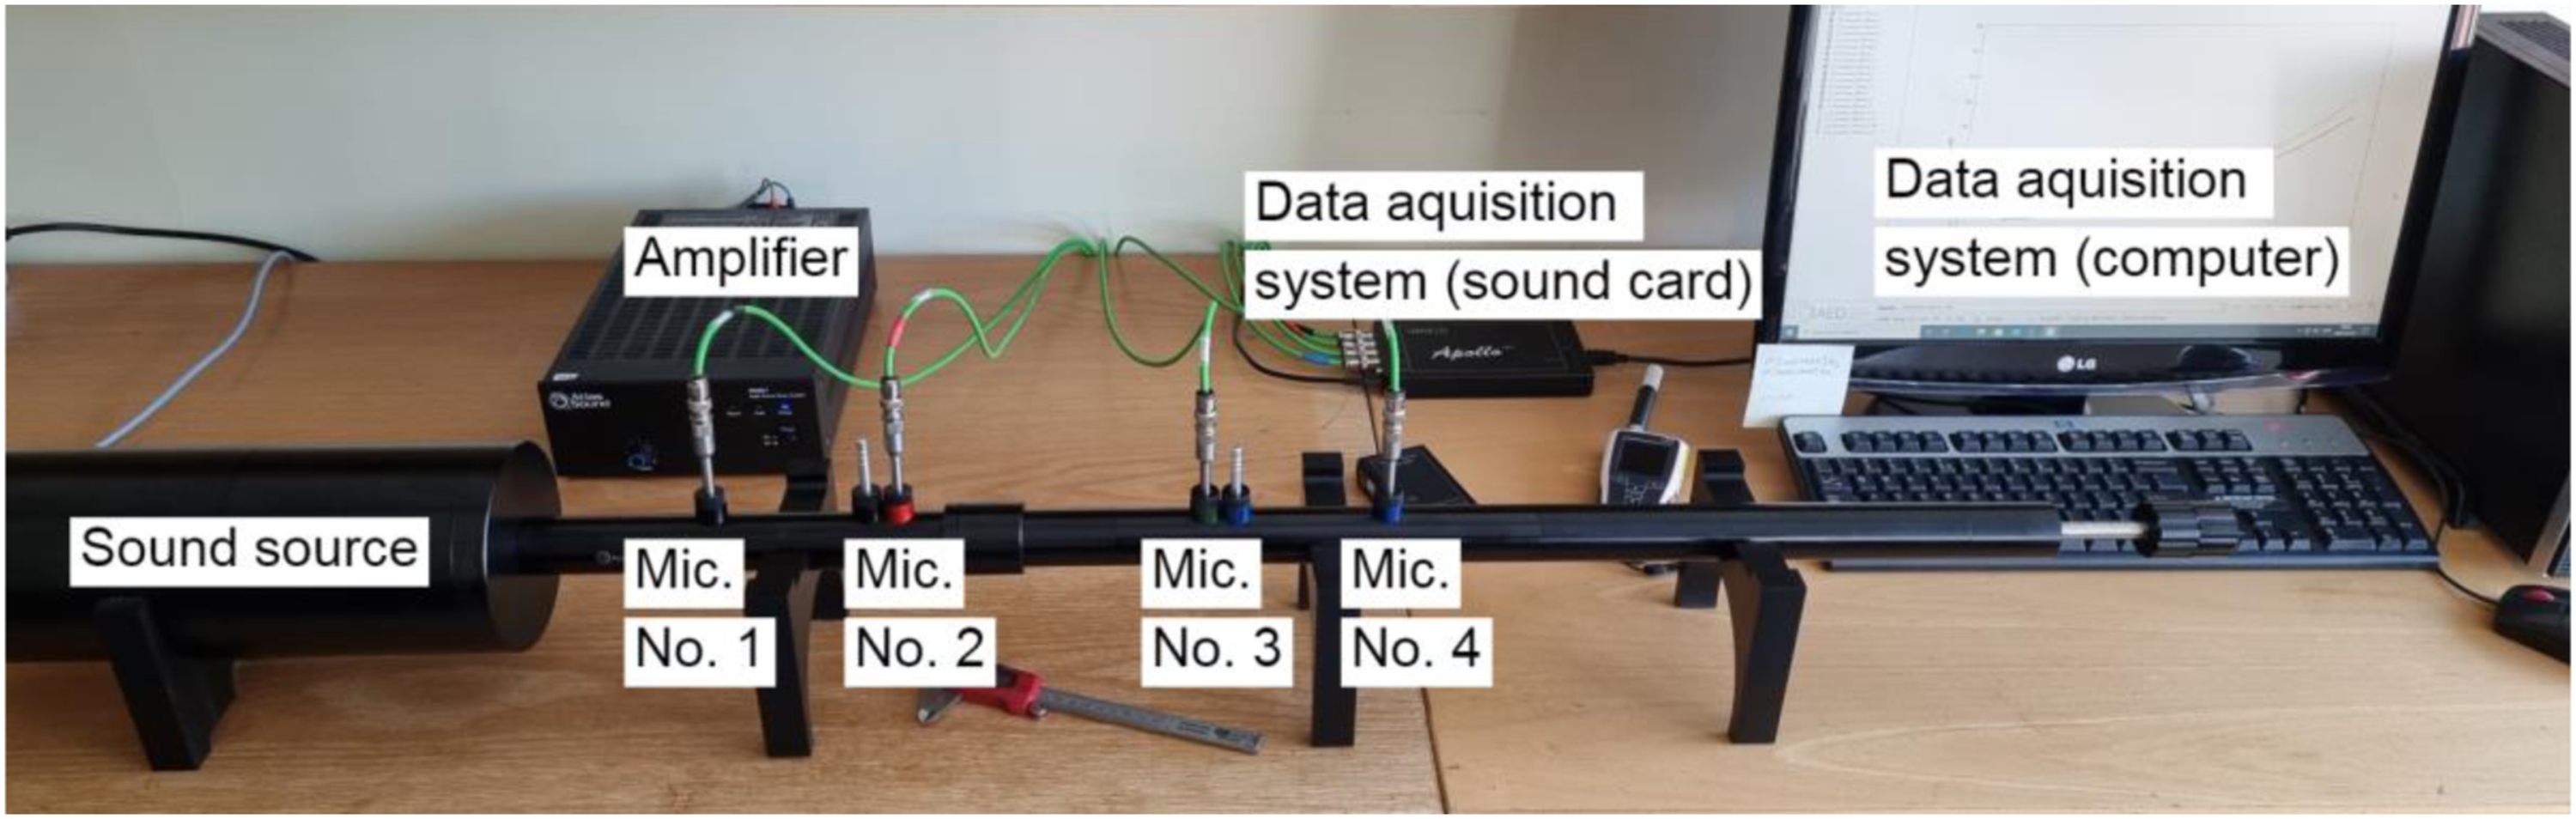
To obtain the sound absorption coefficient (SAC) (α) of PPP with RGP layered structures, the ISO 10534-2 standard method was used (International Organization for Standardization 2001). Such method was chosen due to the requirements for sample size compared with methods which can be performed in reverberant rooms. The impedance tube used in the study is manufactured by Gesellschaft für Akustikforschung Dresden mbH, product AcoustiTube. The measuring frequency range of the tube is 150–6600 Hz (Gesellschaft für Akustikforschung Dresden mbH). For this study, a three-microphone impedance tube measurement system was used. The cross section of the tube was circular with a diameter of 30 mm. Rubber and perforated plastic panels are built to fit into the tube. The samples were rigidly backed. The experimental setup is shown in Figure 2. The distance between mic no. 1 and no. 2 X12 = 120 mm; between mic no. 2 and no. 3 X23 = 20 mm and the distance from the nearest mic to the sample X3S = 60 mm. The diameter of the tube is 30 mm. The measured frequency range is from 250 to 4000 Hz. The results are presented using 1/3 octave band filtering. Three-microphone impedance tube system works according to the same algorithm as two-microphone system but allows to do measurements quicker. The impedance tube configuration for sound absorption measurements.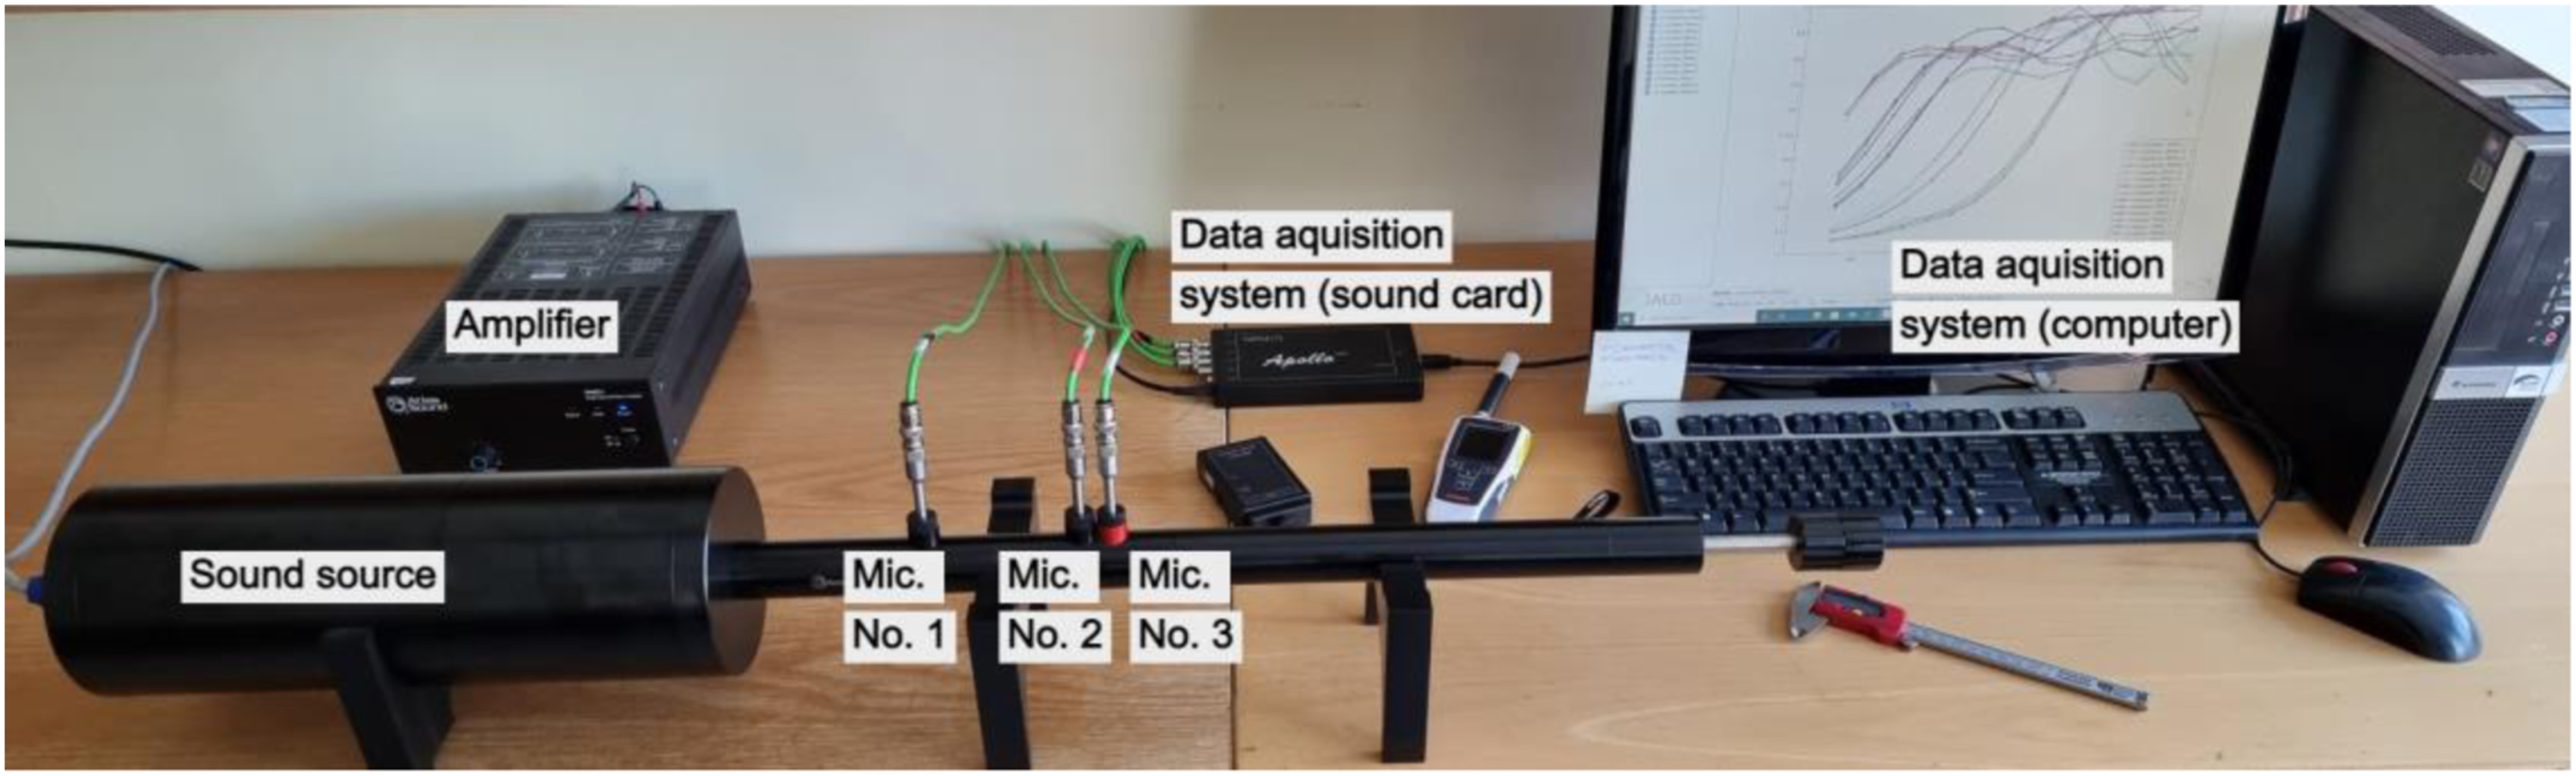
The transfer function method was used with the three-microphone technique.
The transfer function 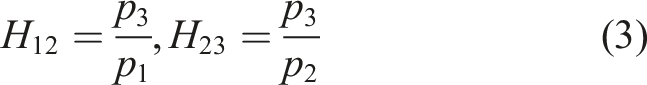
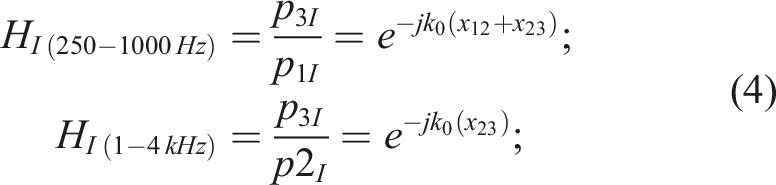
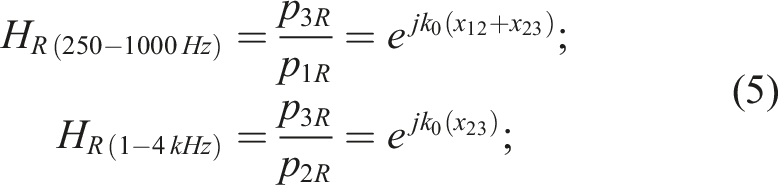
From equations (3)–(5) the reflection coefficient of the sample can be calculated as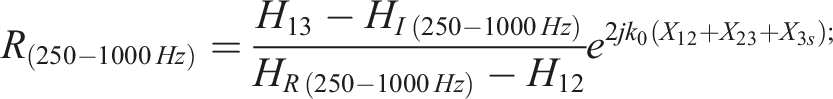
Finally, the sound absorption coefficient is calculated using the following expression:
For engineering applications, sound spectra are often presented as one-third octave frequency bands rather than narrow bands. This frequency representation is linked to the perception of sound by the human ear, and allows compression of the amount of information. In this paper, the results are presented in 1/3 octave to show relevant information while focussing on the application possibilities of the PPP and RGP panels. All different thickness RGP samples were tested in combinations with each PPP sample. Each combination consists of three samples, and 100 averages were made for each measurement. In total, 12 structures consisting of 36 separate samples were tested.
Measurement of sound transmission loss
The measurement of sound transmission loss (STL) was performed using the 1 load, 4 microphone method. During the tests, anechoic termination was used behind the samples. The sound transmission loss was tested according to ASTM: E2611-17 standard. The view of the transmission tube is presented in Figure 4. The distances between the microphones and the sample for measurement for frequency bands from 160 Hz to 1 kHz were X12 = 120 mm; X2S = 60 mm; XS3 = 40 mm; X34 = 120 mm; LSH = 100 mm. The distances between microphones to measure higher frequency (from 1 to 4 kHz) bands were X12 = 20 mm; X2S = 60 mm; XS3 = 40 mm; X34 = 20 mm; LSH = 100 mm, in both cases, t is the thickness of the sample Figure 3. Measurements were made according to the ASTM E2611-17 standard. For STL testing, the same samples were used as in SAC measurements. Sound absorption RGP and PPP samples. (a) RGP samples; (b) PPP samples. Impedance tube system to measure sound transmission loss.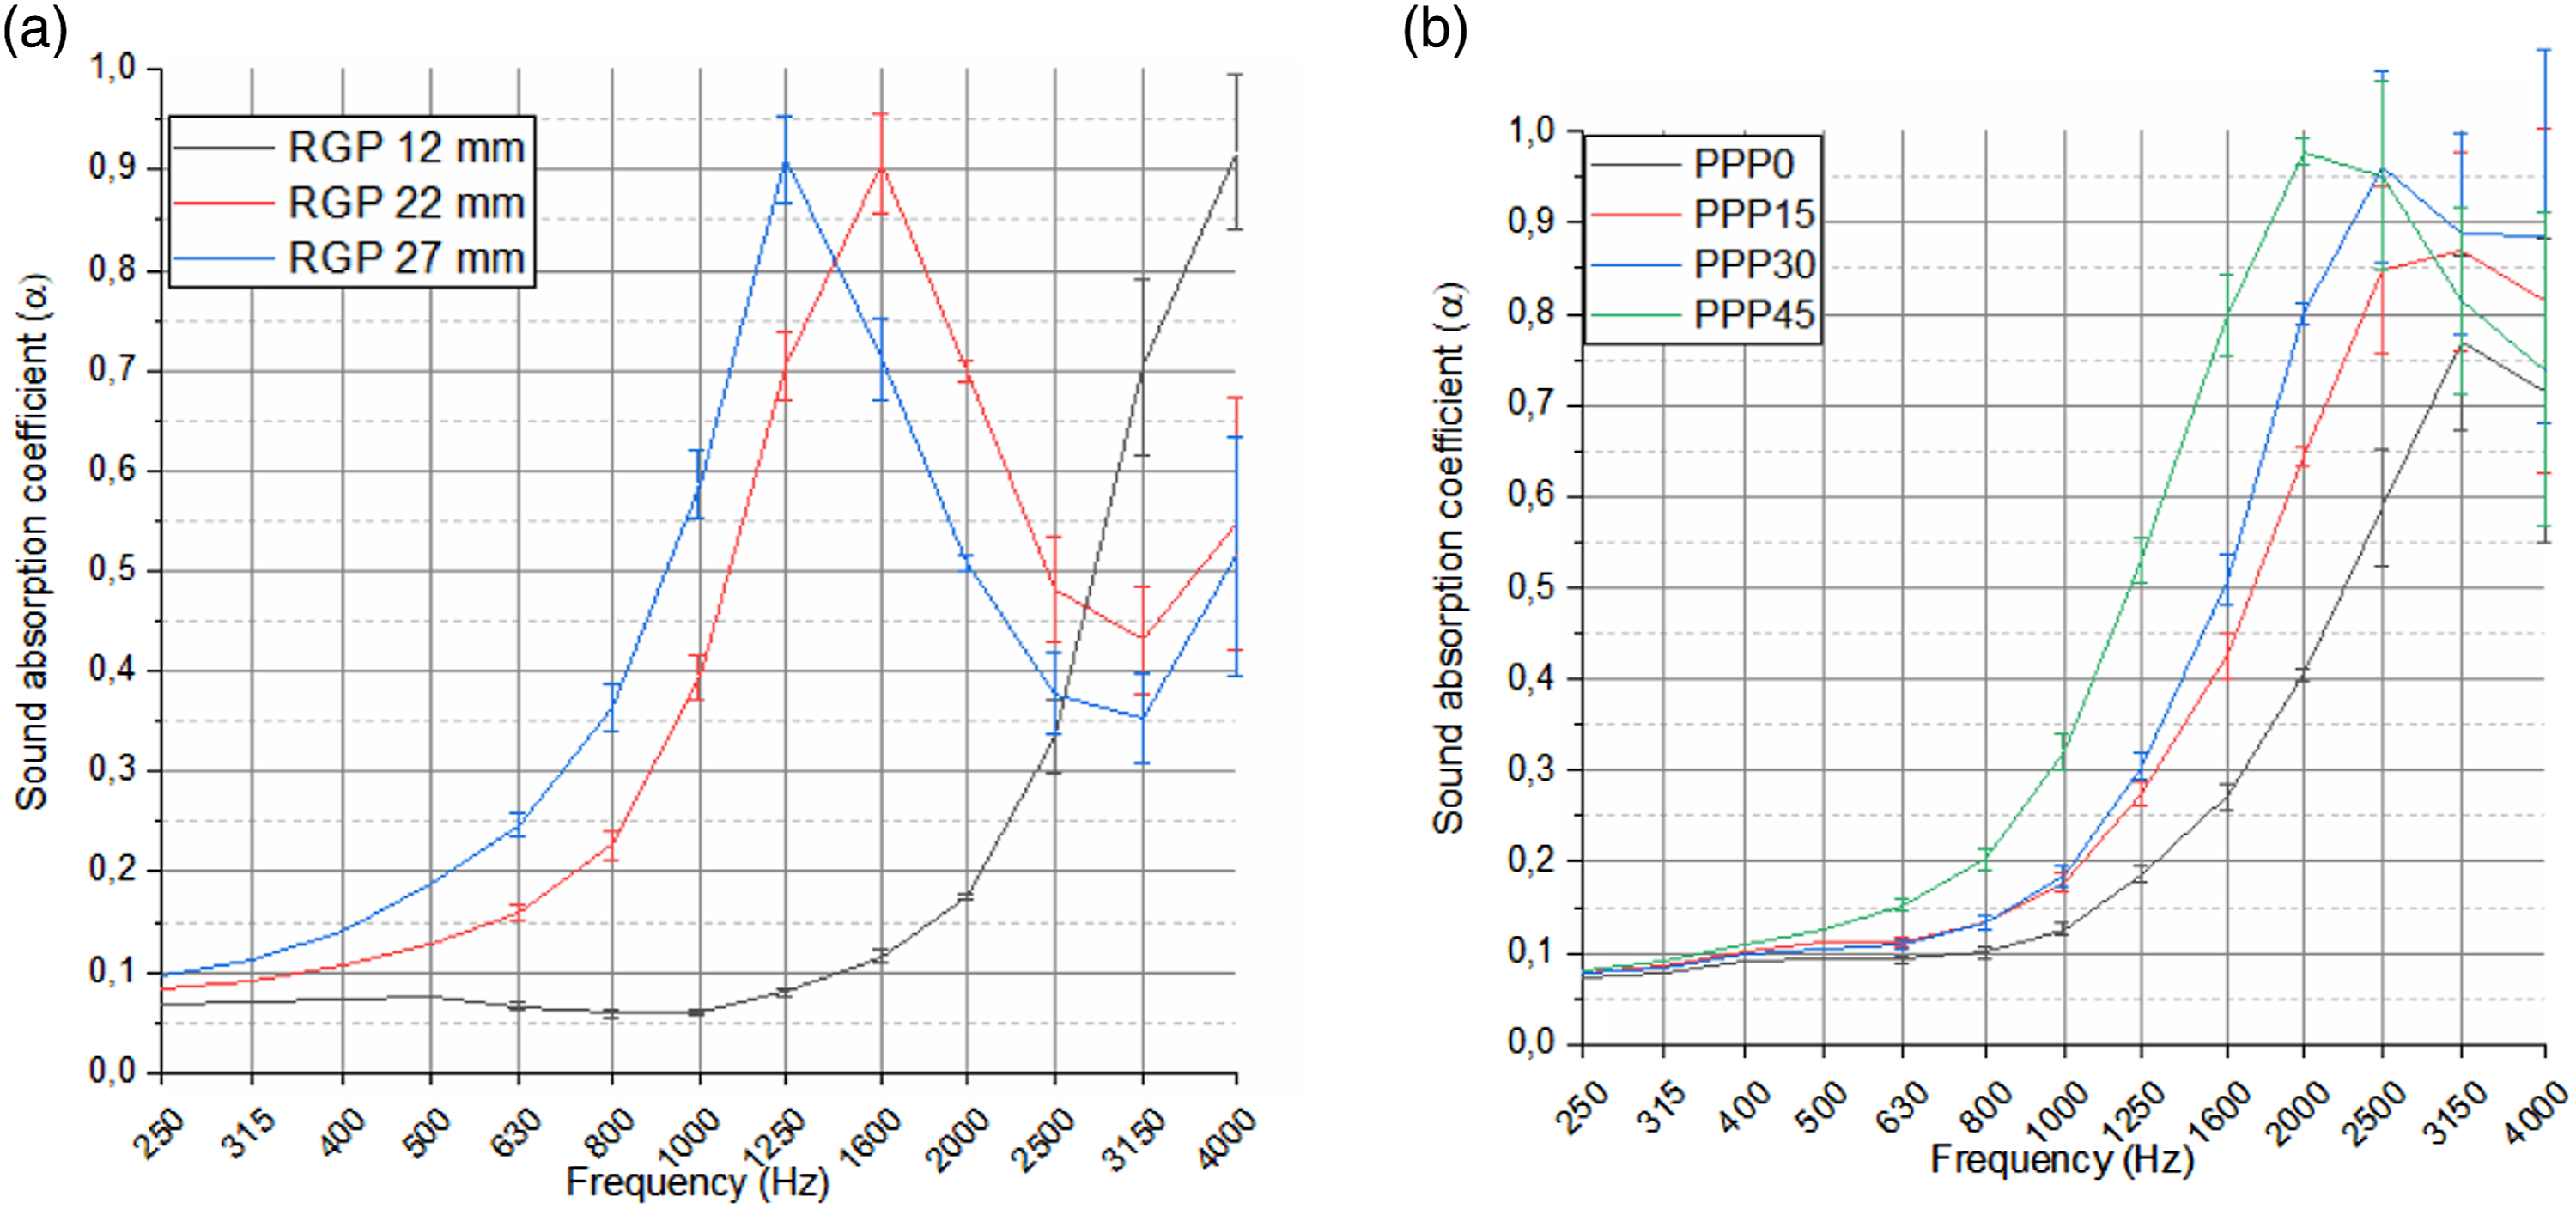
The transfer matrix for such measurement systems is usually expressed as
From this transfer matrix, the transmission coefficient for the anechoically backed sample is expressed: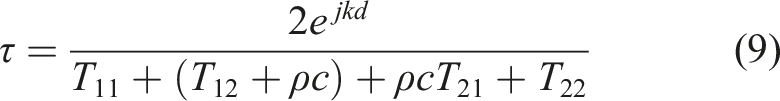
Eventually, the normal incidence sound transmission loss in dB is expressed as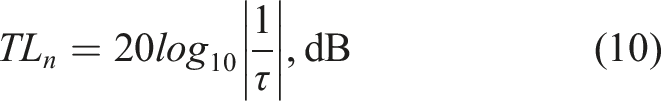
2.2. TOPSIS method to compare the performance of the different designs of RGP and PPP structures
The aim of designing PPP and RGP structures was to create structures that show good absorption and insulation properties at the same time. Such a design would allow better sound quality in the source room while reducing the sound in the nearby rooms of the building. The global environmental trends demand using as little material as possible to reach the goals of sound absorption and insulation.
Decision-making matrix for optimizing RGP and PPP panels.
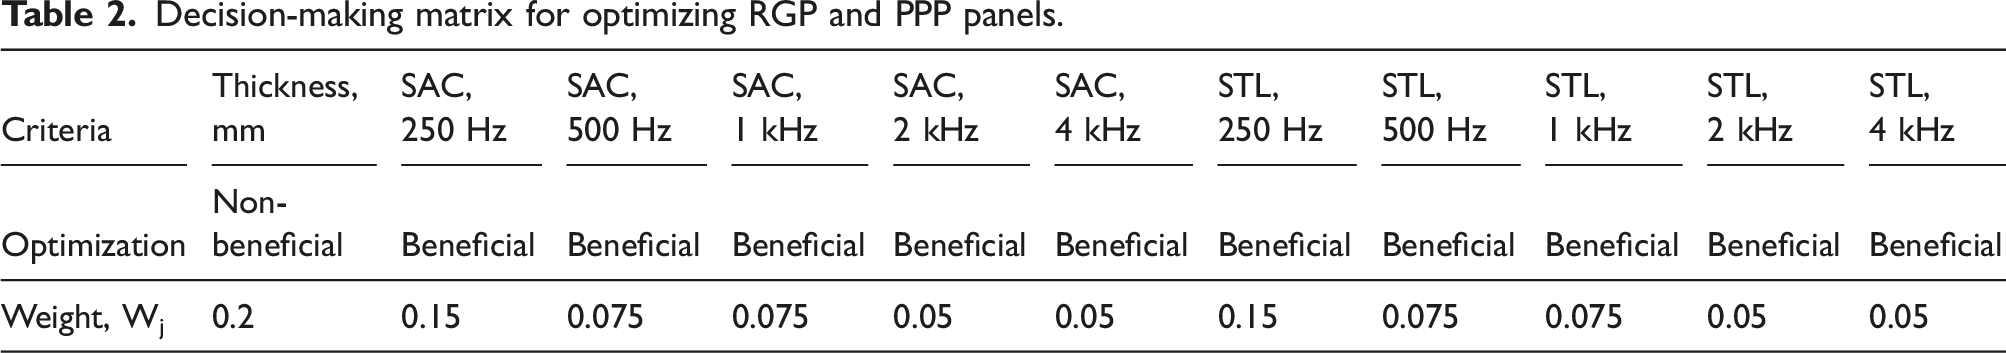
The TOPSIS analysis method is done in a few steps. First, the criteria decided for consideration are governed by importance. The criteria can be beneficial or non-beneficial. In this study, it was decided that an increase in the material thickness is not beneficial. This decision was made due to environmental aspects, with the priority of using as little material as possible. The normalized decision matrix is calculated according to the formula: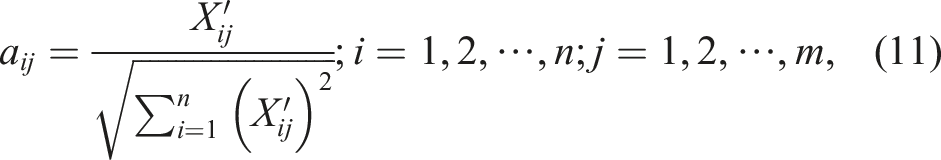
Then the weighted normalized matrix calculated according to:
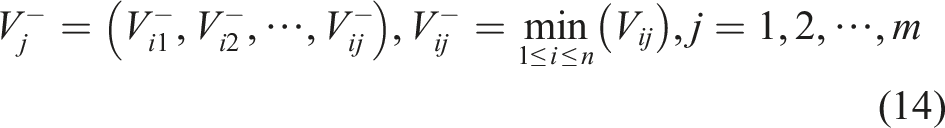
In the weighted normalized matrix, the positive ideal and negative ideal solutions are being determined: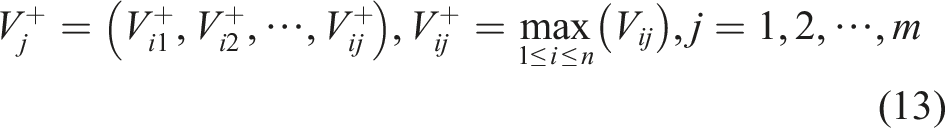
After determining the ideal values, the Euclidean distance, the separation from each positive ideal solution is calculated: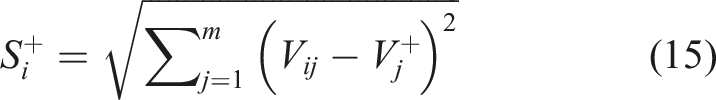
Very similarly, the separation to the negative ideal values are being calculated.
Finally, the performance score for each alternative is calculated: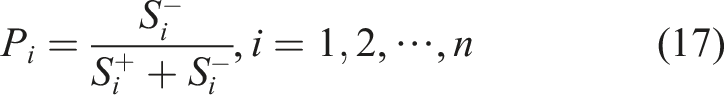
After all the calculations, the
The weights for each criterion given in Table 2 were chosen based on possible applications. The optimal design for RGP and PPP should be as thin as possible, while being effective in the frequency range of 250 Hz–1000 Hz. The designed structures should be installed in existing buildings, so the thickness of the structure is one of the most important parameters regarding the conservation of useable area of the room. Such structures are designed to be used to reduce the sound level in industrial buildings to improve the working conditions. Furthermore, the increase of sound insulation of the walls could reduce the noise pollution in the environment. The decision to prioritize the lower frequency sound absorption and transmission loss was made because these parameters tend to increase with the frequency. Furthermore, higher frequency sound absorption or insulation is usually not an issue in room or building acoustics. Sound absorption is usually linked to the reverberation time in the rooms. The frequencies (250–1000 Hz) chosen for the criteria are often regulated in Europe and other countries (García and Rassmusen).
3. Results and discussion
In this section, the key findings of this study are presented. For simplicity, this section is divided. First, the results of sound absorption and transmission loss are presented, and second, the results of TOPSIS multi-criteria analysis are presented. At the end of the section, the results are discussed and compared with other similar studies.
3.1. Results of sound absorption and transmission loss of PPP and RGP
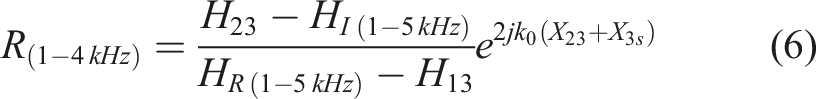
In Figure 4, the sound absorption of the RGP and PPP samples is presented. The RGP (Figure 4(a)) samples showed a sound absorption coefficient up to 0.9. The frequency of the peak sound absorption is determined by the thickness of the sample.
Peak sound absorption is found when the sample thickness is equivalent to 1/8 wavelength. The PPP (Figure 4(b)) panels showed sound absorption coefficient up to 0.97, but in higher frequencies compared to RGP samples. The PPP samples showed an increase in sound absorption when the pore angle was changed. In Figure 4(b), it was found that changing the pore angle not only increases the sound absorption values itself but slightly shifts the effective sound absorption values towards the lower frequencies of the spectrum. Such results can be justified by the change of airflow resistivity of the PPP samples when the pore angle increases (see Table 1). Table 1 provided flow resistivity data gained experimentally. The increases of the pore angle increase the airflow resistivity of the PPP, thus resulting in an increase and shift of sound absorption values towards lower frequencies.
In Figure 5, the results of sound absorption of PPP with RGP are presented. In all cases of RGP thickness, the results show that the sound absorption values increase with the pore angle of PPP. The increase of the pore angle also shifts the sound absorption towards the lower frequency range. As the thickness of the whole sound-absorbing system increases, it was noticed that sound absorption shifts towards the lower frequencies as well. The change in PPP pore angle showed the highest influence on sound absorption when the sound-absorbing system is thinnest (Figure 5(a)). The standard deviation of the average SAC of structures in the measured frequency range was calculated to compare the influence of the PPP pore angle on the sound absorption. Changing the angle of the PPP pores when 12 mm RGP is used, standard deviation was highest – 0.458, when using 22 mm RGP – 0.020; 27 mm RGP – 0.018. The deviation of average SAC decreases as the thickness of RGP increases. Such results indicate that increased thickness of the RGP reduces the importance of the PPP pore angle, which can be justified by the fact that porous sound absorption becomes dominant. Similar results were reported in (Hosseini Fouladi et al., 2010) where the change of perforated panel and porous material position in the structure did not show considerable change in sound absorption (Kuczmarski and Johnston 2011). Sound absorption peak values depend on the characteristic impedance and the thickness of the structure. Influence of the PPP pore angle on the SAC backed with RGP of different thickness. (a) RGP 12 mm thickness; (b) RGP 22 mm thickness; (c) RGP 27 mm thickness.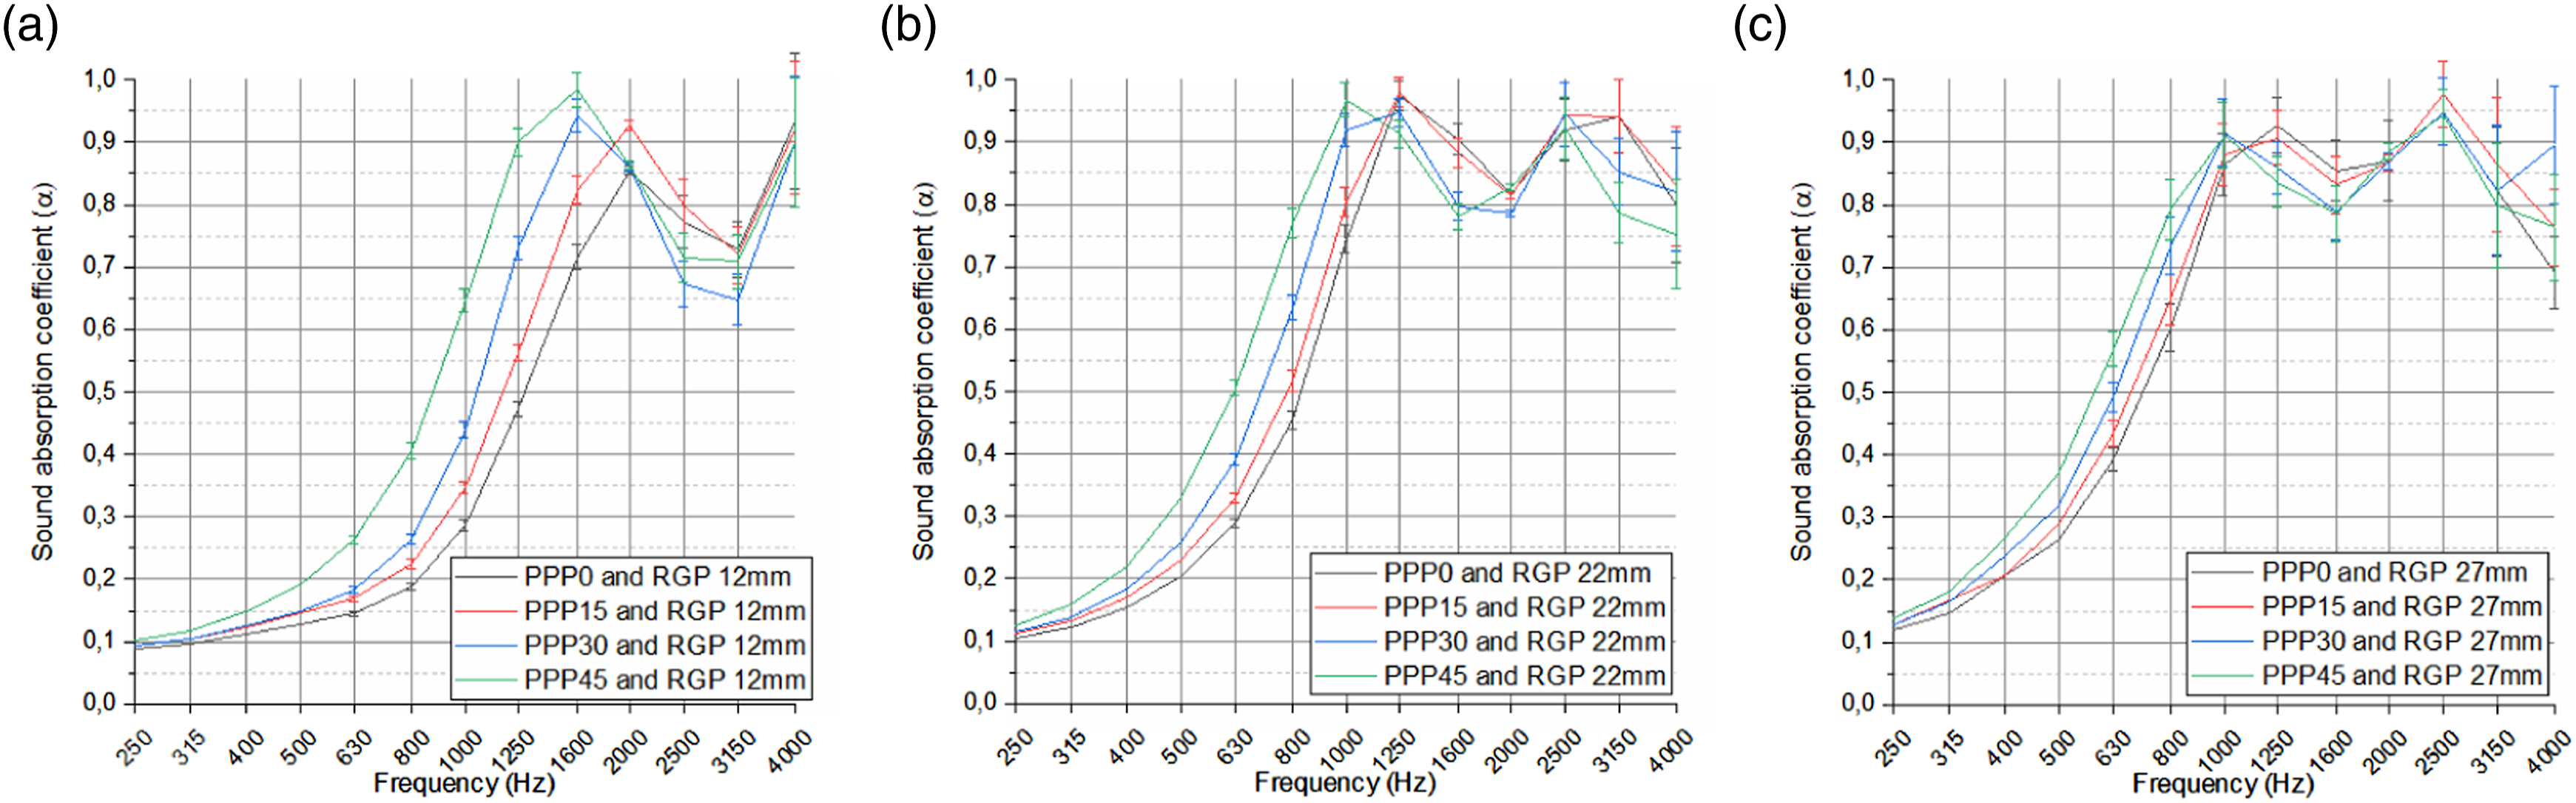
The highest peak SAC reached up to 0.98 within all RGP tested cases. The first peak values of sound absorption were found at 1.6 kHz using 12 mm RGP; 1 kHz – 22 mm RGP; 1 kHz – 27 mm RGP. The first peak frequency corresponds to structure thickness of 1/8 wavelength.
For possible applications, it is important to absorb sound at frequencies lower than 1 kHz with the thinnest material as possible due to the price and weight of the material. The average sound absorption within the frequency range of 250–1000 Hz using 12 mm RGP reached 0.27; 22 mm RGP – 0.44; 27 mm RGP – 0.46. Increase in RGP thickness from 22 to 27 mm (18.5% change) resulted in average sound absorption improvement by 0.02 (8.7% change), while increasing thickness from 12 mm to 22 mm (45.5% change) improved average SAC by 0.17 (38.6%). Such results indicate that the 22 mm thickness of RGP could be the best alternative for sound-absorbing structure design, because 27 mm thickness RGP did not show the performance increase equivalent to the 22 mm RGP.
In Figure 6, the sound transmission loss of RGP and PPP is presented separately. As expected, the results show that sound transmission loss increases with RGP thickness. The sound transmission loss of PPP is increasing with pore angle as well. The values of sound transmission loss of RGP and PPP reach up to 13.4 and 6.2 dB, respectively. Such results can be justified by the fact that the single panel sound transmission (insulation) is mainly defined by the density (mass) of the material. The density of RGP is 1.5 times higher than PPP, which results in higher DTL values. Sound transmission loss of RGP and PPP samples. (a) RGP samples; (b) PPP samples.
STL values increased when PPP combined with RGP (Figure 7). The results show that the DTL values depend mainly on the thickness of the RGP. The STL in all cases increases with the PPP pore angle as well; it is clearly seen when 12 mm thickness RGP is used (Figure 7(a)). When the RGP is thicker, the influence of the PPP pore angle on STL is marginal in the frequency range of 250–1000 Hz, whereas in the higher frequencies, the influence is seen. The lower frequency range sound insulation is justified by the density and thickness of the whole system, which results in marginal differences of STL between the change of PPP in Figure 7(b) and (c) in mentioned frequency range. The drops of STL at frequencies 630 Hz and 1.6 kHz correspond to the resonant and coincidence frequencies of the structure (Isaac et al., 2020). The STL in the higher frequency range increases significantly due to damping when RGP panels are introduced into the system. Such a system could be considered as a double-layer system. The RGP dampens the movement of the PPP panel at higher frequencies, resulting in a sharp increase in STL at frequencies 1–4 kHz. The STL values reach up to 12 dB (PPP45 and RGP 27 mm) in frequency range of 250–1000 Hz and 20 dB (PPP45 and RGP 27 mm) in frequency range of 1–4 kHz. Influence of PPP pore angle on STL with different thickness RGP backing. (a) RGP 12 mm thickness; (b) RGP 22 mm thickness; (c) RGP 27 mm thickness.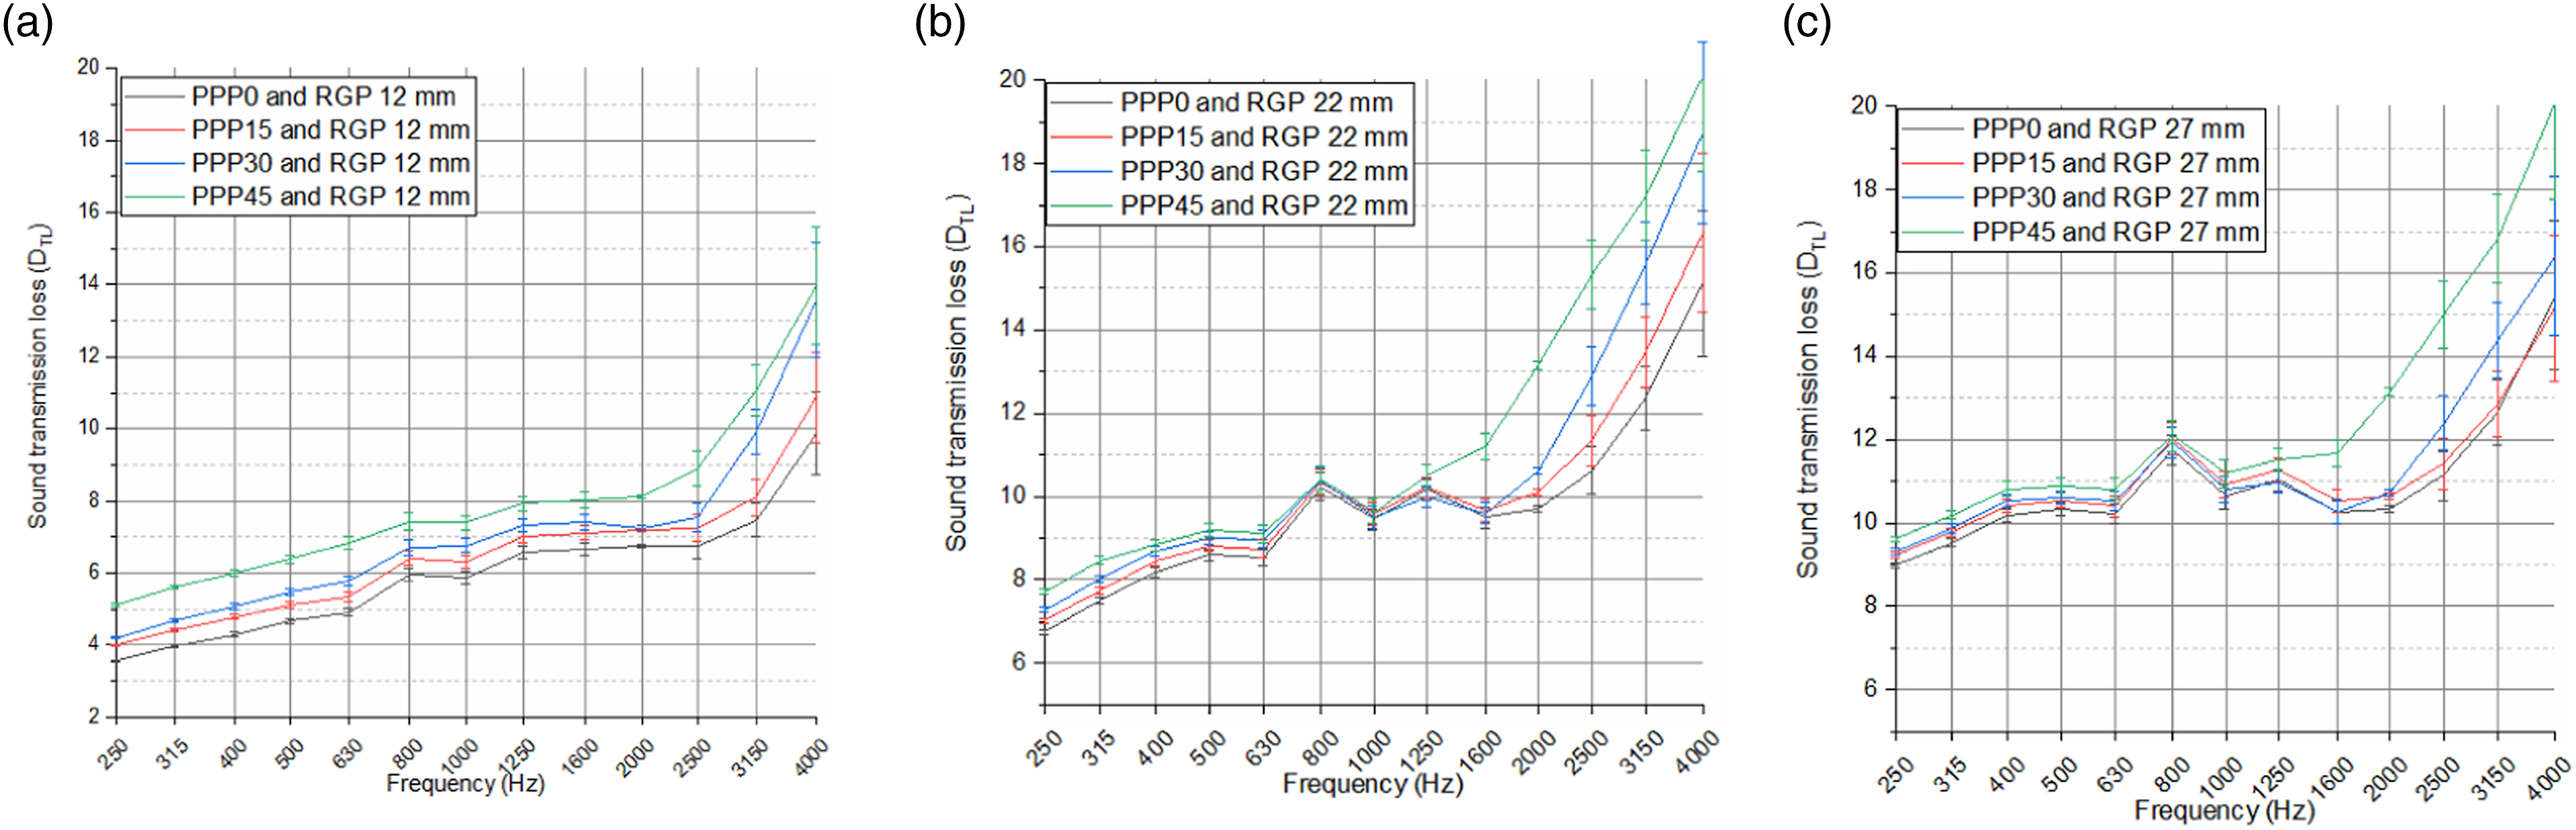
3.2. Multi-criterion analysis using TOPSIS method to optimize the PPP and RGP for applications
To evaluate the sound absorption and insulation of RGP and PPP structures, the TOPSIS multi-criterion analysis was performed. The aim of this optimization was to find the optimal structure for the sound insulation and absorption performance at the same time. Such an optimization is needed for applications in regard to building and room acoustics. While decreasing the reverberation time in rooms (improve the acoustic environment), it also improve the insulation of the walls which are covered with the proposed structure. Since the proposition is to use the structure on the indoor walls, the thickness of the structure becomes significant not only due to environmental aspects but also economical as well. Such covering of the walls could reduce useful area of the rooms. Due to these aspects, the structure is desirable as thin as possible with decent performance of sound absorption and insulation.
Preference order of RGP and PPP structures using the TOPSIS method.
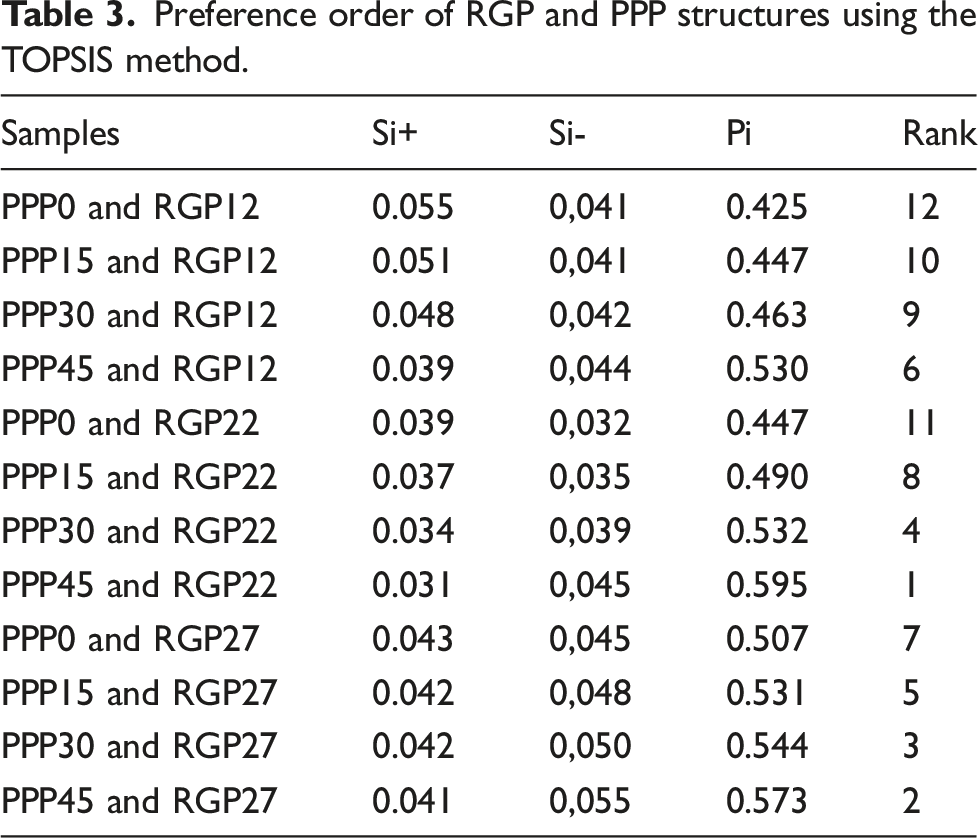
The TOPSIS analysis results show that the optimal structure, when taken into account the thickness of the RGP, is the PPP45 panel with an RGP thickness of 22 mm. The performance gain with extra 5 mm RGP was not enough to make PPP45 with RGP of 27 mm structure optimal, and this structure ranked in the second place. The results of TOPSIS optimization show that most of the samples with RGP 12 mm are ranked lowest, such results indicate that even though the RGP thickness is low, the performance is not enough for application purposes. In all RGP cases, the analysis shows that 45 degree angle of PPP is optimal for sound absorption and insulation.
There are numerous studies on the rubber granule applications for sound absorption and insulation. Most previous studies mixed recycled rubber granules with other materials such as concrete or other materials (Najim and Hall 2010; António et al., 2018; Wang and Du 2020; Bala and Gupta 2021). These results cannot be directly compared with the results obtained in this study, but the mentioned studies show that the recycled tyre granule increases the sound absorption of concretes. The acoustic properties of RGP are quite well known. The main factor that could affect the results of sound absorption results is the binder. In Asdrubali et al., 2008a, rubber crumbs were bind with epoxy glue and the average sound absorption reached (21 mm thickness) 0.48. In this study, polyurethane resin RGP panels show average sound absorption of 0.38 (RGP22).
Few studies have been conducted on sandwich structures with perforated and micro-perforated panels (MPP) backed with RGP. Most of them use straight perforation or micro-perforation. In Li et al., 2020, MPP is used between two layers of rubber to improve the sound absorption of the RGP. Such structures reach sound absorption up to 0.9 around 5 kHz. In the case of this study, the peak sound absorption reached 0.98 at 2.5 kHz, but the sound-absorbing system was slightly thicker. The sound absorption of perforated panels backed with RGP is not investigated deeply; usually MPP or PP is backed with fibrous materials (Bravo and Maury 2018; Beheshti et al., 2021). Such approach is considered more traditional.
4. Conclusions
In this paper, we proposed the sound-absorbing and sound insulating structure for sound absorption and insulation applications. PPP pore angle tilting could not be achieved without 3D printing technologies. The other methods to produce such panels would be less accurate or time-consuming, which would result in problems in acoustic properties characterization of PPP. The proposed layered structure consists of PPP and RGP, which, under production conditions, could be made only using plastic and tyre waste. In the future, we suggest using proposed structures to reduce the sound level in industrial buildings to improve the working conditions. Furthermore, the increase of sound insulation of the walls could reduce the noise pollution in the environment.
The sound absorption values increase with the PPP pore angle and RGP thickness. In all measured cases, the highest sound absorption was found when the PPP 45° pore angle was used. These results could be justified by the fact that the pore angle increment increases the airflow resistivity and ultimately the tortuosity of the PPP. Also, PPP pore angle increment shifts sound absorption values toward a lower frequency range, which is important for applications. Such behaviour is determined by the tortuosity increase of the PPP. The peak values of sound absorption were found at 1.6 kHz using 12 mm RGP; 1 kHz – 22 mm RGP; 2.5 kHz – 27 mm RGP.
The sound transmission loss values increase with PPP pore angle and RGP thickness. In all measured cases, the highest sound transmission loss values were found when PPP 45° pore angle was used. The highest values of sound transmission loss were found when PPP45 + RGP 27 mm structure was used. The STL values reach up to 12 dB (PPP45 and RGP 27 mm) in frequency range of 250–1000 Hz and 20 dB (PPP45 and RGP 27 mm) in frequency range of 1–4 kHz.
To compare the different combinations of RGP and PPP structures, a multi-criteria analysis using TOPSIS method was performed. Twelve different design and thickness PPP and RGP structures were ranked according to the selected criteria. The thickness of RGP, SAC and STL weighted as a criterion. The results of the multi-criteria analysis showed that the optimal structure for a possible application is PPP45 + RGP 22 mm, which was ranked highest of all alternatives. Based on the optimization results, the future studies will focus solely on the highest ranked structure alternative.
In this paper, we only focused on such structures acoustic properties. The results show promising results for sound absorption applications in the future. In the future studies, the focus will shift towards the acoustic parameters of large-scale prototypes for diffuse sound absorption and insulation testing as well as mechanical and thermal properties characterization.
Footnotes
Author contributions
Conceptualization: Tomas Januševičius, Tomas Astrauskas, Raimondas Grubliauskas; Methodology: Tomas Astrauskas, Tomas Januševičius; Formal analysis and investigation: Tomas Astrauskas, Raimondas Grubliauskas; Writing-original draft preparation: Tomas Astrauskas; Writing review and editing: Tomas Januševičius, Raimondas Grubliauskas; Resources: Tomas Januševičius, Raimondas Grubliauskas; Supervision: Tomas Januševičius
Declaration of conflicting interests
The author(s) declared no potential conflicts of interest with respect to the research, authorship, and/or publication of this article.
Funding
The author(s) received no financial support for the research, authorship, and/or publication of this article.