
Abstract
In this paper, a novel statistical vibration-based damage detection method is developed considering uncertainties in measured resonance frequencies. The proposed method is based on the application of resonance frequencies as the most accurate and easiest measurable vibration feature. For proof of efficiency of the proposed method, case studies were undertaken using two identical composite plates, one delaminated and the other pristine. In this respect, the frequency response functions (FRFs) were measured and used as the main input to the Resonance Detection Algorithm as the proposed method. Applying these FRFs to a Resonance Detector Function can determine the resonant frequencies and their statistical distribution. Through the statistical distributions of the corresponding resonant frequencies, their reliability of detecting damage has been obtained via the beta distribution. By observing the damage detection reliability of the two sets of corresponding resonant frequencies, it has been determined that the changes in natural frequencies are due to structural changes and not random errors through measurement.
Keywords
1. Introduction
As the use of composite materials in aircraft structures is now widespread, a greater need exists to determine the safety of aircraft structures subject to accidental damage. Foreign object damage (FOD), ground vehicle collisions and lightning strikes are but a few examples of accidental damage an aircraft structure can face during its operational lifetime. By using different monitoring approaches, the structural failure risks associated with accidental damage events can be assessed quantitatively, allowing aircraft manufacturers, operators and flight certification authorities to better evaluate and predict the damage tolerance and safety of an aircraft structure (Huang and Lin, 2005).
As one of the oldest non-destructive testing (NDT) and NDE techniques, vibration-based methods have been studied extensively for damage detection. Considerable effort has been put into vibration-based methods, which utilize the vibration response of the monitored structure to assess its condition and identify structural damage. Meanwhile, with emerging computing power and sensing technology in the last decade, machine learning (ML) and particularly deep learning (DL) algorithms have become more feasible and extensively used in vibration-based structural damage detection with elegant performance and often with high accuracy (Avci et al., 2021).
Vibration-based health monitoring (VHM) methods are either global or local NDT methods, based on the chosen features, which are based on the fact that any changes introduced in a structure (including damage) or its boundary conditions change its physical properties, and this in turn changes the structural vibration response. For most applications, VHM is applied using the modal characteristics of the structure and especially its lower resonant frequencies, which are easy to measure from experiment (Doebling et al., 1998; Hu et al., 2001; Trendafilova et al., 2008; Trendafoilova et al., 2009; Verboven et al., 2002). This method is not as costly as traditional procedures and can be done with relative computational and logistical ease. Some of the modal characteristics of interest are insensitive to changes in environmental conditions such as temperature. This has made VHM based methods highly desirable.
Cawley and Adams used natural frequencies for the detection and localization of damage, as the resonance frequency is deemed to be the easiest and most accurate modal parameter to measure. There are however limitations within resonant frequency–based VHM. There have been extensive studies indicating the modal frequencies to have low sensitivity to lower levels of damage (Doebling et al., 1998; Sundaresan et al., 2003; Trendafilova et al., 2008; Trendafoilova et al., 2009; Trendafilova, 2005). The curvatures of the mode shapes present a further alternative for damage assessment, but they are difficult to calculate and their estimate from data may involve substantial inaccuracies (Doebling et al., 1998; Hu et al., 2001; Sundaresan et al., 2003; Trendafilova et al., 2008; Verboven et al., 2002). The low sensitivity will result in a small difference between the natural frequencies of pristine and damaged structures which may be masked and passed as measurement error.
For VHM, a method proposed by Gillich (Nobari and Aliabadi, 2018) increases the accuracy of Resonance Detection (RD) significantly. Hence, small shifts in resonant frequencies can be accurately accounted for. This is of great importance since these shifts could have occurred due to the existence of structural abnormalities such as damage. The method however does not provide any measures as to the reliability of the identified resonance frequency and its variation from one measurement point to others. Furthermore, there are many uncertainties in the damage identification procedure such as the measurement noise.
Since the uncertainties inevitably exist in the measured/processed data, statistical methods which consider the uncertainty are studied extensively. Both model- and data-based methods in both time and frequency domains are used for this purpose. Based on the ARX model of the time signal, the standard deviation of the residuals of the ARX model and its distribution was used as the damage-sensitive feature (Zhang, 2007). An ARMA model was applied to time signal, and the first three AR components were used as the damage-sensitive feature (Nair et al., 2006). A model-based statistical SHM method was proposed by Mao et al. (2018) based on dynamic response sensitivity in state-space domain. The probability of damage existence for each structural element is estimated using the statistical characteristic of the identified structural parameters.
In this paper, the method proposed by Gillich (Zhang, 2007) has been extended to a statistical method, based on which, statistical distribution and reliability indices can be assigned to the measured resonance frequencies which can be subsequently used in a damage detection process.
2. Statistical resonance detector
The main challenge with detecting resonance frequency, and hence its change, is the measurement accuracy involved. As such, a method known as Statistical Resonance Detector (SRD) is proposed. The main goal of an SRD is to increase the accuracy of RD and providing a statistical description of its reliability for damage detection. In this respect, increasing sampling time and hence resolution of the frequency domain data is an obvious choice. However, due to the nature of the discrete Fourier transform (DFT), increasing the sampling time will not result in lower random error (Newland, 2005). Furthermore, other DSP features such as leakage worsen the accuracy, and as shown by Gillich (Nobari and Aliabadi, 2018), even with higher resolution one can still find a more accurate measure of the resonant frequency, using the RD technique explained below.
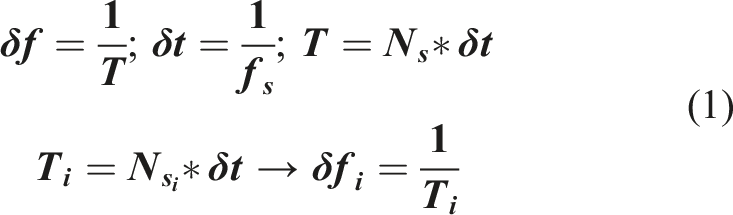
To reduce random error, the normal practice in signal processing is to use the average of multiple measurements of FRFs, all taken with the same frequency resolution. Even with averaging, other features of DSP such as leakage will result in the variations in resonance frequencies from measurement to measurement. The RD technique as proposed by Gillich (Nobari and Aliabadi, 2018) is based on calculation of the frequency response functions (FRFs) using different frequency resolutions, hence having multiple measures for the resonant frequency, that is
In this work, instead of fitting a curve to the various measures of a resonance frequency, its statistical distribution is calculated. In this respect, the PDF of each resonance frequency distribution is calculated for pristine and damaged structures, covering the range of possible measures and probability of their occurrence of each resonant frequency for the two structures. Subsequently, reliability of damage detection through the difference of their resonant frequencies is calculated by examining possible true/false positive and true/false negative percentage, as seen in Figure 1. Distribution of 1st resonant frequency of an undamaged and damaged structure.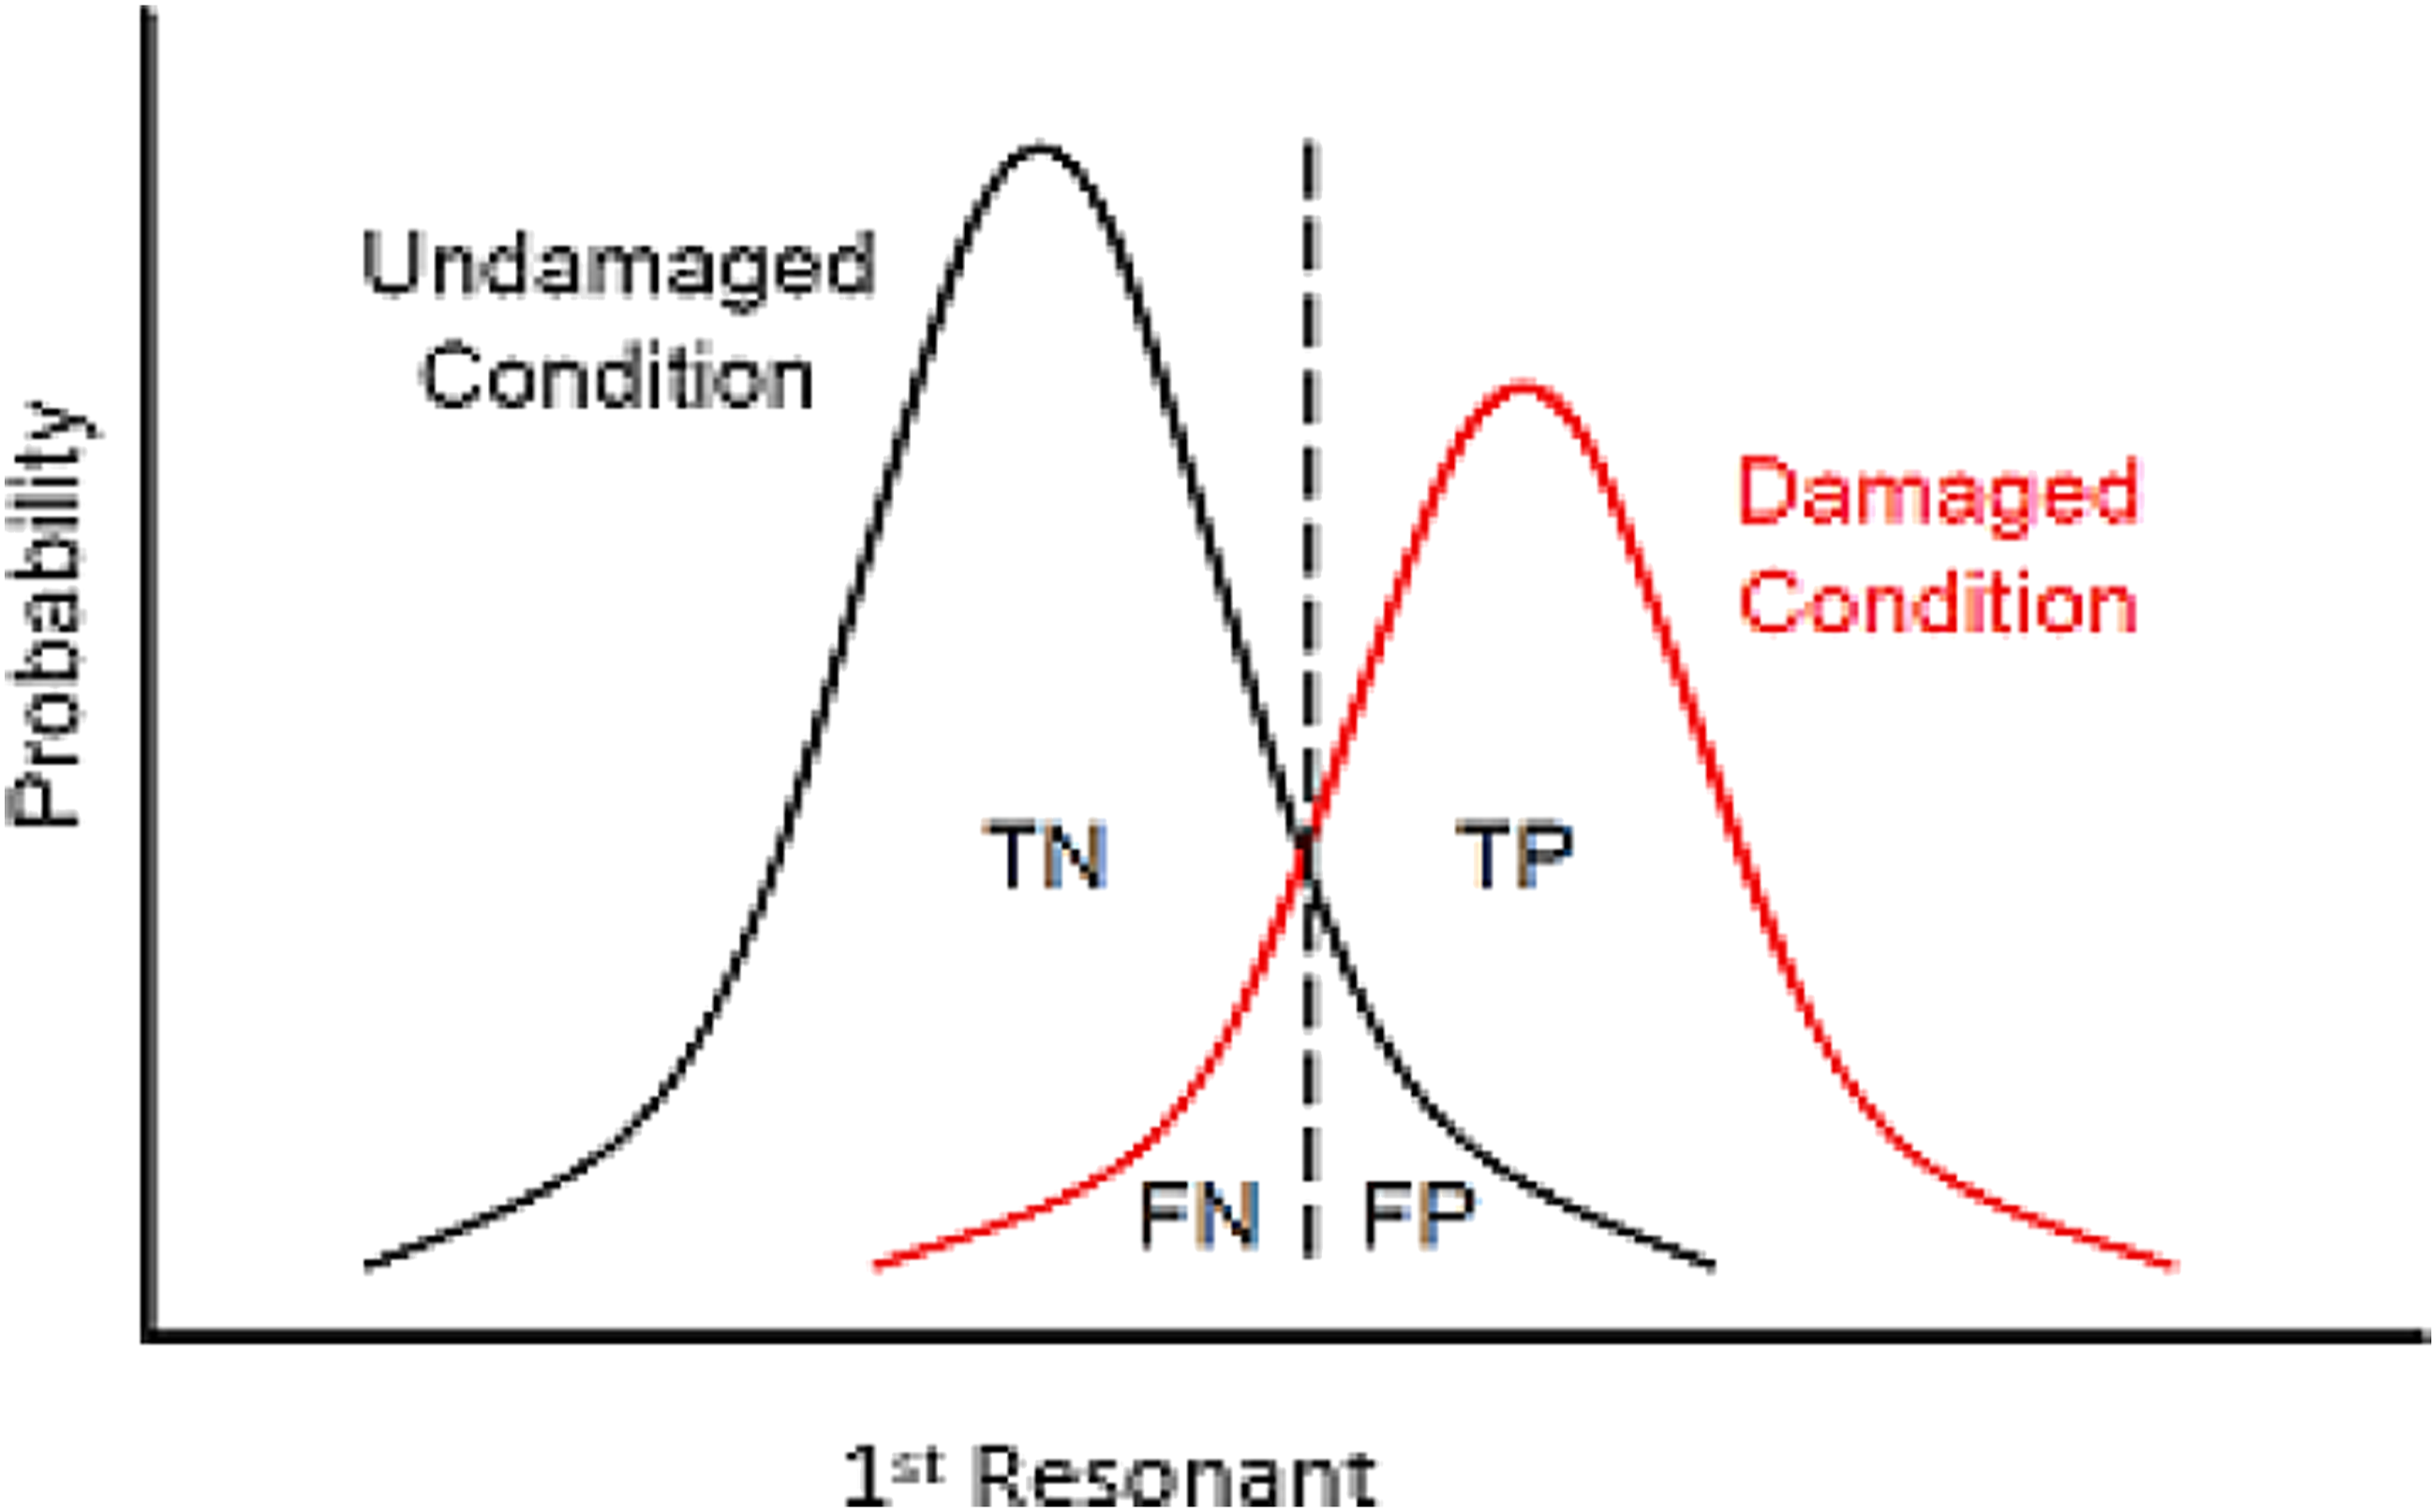
TN (true negative) and TP (true positive) represent the area under the PDF graph of the two structures, and FN (false negative) and FP (false positive) represent the overlapping area of the undamaged and damaged structures, respectively. It is desired that the overlapping area between the two PDFs be minimal since it implies certainty and reliability of the SRD technique.
The process is repeated for
3. Mode indicator function (MIF)
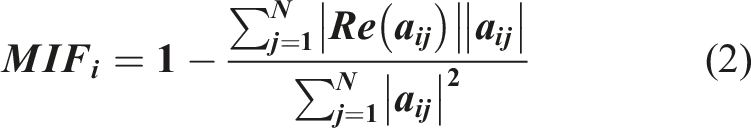
As discussed, an SRD is heavily dependent on the statistical distributions of the corresponding resonance frequencies of the pristine and damaged structures. Two issues must be addressed, namely, (i) which resonances are of significance with high signal to noise ratio across all measured FRFs and (ii) how the corresponding modes can be found without resorting to elaborate experimental modal analysis (EMA) techniques. The first issue is efficiently addressed by the application of the MIF. There are different types of MIF, but all of them are calculated using FRFs measured at
4. Modal assurance criteria (MAC)
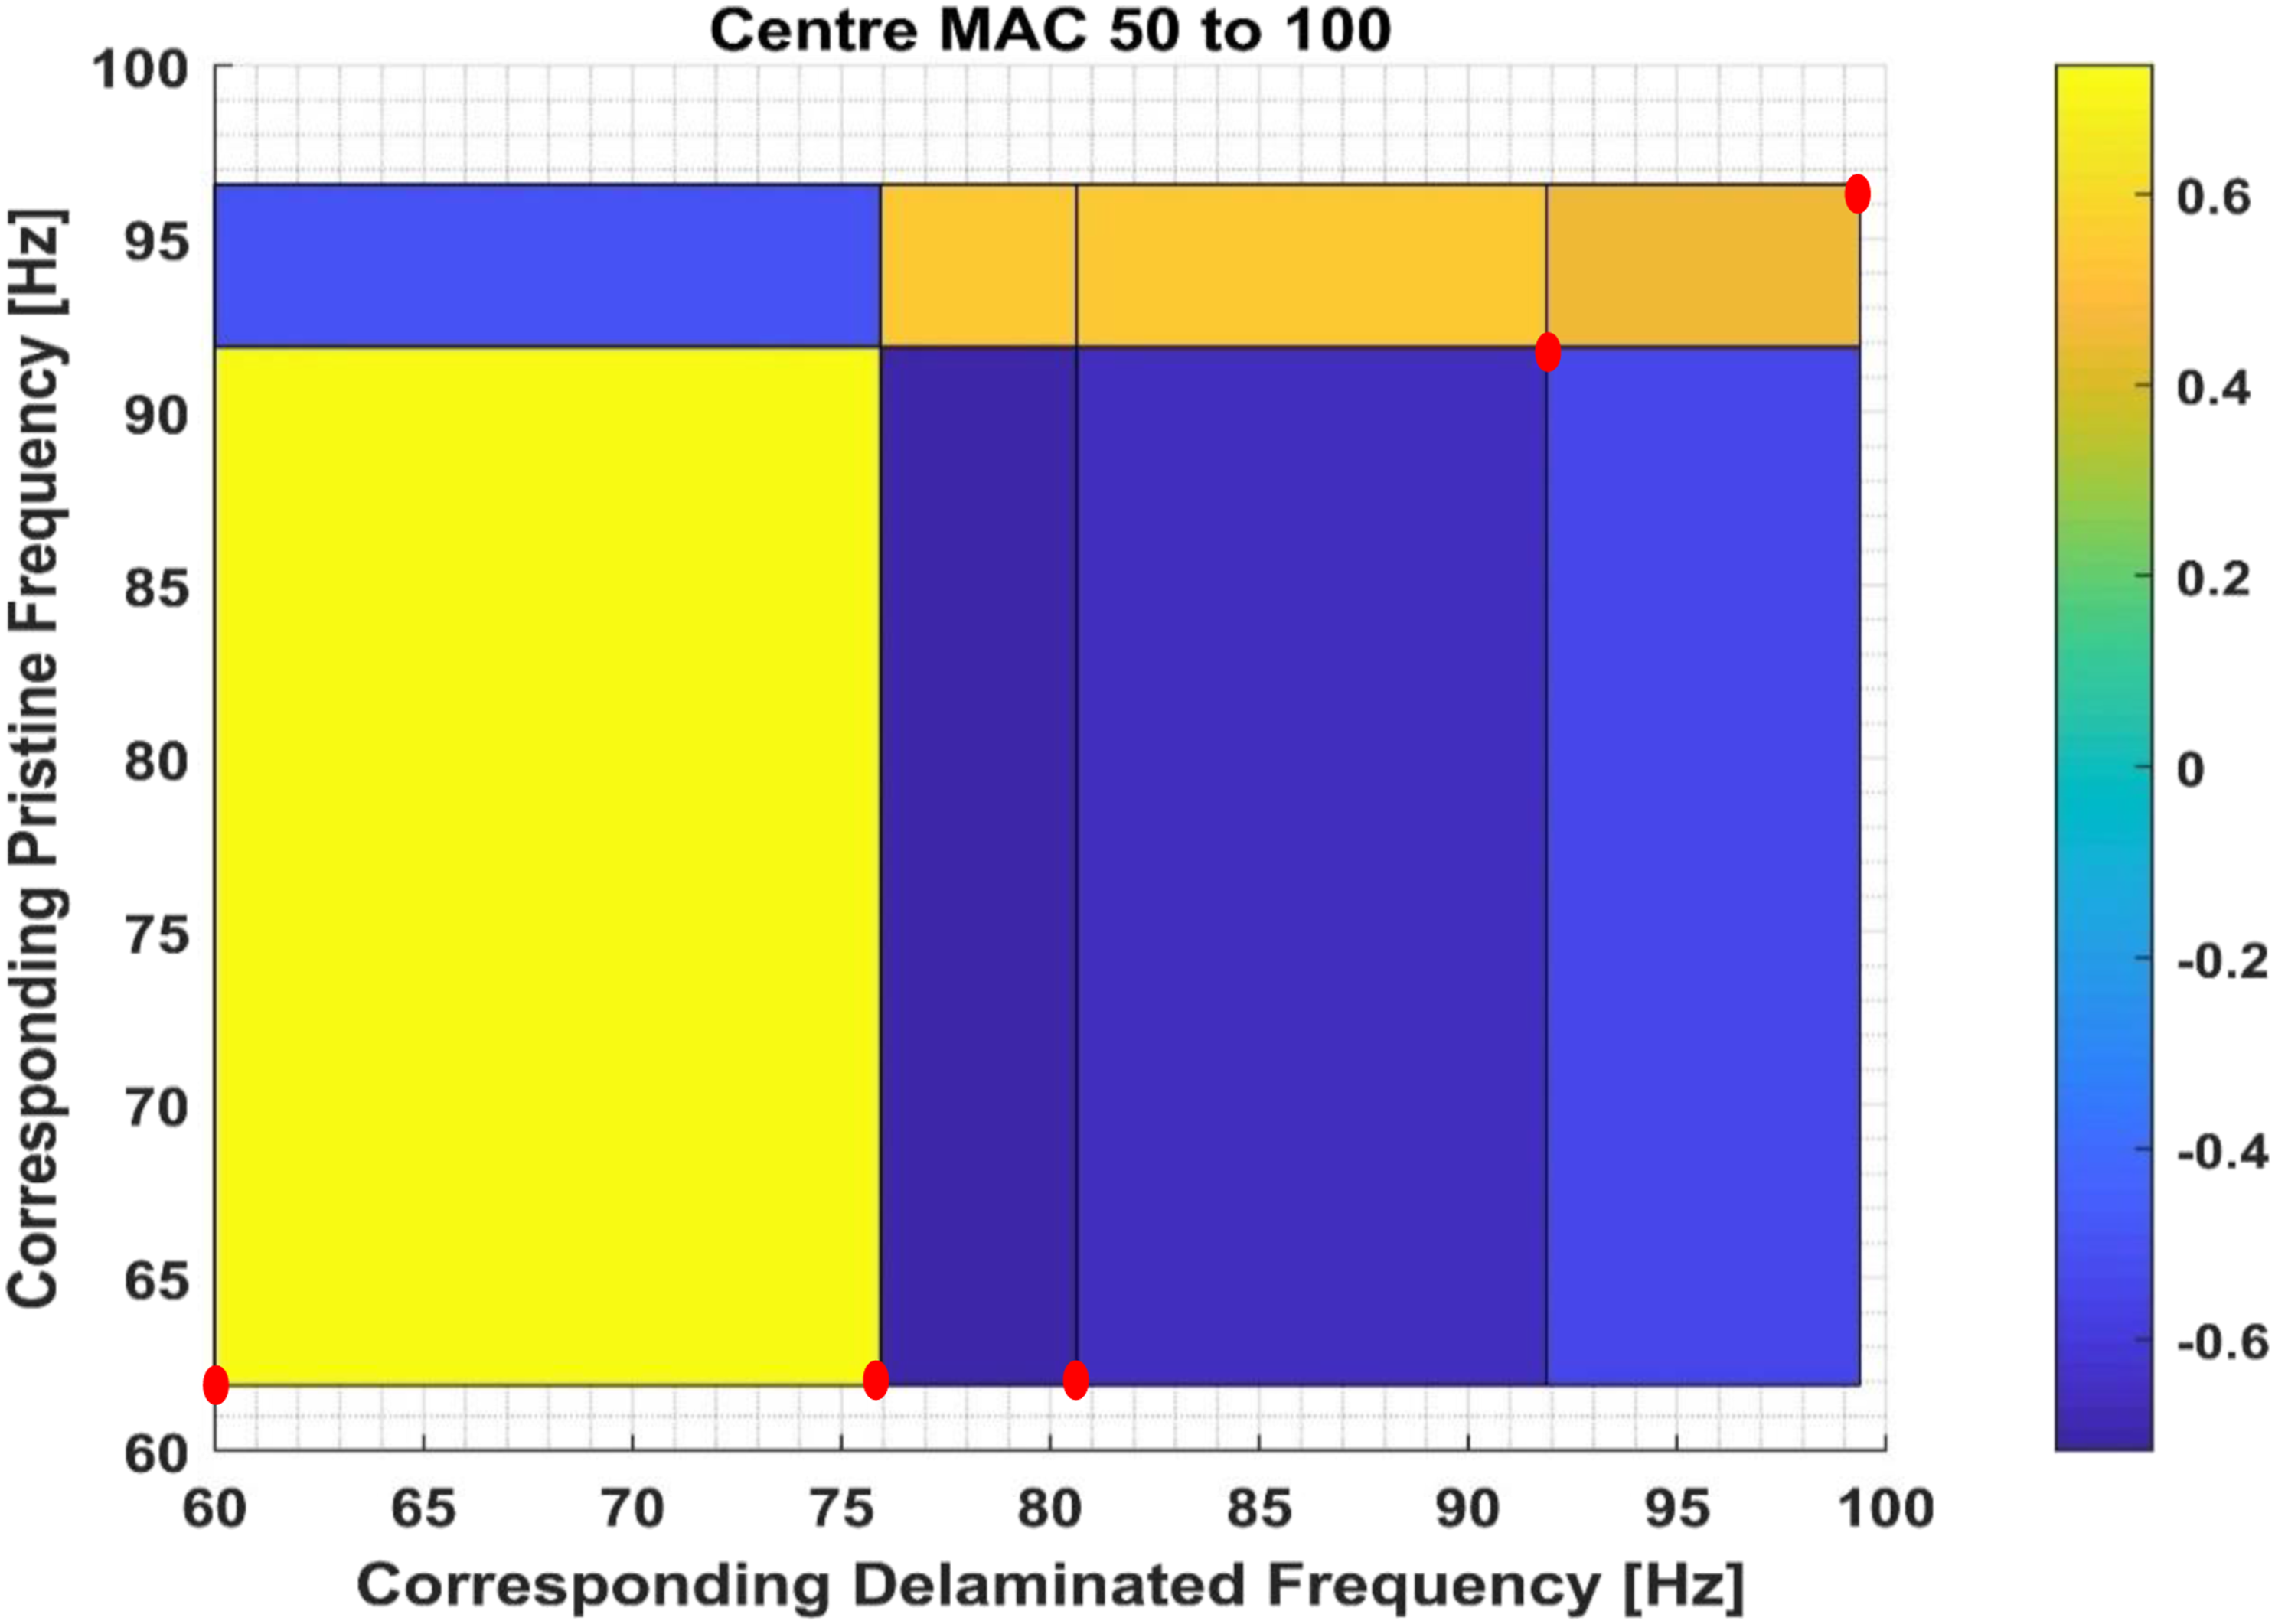
In order to identify which frequencies correspond to one another across multiple structures, a type of correlation function known as MAC can be used. This robust pairing criterion is a statistical indicator based on the covariance matrix of various modes of the two structures. This provides a robust indicator for pairing the corresponding modes between two structures. As the MAC considers only mode shapes, it can be misleading when it is applied to higher modes, if enough spatial resolution is not considered in FRF measurements. It is easy to apply and does not require an estimate of the system matrices. It is bounded between 0 and 1, with 1 indicating fully consistent mode shapes. It can only indicate consistency and does not indicate validity. A massive advantage of MAC is its independence of environmental conditions such as temperature. A value near 0 indicates that the modes are not consistent (Pastor et al., 2012). The MAC is calculated as the normalized scalar product of the two sets of vectors
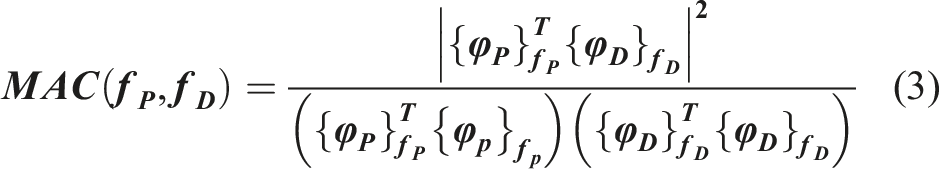
As the mode shapes can be scaled arbitrarily, to emphasize the imaginary components of the FRFs, complex plane rotation is applied to mode shapes, in order to minimize their real components.
Now, the corresponding resonant frequencies can be compared to one another for damage detection and reliability analysis. This task has been undertaken by the statistical approaches in the next section.
5. Resonance frequency distribution and reliability indices
The results from the SRD include the resonance frequencies mean values, standard deviations and PDFs for each point of measurement. So, if there are No measured FRFs, No number of such distributions will be available. The PDFs of the identical measurement points on the pristine and delaminated plates can be compared and the reliability of their resonant frequencies difference can be assessed based on their overlapping area for each measurement point. It is desired that the overlapping area of the two PDFs be minimal since it implies that the difference between resonance frequencies of the two plates is due to structural differences and not measurement errors. For each measurement point, a reliability index is defined based on the overlapping area of the PDFs and hence No reliability indices. The distribution of the reliability indices is examined through the β distribution, and a 90% reliability is defined as a target for reliable damage detection.
The β distribution is a continuous probability distribution defined in the interval of [0, 1]. This makes it highly desirable for the purpose of using it as a reliability index. Parameterized by two positive parameters α and β, appearing as exponents of the random variable that control the shape of the distribution (Sarhangian et al., 2008), a higher α and lower β is desired. A sample of the resulting distributions is shown in Figures 7 and 8.
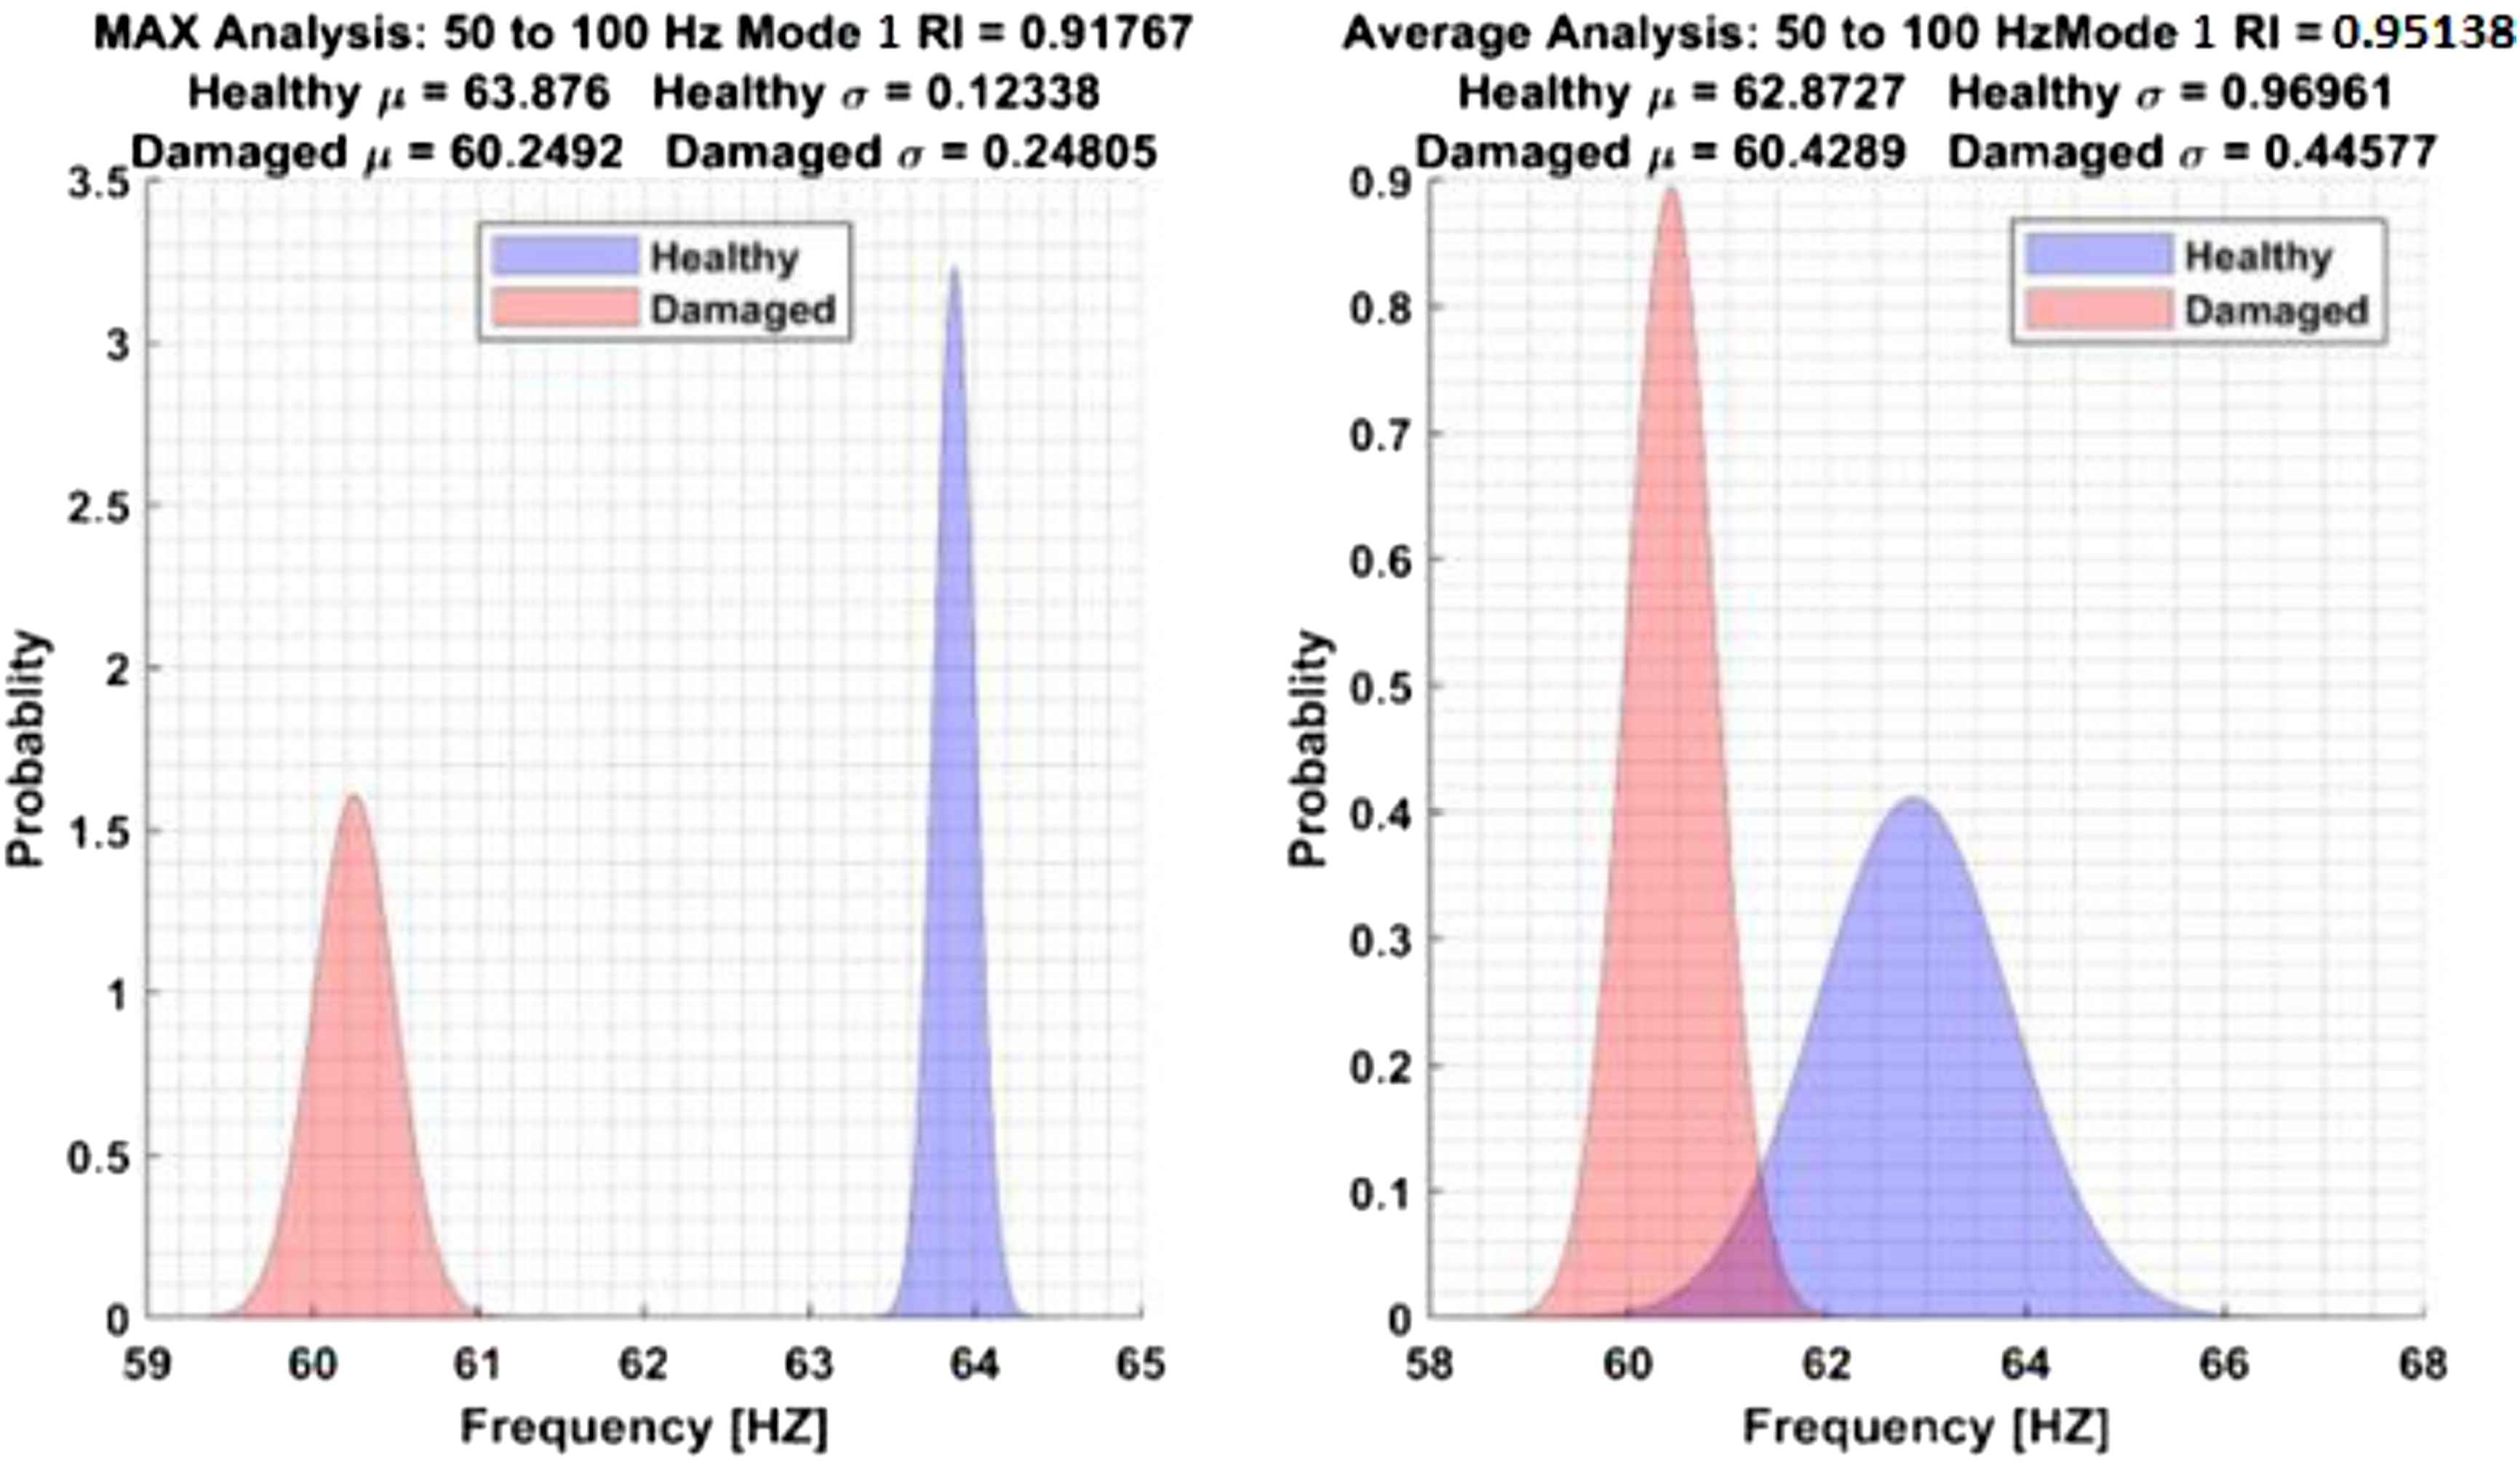
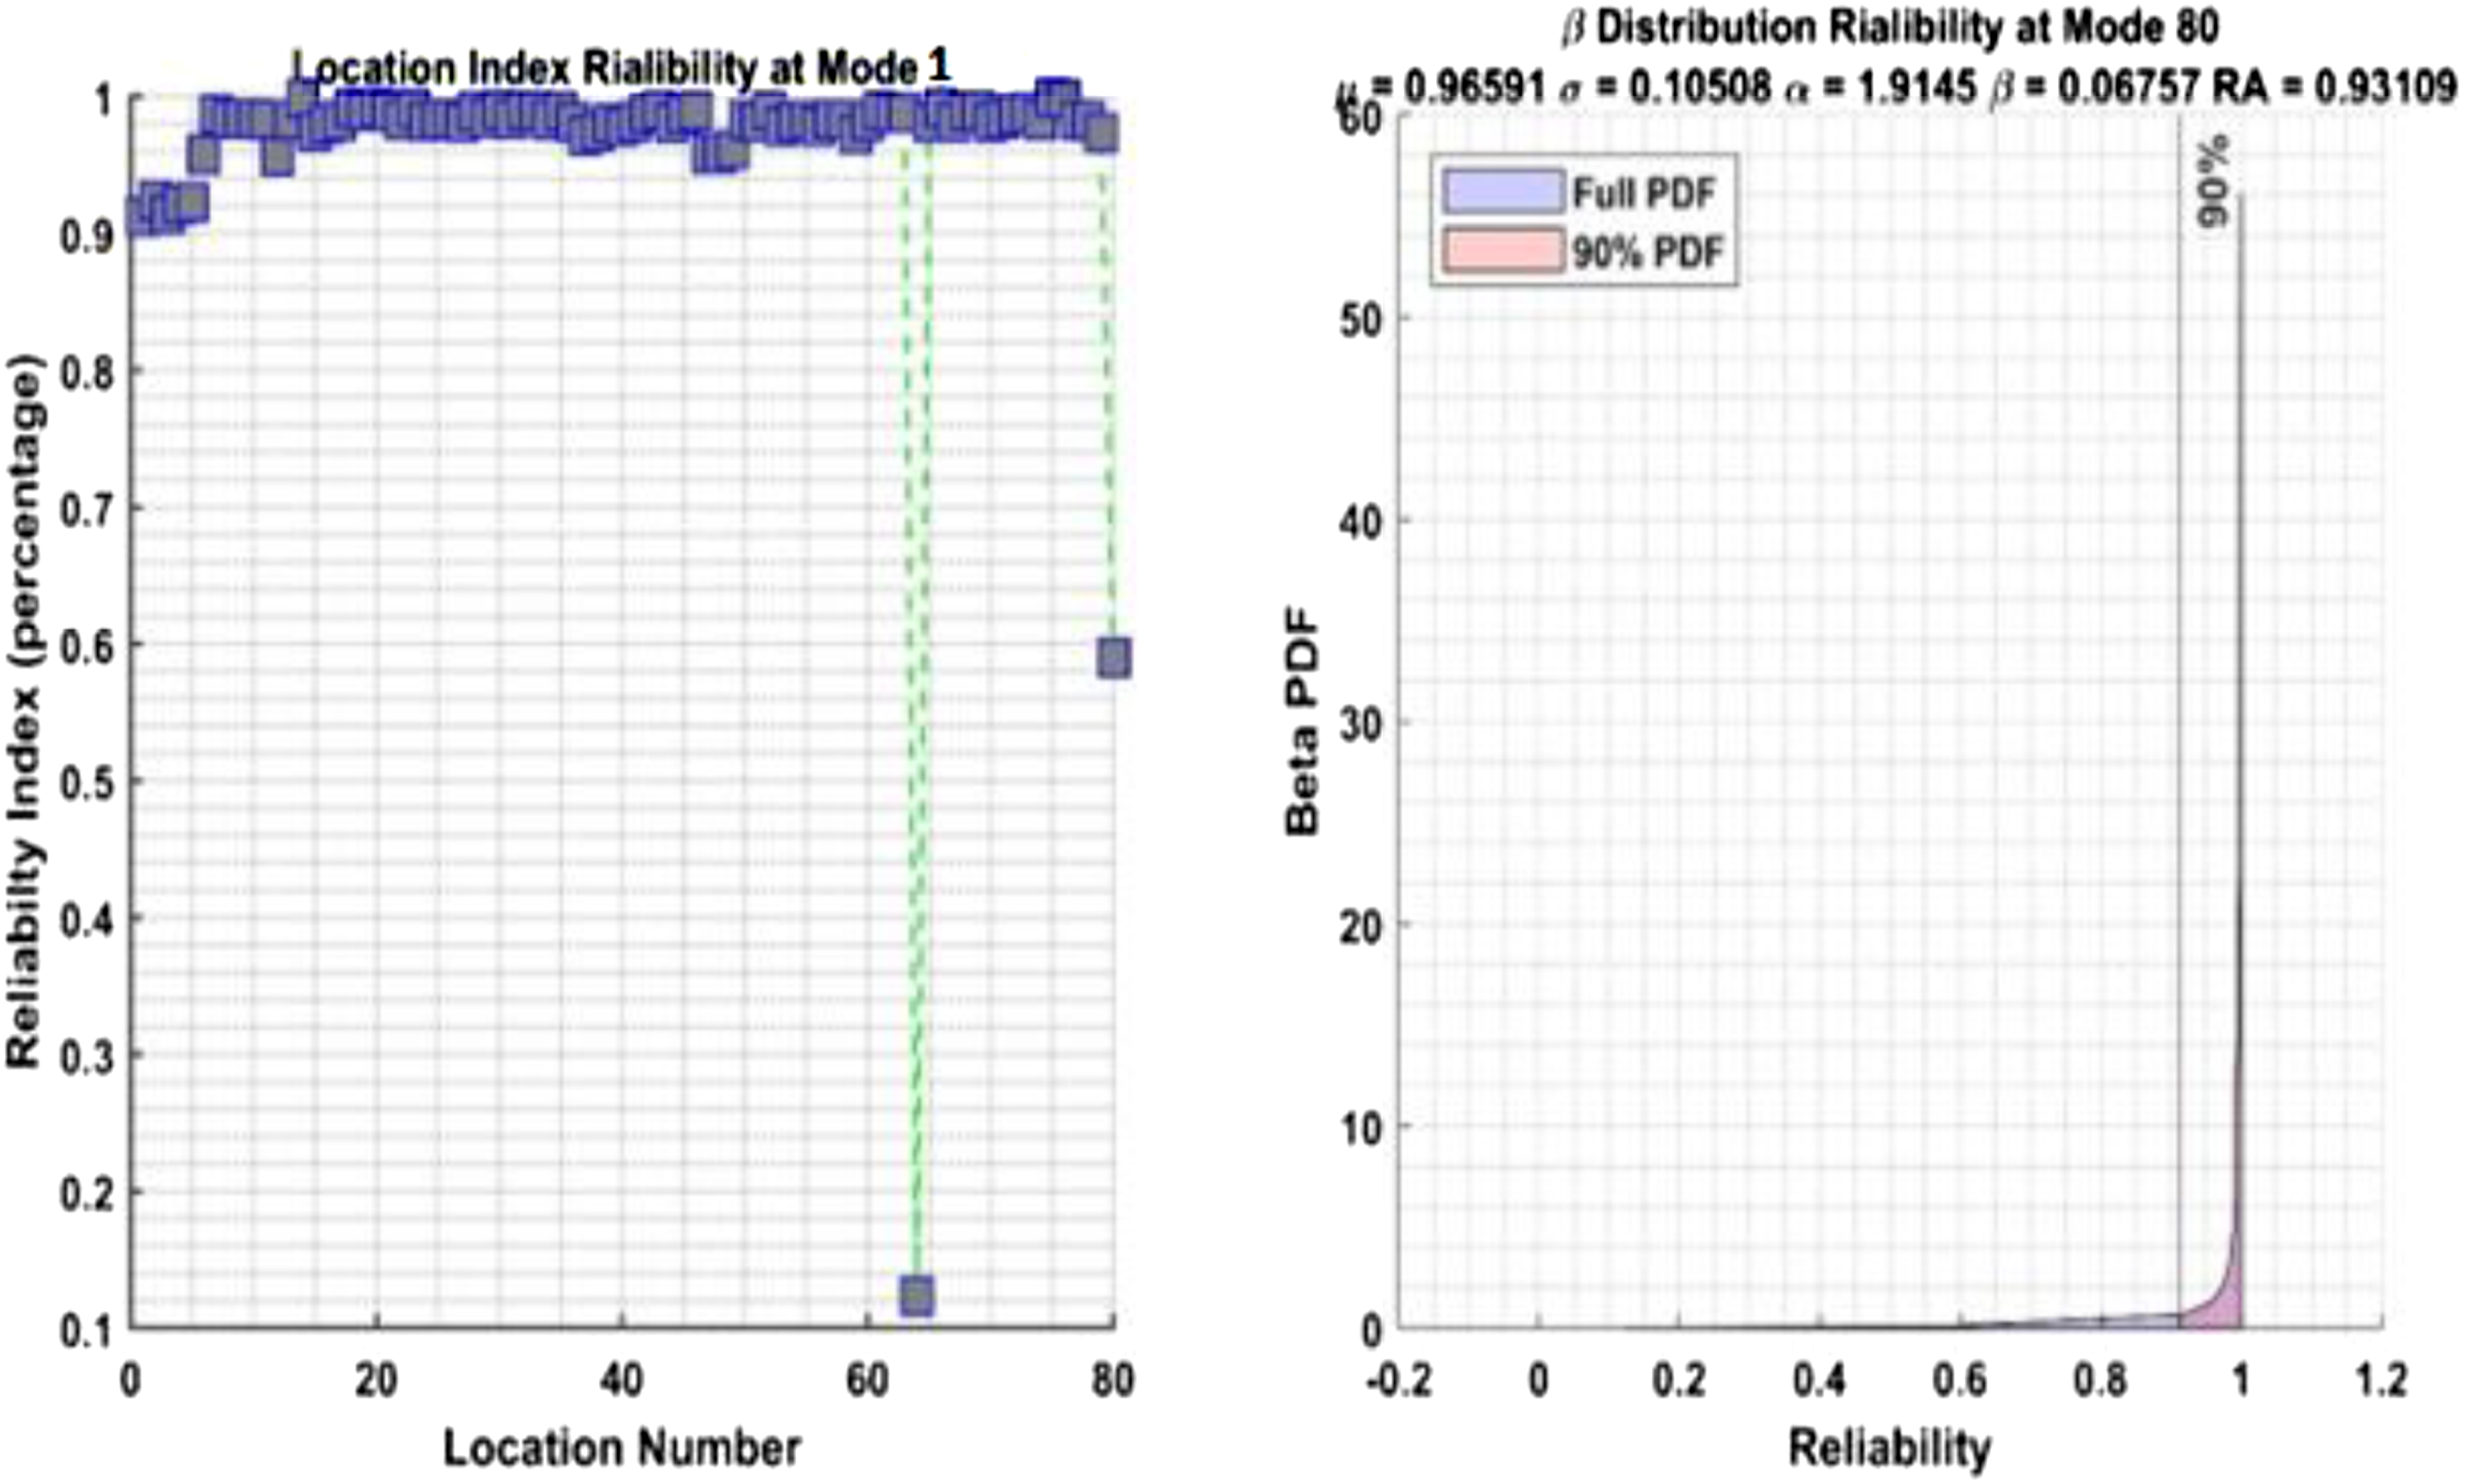
Figure 7 shows the PDFs for the resonance frequencies for Mode 1 throughout the entire body of the structure. The left graph in Figure 7 utilizes the resonance frequency with the maximum amplitude found for each point, designated as MAX analysis, while the one on the right utilizes the average resonant frequency for the entire measurement points, designated as AVG analysis. As can be seen, the reliability for the MAX analysis is 0.92, indicating high reliability throughout the structure. To examine the point-to-point variation of reliability, this quantity is calculated for each measurement point, result of which can be seen in Figure 8. The left graph in Figure 8 represents the ratio of the total area to non-overlapping area of the PDFs of the two plates at each measurement point. Applying the β distribution analysis to reliability values at each point results in the right graph where the reliability index is shown to be at 0.93. All the necessary building blocks of the SRD approach have been introduced and discussed. The following section summarizes the SRD approach with all its components.
6. Case study
The components for damage detection and reliability analysis are summarized as shown in Figure 2. The steps for damage detection and reliability analysis are shown.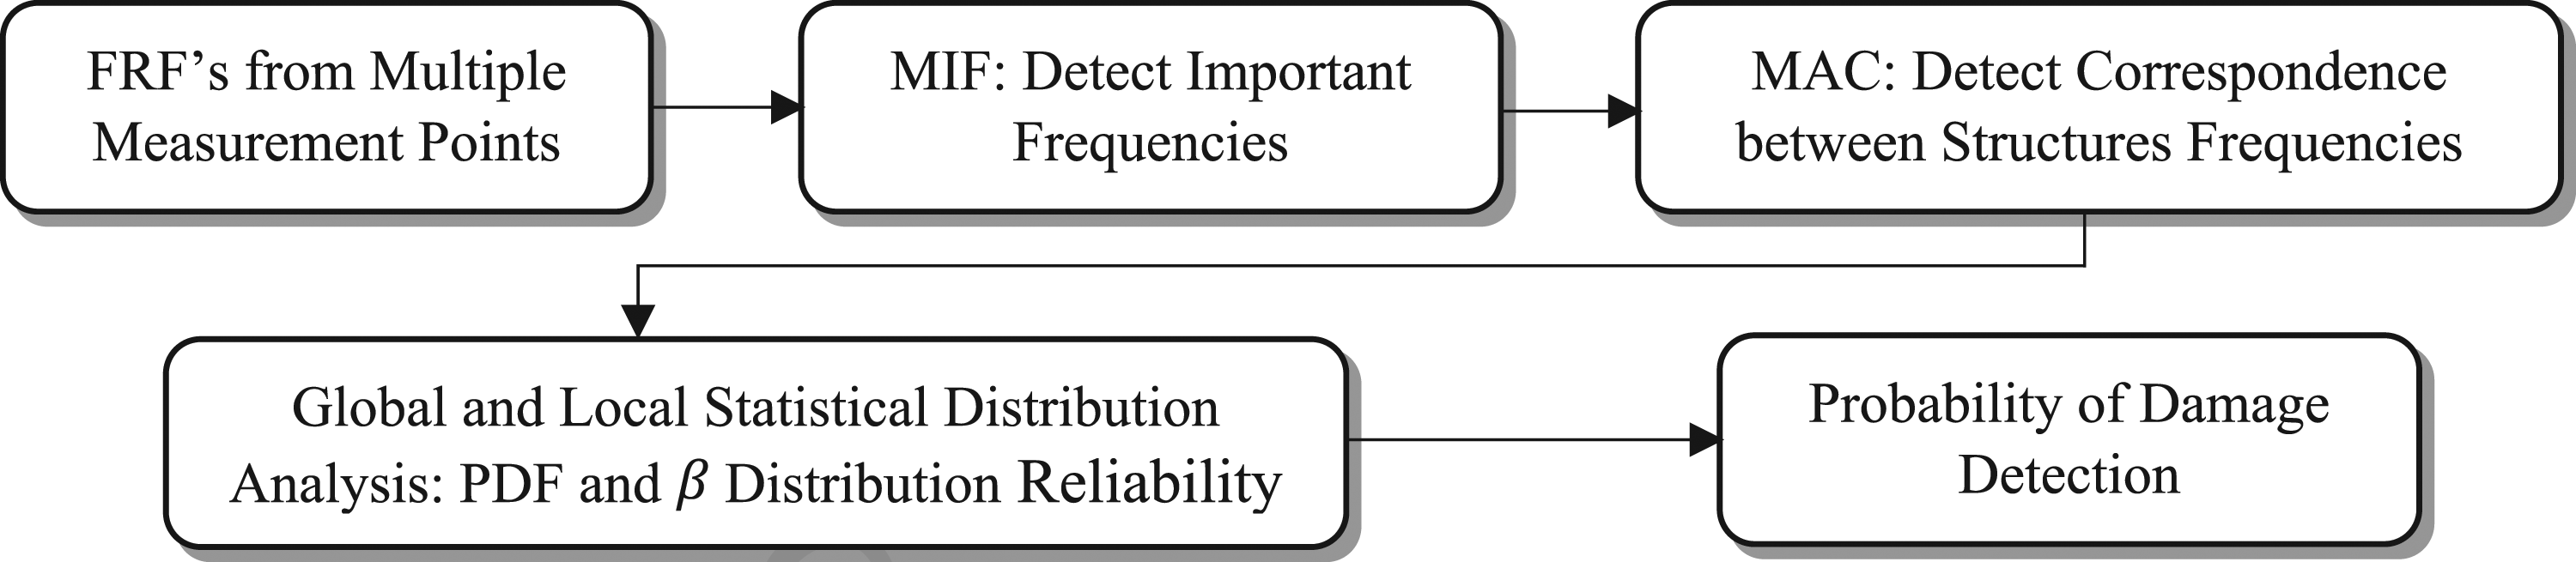
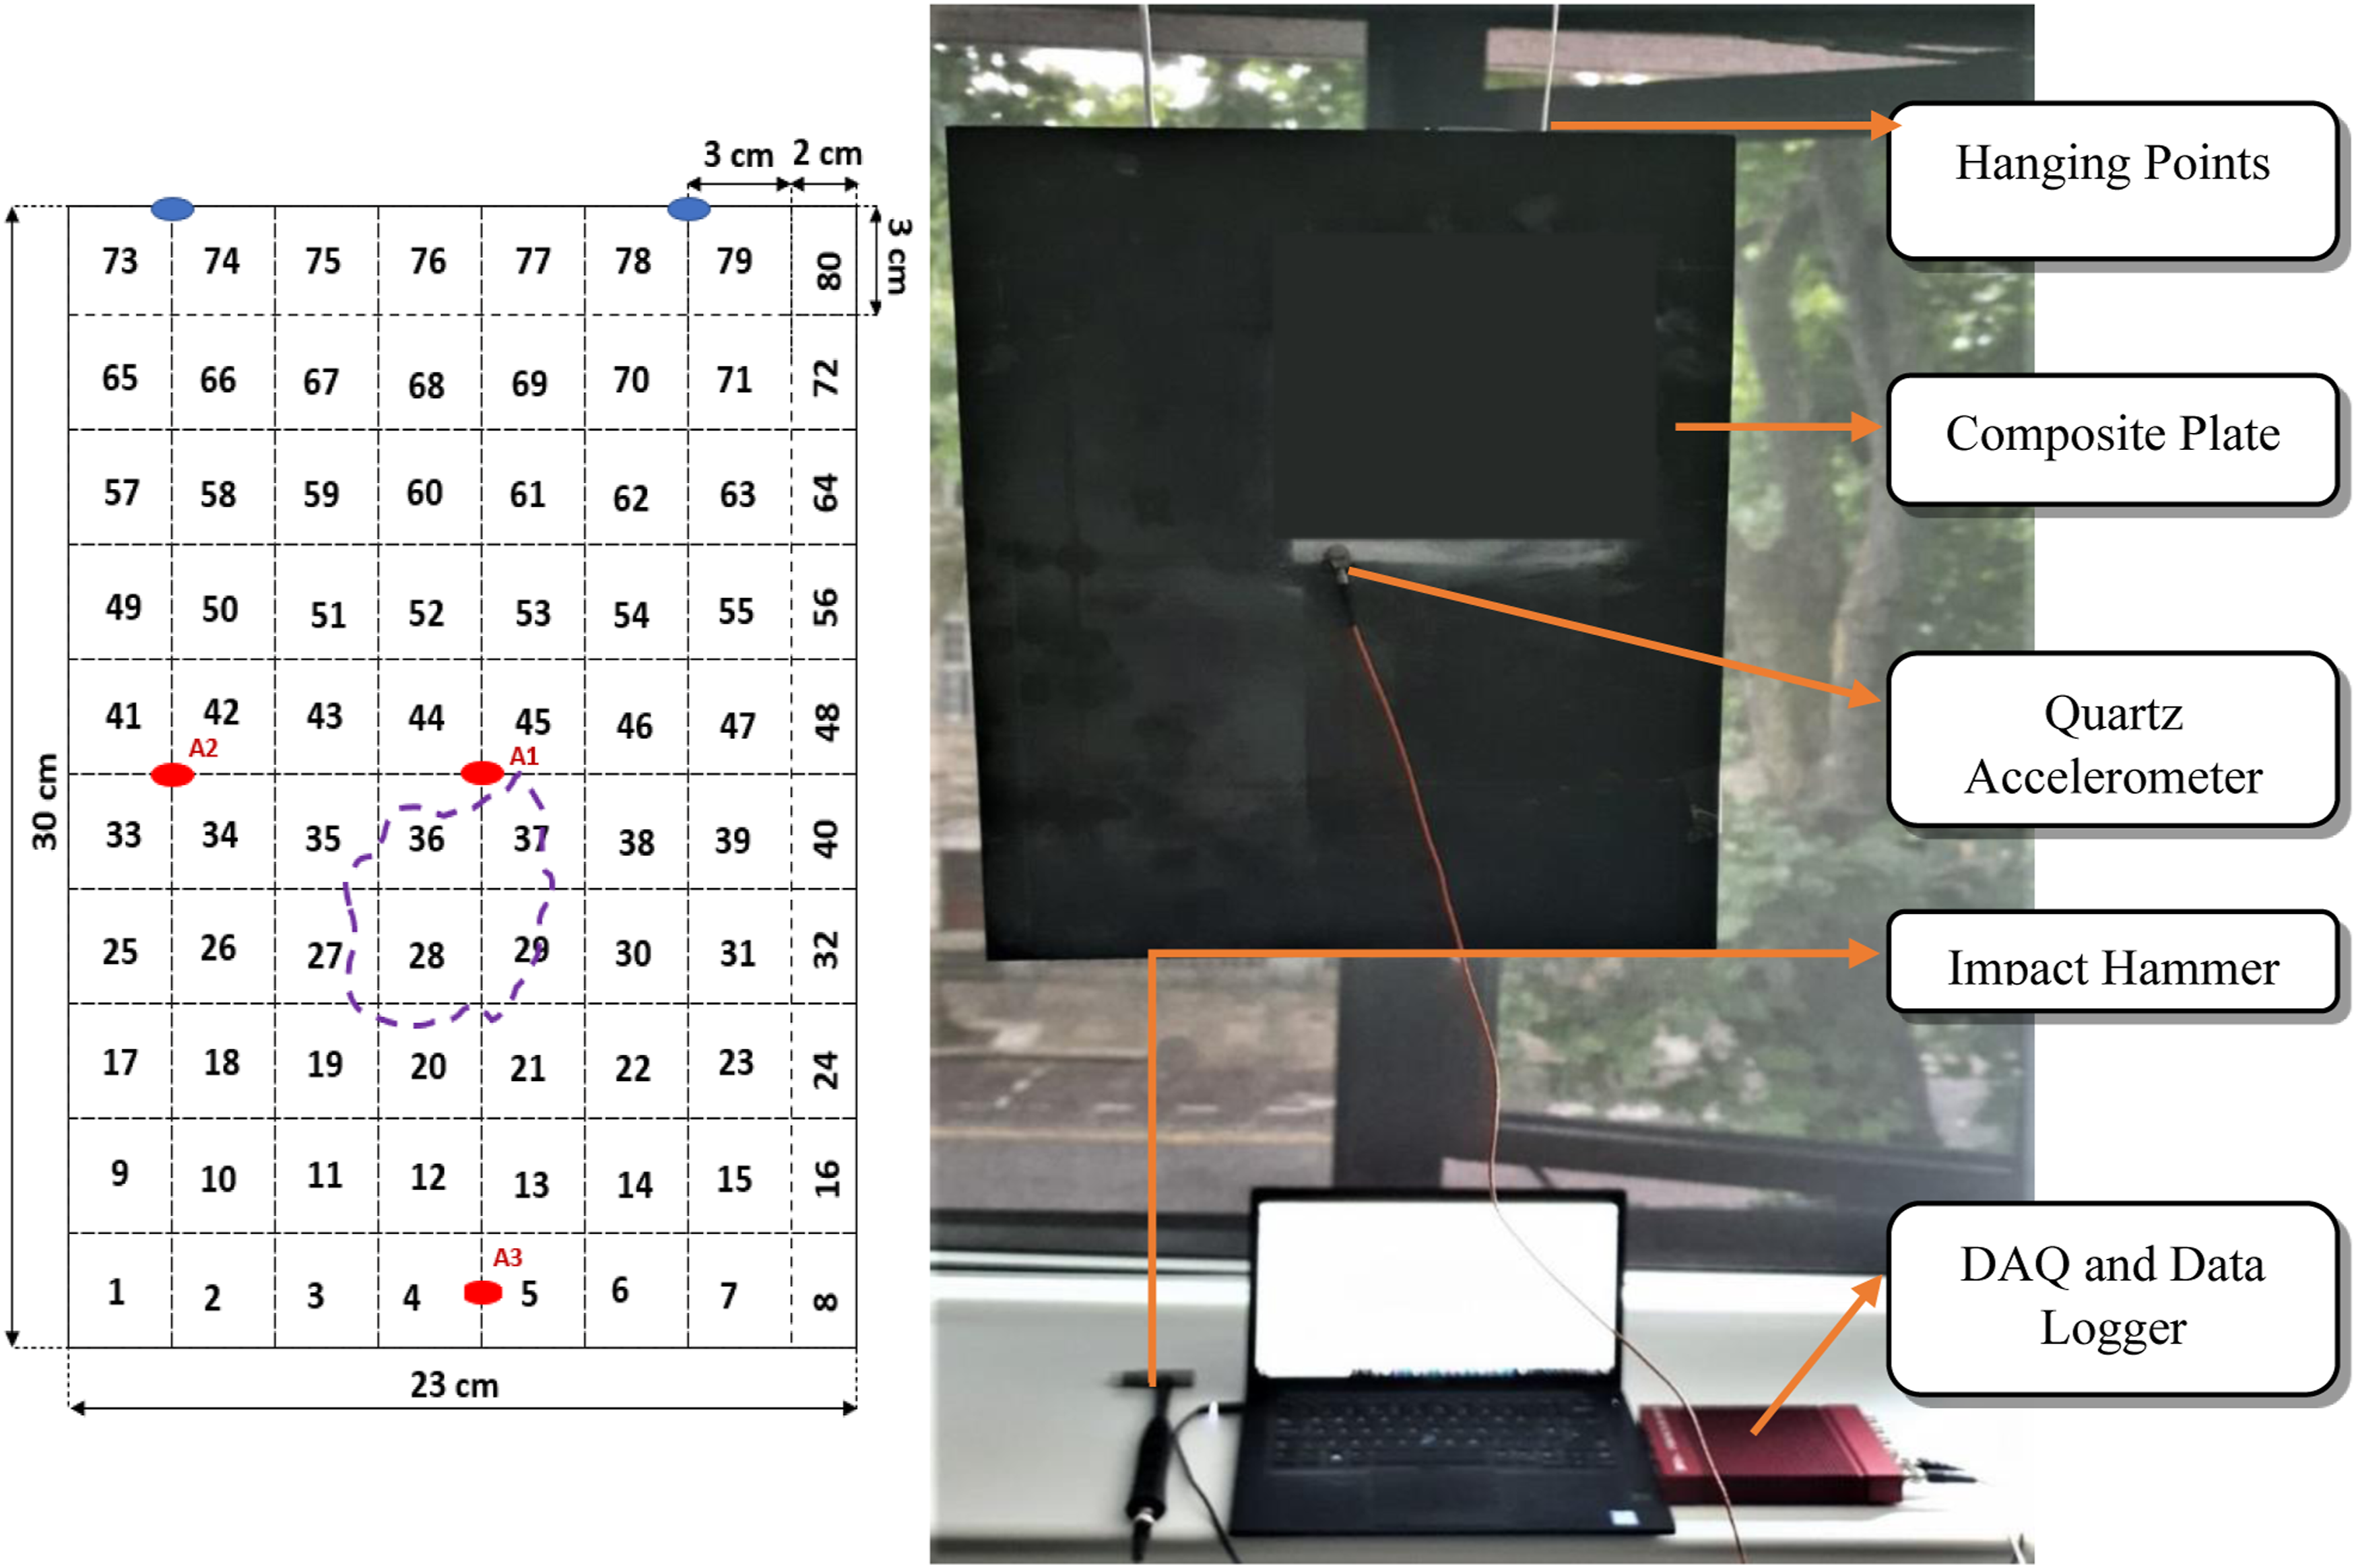
A composite structure was used as a baseline/pristine structure, and an identical composite structure with 11% delamination as highlighted in Figure 3 was used as its damaged counterpart. 11% was deemed as low/moderate damage against which the efficiency of the SRD was to be examined. The composite plates are quasi-isotropic and are comprised of 16 layers with a layup sequence of [0/± 45/90]2s and made of M21-T800s material with dimensions 30 × 23 × 0.1 cm (Dafydd, 2019). In order to examine the efficiency of the SRD technique, vibrational case studies with two different excitation techniques were undertaken: (1) Hammer: FRFs related to 80 points on each plate were measured and SRD was implemented. To show the certainty and repeatability of the technique, the plates FRFs were measured subsequently with 20 points at different reference locations, and the SRD was once again implemented. (2) Shaker: FRFs related to 18 points are taken on each plate with a continuous vibration force from a shaker to the centre of the plate. This case study is intended to identify the independence of the efficiency vibration methods on the type of excitation force. Right: The hammer test setup for data collection. Left: The plate is shown with dimensions, gridding system, QAC placement, damage location for damaged plate and hanging points
7. Hammer test setup
The setup for this test can be seen in Figure 3: • Two free hanging M21-T800s composite plates: pristine and damaged, weighing 90 g. Both boards have been divided to a grid of 10 by 8, as shown in Figure 9. • Internal Circuit Piezo (ICP) Quartz Accelerometers (QACs) attached to each board with an adhesive. The QACs are weighed at 0.9 g and can detect vibrations up to 25Khz. • Impact Hammer (IH) model IH/02 by DJB systems. The IH tip is made of aluminium, bringing the total weight of the hammer to 80 g with sensitivity of 2.5 mV/N. • Each QAC and IH are connected to a data acquisition system (DAQ), Data Physics Abaqus 901 signal logger and analyzer, via a BNC connector. The DAQ has a sampling frequency of up to 80 KHz and 24-bit analog-to-digital conversion with up to 150 dB dynamic range. • The DAQ is connected to a PC via Ethernet port, where the software on the laptop can log the data and visualize required data.
As is seen in Figure 3, the plate is divided to a grid of 10 by 8 resulting in 80 sub locations of 3 × 3 cm size. The last column of locations is of 2 × 3 cm size. To remove the effects of the boundary condition, the plate is hung from the two blue hanging points as shown in Figure 3 at the top of the plate. The wires connecting the plate to the hanging points are connected with adhesives to the plate. The sensors for different case studies are annotated by A1; centre sensor, A2; west sensor and A3; south sensor. Since the plate is symmetric along its vertical central and horizontal central lines, these locations were chosen for experimentation. The delamination for the damaged plate is presented by the purple outline. This was obtained and confirmed by ultrasound imaging (Dafydd, 2019). For adequate results, the Impact Hammer (IH) is impacted as perpendicular as possible to the centre of each grid. It is also important that a singular impact with short impact time and no ripples is applied to the plate. An example of the output of the data acquisition system (DAQ) is shown in Figure 4. Going forward, the centre (A1) Quartz Accelerometers (QACs) with 80 measurements will be used for the first case study. Top figure indicates the transfer function of a pristine plate at location 17. The three bottom figures from left to right, respectively, indicate the IH force over time, applied to the plate, the transfer function of the IH impact and the response of QAC over time.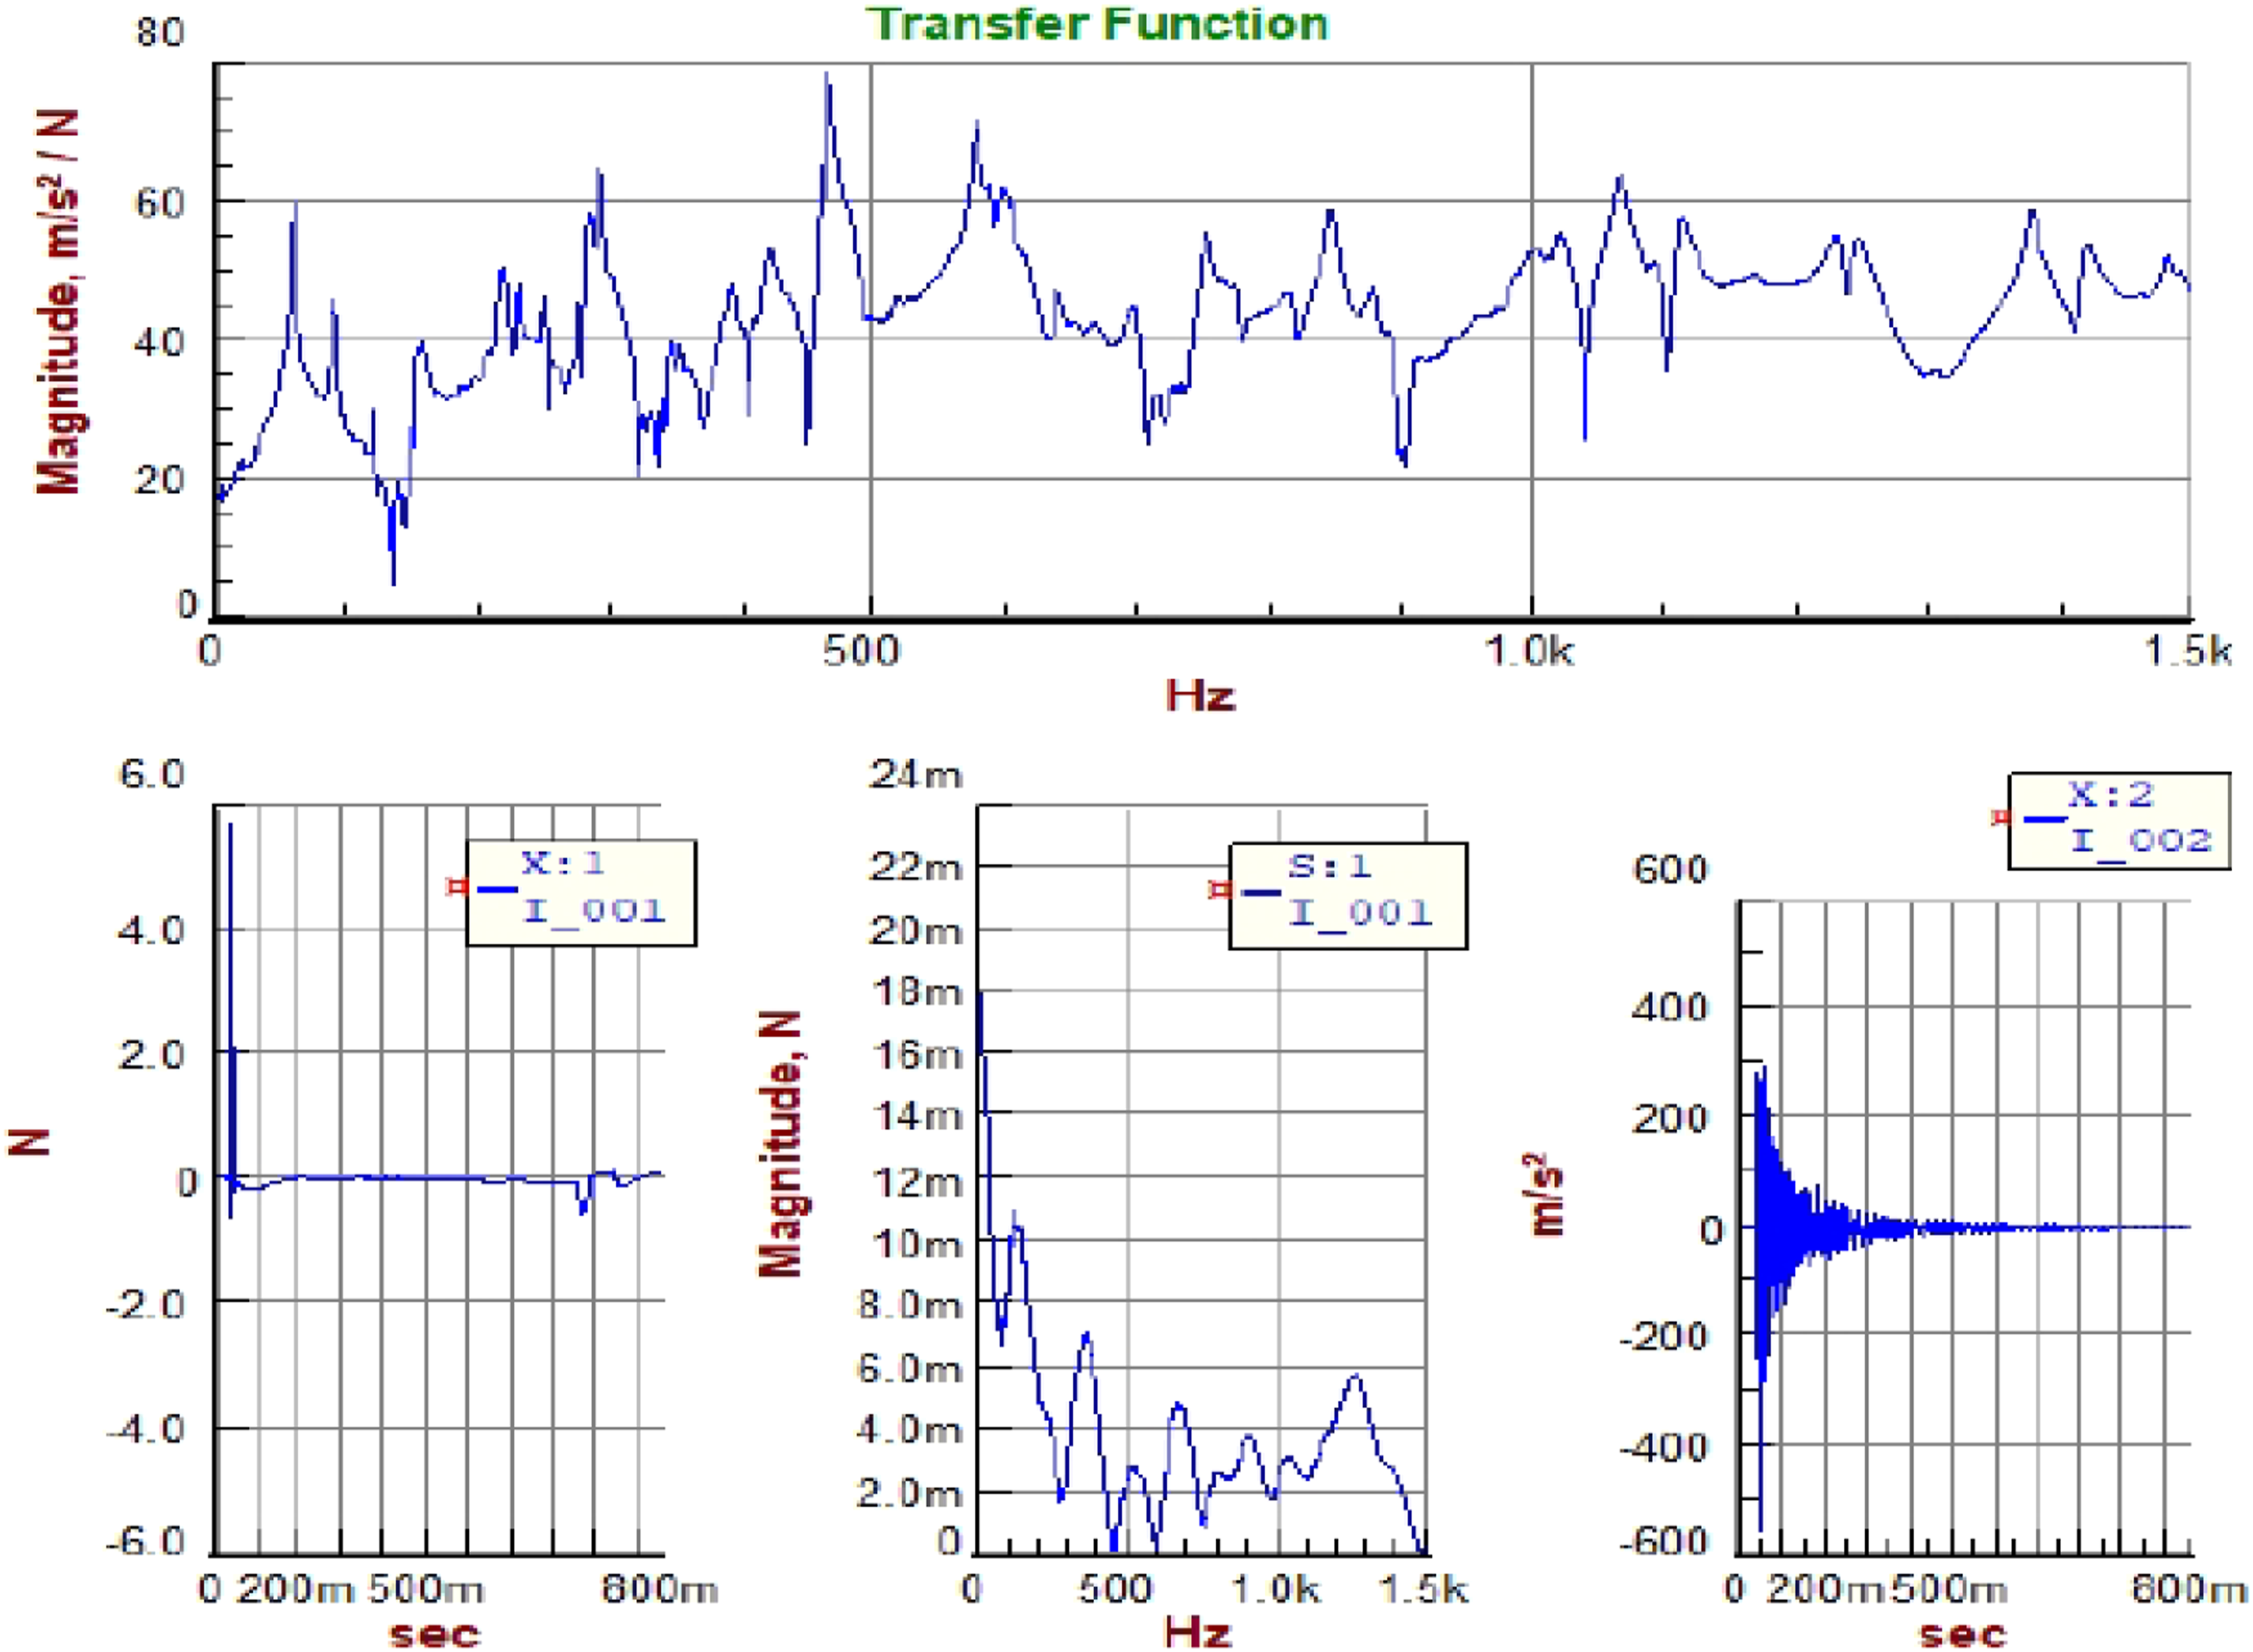
8. Hammer results
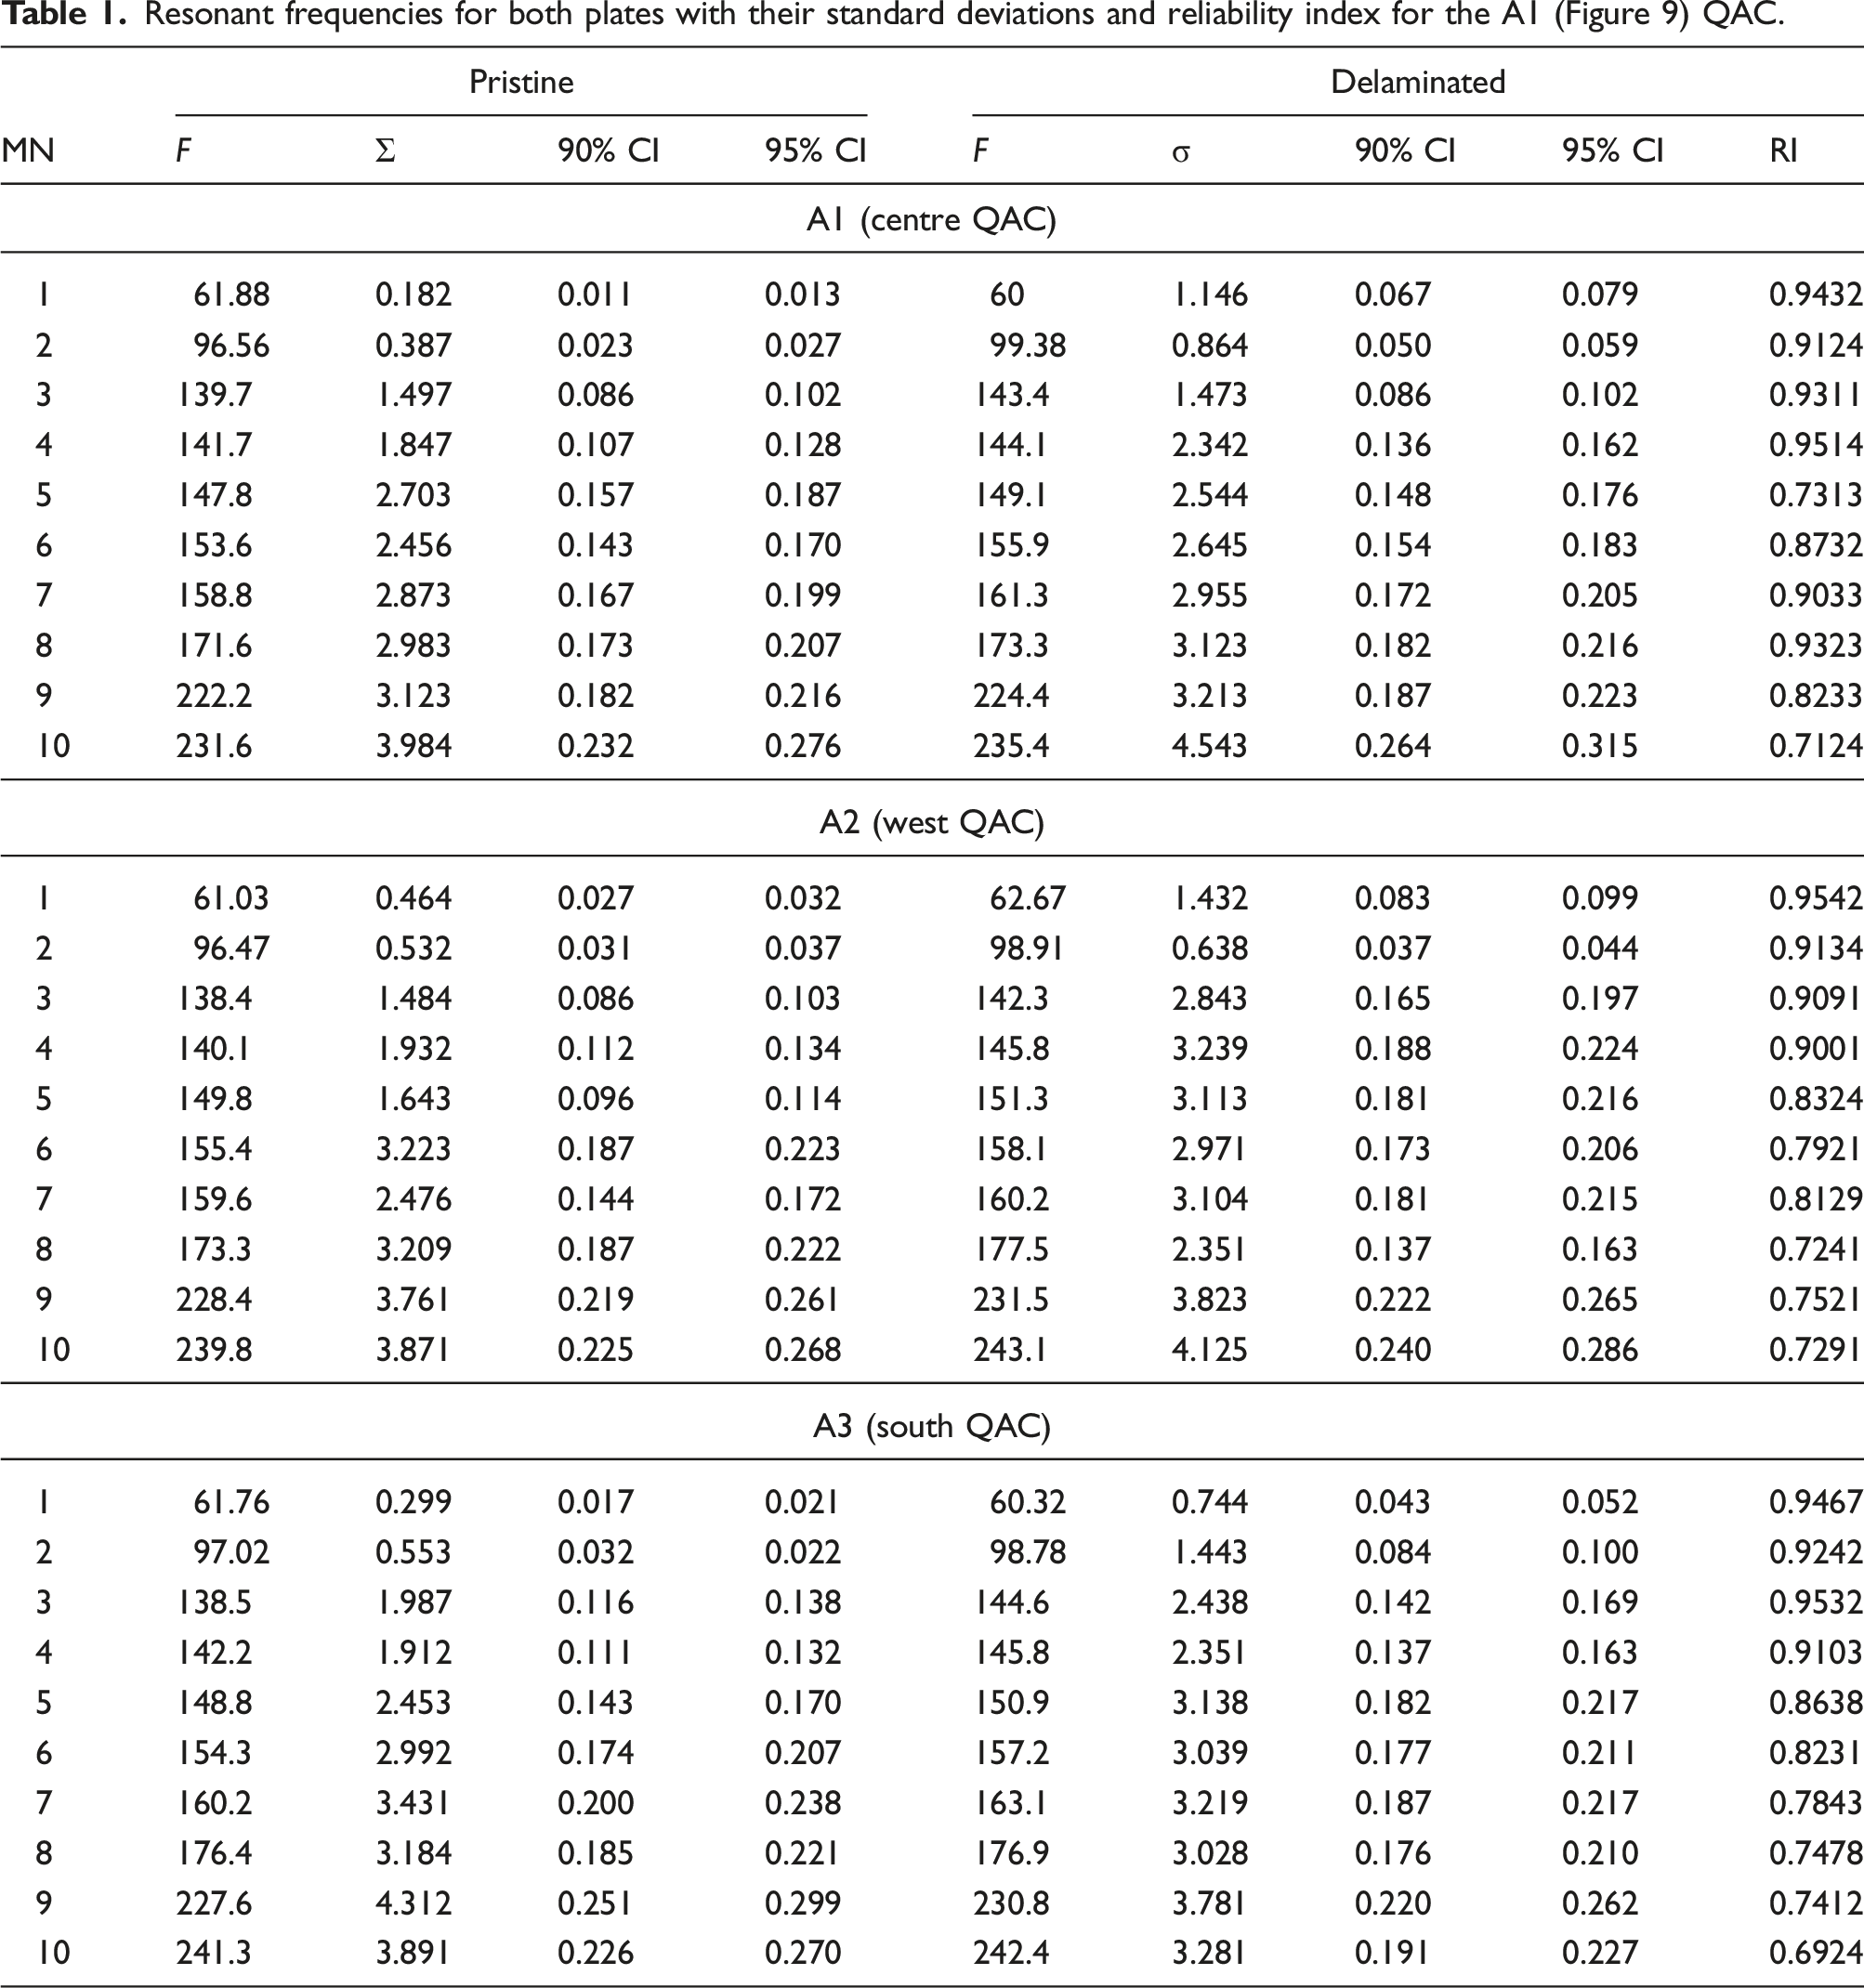
To apply the SRD with more clarity, a range of 50–100 Hz of the FRF is chosen and the corresponding MIF calculated for this range, as shown in Figure 5. The criterion line of 0.1 was selected since it would consider the smaller MIFs that might be of high importance. Taking the peak frequencies, shown with black points above the threshold, they can now be subjected to MAC analysis, where the corresponding frequencies between the pristine and delaminated plates can be found. Looking at Figure 6, the frequencies above 50% MAC (annotated with red points) value have been considered for reliability analysis within SRD. For example, as shown in Figures 7 and 8, the 1st mode found in the 50–100 Hz range has very high reliability of 0.94 with AVG analysis leading to a local reliability of 0.95 in Figure 8 for all measurement points except two. Extending the mentioned steps up to 500 Hz results in the resonant frequencies ( The MIF of the range 50–100 Hz is shown. The MIF criteria lines are also shown. The peak frequencies of interest are shown with black dots. The MAC of the frequencies is shown. The ones above 50% have been annotated by red dots. Red points at 75 and 80 Hz are of no interest as they don’t correspond to any resonances. The PDFs of the 1st mode of the 50–100 Hz range is shown. Sample PDFs for healthy and damaged plates are shown for a specific mode throughout two structures. The figure on the left utilizes the resonance frequency with the maximum amplitude found for each point while the one on the right utilizes the average resonance frequency for the entire measurement points. The reliability index of the 3rd mode within the 50–100 Hz range is shown. The figure on the left represents the local reliability indices obtained from each point’s PDFs. Using those results, the figure on the right shows the application of β distribution on those indices. Resonant frequencies for both plates with their standard deviations and reliability index for the A1 (Figure 9) QAC.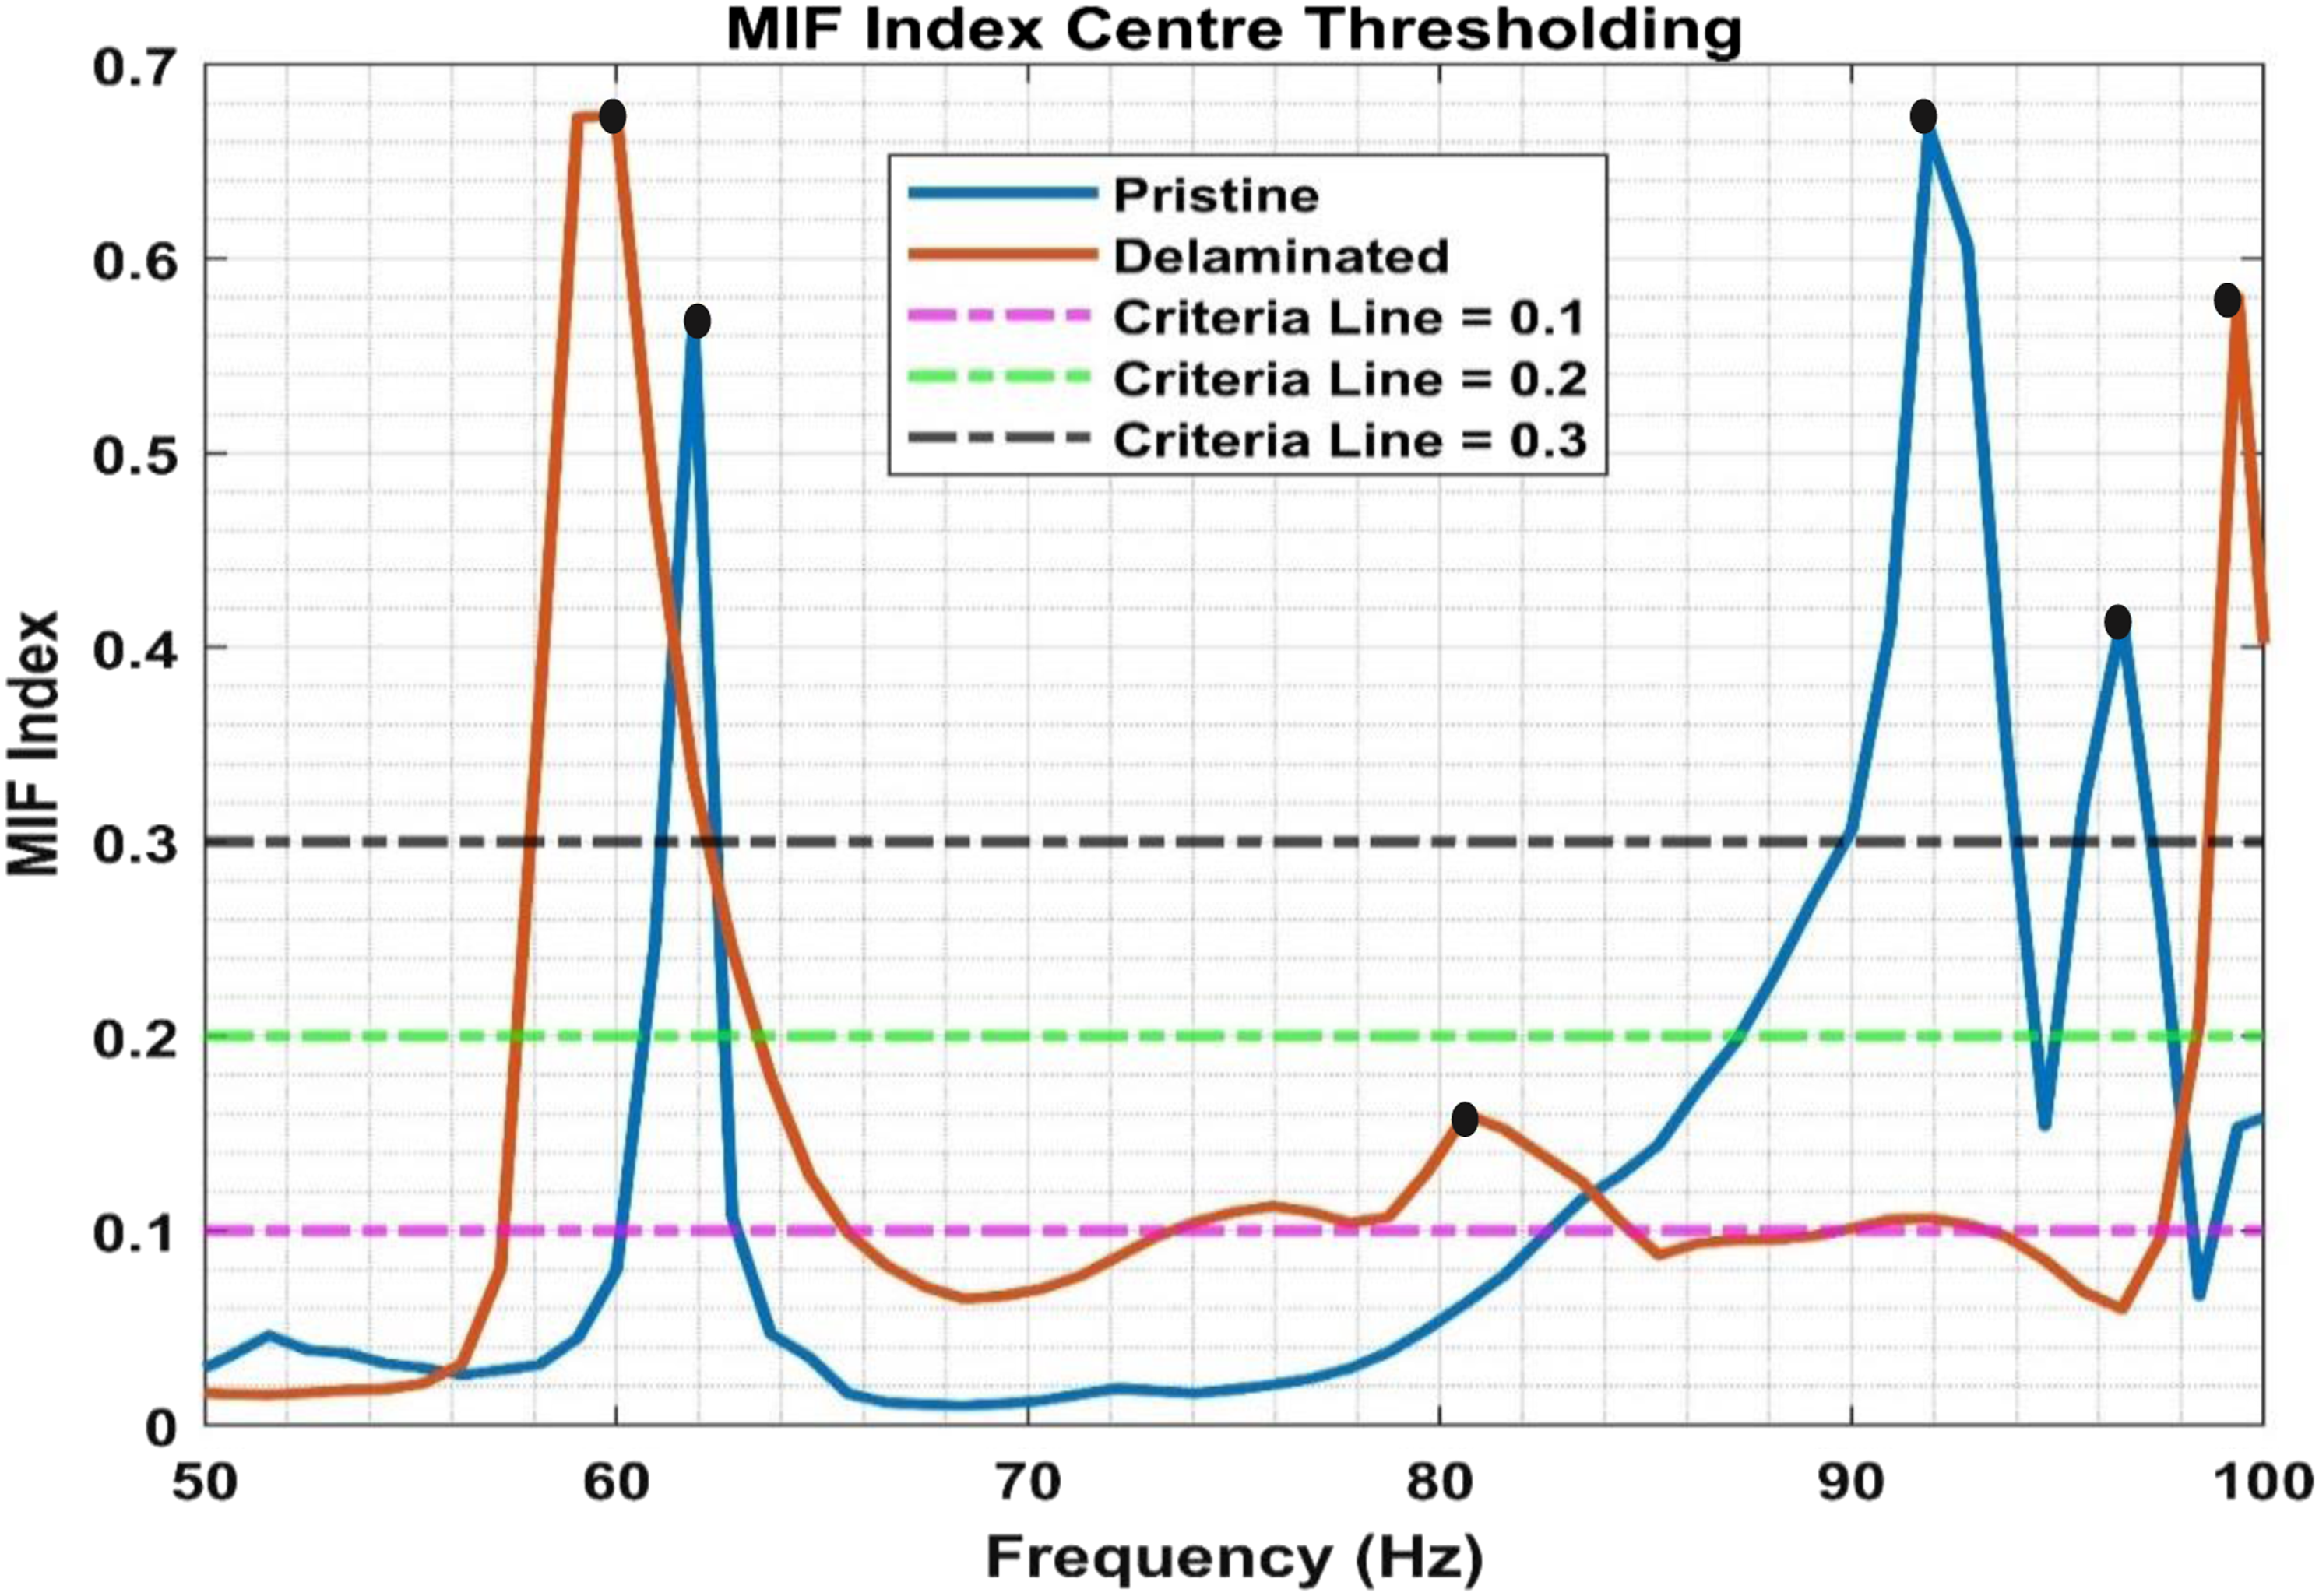
To further consolidate the certainty and repeatability of the results for damage detection, further case studies were undertaken where the QAC was placed individually at the A2 (west) point and the A3 (south) point (Figure 3) and a different number of locations were measured. A total of 20 locations were chosen for each of the west and south QAC. These locations are: 1, 4, 5, 8, 33, 36, 37, 40, 41, 44, 45, 48, 73, 76, 77, 80, midpoint between 18, 19, 26, 27, midpoint between; 22, 23, 30, 31, midpoint between; 50, 51, 58, 59 and midpoint between; 54, 55, 62, 64 (Figure 3).
As is seen from the results in Table 1, each plate’s natural frequencies were obtained with high reliability and confidence for the lower modes. The accurate detection of higher modes is difficult to address, not only due to measurement resolution difficulties but also due to the presence of noise at higher frequencies as well as denser modal behaviour and local characteristics of higher modes. This can be improved however by very careful selection of the measurement and processing system as well as measurement data points. Unfortunately, this may not be entirely feasible in a practical application.
9. Shaker test setup
The test setup for gathering vibration data can be seen in Figure 9. Similar to the hammer setup, it includes the same plates, free body hanging, grids, QAC and DAQ, excluding the hammer. In addition, the following devices are also included in the setup: • A shaker, capable of exerting a maximum random force of 200 N and a frequency range up to 6500 Hz. • Stinger rod, with the length of 304.8 × • A Force Transducer (FT), with a frequency range of up to 36 KHz and tension and compression force up to 450 N, to apply the Shaker vibration to the plate. The shaker test setup for data collection is shown.
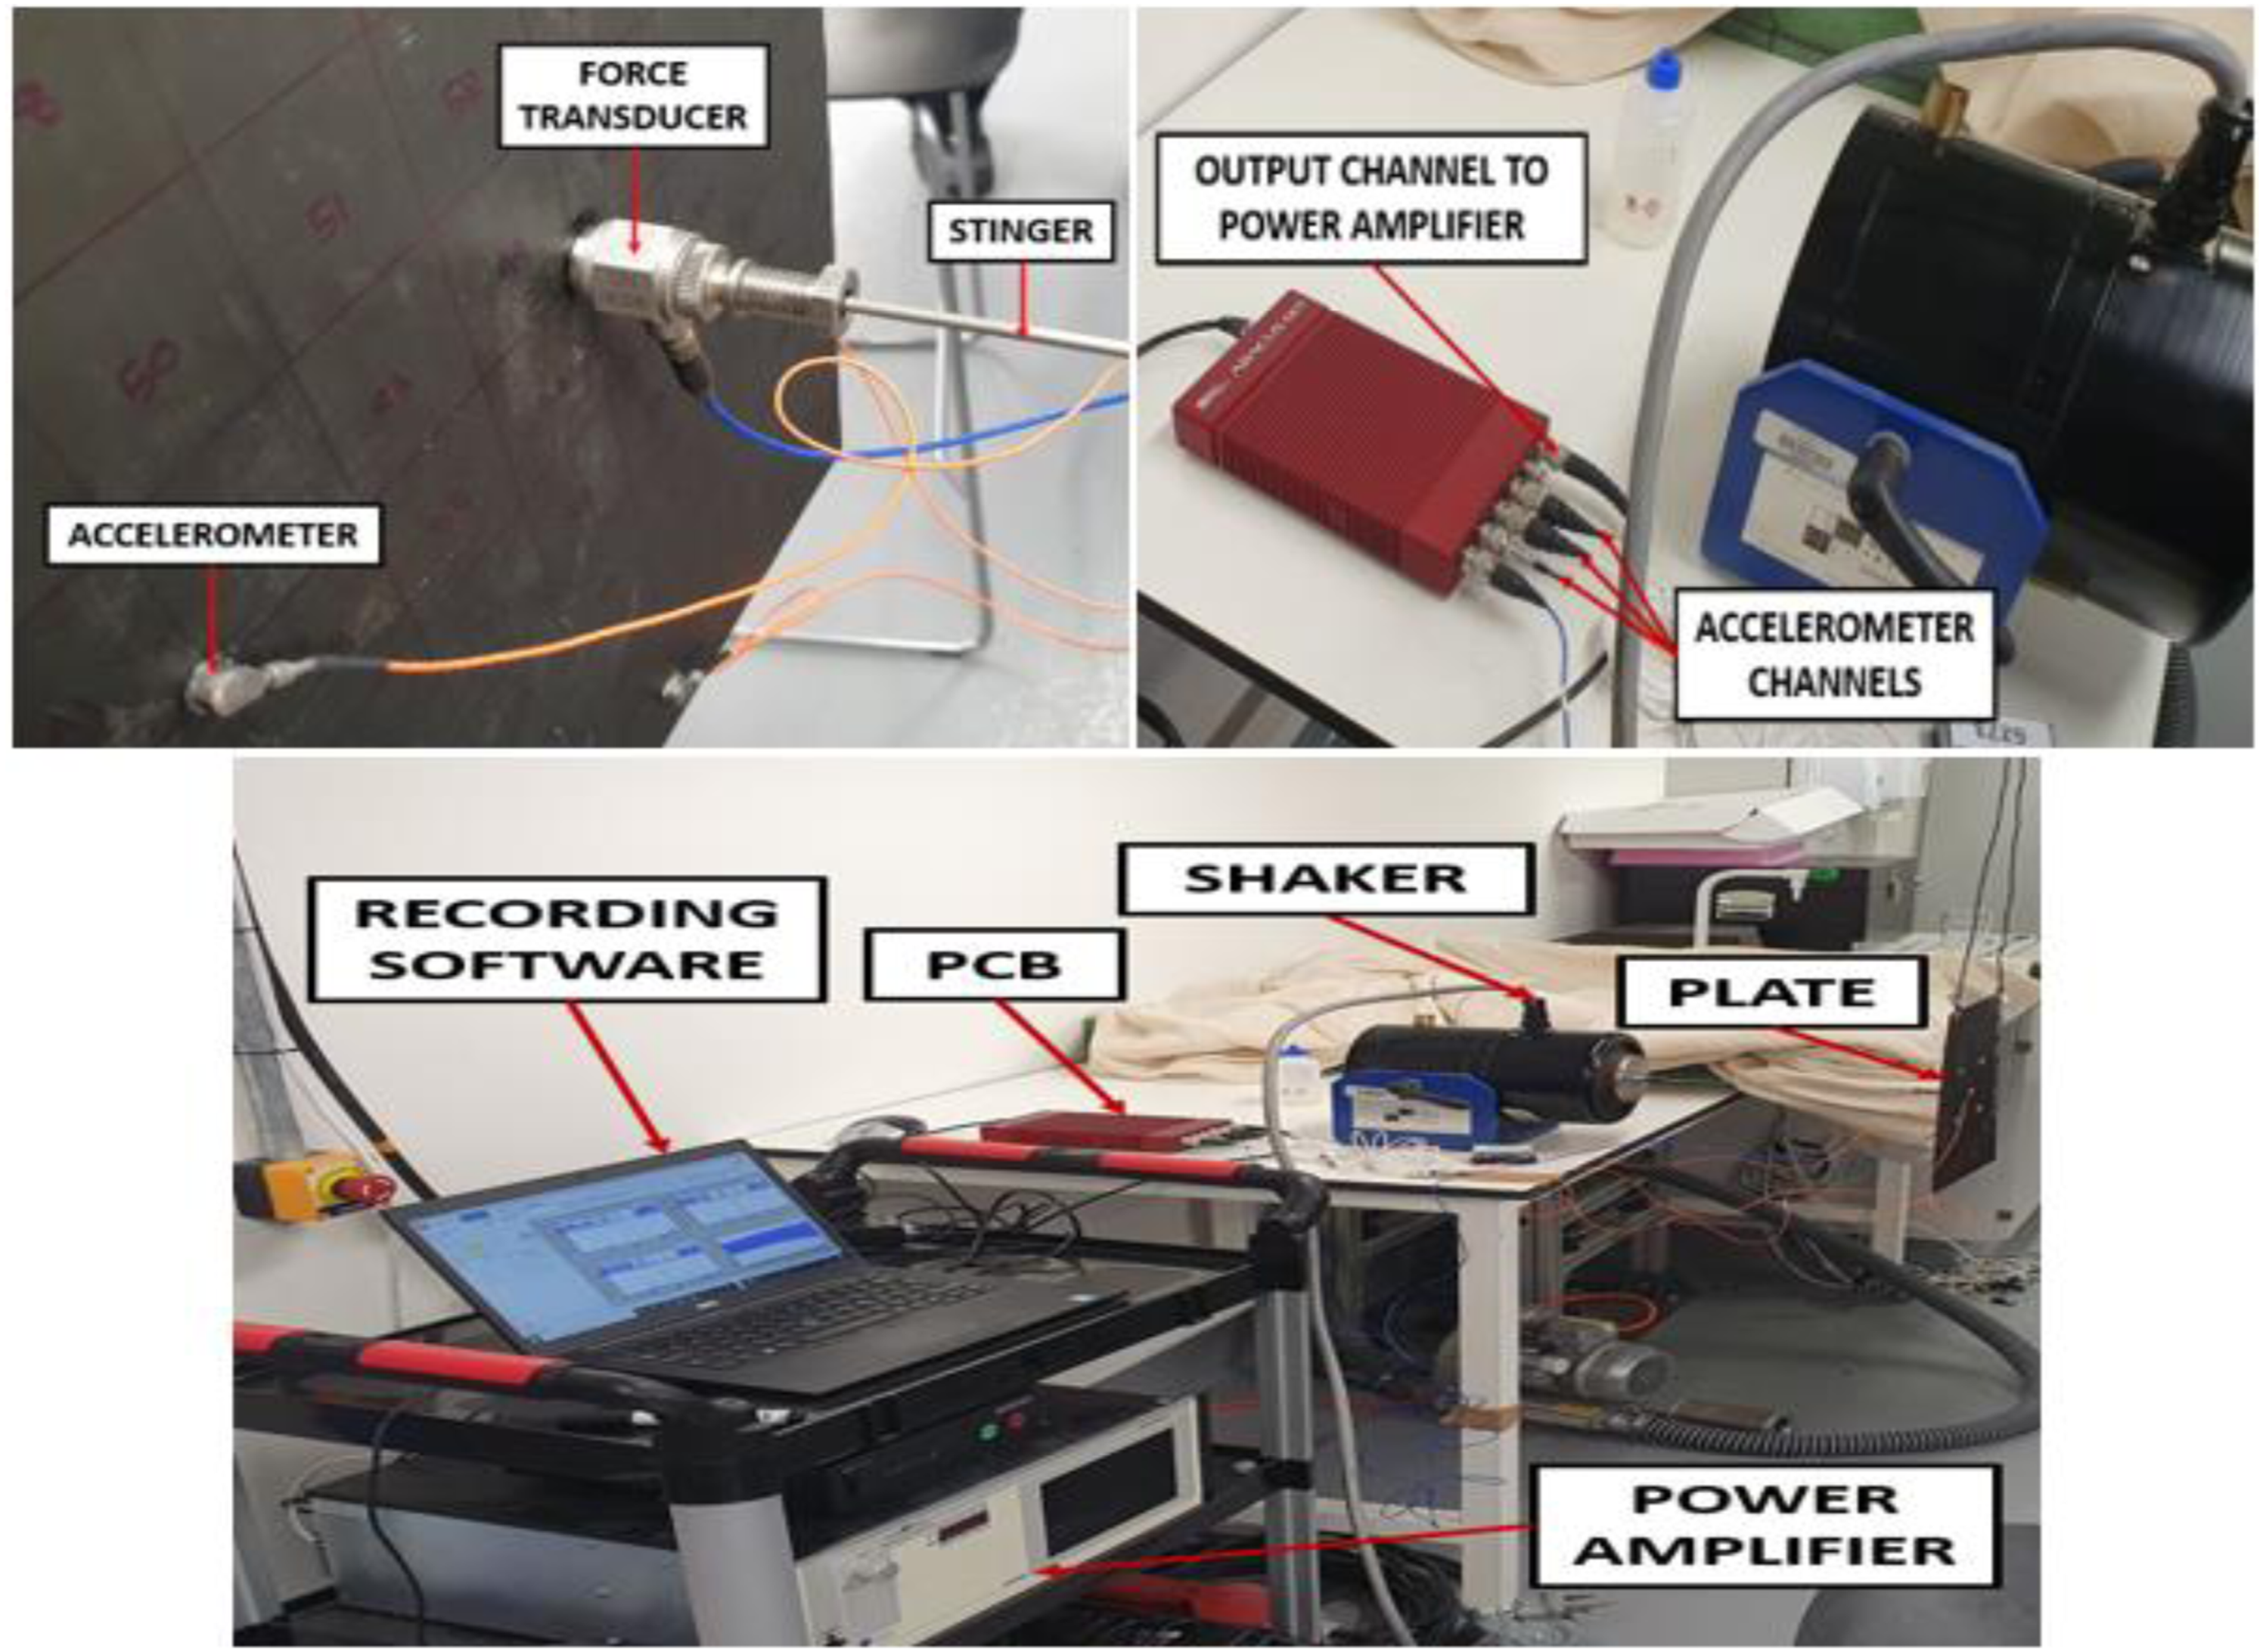
Three measurements are taken simultaneously with three QACs connected to the plate at three random locations. A random sweep was chosen for the vibration profile of up to 500 Hz. The critical load of the Stinger 10.48 N is higher than that of hammer 9.34 N, indicating that the Stinger will not buckle while the shaker imitates the hammer force. Furthermore, the first axial mode of the Stinger 1.63 KHz is out of range of the test range (500 Hz), indicating it will not resonate before and hence the data will not be null. An example of the FRFs of three random points are shown in Figure 10. The bottom right figure indicates the vibration profile of the shaker. The rest of the figures show the FRF magnitude and phase.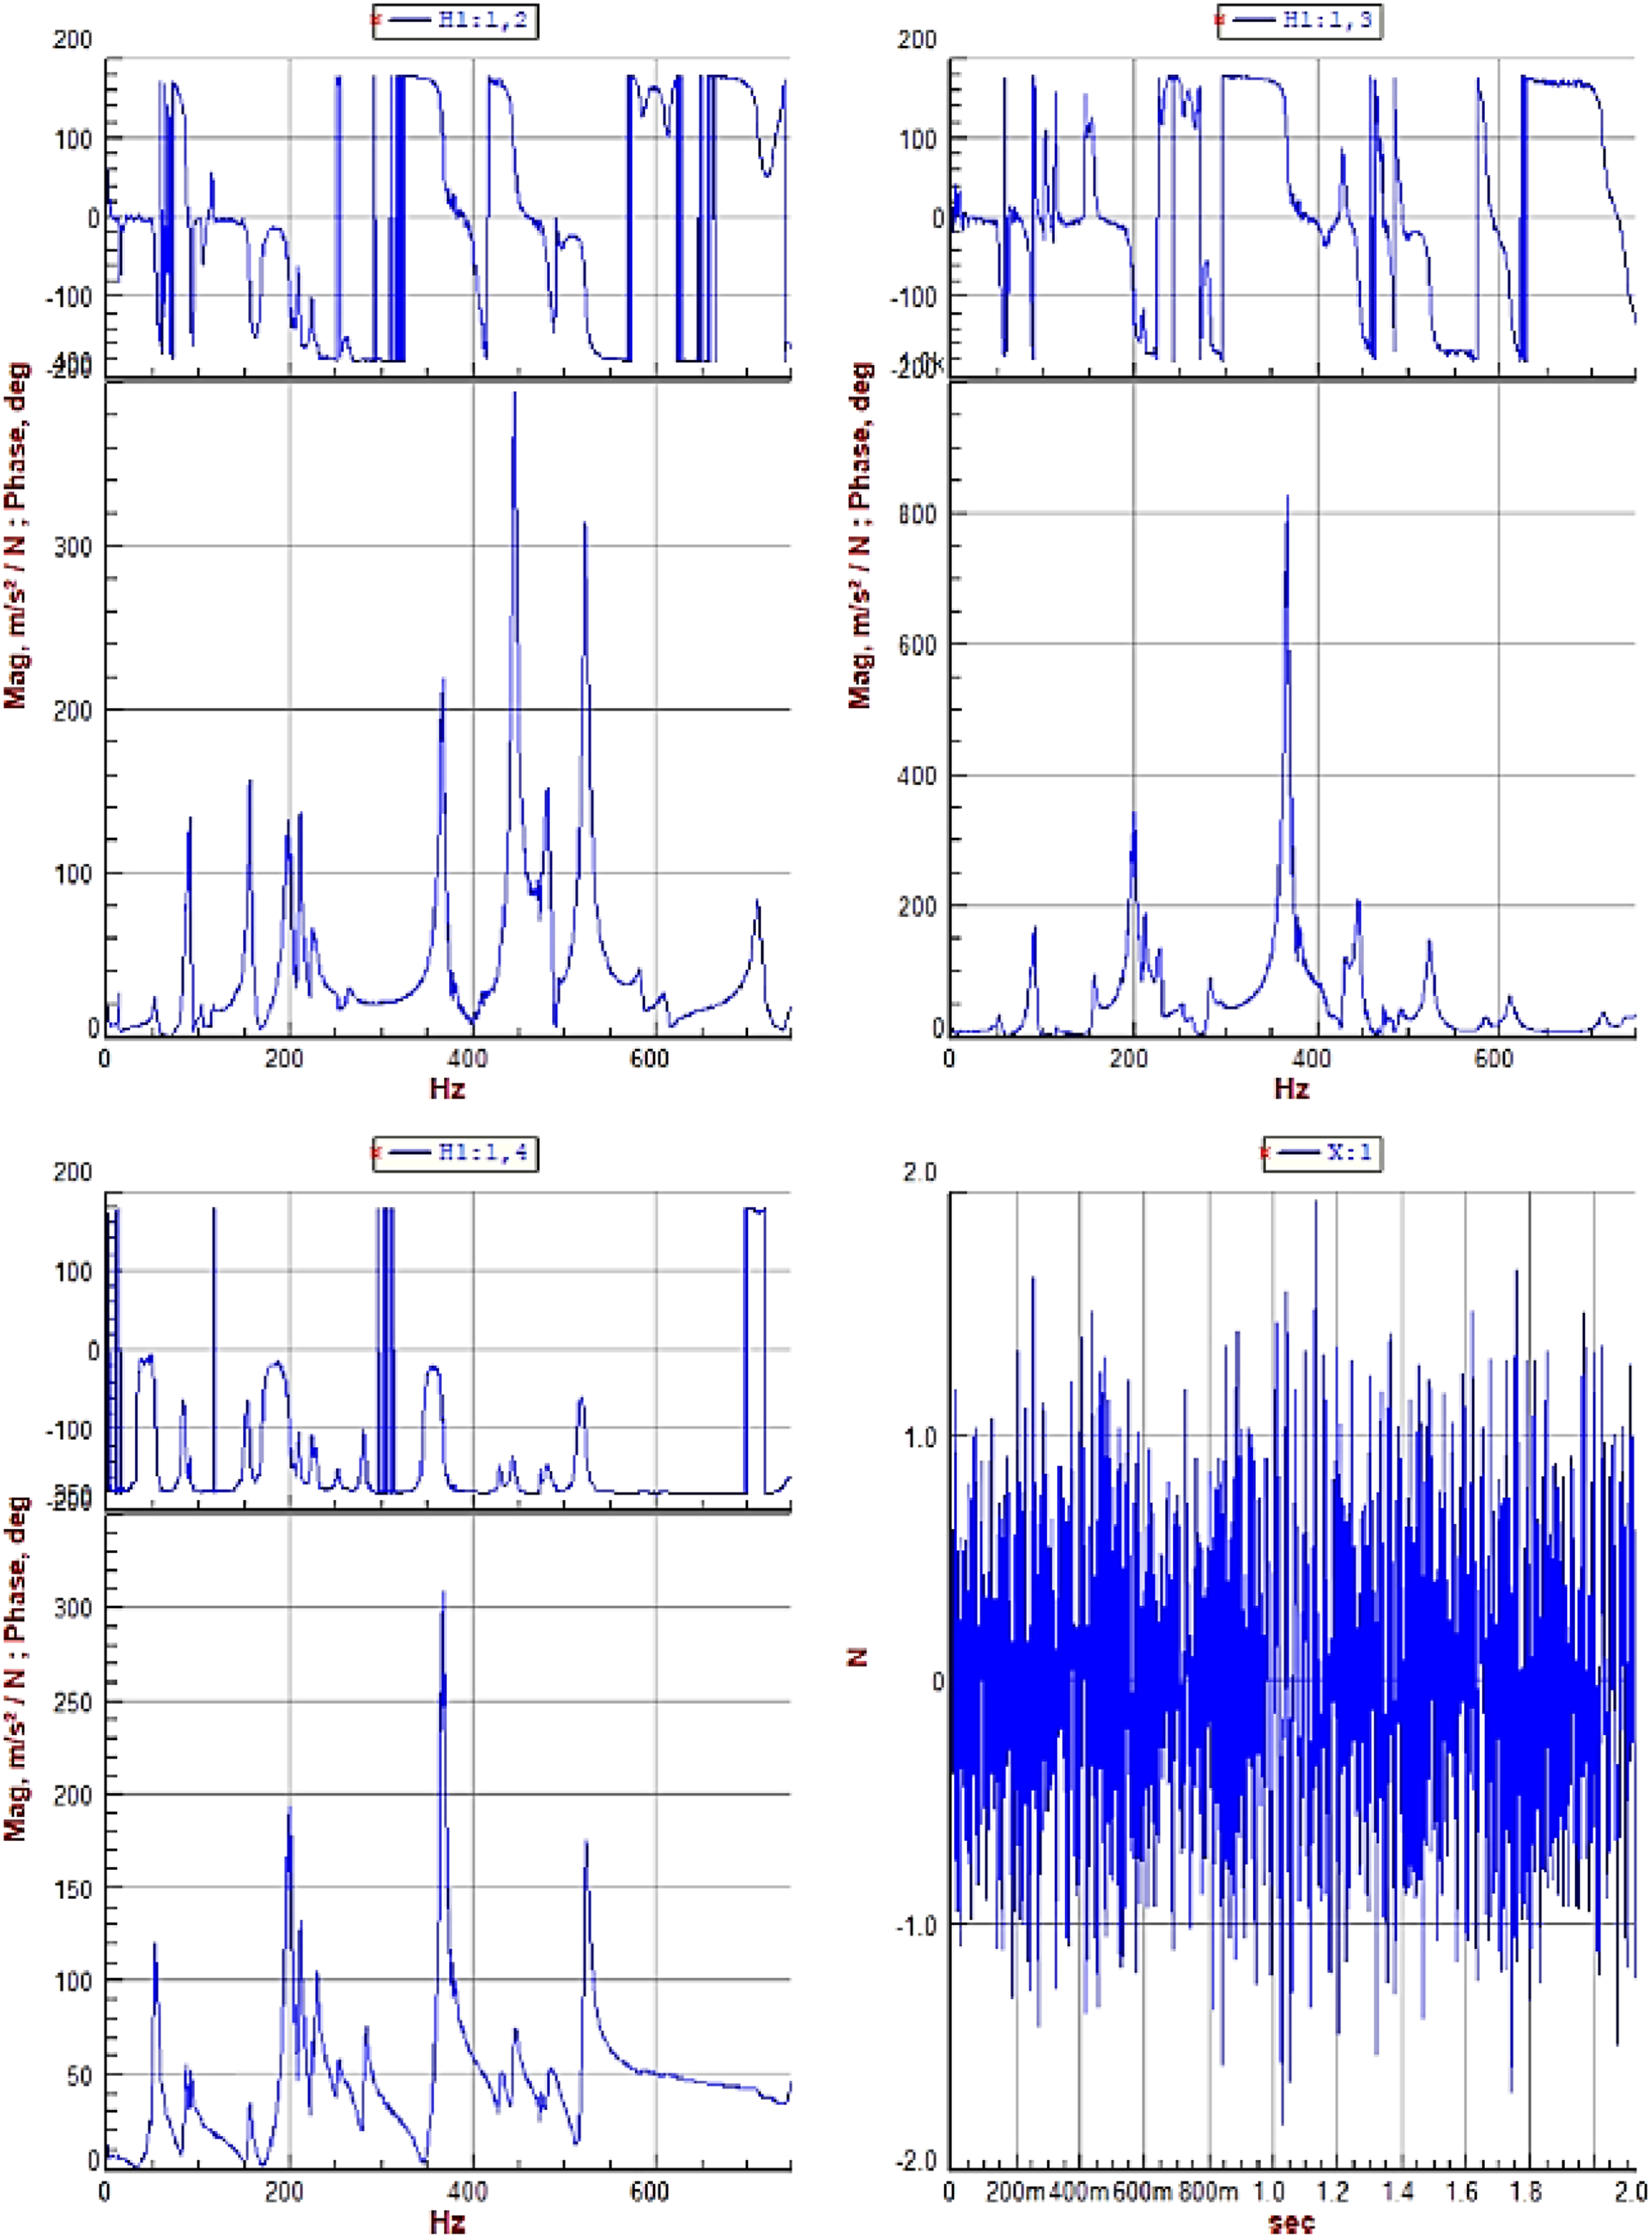
10. Shaker results
Resonant frequencies for both plates with their standard deviations and reliability index for the A1 QAC.
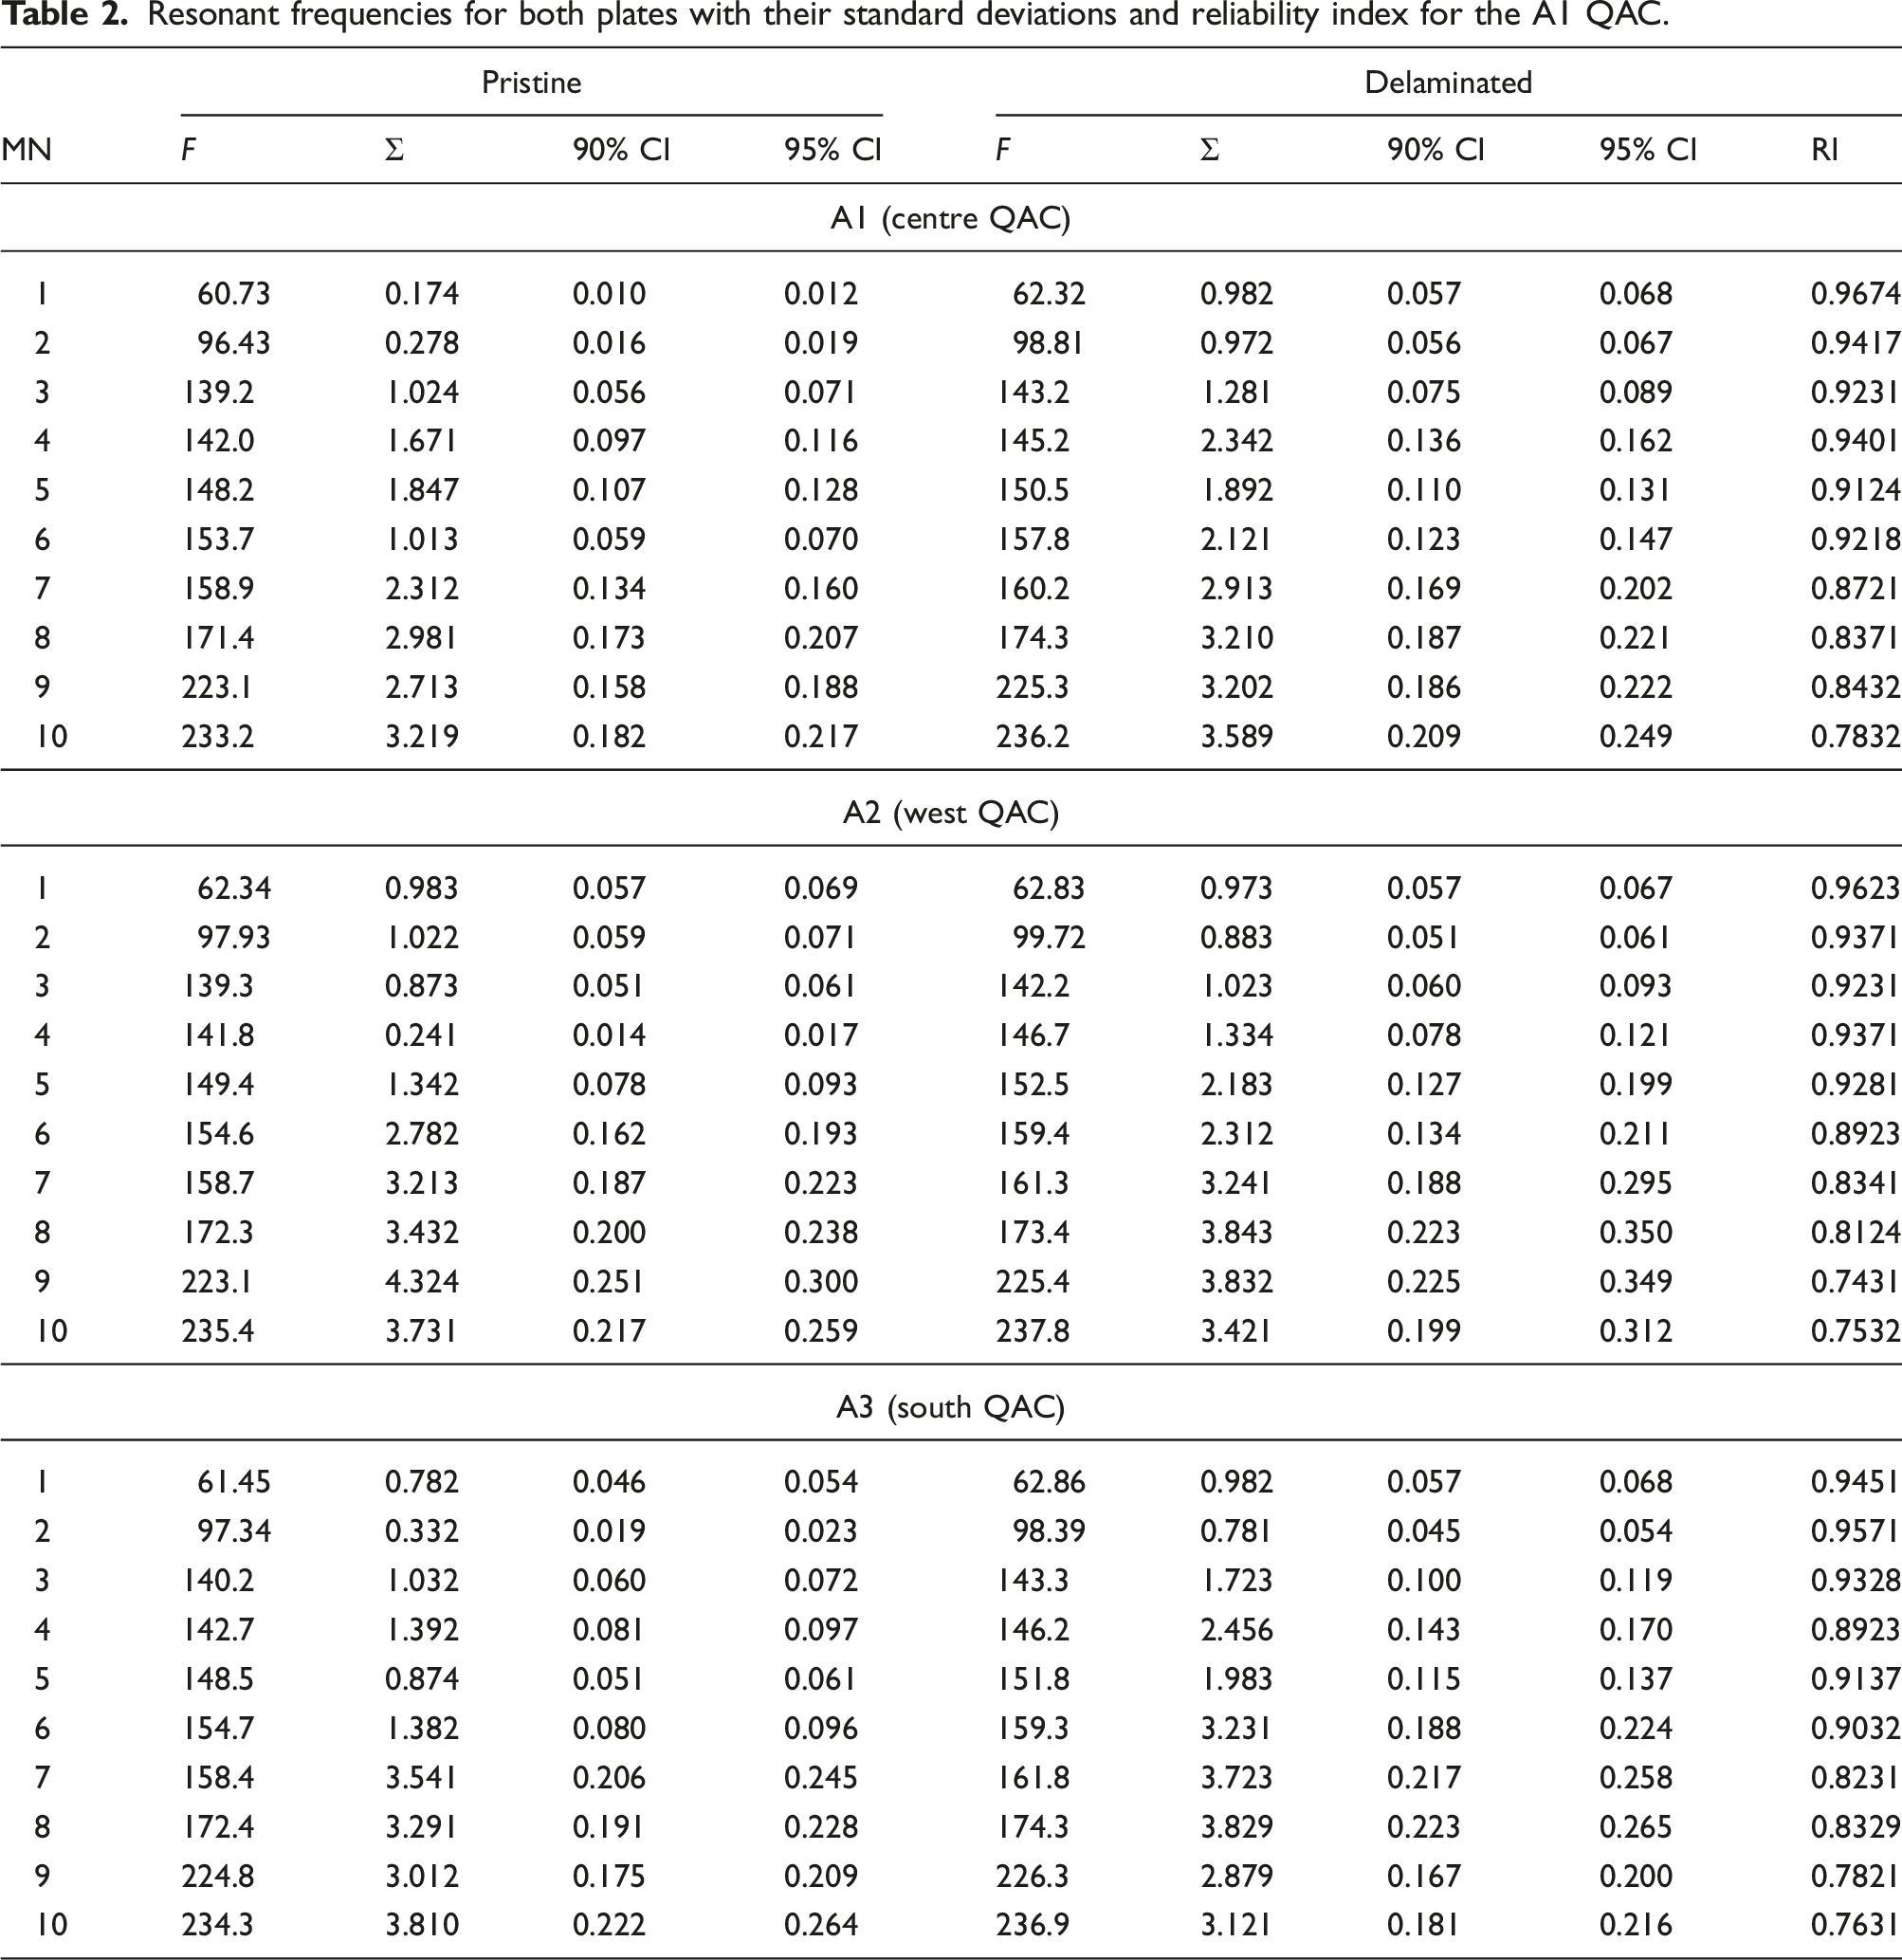
Compared to the number of modal frequencies found with the hammer approach, two additional modal frequencies were found via the shaker approach. This can be explained by the random sweep of the shaker, containing more frequencies within its spectrum, activating higher modes. Since hammer impacts induce a sudden excitation, they might not activate a higher mode as much as a continuous excitation.
11. Conclusion
The main goal of this paper was to substantiate the reliability and repeatability of vibrational-based methods for damage detection in composite structures based on SRD. Observing the FRFs obtained from the hammer impacts with a reference QAC in the middle of the plate, the differences in the first four modal frequencies between pristine and delaminated plates were determined to be due to structural differences between the plates rather than random shifts of frequency. Additionally, the reference QAC was changed to two other locations, where the same shifts in the first four modal frequencies were observed to be due to structural abnormalities. Furthermore, a different vibration-based approach was introduced: the shaker, where a continuous vibration is applied to the plate. As indicated by this approach, the shift in the first six modal frequencies was due to structural differences between the two plates. Two additional modes were found compared to the hammer approach. Furthermore, the reliability of both methods was calculated to be above 90% via SRD. Hence, it can be concluded that via SRD, vibration-based methods are highly reliable and repeatable for damage detection. For smaller damage, more modal frequencies will be required as they raise precision.
Footnotes
Declaration of conflicting interests
The author(s) declared no potential conflicts of interest with respect to the research, authorship, and/or publication of this article.
Funding
The author(s) received no financial support for the research, authorship, and/or publication of this article.