
Abstract
Bridge dislocations are hard to be voided in the operation of high-speed trains, which will lead to abnormal vibration of trains. In this study, the train–track–bridge interaction theory was adopted to develop and validate a three-dimensional coupled train–track–bridge vibration model using the finite element method. Thereafter, the influence of the dislocation amplitude on the dynamic performance of high-speed trains under five typical bridge additional transverse dislocation modes was investigated utilizing the overrun probability analysis approach. The results showed that the dislocation amplitude significantly affects the transverse dynamic behavior of high-speed trains, but it has a considerably smaller impact in the vertical direction when exposed to five typical bridge transverse dislocation modes. Moreover, under constant dislocation amplitude, the transverse parallel misalignment of the girders has the greatest influence on the running performance of high-speed trains. Although all the running performance indicators did not exceed the limit in the transverse unilateral cornering condition of the girder, speed control was suggested to guarantee operational stability. At various vehicle speeds, dislocation thresholds for the transverse symmetrical cornering, transverse parallel cornering, transverse misalignment, and transverse parallel misalignment were provided based on probabilistic guarantee rates utilizing the transverse Sperling index as the control index.
Keywords
1. Introduction
Slab tracks have become a prevalent trend for high-speed railways worldwide because of their higher stability, lower track deformation, and much lower maintenance than ballasted tracks (Zhai, 2020). The development of a mathematical model and the simulation technique to analyze the dynamic behavior of slab track will help understand the track and vehicle components’ interactions and measure the vibration characteristics of the track structure (Galvín et al., 2010; Liu et al., 2021a; Liu et al., 2021b). Antolín et al. (2013) established a vehicle–bridge system algorithm considering nonlinear wheel–track contact forces. To analyze the influence of random irregularities and the bridge and train parameters on the system response, Liu et al. (2020); Liu et al. (2021c) modeled the train as a mass–spring–damping system, imitated the bridge structure applying the finite element method, and developed a train–bridge coupled system (TBCS). Utilizing velocity admittance of box girder as an evaluation index, Kun et al. (2017) established two coupled vibration entity models: track slab–cement and asphalt mortar–concrete base layer box girder, and mainly discussed the influence of four common damping fasteners on box girder vibration. Lei and Zhang (2011) proposed the CRTS II ballastless track–train coupled vibration model based on a new slab track unit and conducted parameter analysis on the stiffness and damping values of various components of the slab ballastless track structure. Li et al. (2020) employed LS-DYNA to build a ballastless track–train coupled vibration model and studied the influence of material properties on train performance, wheel–track contact force, and dynamic response of track, track plate, and CA mortar layer. Li et al. (2018) created a frequency-domain theoretical model of the vehicle–track coupled system to investigate the influence of different track structures on vibration and noise of concrete elevated box girder (CEBG). Wan and Ni (2019) performed the dynamic sensitivity analysis of a random dynamic system to evaluate random parameters of train and track–bridge systems on the dynamic response of the train–track–bridge system (TTBS). Biondi et al. (2005) suggested a substructure method for dynamic analysis of the train–track–bridge system. Martínez-Rodrigo et al. (2010) studied the lateral vibration of existing railway bridges under resonance conditions. Blanco-Lorenzo et al. (2011) constructed the train–track coupled vibration model by combining the multi-body dynamics software SIMPACK and the finite element software NASTRAN and investigated the dynamic performance of high-speed ballasted tracks and three different types of ballastless slab tracks by using numerical simulation in the time domain.
Track irregularity caused by deformation wear or additional bridge dislocation severely impacts the running performance of a high-speed railway. Cantero et al. (2015), Luo and Lei (2014), and Tan and Ji (2011) analyzed the influence of track irregularity on the vibration characteristic system based on the train–track–bridge vertical coupled vibration model. The findings indicated that the wavelength variation of track irregularity has little influence on the system position response but significantly affects the track’s vertical wheel–track force and vertical acceleration amplitude. Zheng et al. (2020) addressed the dynamic response of train–track–bridge systems under pier settlement and beam misalignment conditions. In addition, it revealed that the vehicle’s vertical acceleration amplitude grows with the rise in beam deformation at different running speeds, and it provided the limits of pier settlement and beam misalignment for safe driving. Xiong et al. (2006) developed a vehicle–bridge model considering vertical degrees of freedom and nonlinear wheel–rail contact to examine the vehicle acceleration and Sperling coefficient for different vehicle speeds and pier settlement amplitudes. Xiang et al. (2021) established a train–track–bridge coupled vibration algorithm, analyzed the dynamic system response at varying train speeds and bridge creep deformation, and determined the creep upper arch limit of the bridge. Yau, (2009) and Yau and Fry Ba (2007) studied the resonant velocity of the vehicle–bridge system and the effect of foundation settlement on the vehicle–bridge system by modeling the vehicle as an equally spaced moving mass–spring unit and building a coupled vehicle–simply supported girder bridge vibration model. The results exhibited that uneven settlement of the foundation has a small effect on the bridge response, but the vertical acceleration of the car body rises with increasing the foundation settlement amplitude, which negatively affects the high-speed railway traffic. Besides, it is proposed that the allowable rotation angle of the girder under local settlement should not exceed 1/1000. Podworna (2017) presented an axle technique with vertical degrees of freedom to analyze the dynamic response of ICE3 trains passing through a steel–concrete composite girder bridge and proposed limits for vertical track irregularity at different vehicle speeds. The vehicle–bridge system approach is established (Gou et al., 2018; Gou et al., 2019; Gou et al., 2021) based on the CRTS I and CRTS II ballastless track on rail deformation mapping model and SIMPACK multi-body dynamics simulation software. The influence of four beam dislocation modes: pier settlement, beam vertical rotation angle, beam misalignment, and creep arch on rail mapping deformation and high-speed train operation performance was studied, and the dislocation thresholds for each beam dislocation mode were proposed.
Although the dynamic response of the coupled train–track–bridge system under girder dislocations has been studied and evaluated extensively, there are still specific gaps. There is a paucity of research on the running performance of high-speed railways under the additional transverse dislocations of girders, and most of the track–bridge models are oversimplified for the track structure. Studying the running performance of high-speed railways under the extra transverse dislocation mode of the bridge and determining the dislocation threshold for assessing the running safety performance of track–bridge systems is of utmost importance. This paper simplifies a single-section vehicle into a 31-degree-of-freedom mass–spring–damping system, and a three-dimensional train–track–bridge coupled system dynamic response calculation program (TTBCS) is developed to study the influence of five typical additional transverse dislocations of bridges on the dynamic performance of high-speed trains. The probabilistic statistical characteristics of running performance indicators under five typical additional transverse dislocations of bridges and the transverse dislocation threshold based on running safety are presented.
2. The coupled vibration model of the train–track–bridge system and validation
2.1. The coupled vibration model of the train–track–bridge system
A coupled dynamic system is composed of the railway vehicle and the track–bridge subsystem components to simulate the situation of a high-speed train passing through the high-speed railway track–bridge system. Figure 1 depicts a schematic description of the coupled vibration model of the train–track–bridge system. The schematic diagram of the coupled vibration model of the train–track–bridge system: (a) floor plan and (b) 3D drawing.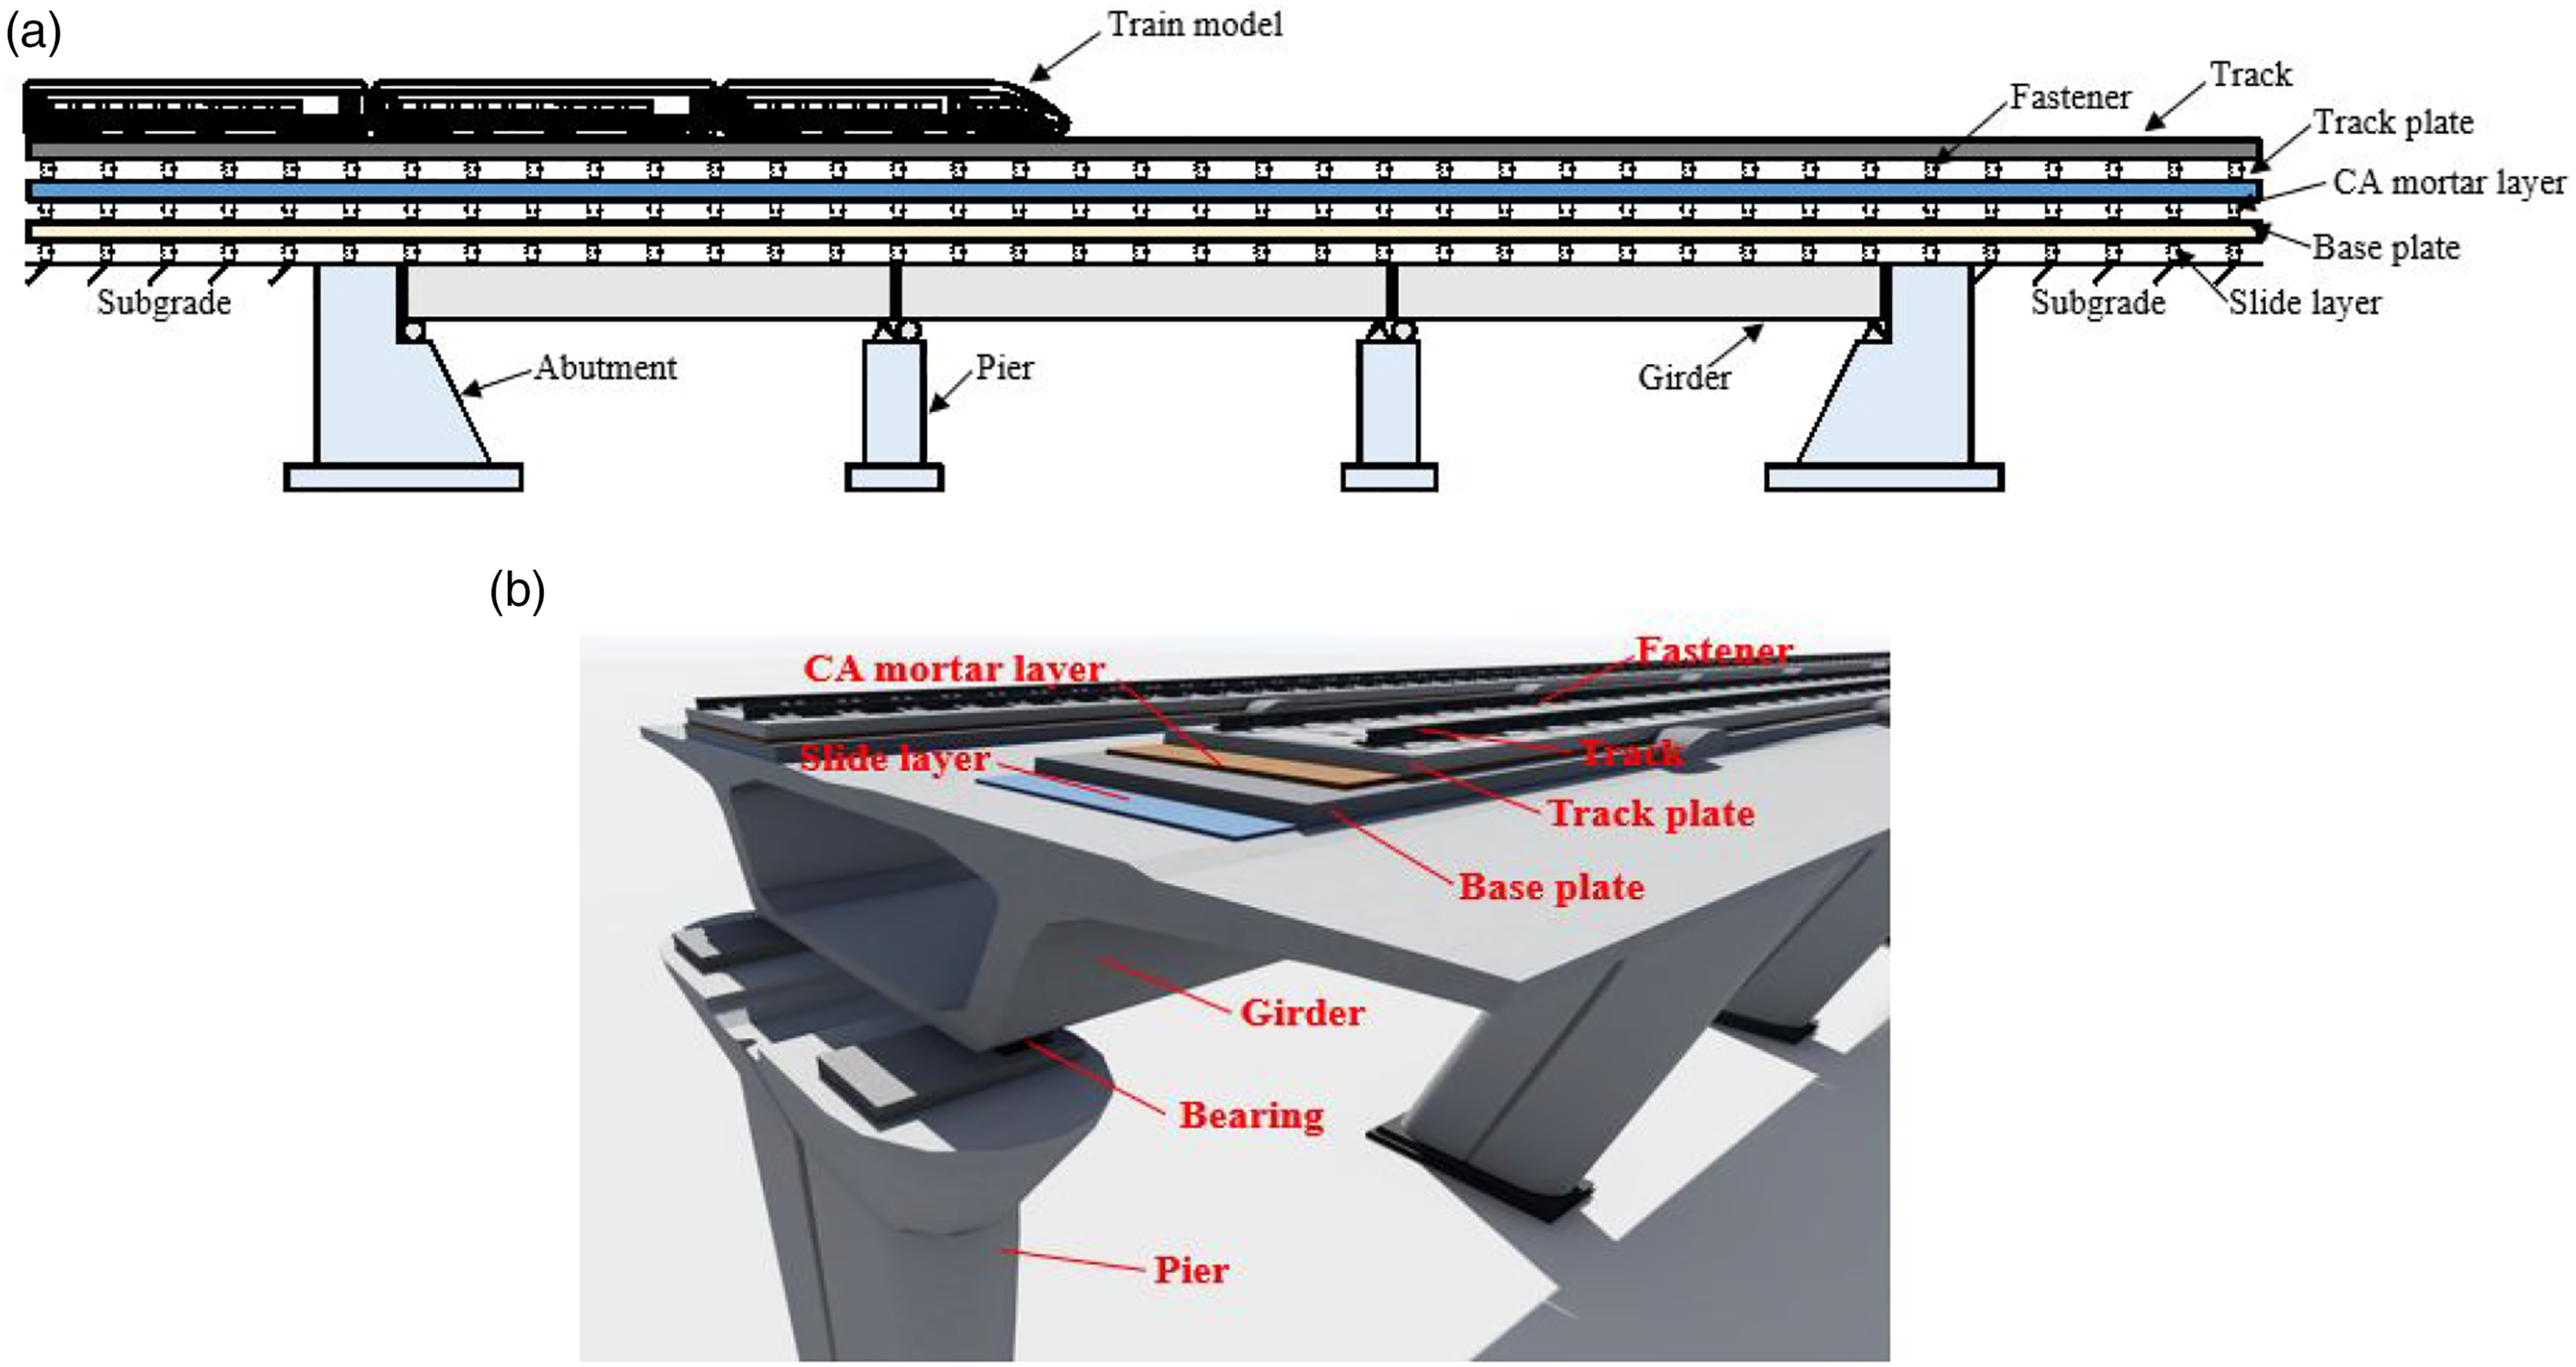
Figure 2 demonstrates the model diagram of a high-speed railway vehicle, in which a single-section vehicle is simplified as a mass–spring system with 31 degrees of freedom. The dynamic vehicle response can be calculated using equation (1) The schematic diagram of a high-speed railway vehicle.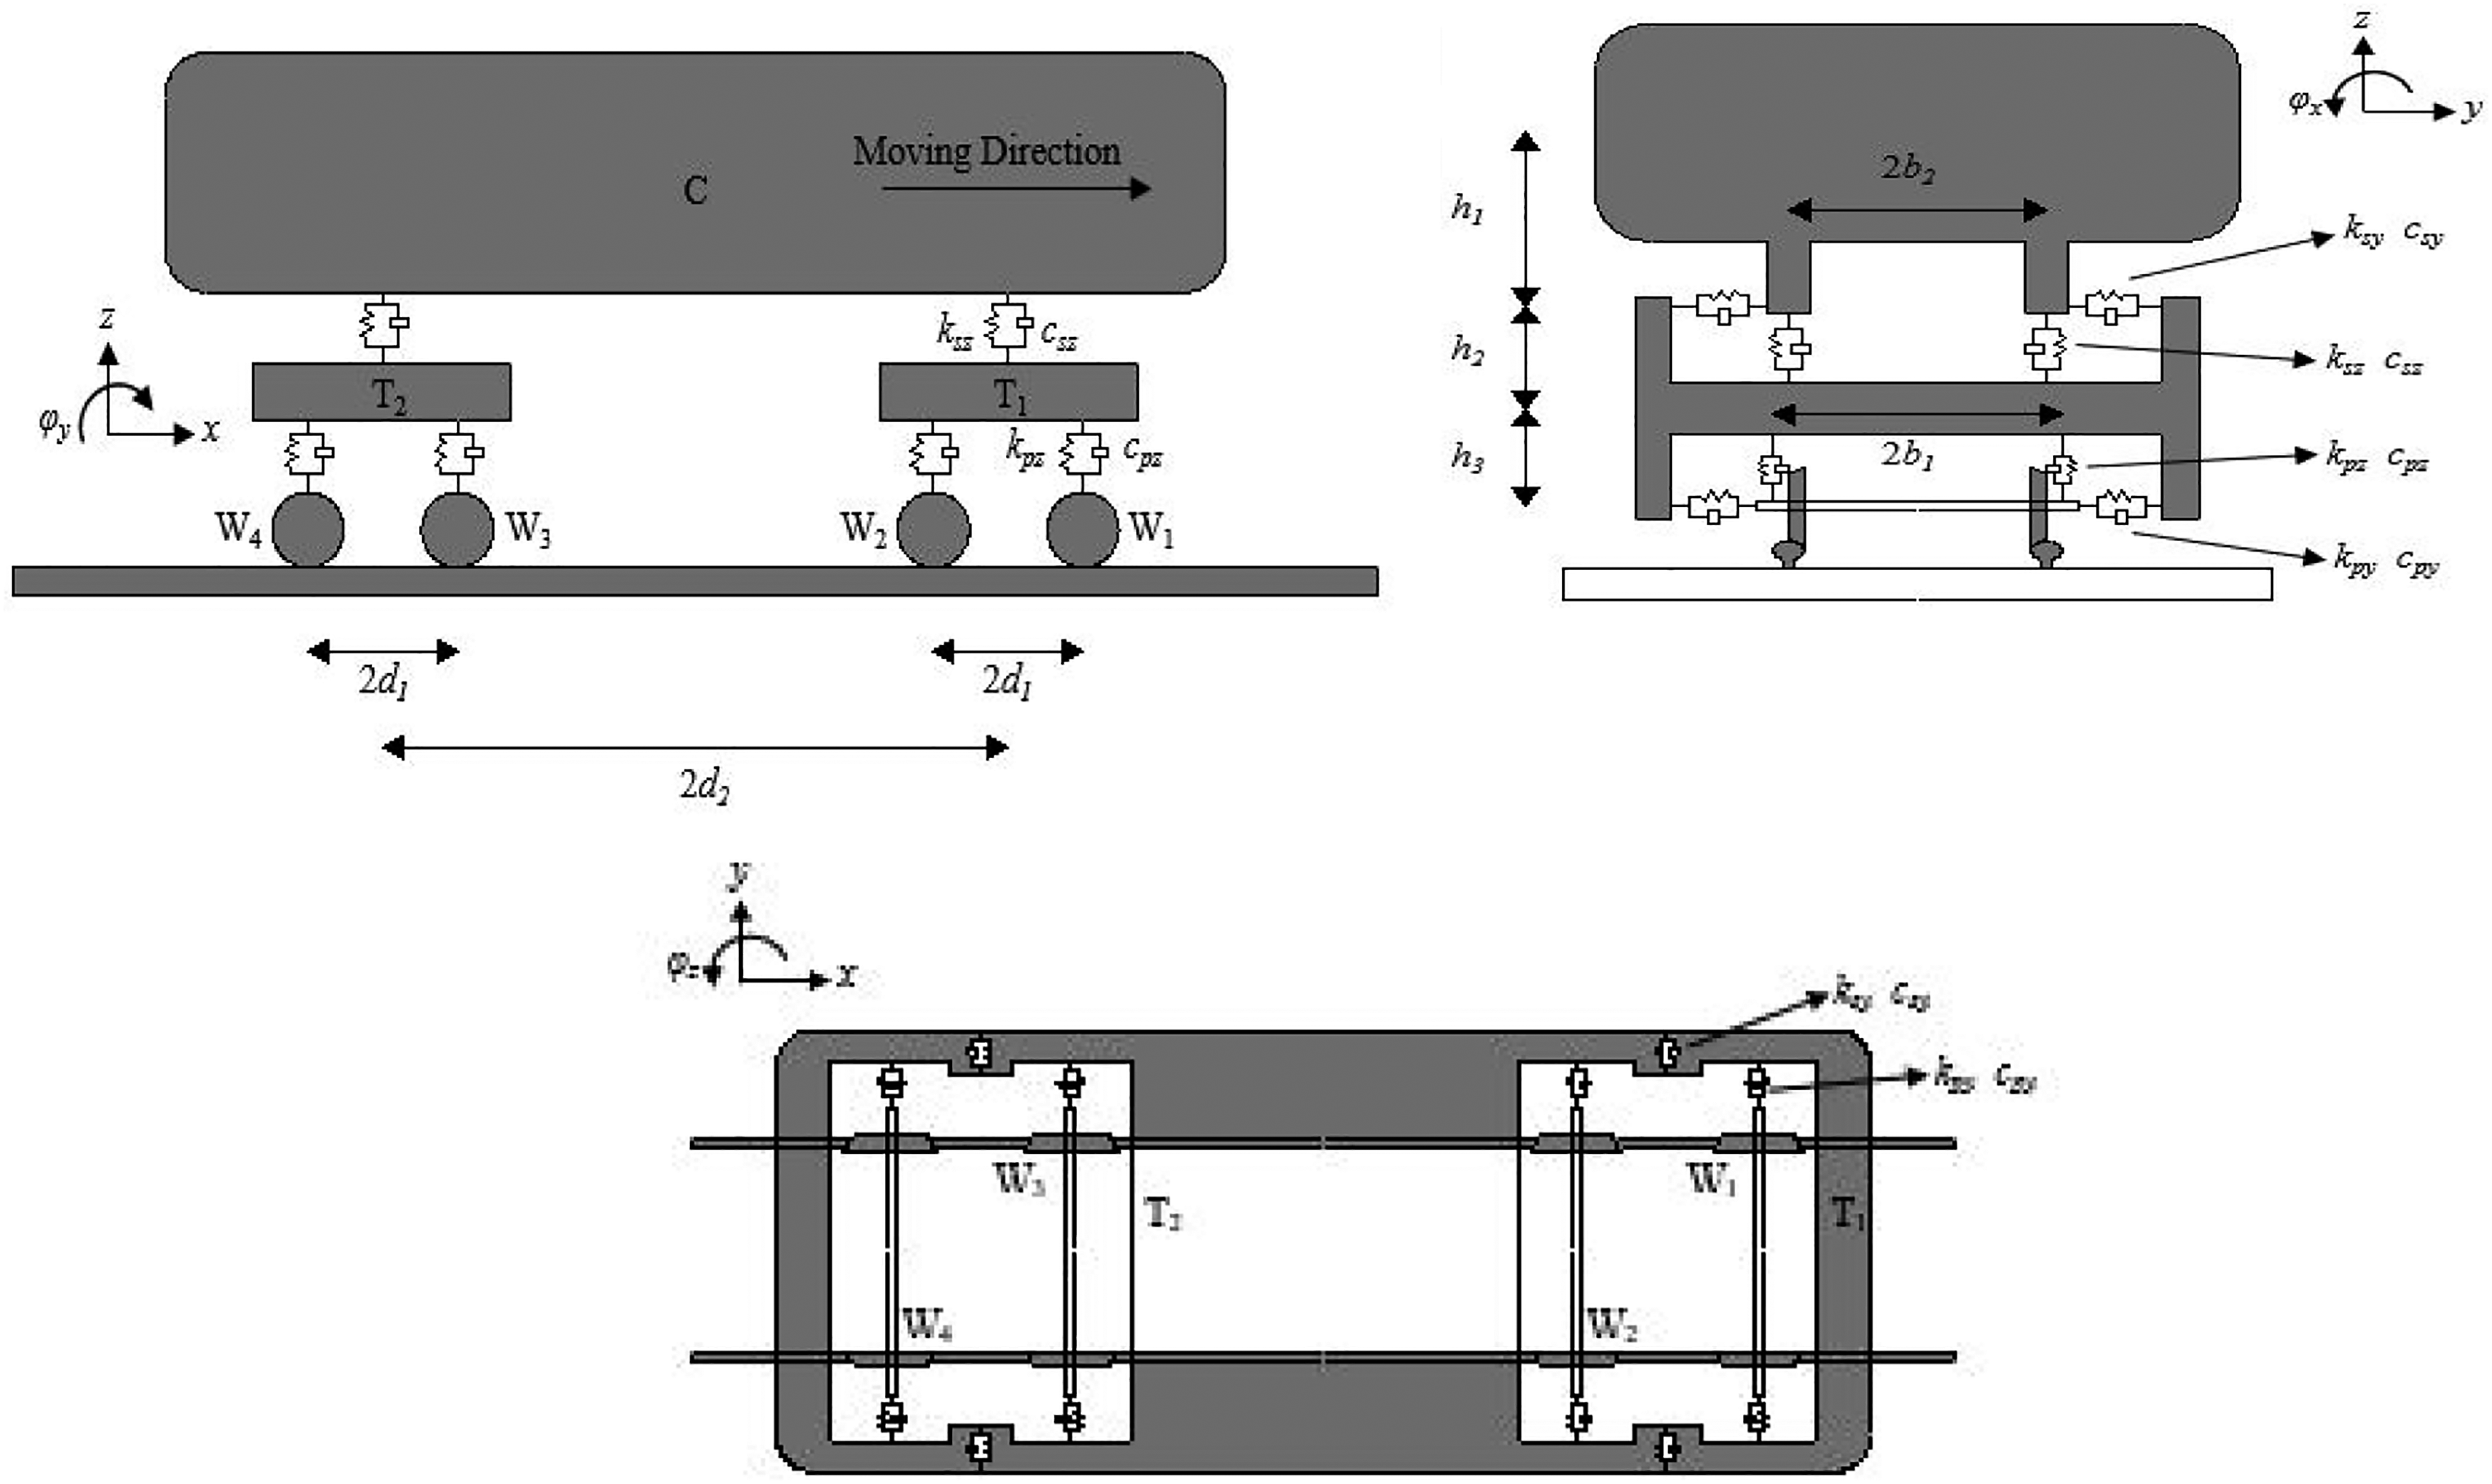

The CRTS II track system contains a track, fasteners, track plate, CA mortar layer, base plate, and slide layer. As mentioned previously, the high-speed railway track–bridge system will be developed using the finite element method. Accordingly, the track, track plate, base plate, bridge, and pier (abutment) are simulated by the Timoshenko beam element. In addition, the fasteners and interlayer components (CA mortar layer and slide layer) and the support between the main girder and the pier (abutment) were connected by spring–damping components, while the pier (abutment) bottom was consolidated.
The finite element method integrates the whole mass, stiffness, and damping matrix of the track–bridge system. The theories of structural dynamics were applied to drive the dynamic equation of the track–bridge system as indicated in equation (2)

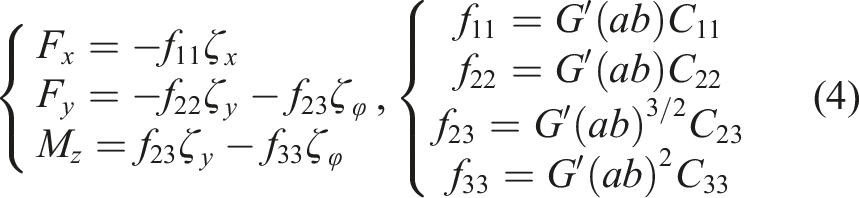
Wheel–rail contact action mainly generates wheel–rail contact forces and lateral creep forces. The wheel–rail contact relationship can be assumed as a knife-edge contact constraint, that is, an ideal conical tread, with the rail considered a hinge point. The calculation of wheel–rail vertical force and lateral creep force can be seen in the reference Lai et al. (2021).
The wheel–rail vertical forces are calculated by means of the Hertz contact theory and can be expressed as

The Kalker linear creep force model was used for lateral creep forces
The dynamic equation of the train–track–bridge coupled system is given by equation (5), which is produced by combining equation (1) and equation (2)
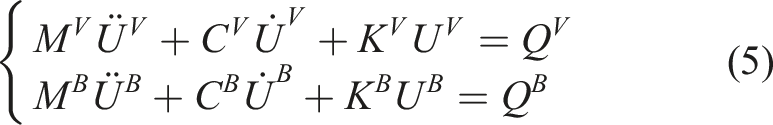
The matrix form is derived from equation (6)
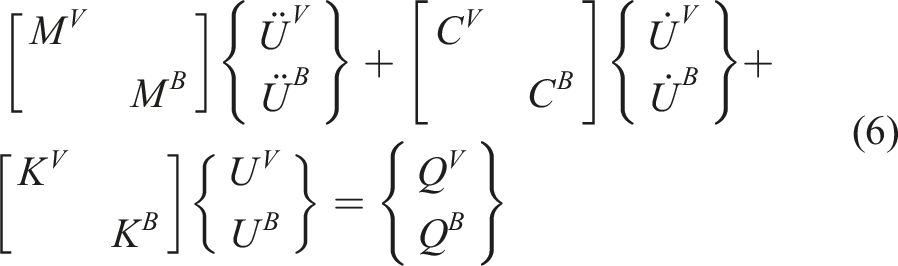
A step-by-step integration method is utilized to solve the matrix equation using the Newmark-β approach. In this study, an automated tool called “TTBCS” is developed for modeling train–track–bridge coupled vibration.
2.2. Model validation
In case 1, the finite element algorithm of a high-speed railway’s 10-span, 32 m simply supported concrete beam bridge is built to verify the TTBCS program. The ICE3 high-speed train, with eight carriages (2M + 6T) arranged into groups, with a running speed of 250 km/h, was chosen as the training model. It uses random irregularity time-domain samples produced by the German low-interference spectrum. The specific parameters for the track–bridge system are described in the reference Yu et al. (2022). The TTBCS’s calculated results are compared to those obtained from TTBSIM (Zhai, 2020) (a comprehensive software for train–track–bridge dynamic simulation and analysis in the reference Zhai (2020)). The TTBSIM has proven its extensive validity through the validation of real-world data, so this section mainly uses TTBSIM results to verify the correctness of TTBCS.
Figure 3 shows the comparison of vertical and lateral deflection and acceleration response time-history curves of the mid-span node of the fifth-span main girder. They indicate that the calculated time-history curves from the TTBSIM software and the TTBCS program are in good agreement overall, validating the applicability of the TTBCS program, except for a slight deviation in the amplitude of the high-frequency components due to the randomness of the initial track irregularity. Comparison of dynamic response time-history curves of the primary girder mid-span node: (a) deflection and (b) acceleration.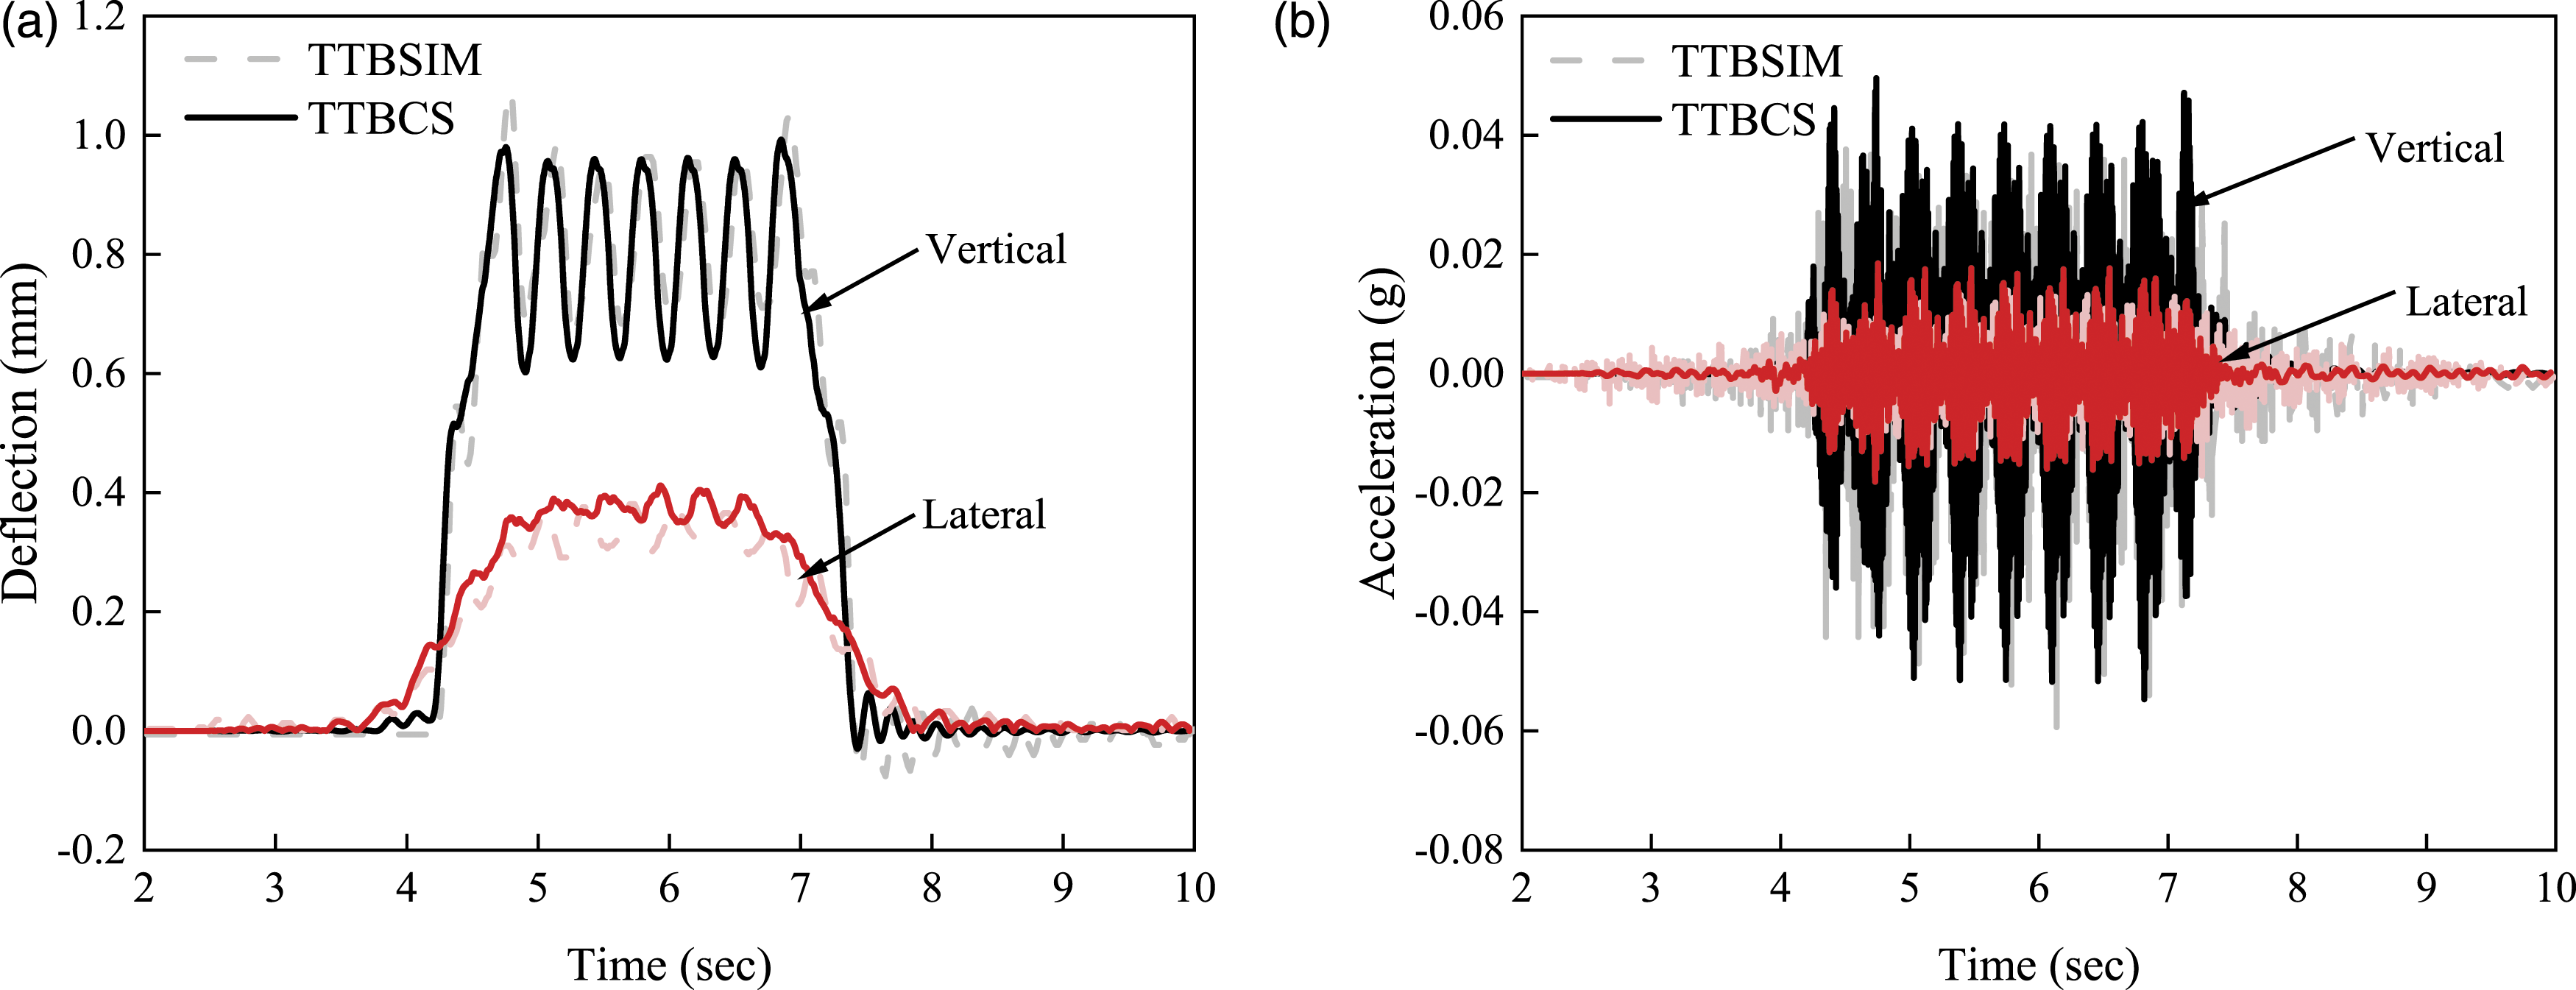
In case 2, the calculation results of TTBCS program are compared with the results of high-speed train bridge crossing test of Beijing–Tianjin intercity railway in the reference Zhai (2020). The test vehicle is CRH3 EMU, and the track irregularity is simulated by the irregularity samples generated by German low-interference spectrum. The calculation speed is set to 200 km/h ∼ 400 km/h (interval 20 km/h), and the vertical displacement and vertical acceleration of the bridge, wheel load reduction rate, and derailment coefficient of the trains are compared, as shown in Figure 4. The comparison results further prove the rationality of the TTBCS program. Comparison of train–bridge dynamic response under different speeds: (a) vertical deflection and vertical acceleration and (b) wheel load reduction rate and derailment coefficient.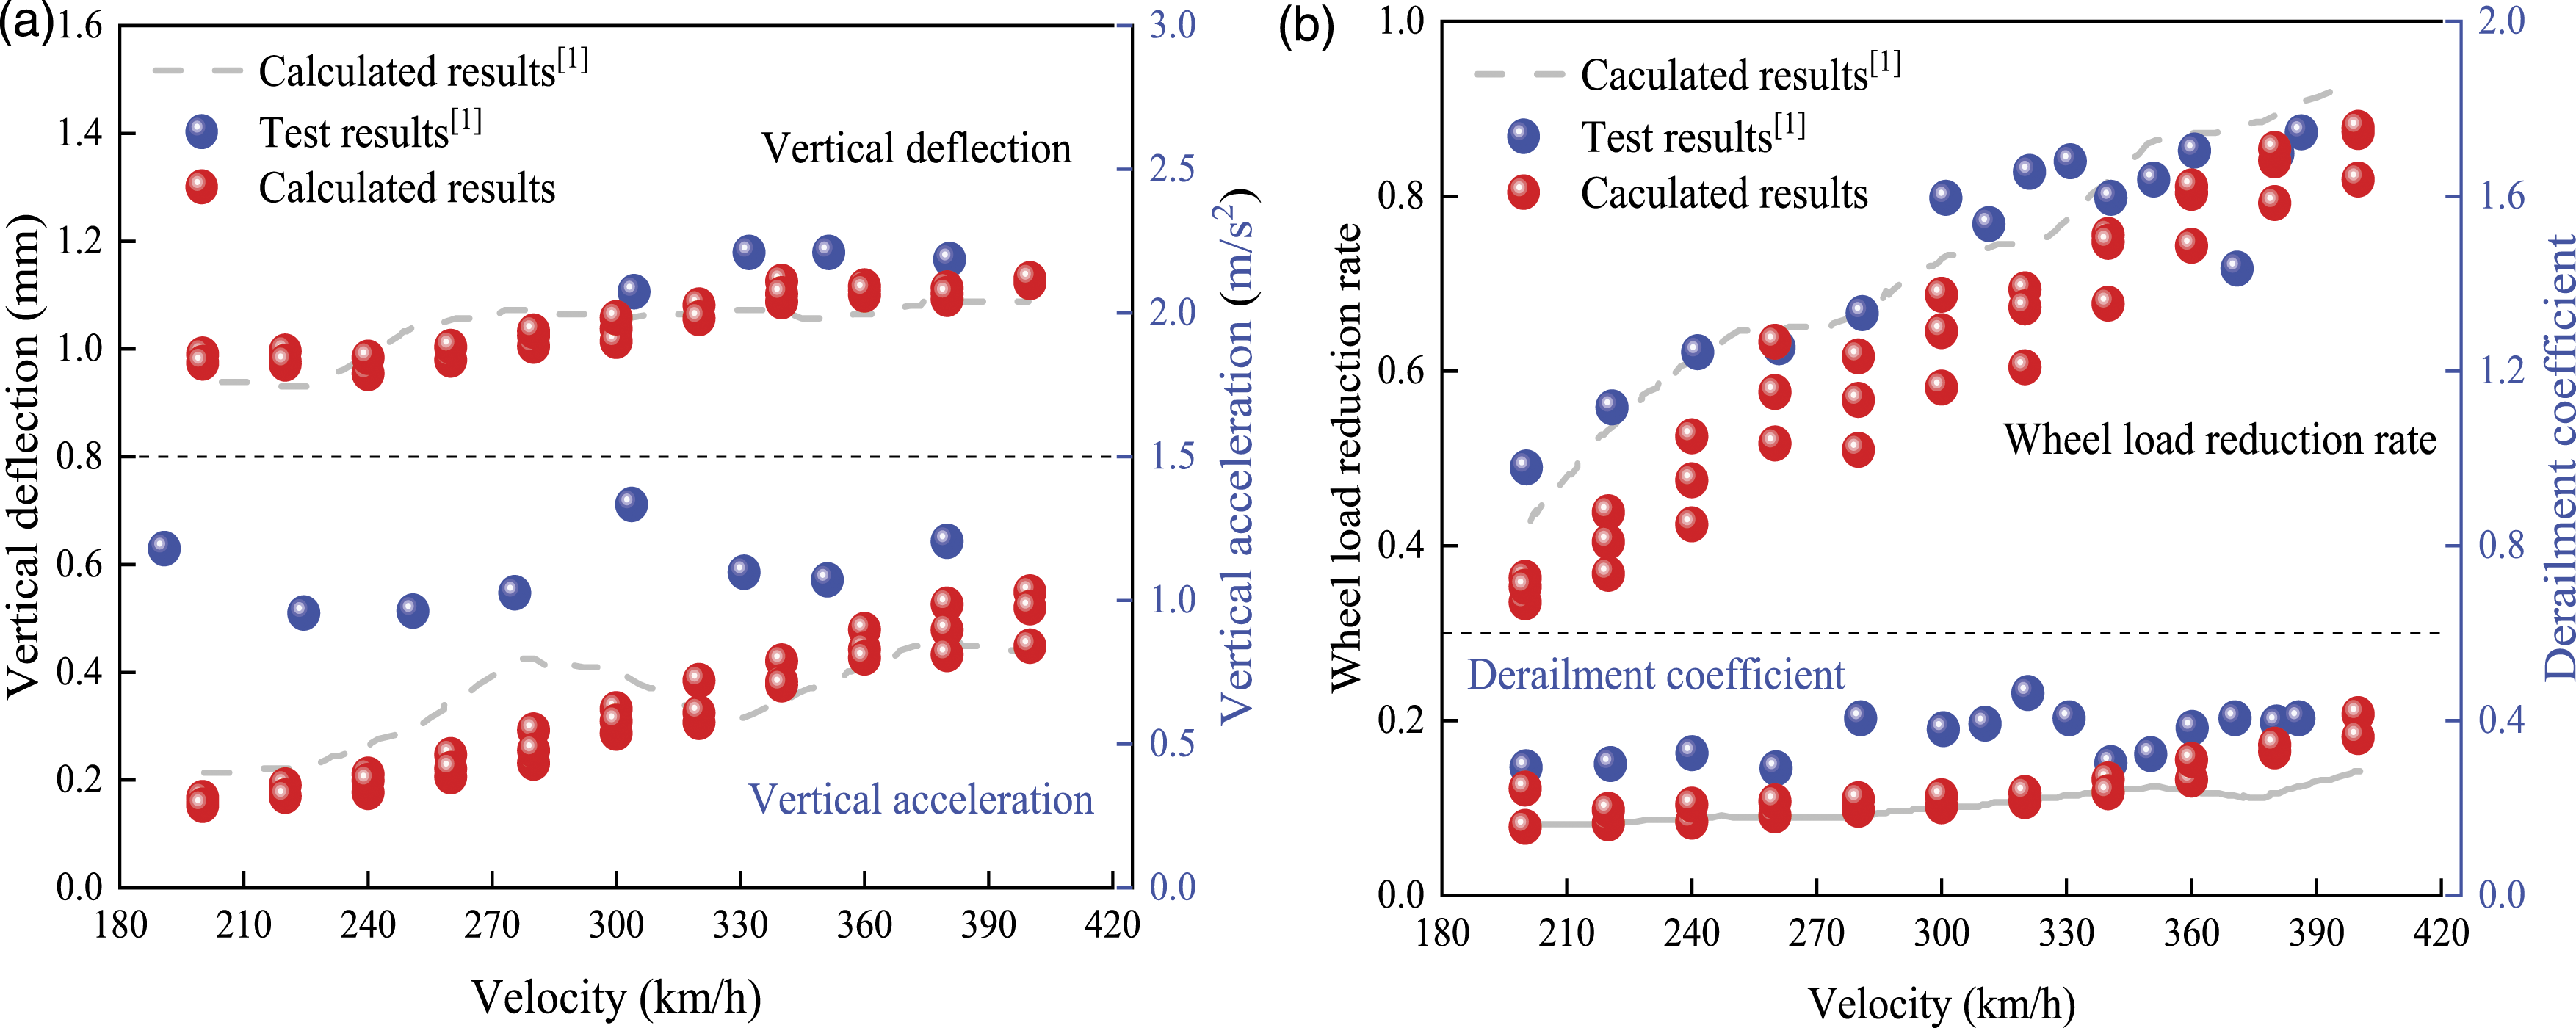
3. Stability test of high-speed railway performance indicators under additional transverse bridge dislocations
3.1. Initial track irregularity
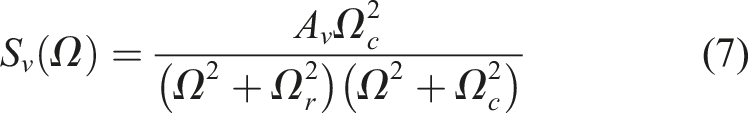
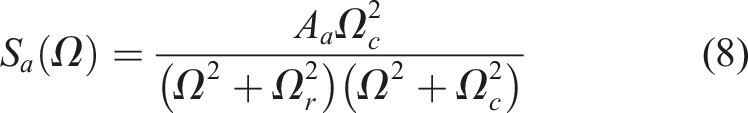
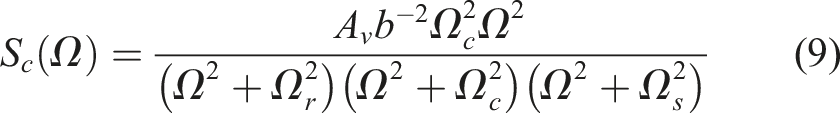
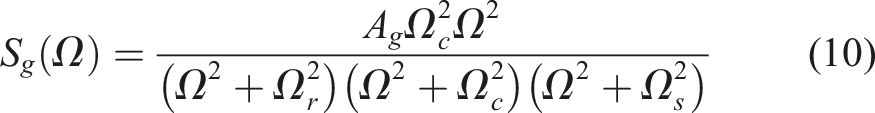
The median spectrum or average spectrum of track irregularity, also known as PSD, is a simple expression of the initial track irregularity, which is a stable Gaussian random process. It is possible to describe the PSD curve of the German low-interference spectrum as
The triangular series method is used in treating track irregularity as a stationary random process, and the initial track irregularity simulation value can be generated by the triangular series method German high-speed railway track irregularity geometric samples: (a) vertical irregularity and (b) directional irregularity.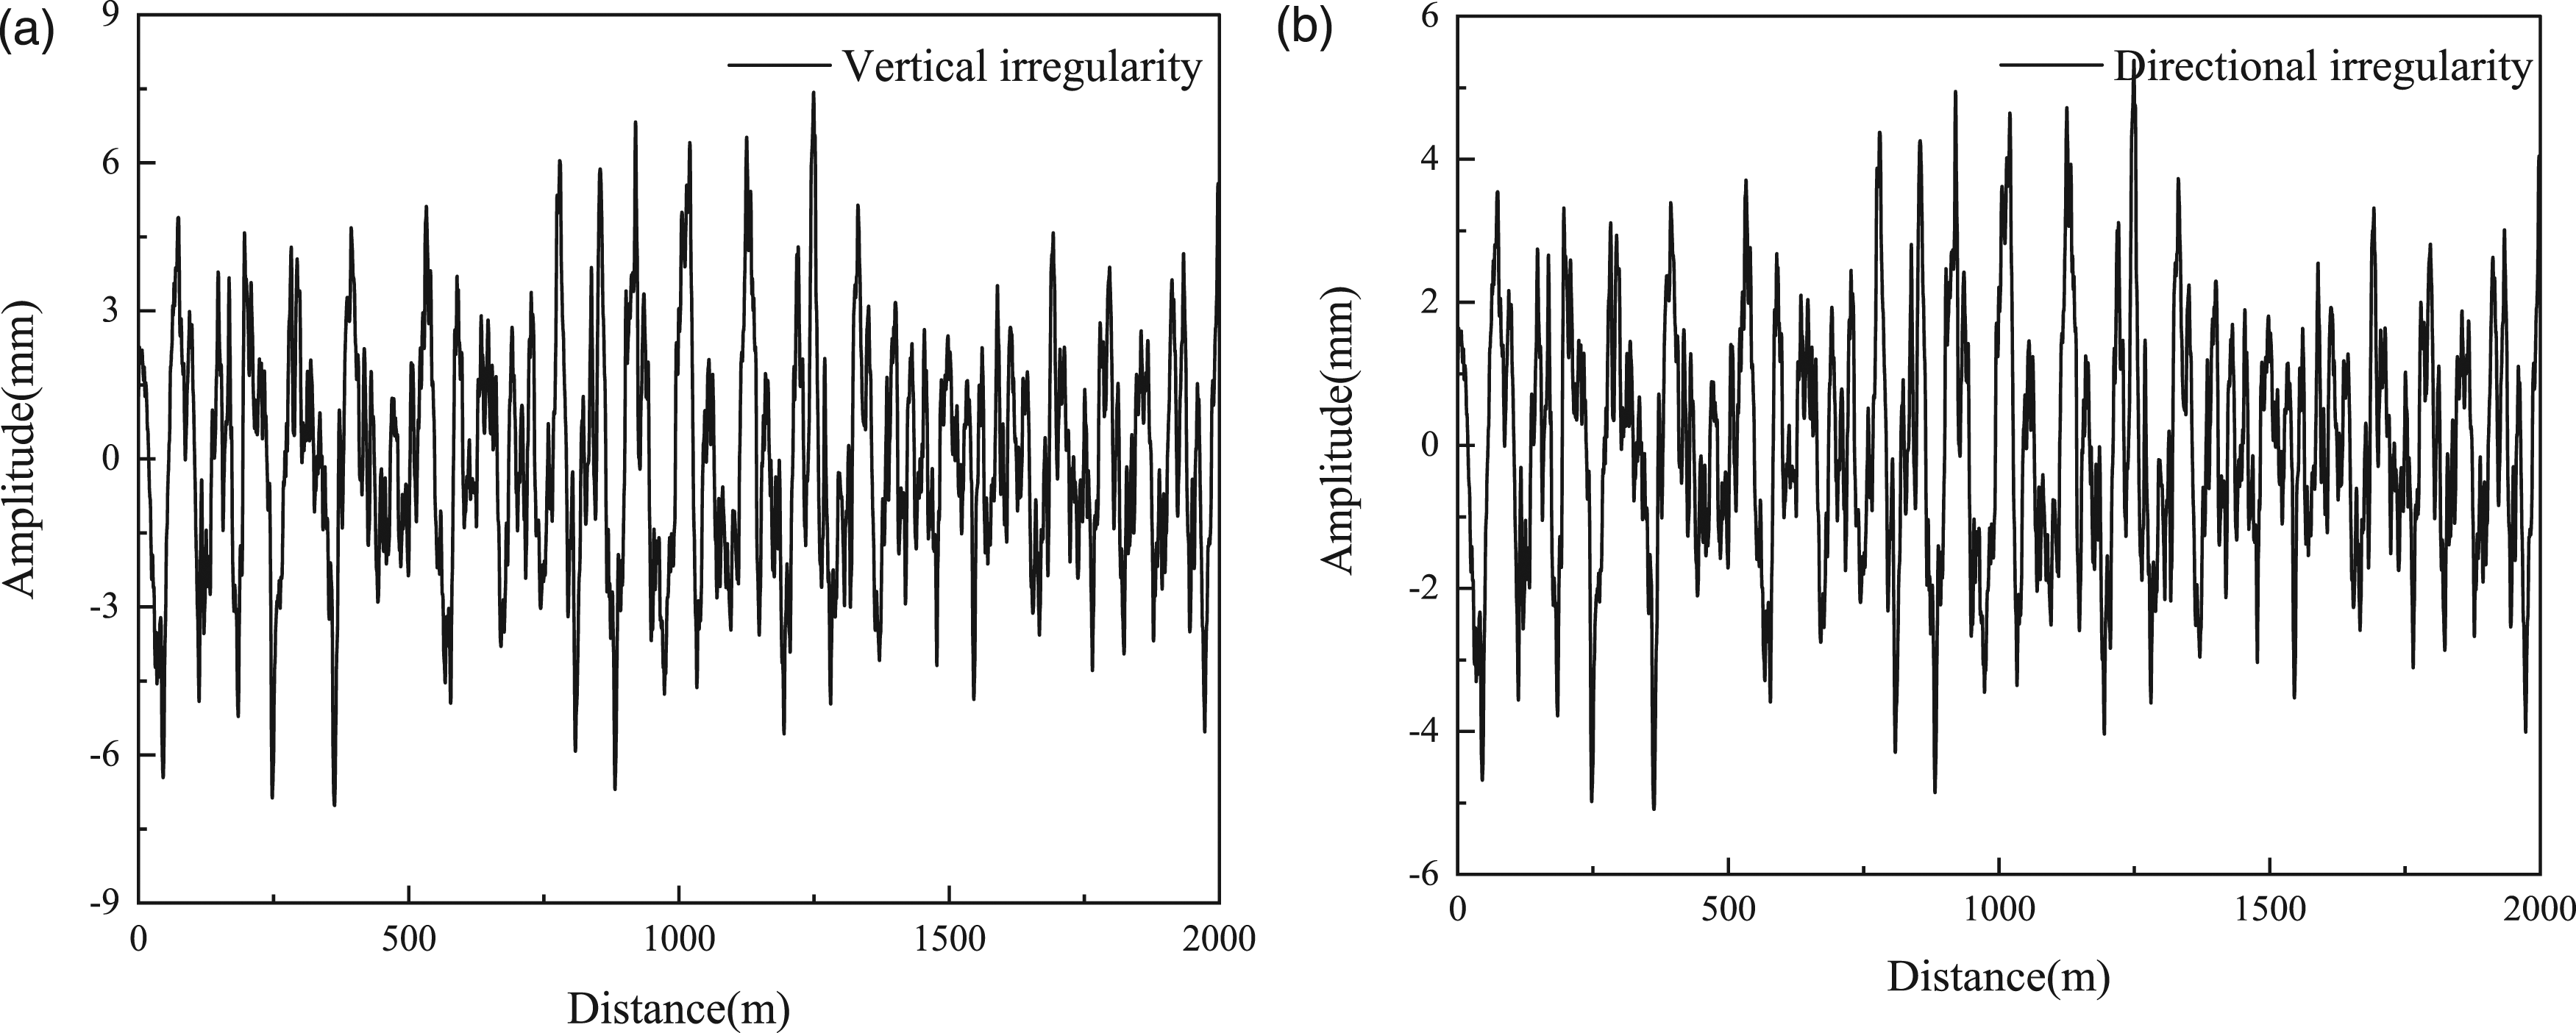
3.2. Track irregularity caused by bridge transverse dislocation
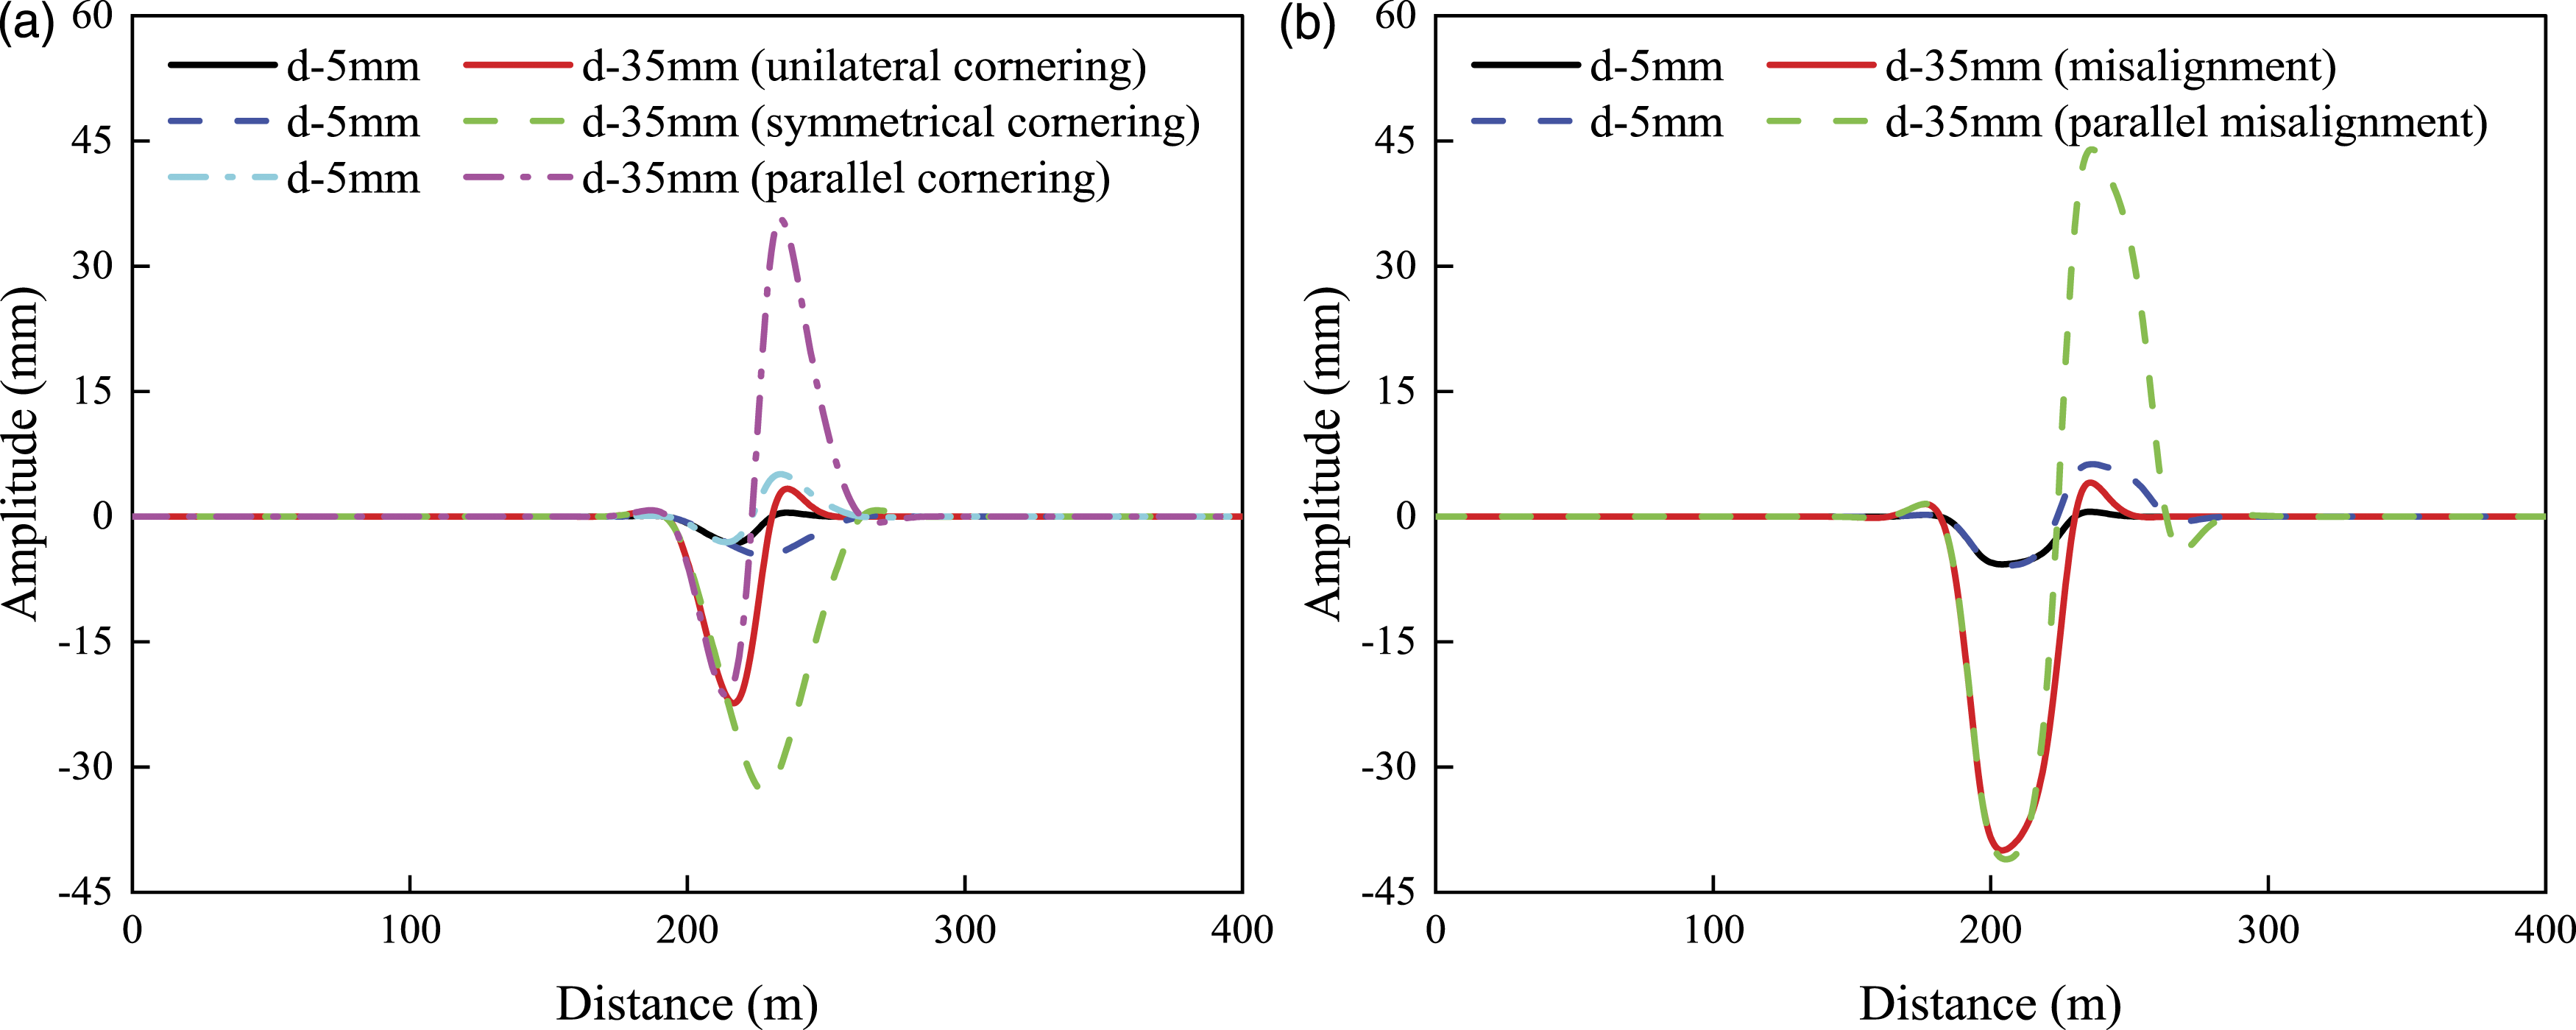
Beam cornering and misalignment are two of the most common transverse permanent dislocation patterns that may occur on high-speed railway bridges due to natural disasters, including impacts, earthquakes, and typhoons. Based on the finite element model of the track–bridge system in Section 2.1, five representative extra transverse dislocations modes of the bridge are considered (Figure 6) to calculate the rail mapping deformation. Figure 7 displays geometric samples of rail additional irregularity under five bridge additional transverse dislocation modes. The initial irregularity samples and the additional irregularity samples are superimposed as the external irregularity excitation of the train–track–bridge model. Five additional transverse dislocation modes of bridges. Geometric samples of rail additional irregularity under five additional transverse dislocation modes of bridges: (a) cornering and (b) misalignment.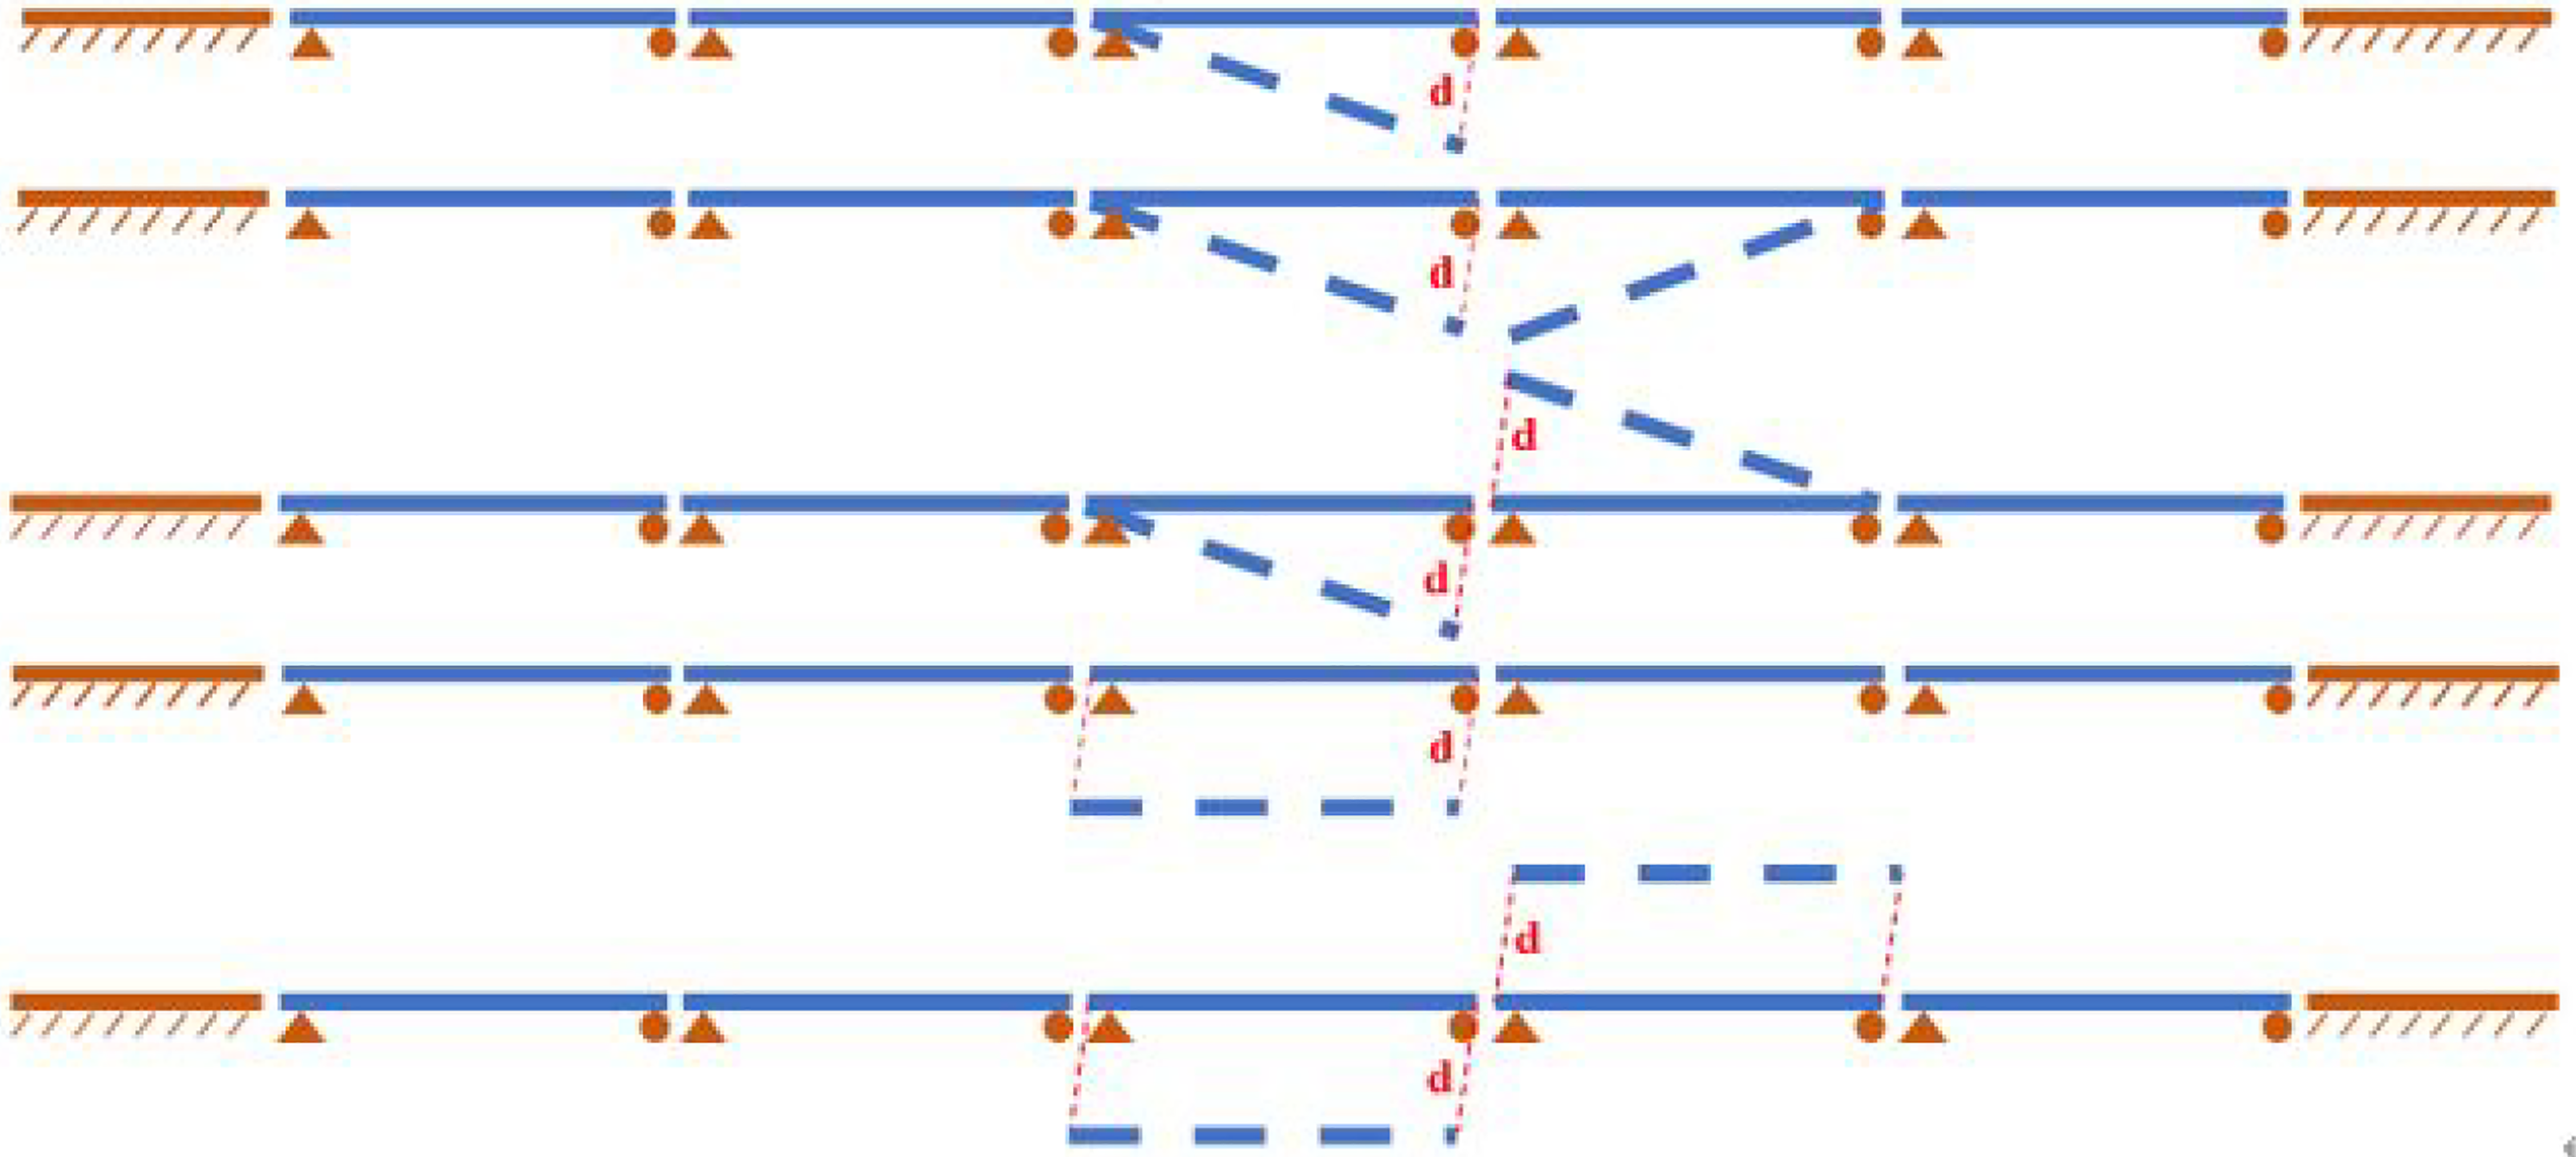
3.3. Probabilistic statistical characteristics of running performance indicators under additional transverse dislocations of bridges
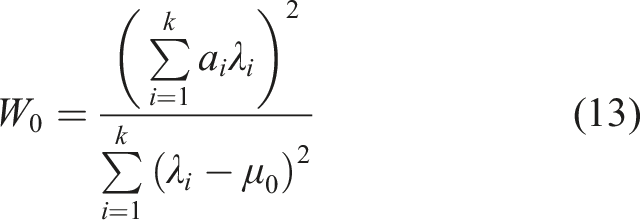
The power spectral density function of the initial track irregularity is a stationary Gaussian random process. Although the rail mapping deformation under the additional transverse dislocation of the bridge is determined, the initial geometric irregularity samples converted by the trigonometric series method and the track irregularity samples formed by superposition still involve randomness. Assuming a total of

Corresponding to the alternative hypothesis,
The null hypothesis
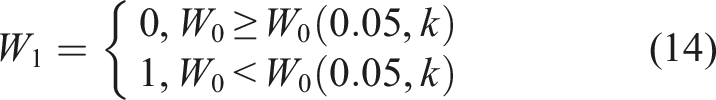
When
By Chebyshev’s Large Number Theorem, as the number of samples increases, the sample
The indigenous level is taken as

Then

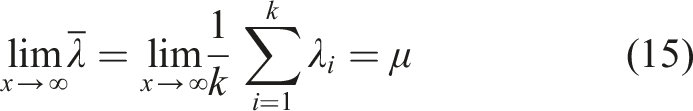
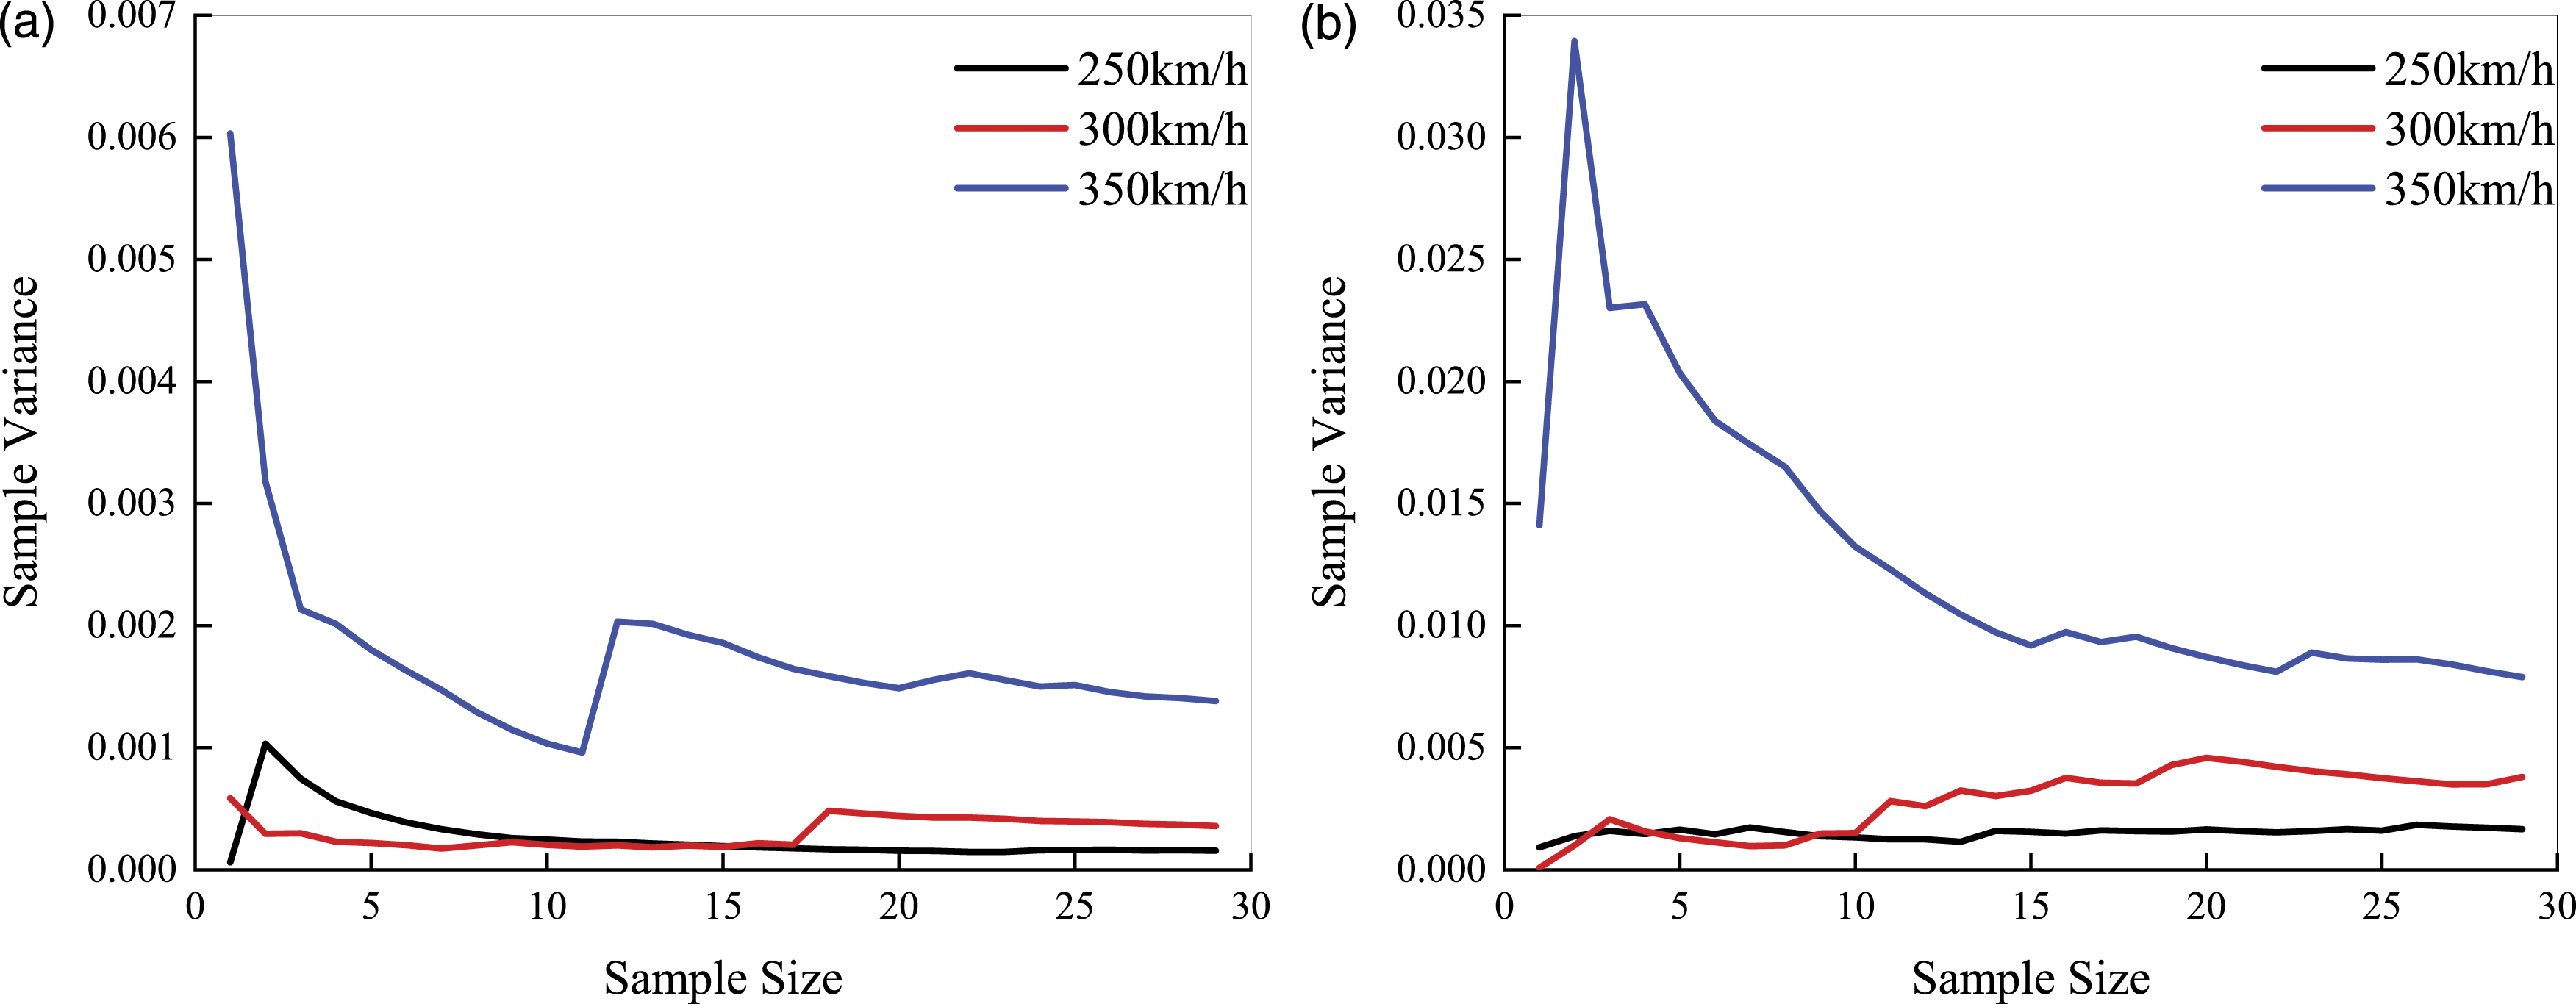
The sample capacity of track irregularity excitation is assumed to be Sample averages of running performance indicators: (a) derailment coefficient and (b) wheel load reduction rate. Sample variances of running performance indicators: (a) derailment coefficient and (b) wheel load reduction rate.
4. Influence of bridge additional transverse dislocations on running performance of high-speed trains
A 5-span ballastless track-simply supported system and ICE3 EMU are chosen for analysis, and a sufficiently long subgrade section is taken to eliminate the effect of subgrade section constraints. Thirty samples of track irregularities are taken for each type of dislocation amplitude to calculate the dynamic response of the train–track–bridge system, with the aim of investigating the influence of dislocation amplitude on the running performance of high-speed trains under five additional transverse dislocation modes of bridges. The calculation results of each sample are checked for normality using SW tests according to the analysis method in Section 3. When determining the running performance index of high-speed trains subject to this type of dislocation amplitude, an upper limit is generated for each sample with a confidence level of 0.95.
4.1. Transverse unilateral cornering
When the right end of the third span beam suffers a transverse dislocation of 0.155‰ rad, 0.31‰ rad, 0.465‰ rad, 0.62‰ rad, 0.775‰ rad, 0.93‰ rad, and 1.085‰ rad transverse dislocation, the maximum transverse displacement of the beam end is 5 mm, 10 mm, 15 mm, 20 mm, 25 mm, 30 mm, and 35 mm. Figure 10 depicts the computed findings of the running performance indices of high-speed trains at different speeds, involving the transverse acceleration, transverse Sperling index, derailment coefficient, and wheel load reduction rate. Accordingly, the transverse dynamic performance indices of high-speed trains rise significantly with the growth of the transverse dislocation amplitude of the girders. The greatest excess in the transverse acceleration of the car body is 105.1%, the maximum increase of the transverse Sperling index is 28.1%, and the highest rise in the derailment coefficient is 47.9%. The wheel load reduction rate is not sensitive to the change of the beam transverse dislocation amplitude, which means that the transverse unilateral corner dislocation of the beam has less influence on the vertical dynamic performance of high-speed trains. However, the safety and comfort indices of the high-speed train do not exceed the specification limits, and the comfort level of the train operation decreases. It is recommended that the transverse Sperling index be used as a control indicator to regulate the operational speed of high-speed trains suitably. Influence of transverse unilateral cornering of girders on running performance of high-speed trains: (a) lateral acceleration and Sperling index and (b) derailment coefficient and wheel load reduction rate.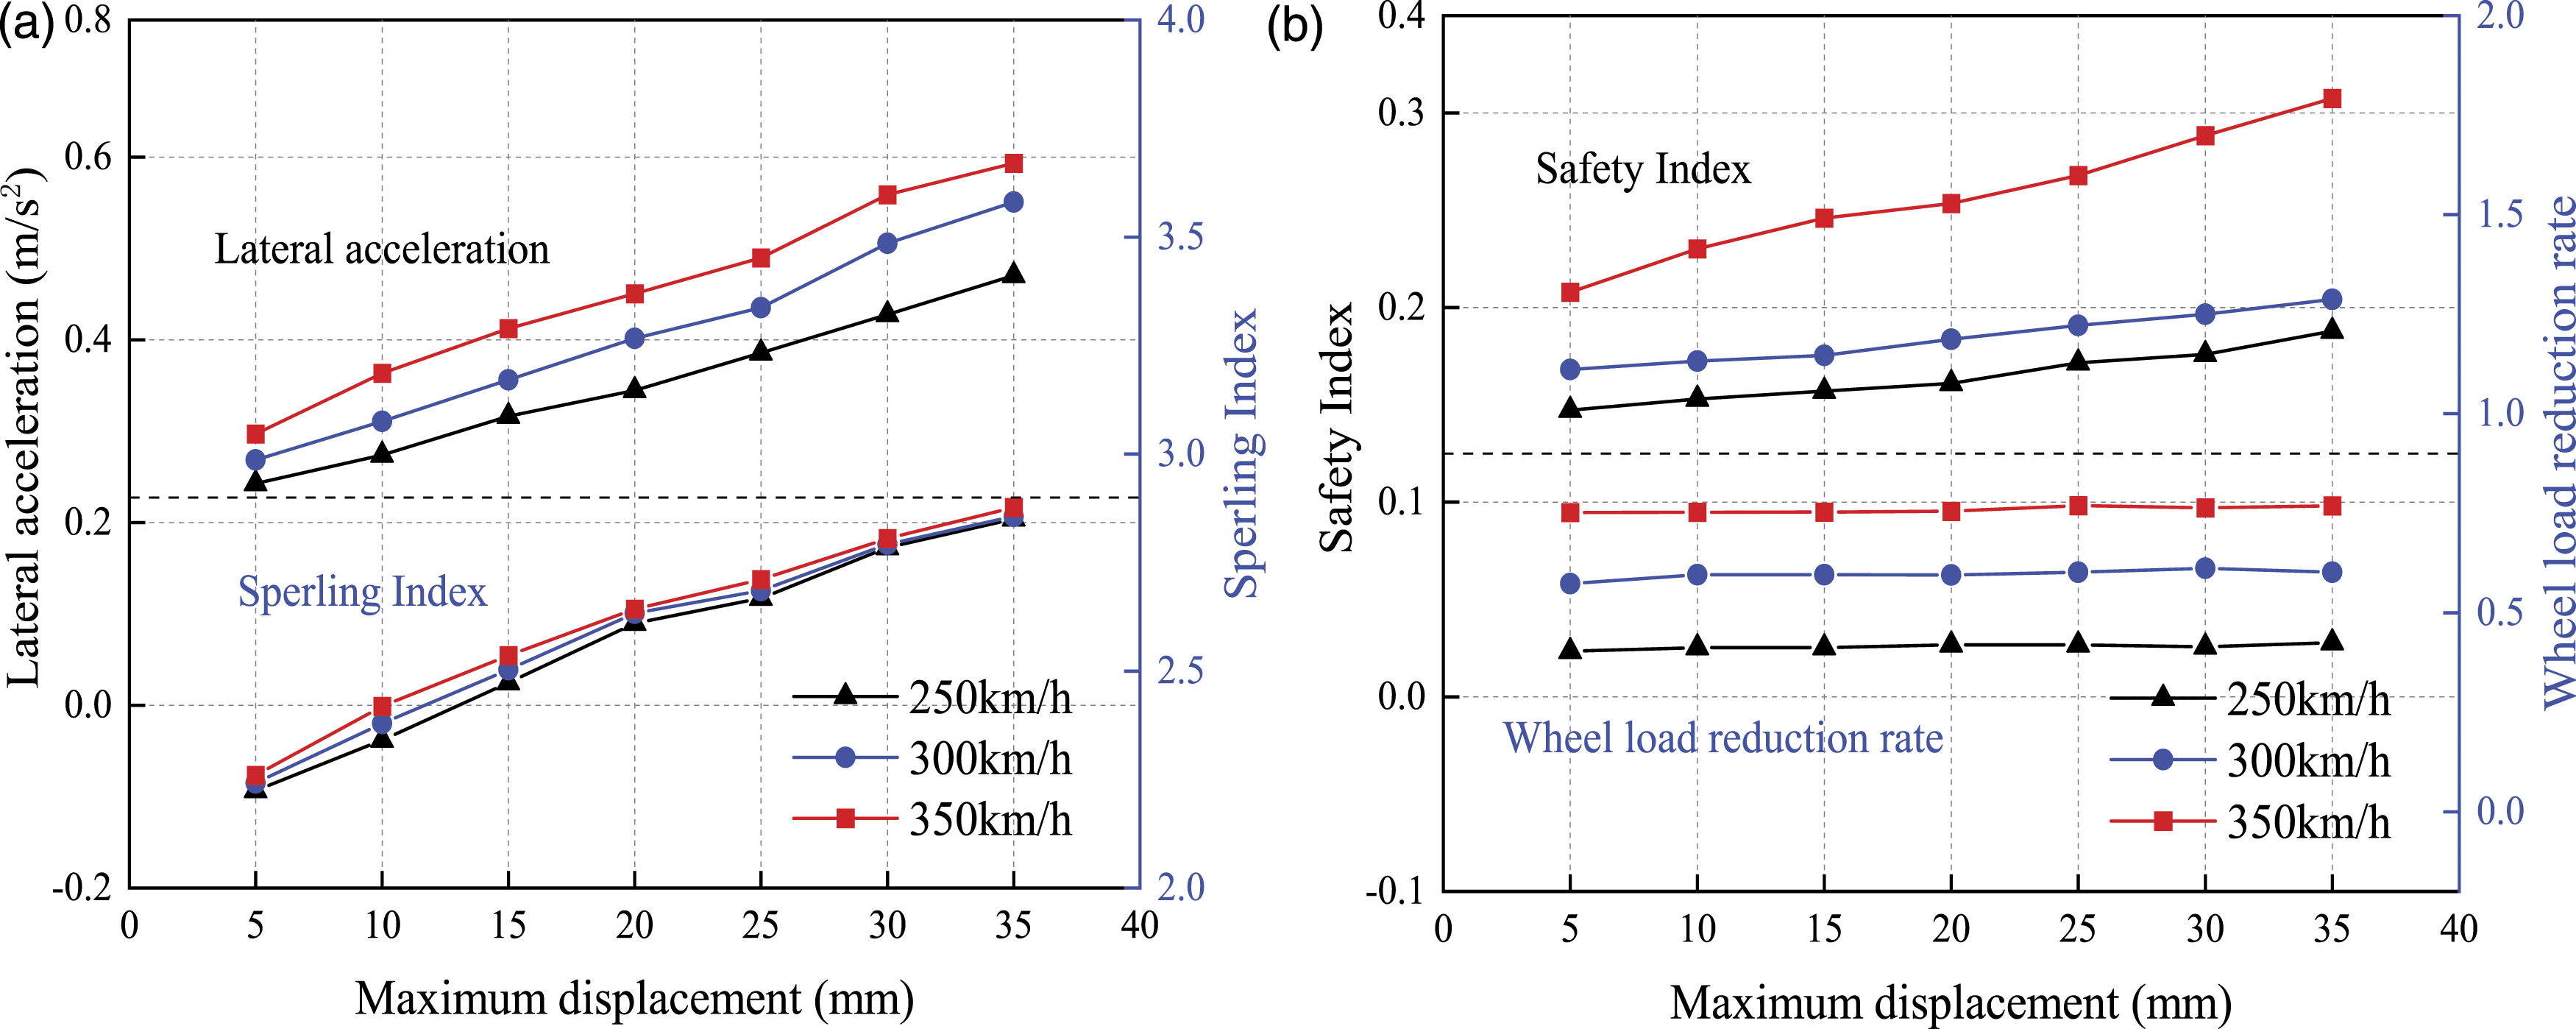
4.2. Transverse symmetrical cornering
Under the condition of transverse symmetric corner dislocation, when ± (0.155‰) rad, ± (0.31‰) rad, ± (0.465‰) rad, ± (0.62‰) rad, ± (0.775‰) rad, ± (0.93‰) rad, and ± (1.085‰) rad transverse symmetric corner dislocation occurs at the joint of third span and fourth span, respectively, the corresponding maximum transverse symmetric corner displacement at the end of the beam is 5 mm, 10 mm, 15 mm, 20 mm, 25 mm, 30 mm, and 35 mm, respectively. Figure 11 indicates the performance index of high-speed trains at different speeds. As can be seen from Figure 11, the transverse dynamic performance indexes of the high-speed train improve noticeably with increasing the beam transverse dislocation amplitude, while the vertical dynamic performance of the car body is less affected by growing beam transverse symmetric corner. The maximum rise in the transverse acceleration of the car body is 190.4%, the maximum increase in the transverse Sperling index is 35.9%, and the maximum increase in derailment coefficient is 67.7%. At a maximum transverse displacement of 30.5 mm at the beam end, the Sperling index at a speed of 350 km/h exceeds the Sperling index limit in the specification. It is suggested that the transverse Sperling index be used as the control index to reduce the speed appropriately and ensure running safety. The threshold value in the girders at a speed of 350 km/h based on the probability guarantee rate is computed to be 0.946‰ rad. Influence of transverse symmetrical cornering of girders on running performance of high-speed railway: (a) lateral acceleration and Sperling index and (b) derailment coefficient and wheel load reduction rate.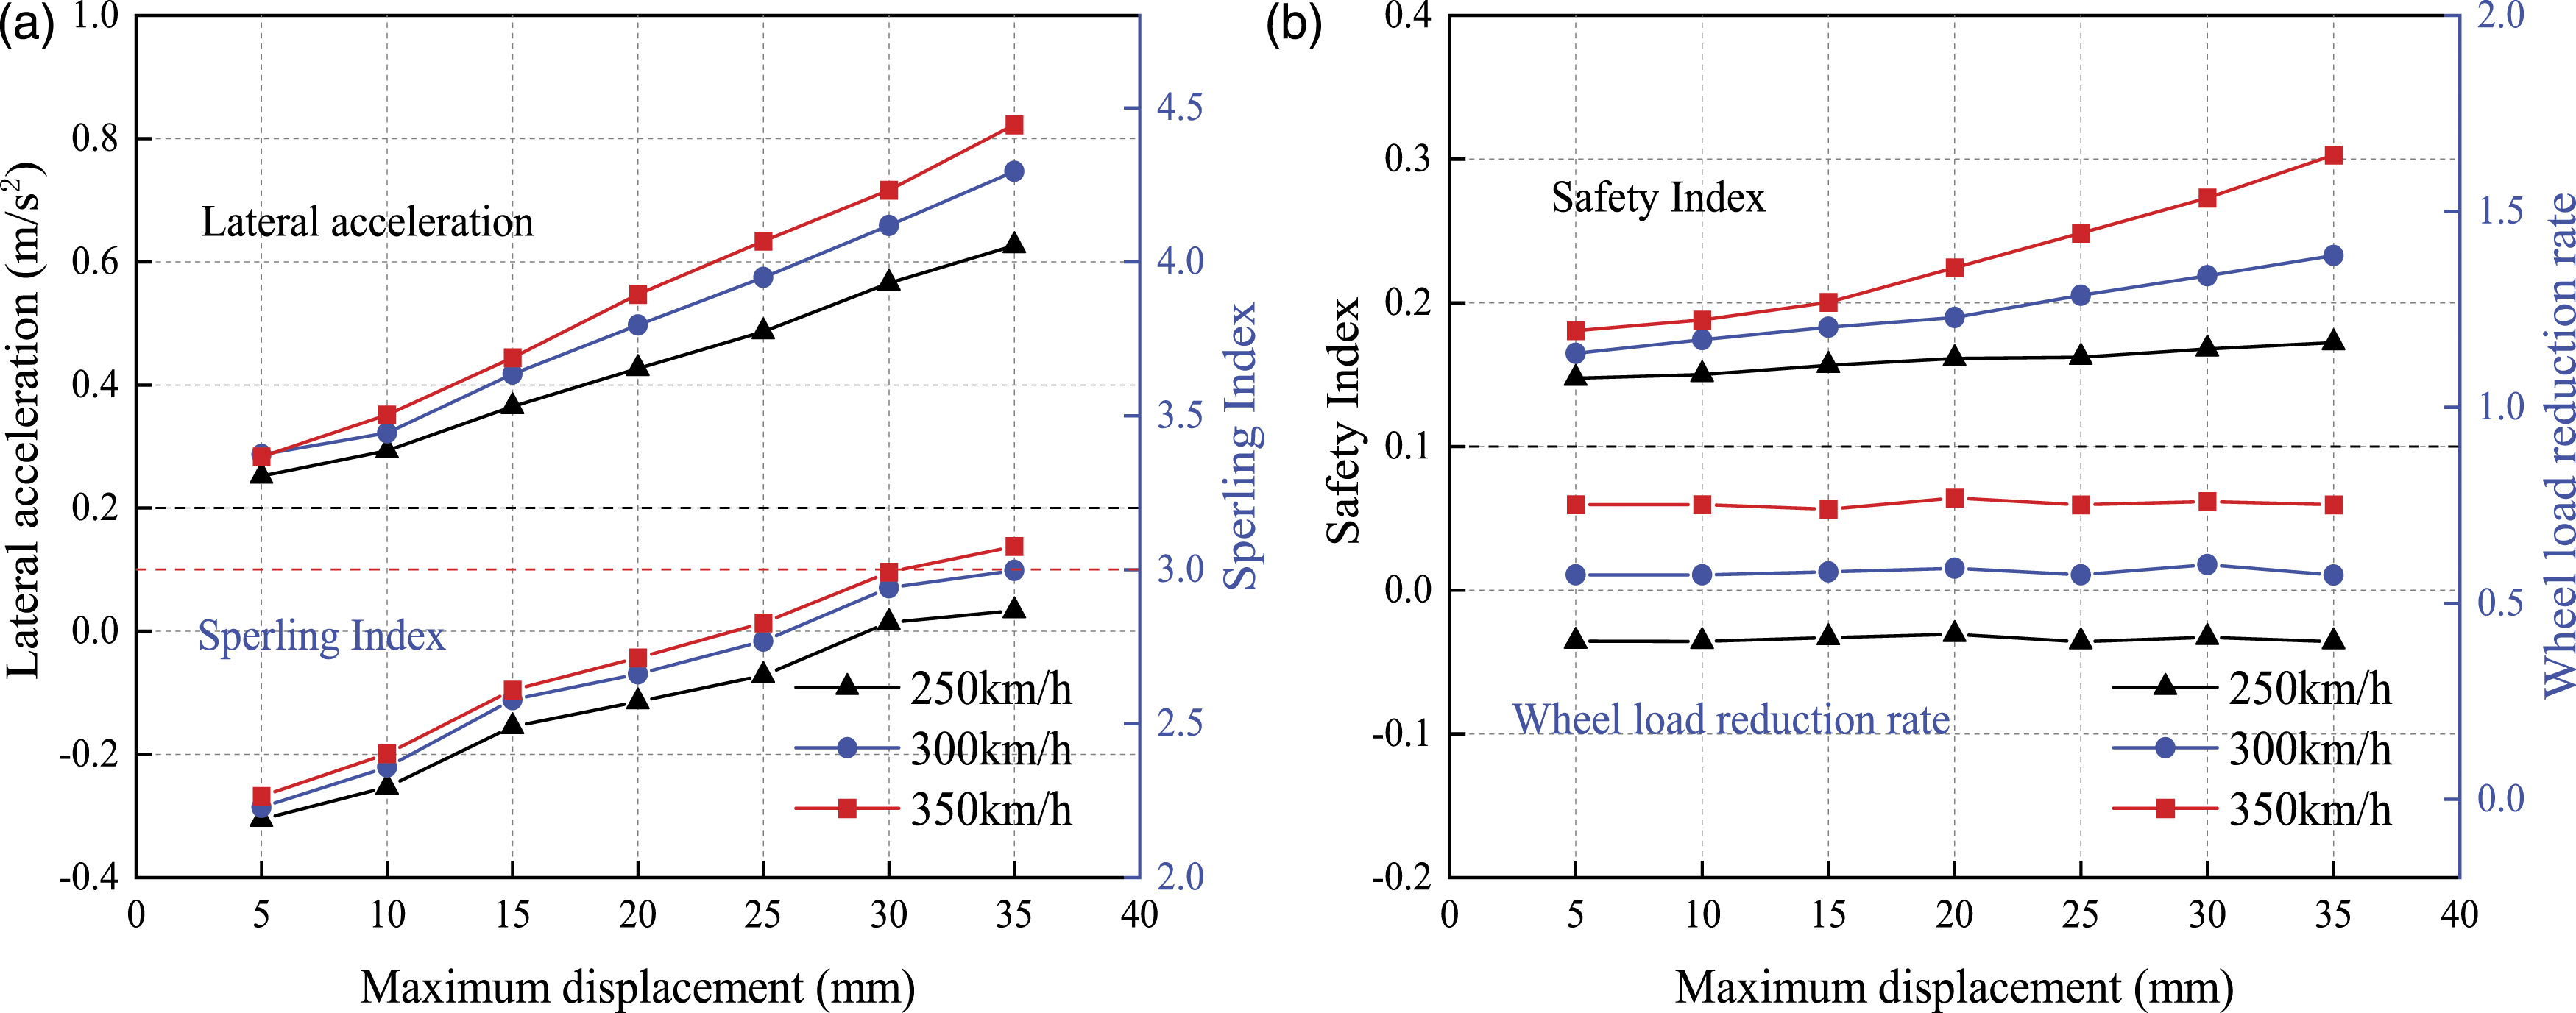
4.3. Transverse parallel cornering
The calculation results of the running performance index of high-speed trains at different speeds are shown in Figure 12. Generally, it was observed that when 0.155‰ rad, 0.31‰ rad, 0.465‰ rad, 0.62‰ rad, 0.775‰ rad, 0.93‰ rad, and 1.085‰ rad transverse parallel corner dislocations occur simultaneously at the right end of the third span and the left end of forth span, the corresponding maximum transverse displacement values of the beam ends are 5 mm, 10 mm, 15 mm, 20 mm, 25 mm, 30 mm, and 35 mm, respectively. On the other hand, with the exception of the wheel load reduction rate, it was noticed that all the running performance indicators increase significantly with the increase of the transverse parallel corner dislocation of the beams. The maximum increase in transverse acceleration of the car body is 242.7%, the maximum rise of the derailment coefficient is 192.4%, the maximum increase of the transverse Sperling index is 49.1%, and the Sperling index has exceeded the specification limit. Taking the transverse Sperling index as the control index, the threshold values of transverse parallel cornering dislocation of the girders based on the probability guarantee rate for high-speed trains at 250 km/h, 300 km/h, and 350 km/h are 0.644‰ rad, 0.639‰ rad, and 0.634‰ rad, respectively. Influence of transverse parallel cornering of girders on running performance of high-speed railway: (a) vertical acceleration, (b) Sperling index, (c) derailment coefficient, and (d) wheel load reduction rate.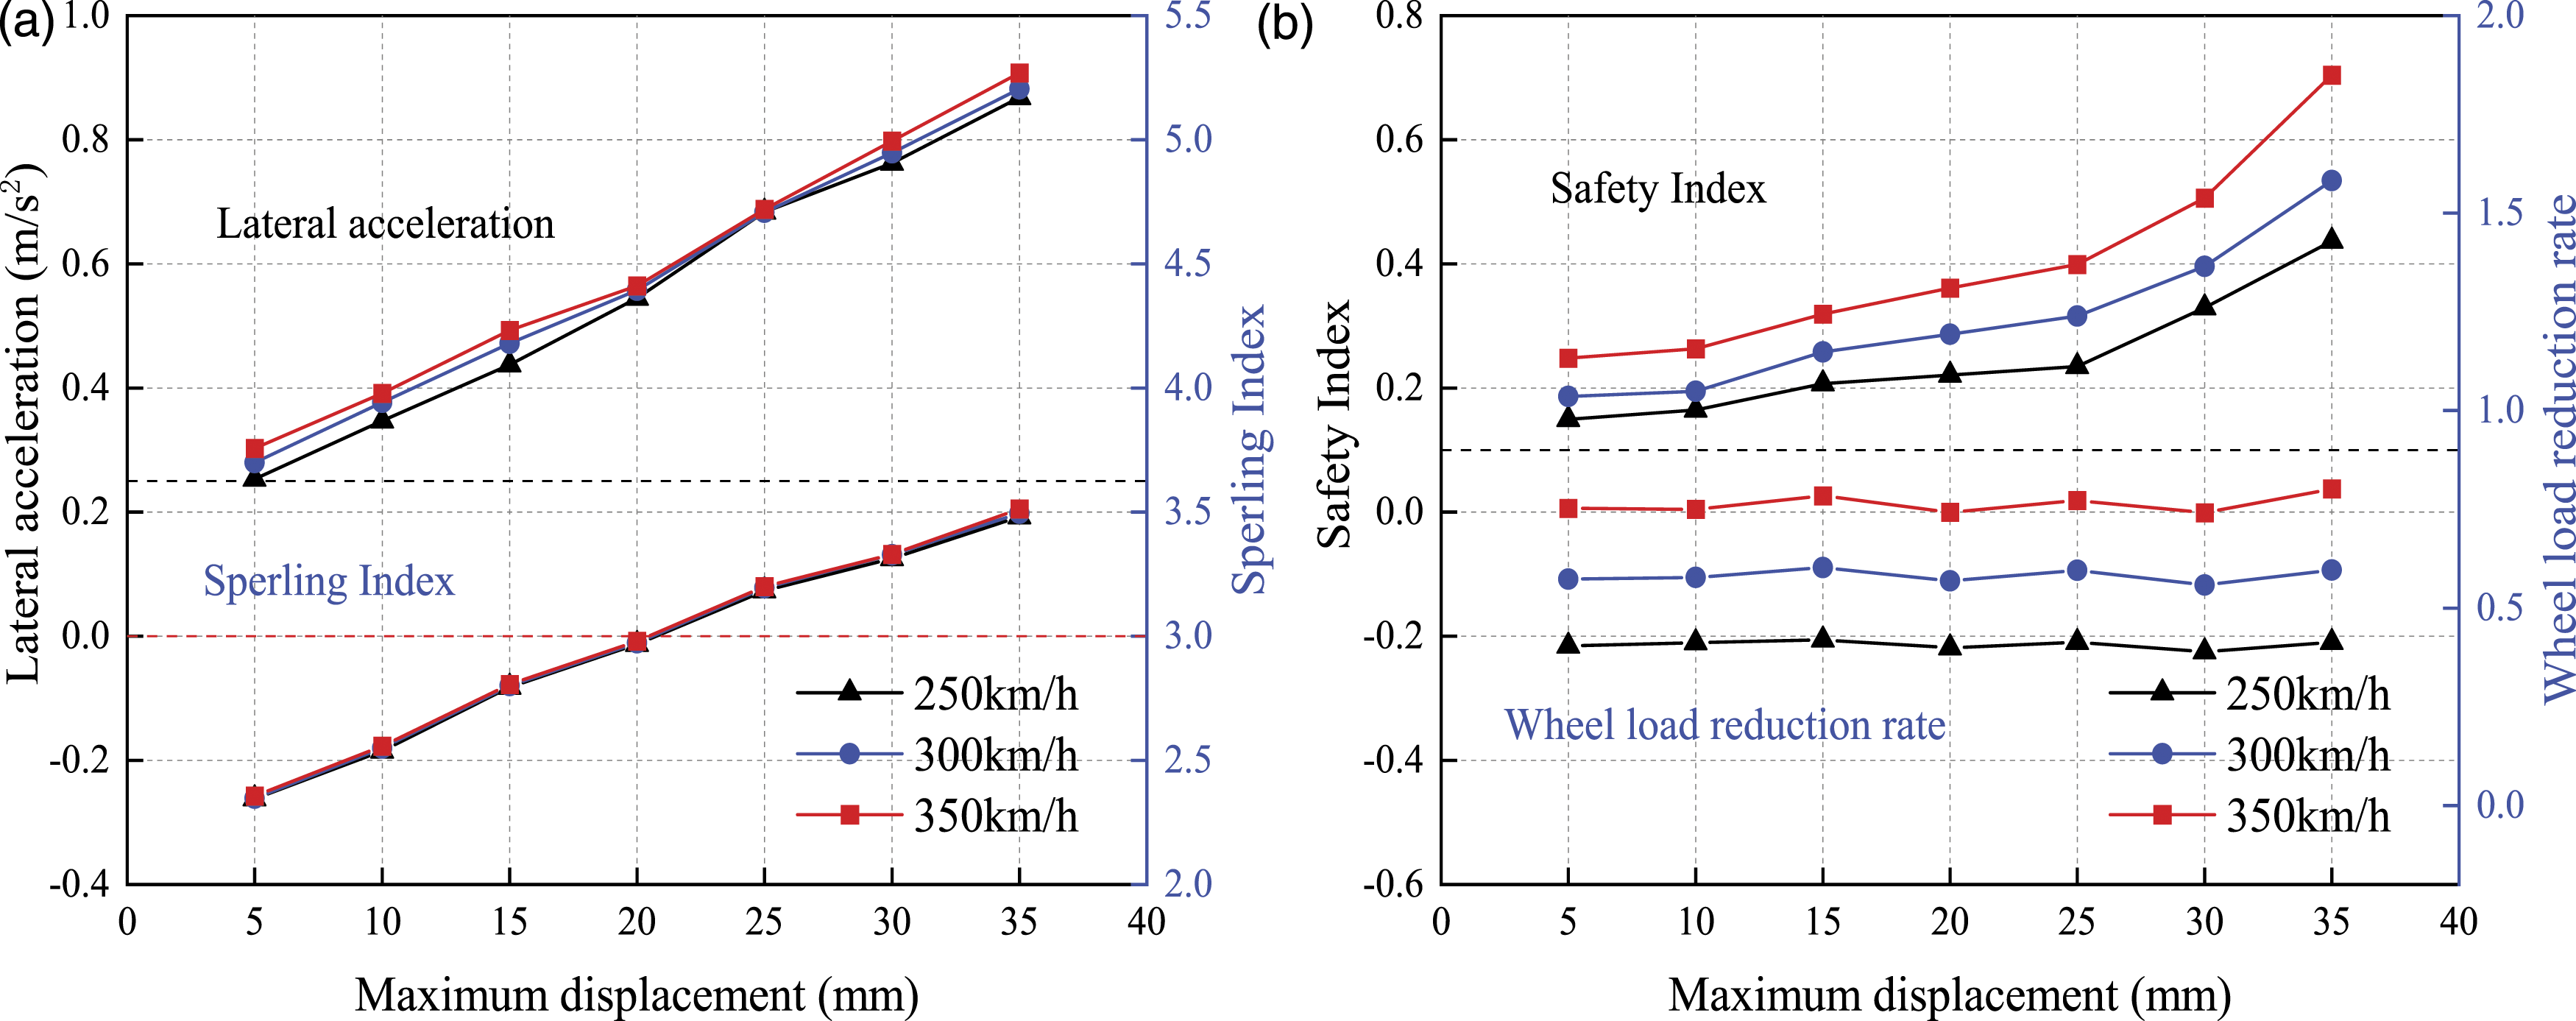
4.4. Transverse misalignment
The calculation results of the performance indicators for high-speed trains at different speeds are shown in Figure 13 when the beam at the third span has a transverse misalignment of 5 mm, 10 mm, 15 mm, 20 mm, 25 mm, 30 mm, and 35 mm. The transverse running performance indicators of high-speed trains increase significantly with raising the transverse misalignment dislocation of the beam. The maximum increase in the transverse acceleration of the car body is 269.4%, the maximum increase in the derailment coefficient is 146.6%, and the maximum increase in the transverse Sperling index is 48.2%; the transverse acceleration of the car body and the Sperling index have exceeded the specification limits. With the transverse acceleration as the control index, the transverse dislocation thresholds of high-speed trains based on probability guarantee rate at 250 km/h, 300 km/h, and 350 km/h are 34.5 mm, 33.3 mm, and 32.3 mm, respectively. With the transverse Sperling index as the control index, the transverse dislocation thresholds of high-speed trains based on probability guarantee rate at 250 km/h, 300 km/h, and 350 km/h are 23.2 mm, 21.4 mm, and 20.9 mm, respectively. Influence of transverse misalignment of girders on running performance of high-speed railway: (a) lateral acceleration and Sperling index and (b) derailment coefficient and wheel load reduction rate.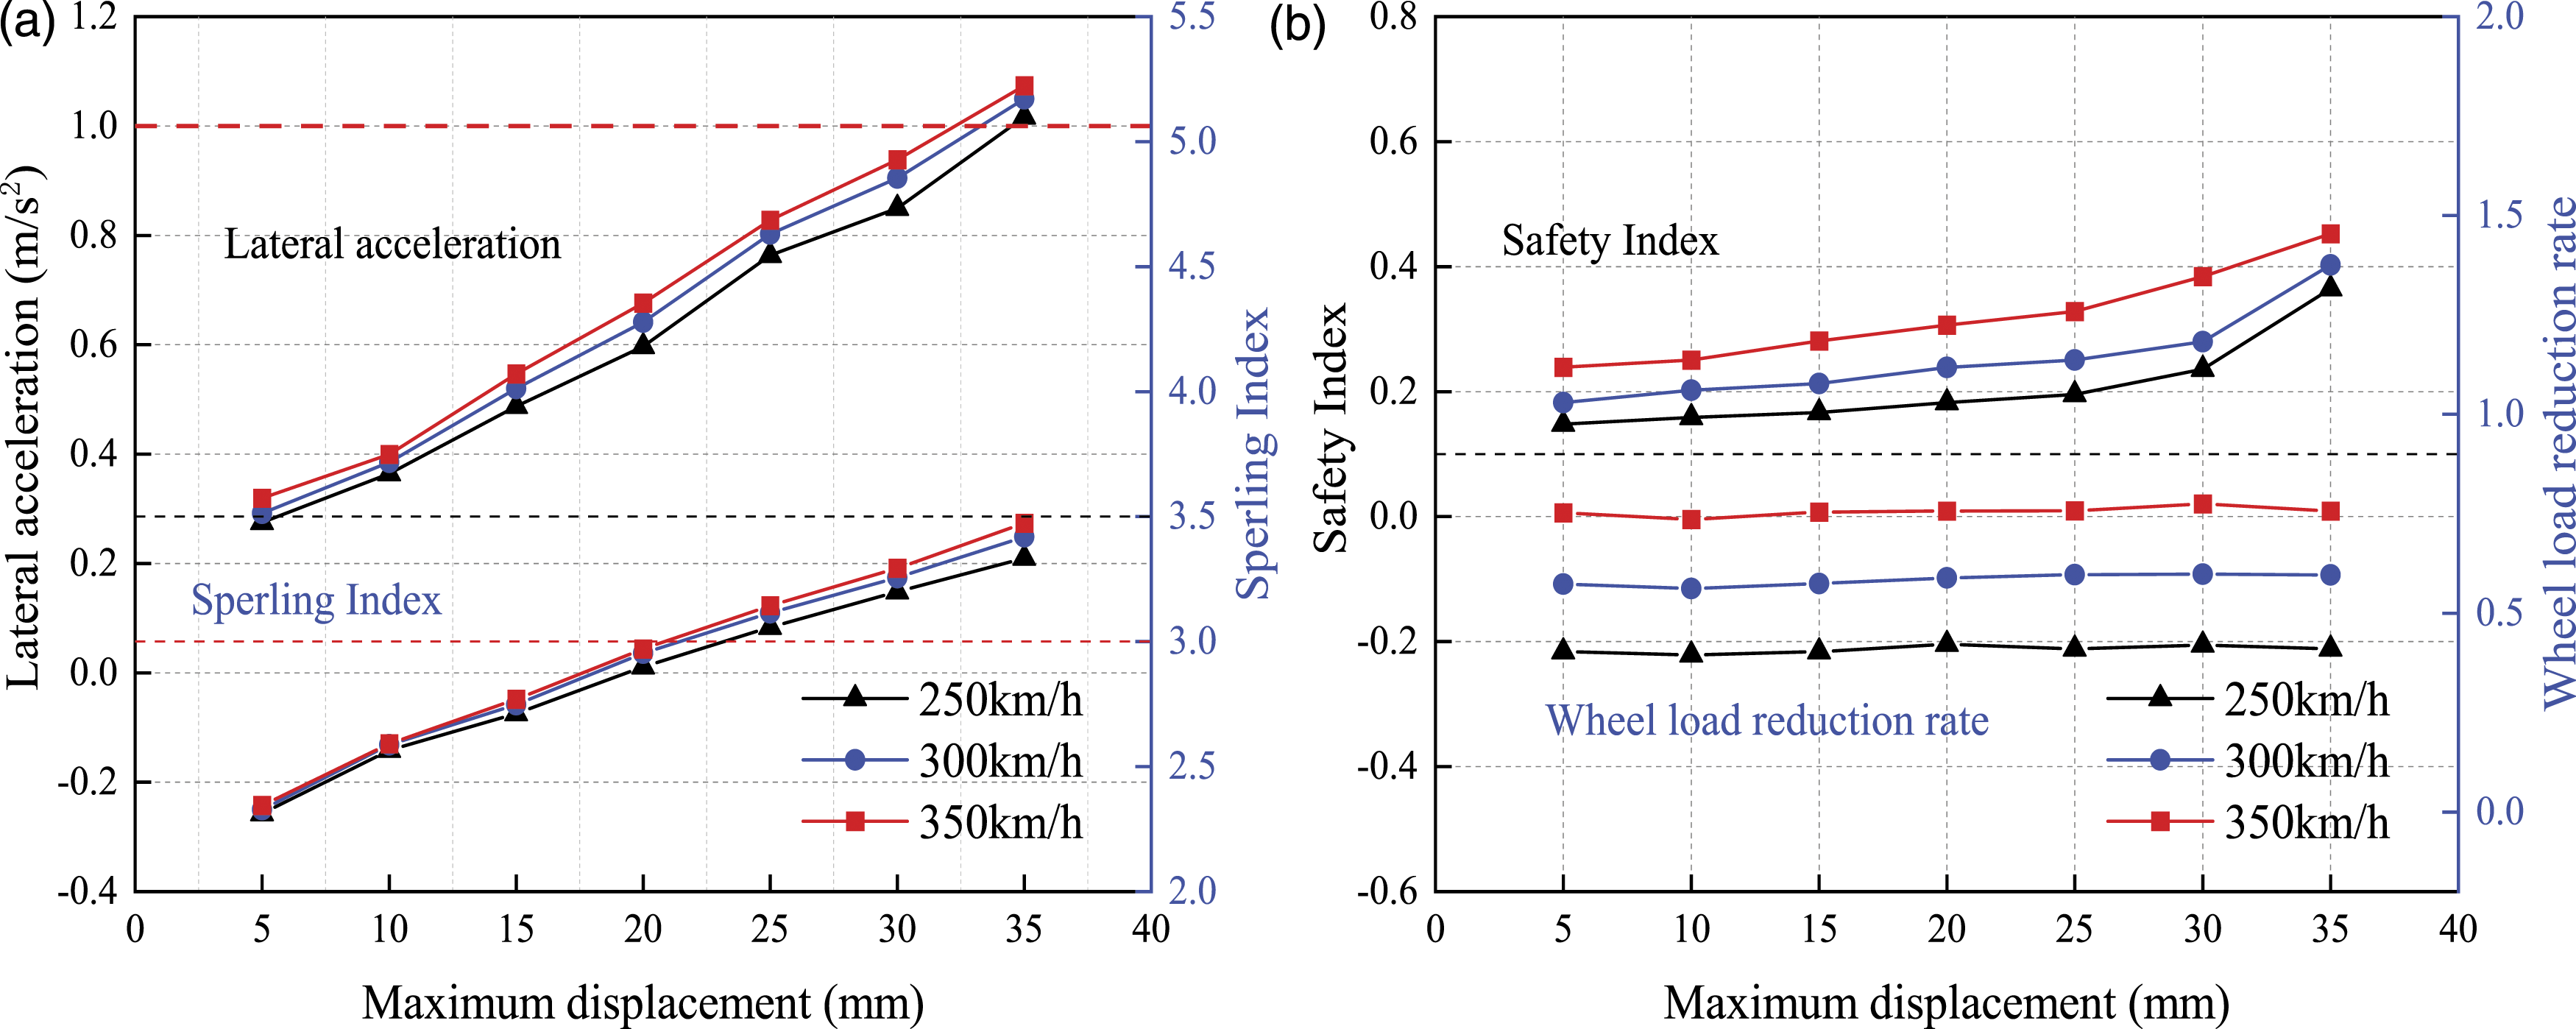
4.5. Transverse parallel misalignment
Under the case of beam transverse parallel dislocation, when the beam of third span and fourth span occurs ±5 mm, ±15 mm, ±25 mm, and ±35 mm transverse dislocation, respectively, the calculation results of high-speed train performance index at different speeds are shown in Figure 14. The transverse running performance indicators of high-speed trains increase as the transverse parallel misalignment dislocation of the beam increases. The maximum increase of the transverse acceleration of the car body is 423.9%, the maximum increase of the derailment coefficient is 373.8%, and the maximum increase of the transverse Sperling index is 65.9%. The derailment coefficient, the transverse acceleration of the car body, and the Sperling index exceed the corresponding limits of the specification. The most severe deterioration in the performance of high-speed trains occurs under transverse parallel misalignment of the beam. With derailment coefficient as control index, the transverse dislocation thresholds of high-speed trains based on probability guarantee rate at 300 km/h and 350 km/h are 33.5 mm and 22.6 mm, respectively. With transverse acceleration as the control index, the transverse dislocation thresholds of high-speed trains based on probability guarantee rate at 250 km/h, 300 km/h, and 350 km/h are 22.1 mm, 20.9 mm, and 20.0 mm, respectively. With the transverse Sperling index as control index, the transverse dislocation thresholds of high-speed trains based on probability guarantee rate at 250 km/h, 300 km/h, and 350 km/h are 12.5 mm, 11.6 mm, and 11.1 mm, respectively. Influence of transverse parallel misalignment of girders on running performance of high-speed railway: (a) lateral acceleration and Sperling index and (b) derailment coefficient and wheel load reduction rate.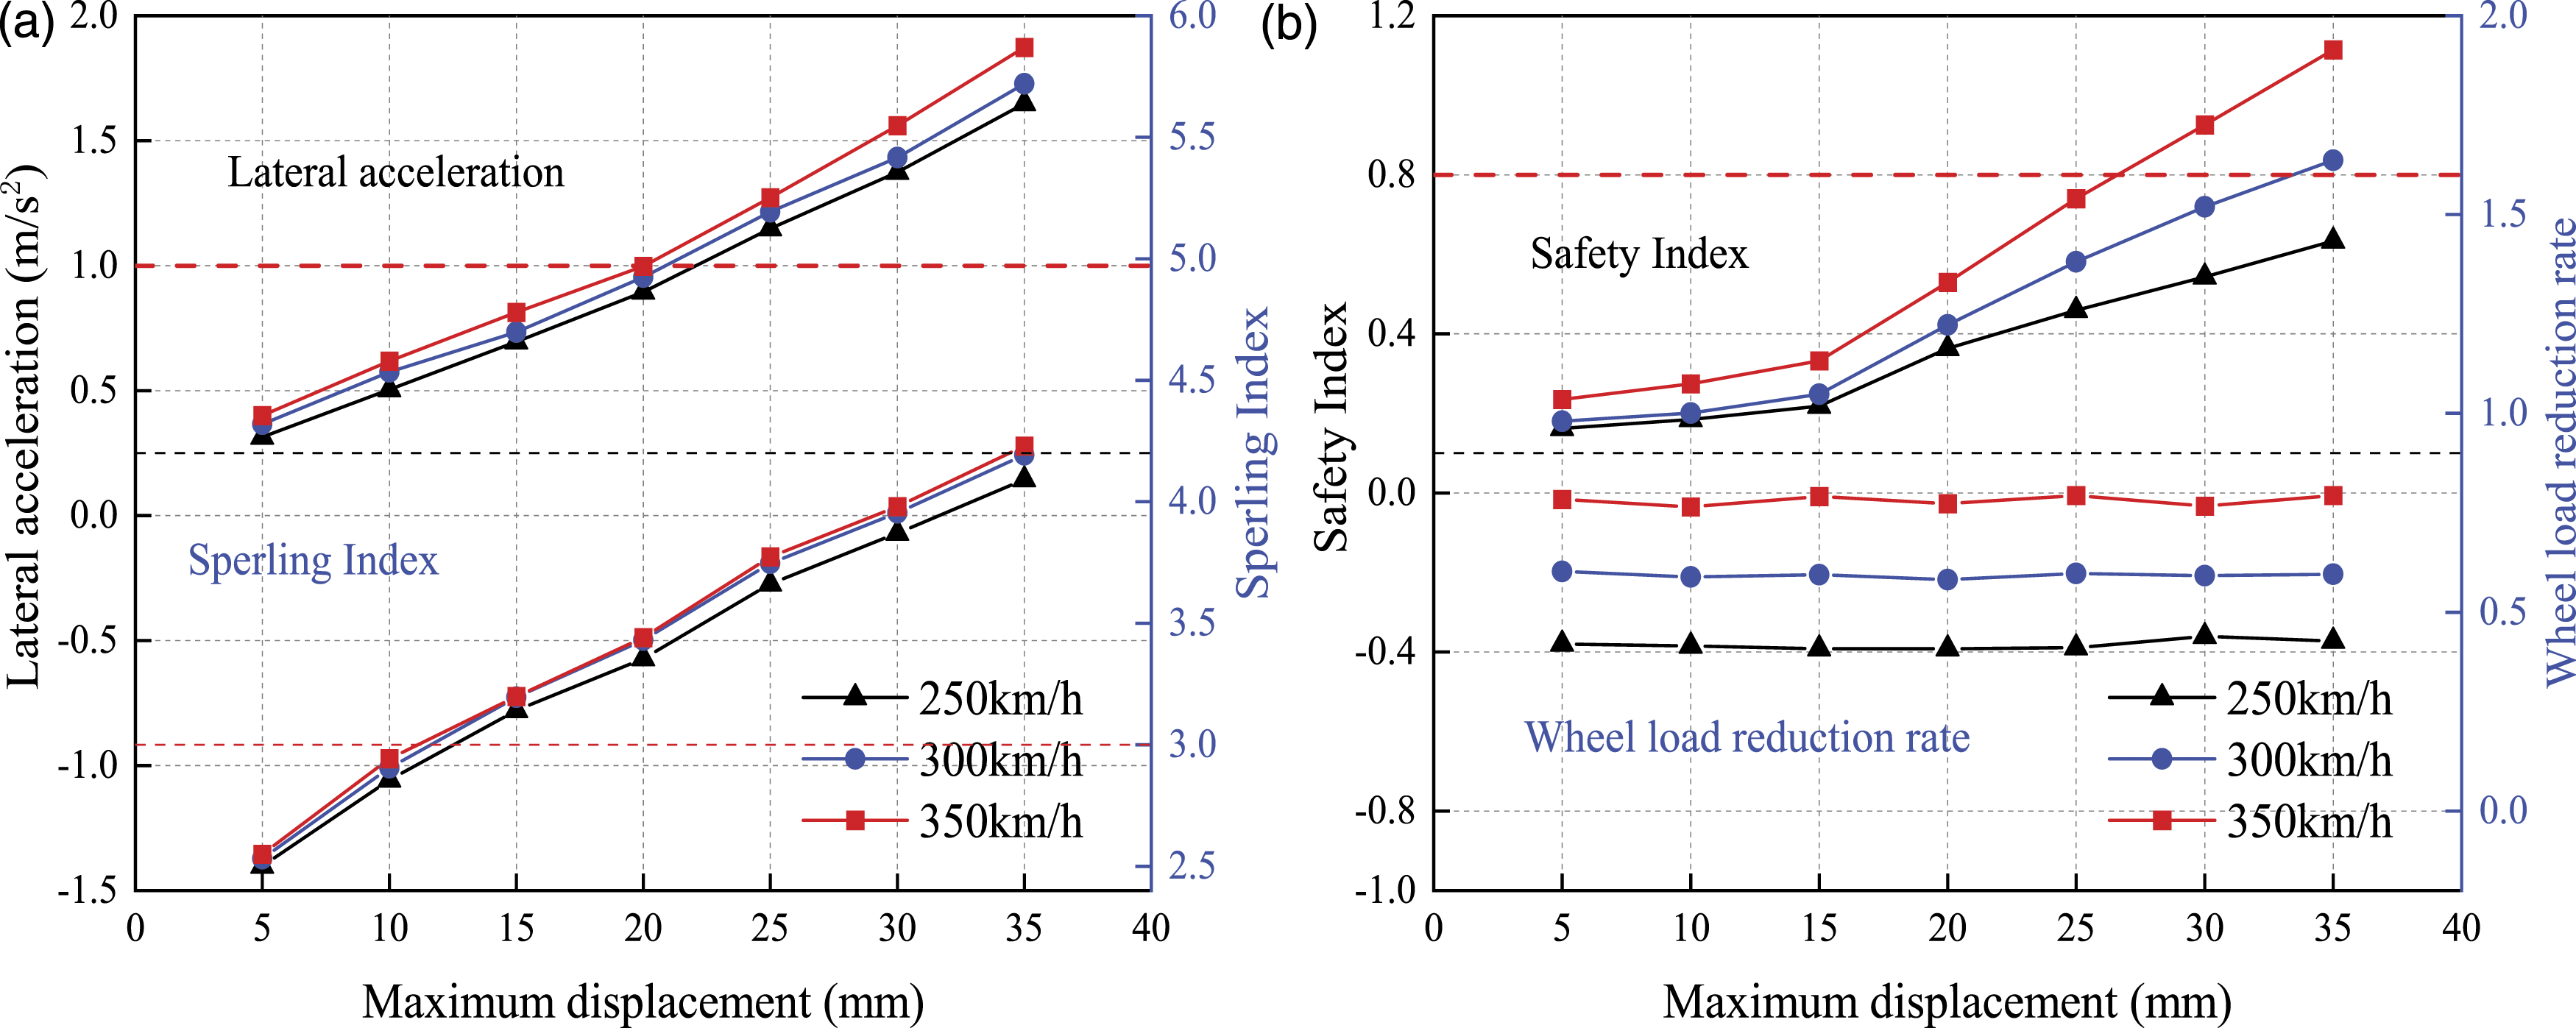
4.6. Thresholds summary of five typical transverse additional dislocation modes
Summary of beam dislocation thresholds under different speeds.

5. Conclusions
In this study, a coupled train–track–bridge model was developed and validated, and the impact of the dislocation amplitude on the dynamic performance of high-speed trains under five typical extra dislocation modes of bridges was investigated through the overrun probability analysis. Based on the statements above, the following main conclusions can be drawn: (1) The transverse dynamic performance of high-speed trains is significantly affected by the increase in the dislocation amplitude under the five typical bridge transverse dislocation modes, whereas the effect on the vertical dynamic performance is minimal. (2) Although the performance indicators of high-speed trains did not exceed the limits under the conditions of the transverse unilateral cornering of the girders, it is recommended to reduce the speed to ensure the running stability. (3) Under the condition of transverse symmetrical cornering of the girders, the threshold value in the girders at a speed of 350 km/h based on the probability guarantee rate was computed to be 0.946‰ rad when using the transverse Sperling index as the control index. (4) Under the condition of transverse parallel cornering and transverse misalignment of the girders, the threshold values of transverse parallel cornering dislocation of the girders based on the probability guarantee rate for high-speed trains at 250 km/h, 300 km/h, and 350 km/h were 0.644‰ rad, 0.639‰ rad, and 0.634‰ rad, respectively. Moreover, the threshold values of transverse misalignment dislocation were 23.2 mm, 21.4 mm, and 20.9 mm, respectively, when using the transverse Sperling index as the control index. (5) Under the condition of transverse parallel dislocation of the girders, the running performance of high-speed trains was the most seriously deteriorated, and under certain dislocation amplitude, the safety and stability indexes of train operation had exceeded the limit. Using the transverse Sperling index as the control index, the threshold values of transverse parallel misalignment dislocations of girders based on probabilistic guarantee rates at 250 km/h, 300 km/h, and 350 km/h are 12.5 mm, 11.6 mm, and 11.1 mm, respectively.
Footnotes
Declaration of conflicting interests
The author(s) declared no potential conflicts of interest with respect to the research, authorship, and/or publication of this article.
Funding
The author(s) disclosed receipt of the following financial support for the research, authorship, and/or publication of this article: The research described in this paper was financially supported by the National Natural Science Foundations of China (U1934207, 52078487, 52178180), Innovative Province construction special Project of Hunan (2019RS3009), Transportation Science and Technology Project of Hunan (202011), Innovation-driven Project of Central South University (502501006), and State Key Laboratory of Performance Monitoring and Protecting of Rail Transit Infrastructure (HJGZ20211003, HJGZ20212009).
Ethical approval
This article does not contain any studies with human participants performed by any of the authors.