
Abstract
In rotating machinery, especially in rolling bearing diagnostics, early and effective fault diagnosis is essential to ensure the reliability of rolling bearings. The commonly used vibration analysis gathers large amounts of information about the dynamics and the general condition of the bearings by recording vibrations generated by a rolling bearing. Within the vibration analysis, the location of the damage can be determined by using envelope demodulation. This is done by identifying the damage frequency within a damaged bearing. Peak-, Root-Mean-Square (RMS)-, and Hilbert-envelopes are the conventional demodulation methods in this field, but each of these methods is different and thus more or less suitable for particular applications. This paper presents a comparative study of these three methods. The selected envelopes are compared and evaluated through experiments, the evaluation of measurement data and the establishment of quality characteristics regarding efficiency and quality. In the process, a decision tool is created to help in the selection of a suitable envelope demodulation technique. A formula for calculating an optimal window size of the Peak-envelope is established, as well as a recommendation for selecting a window size of the RMS-envelope.
1. Introduction
The process of envelope analysis was developed more than 30 years ago (Darlow et al. 1974). Nowadays, it is used and further developed as an important process in the area of fault diagnosis in rolling bearings. Thus, in recent years, research has been conducted on the development of various methods for bearing detection and diagnosis.
In rolling bearings, defects in the bearing components cause a series of shock pulses, for example, due to the rolling over of defects in the running surfaces of the bearings. This generates a short transient vibration in the bearing with each individual impulse. The frequencies of these vibrations correspond to the natural frequencies of the system. The shocks are repeated at the characteristic frequencies of the bearing when the rolling elements encounter a local defect on the inner or outer ring, or a defect on a rolling element encounters the inner or outer ring. The impact itself modulates the signal with the corresponding bearing frequency. This periodic modulation increases the envelope RMS value. Thus, by determining the frequency of damage, it is possible to determine the location of the damage. (Bujoreanu et al., 2013)
According to Isermann (2006), linear overlapping of additional machine vibrations results in several sideband frequencies. This in turn results in more complex frequency spectra and makes it difficult to isolate and diagnose the bearing faults, since the damaging pulse frequencies only appear as sidebands in the frequency spectrum.
In Bauer et al. (2019), a method is established for detecting the influence of these external vibration excitations. By creating a flow chart, this method distinguishes externally generated vibrations from conventional rolling bearing vibrations and detects them with the help of intelligent evaluation algorithms.
The use of amplitude demodulations results in several advantages. The analysis of envelope signals provides more diagnostic information than the analysis of raw data. In the envelope analysis, a one-sided spectrum of only positive frequencies is inversely transformed into the time domain. Thus, the portion of the spectrum to be demodulated is effectively extracted by a filter and separated from nearby elements. (Randall and Antoni 2011)
Several filter methods can be used for envelope demodulation. It is difficult to determine which is the most efficient and qualitatively superior solution. In the following research it will be investigated how the transformed amplitudes of the different envelope demodulation methods differ with respect to quality and efficiency. The aim of this research is to analyze the different filtering methods in the context of envelope formation. Various aspects are selected, which can be considered and evaluated when choosing the right envelope demodulation method, to simplify the selection of a suitable envelope formation method. Three envelope methods are examined and compared—the RMS-, Peak-, and Hilbert-envelopes. An envelope detection based on the Hilbert transform is most used in common practice.
In addition to the selection of the demodulation method, a suitable window size for the Peak- and RMS-envelope has to be chosen. Therefore, it is investigated how the envelope formation behaves with the choice of different window sizes and how the optimal window size can be selected methodically and mathematically.
2. State of the art
Rotating machinery relies on functioning bearings for a reliable operation. Safety and operational readiness of the machines will be improved if monitoring techniques are developed and used that can detect when a damaged or defective bearing needs to be replaced. According to Bechhoefer and Praneet. (2011), envelope analysis can detect bearing failures at an early stage, before failure or maintenance is required, and warn the operator.
The vibration signal of a periodic shock pulse stimulation is an amplitude modulated signal. The structure resonances stimulated are considered as carrier frequencies and the damage frequencies as modulation signal. When analyzing envelopes, the goal is to replace the vibration signals of a shock, caused by bearing defects, with a single pulse over the entire shock duration. The vibration signals are amplitude demodulated to extract the damage frequencies from the existing noise. Envelope demodulation of the signal is necessary to separate the modulation signal from the carrier frequency. The shock pulses and their fading can then be perceived in the representation of the envelope signal. The envelope received from the demodulation process is analyzed in the frequency domain. Its frequency components can be identified using a frequency spectrum. Even in the case of disturbed signals or very weak shock pulses, the repetition frequency of the shock pulses can be detected in the frequency spectrum of the envelope. (Bujoreanu et al., 2013; Geropp 1995)
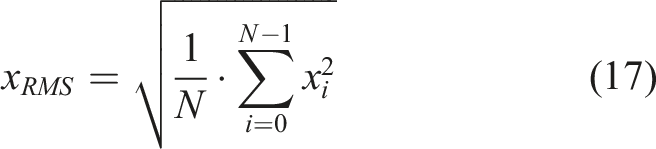
An RMS value is defined as the square root of the mean square value of a signal. The RMS of the measured signal is commonly used to measure vibration intensity and to indicate an upcoming defect. However, the RMS level only reflects the amplitude of the original signal and does not give detailed information about the shape of the defect’s vibration. (Xu et al., 2016)
The RMS level is a very simple method for analyzing time signals. It is very popular, but in the case of detecting localized bearing defects according to Azeez and Alex (2014), it offers limited success and can sometimes make it difficult to detect early damage.
The Peak-envelope demodulates the impulse signal by first performing a fully digital peak detection as part of the envelope generation. Here, a peak is defined as an event in the time signal which fulfills the criterion that there is a local maximum with an amplitude above a predefined trigger value (Goreczka and Strackeljan 2009).
According to Haoning et al. (2019), the demodulation effect of the Peak-envelope method is weak despite preserving the highest peaks in the original waveform if there are no obvious bumps in the signal. Then, the envelope signal loses the damping and harmonic characteristics of the original signal.
The Hilbert envelope allows complex demodulation analysis, adapted to the signals. It is a commonly used tool for demodulation and is based on a mathematical operation. The envelope is the magnitude of the transformation. The vibration always has a real and an imaginary part. (Jaksch and Bazant 2005)
According to Feldman (2011), it is a popular and effective tool for envelope analysis because it allows complex demodulation analysis adapted to signals in the form of a single but modulated sine wave. In studies by Betea et al. (2013), the Hilbert envelope performed best in detecting the signal compared to other filters because it follows the peaks of the input signal.
Small defects of rolling bearings can be detected in the frequency spectrum only as side bands but become more obvious in the frequency spectrum of the envelope signal. In the envelope of the vibration signal, it is possible to simultaneously follow the evolution of the defects, according to the obvious number of harmonic components compared to the random components with uniform amplitudes (Haoning et al. 2019).
For the window selection of the envelope analysis, Bechhoefer and Praneet. (2011) investigates the selection of the correct window on an experimental basis to detect the bearing damage. A measure of efficiency was created to evaluate different window sizes, but this varies from bearing to bearing. Again, it was hypothesized that non-detections of bearing failure in operation are often due to poor window selections. However, no recommendations are made on window size selection for RMS- and Peak-envelopes.
3. Experiments and experimental setup
The measurement data used for this research were acquired at the bearing test rig at Aalen University. Figure 1 shows a schematic overview of the test setup. The test rig generally consists of an asynchronous induction motor (left), a claw coupling (center), and an acceleration sensor (right). The motor shaft is supported on the drive side by two shaft bearings. The bearing is attached to the shaft and can be loaded at the front by an adapter with a radial tensile force Configuration of the experimental set-up.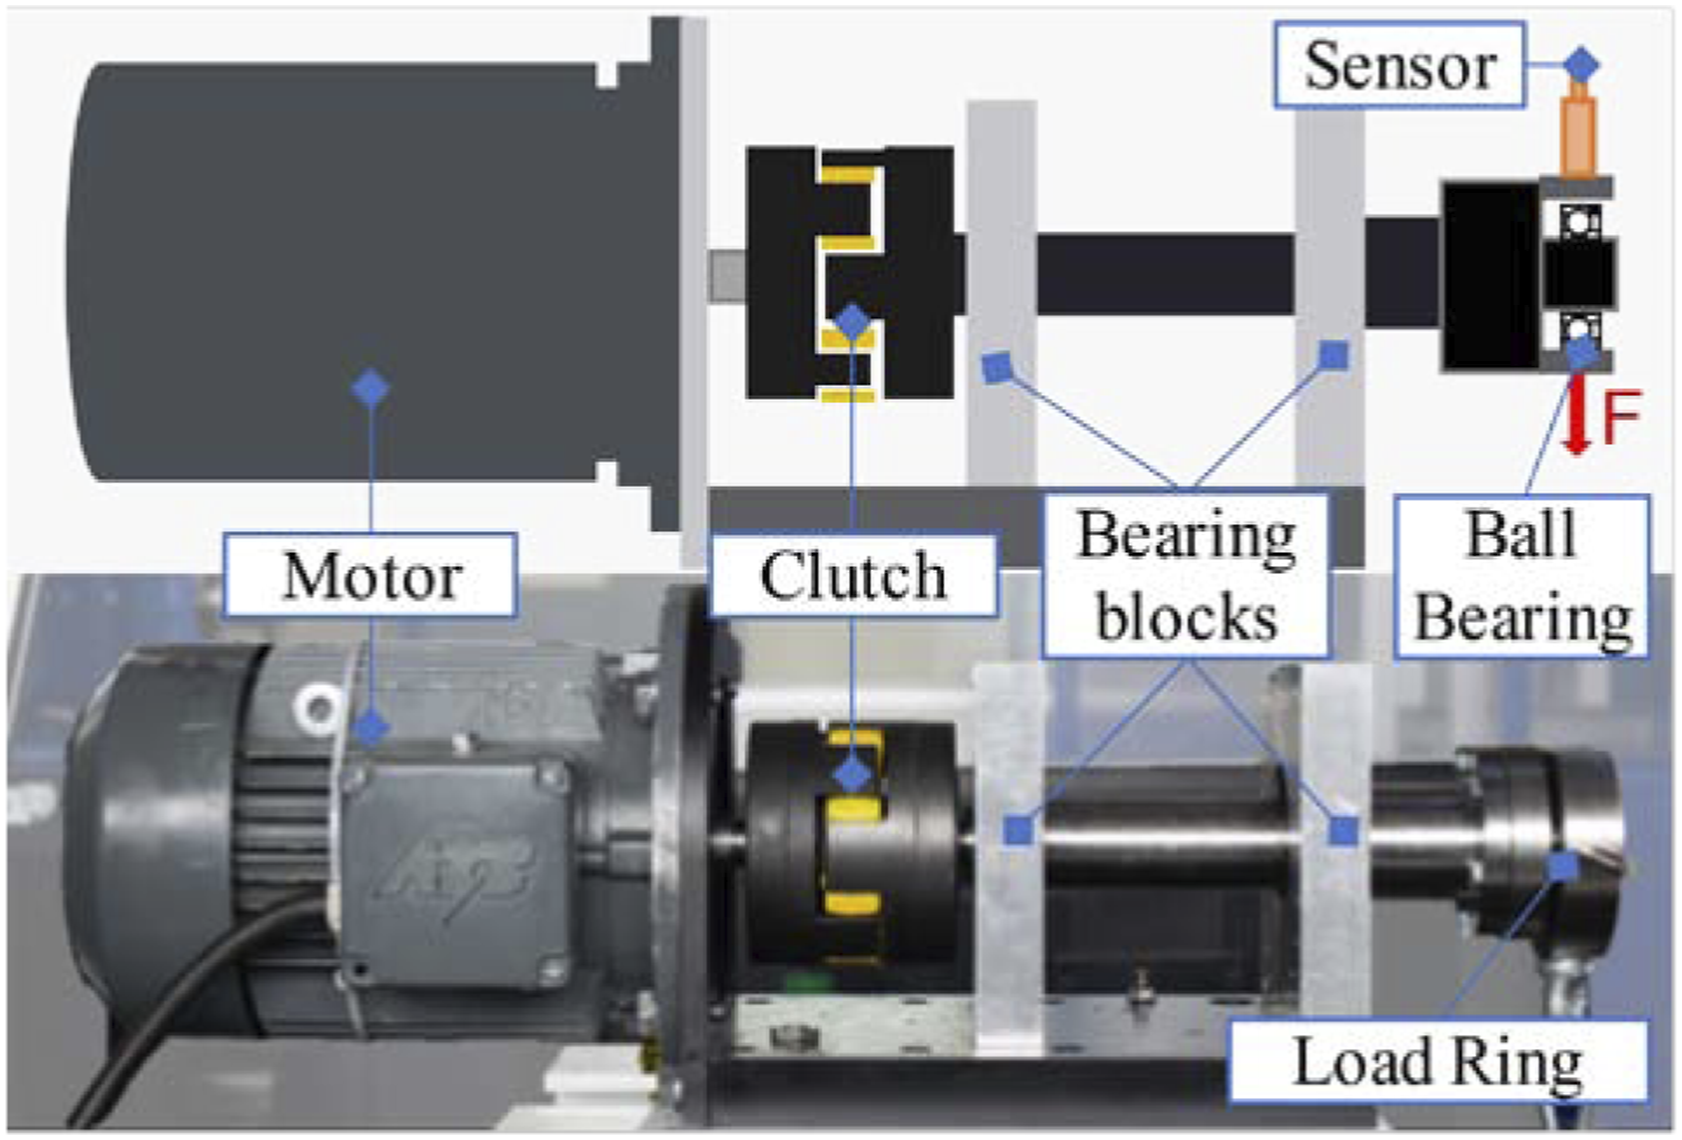
During assembly, it is relevant that the damage to the bearing is in the load zone when the tests are carried out. This allows the results to be reproducible during the following validation. To collect vibration data from the bearing, a piezoelectric accelerometer with a bandwidth of 0.5 Hz up to 10,000 Hz is attached to the outer ring fixture at the level of the bearing. The data of non-damaged bearings are considered as the basic data. A significant outer ring defect is used as the specific bearing defect. To be able to validate the results, further bearing data sets and resulting measurements are used. Damage in three different bearings was simulated by using different techniques. To simulate low intensity damage, a laser was used to cause damage in the raceway on the outer ring of the bearing. For the simulation of large damage intensities, a hole was mechanically cut across the outer ring using a milling cutter.
The choice of sensor position can improve the signal quality for condition monitoring in areas with high amplitudes of the system mode, according to Bauer et al. (2021). Here, sensor positioning close to the emission source is recommended.
The measurements are done with a sampling frequency of 51,200 Hz over a measuring time of 11 s. As an example, an outer ring defect of ball bearing 6006 is shown in Figure 2. The defect is simulated on the outer ring of the ball bearing with a laser. For the ball bearing 6006 with outer ring damage and a shaft rotation speed of 1000 rpm, the damage frequency is 69 Hz. Outer ring damage on the ball bearing by a laser.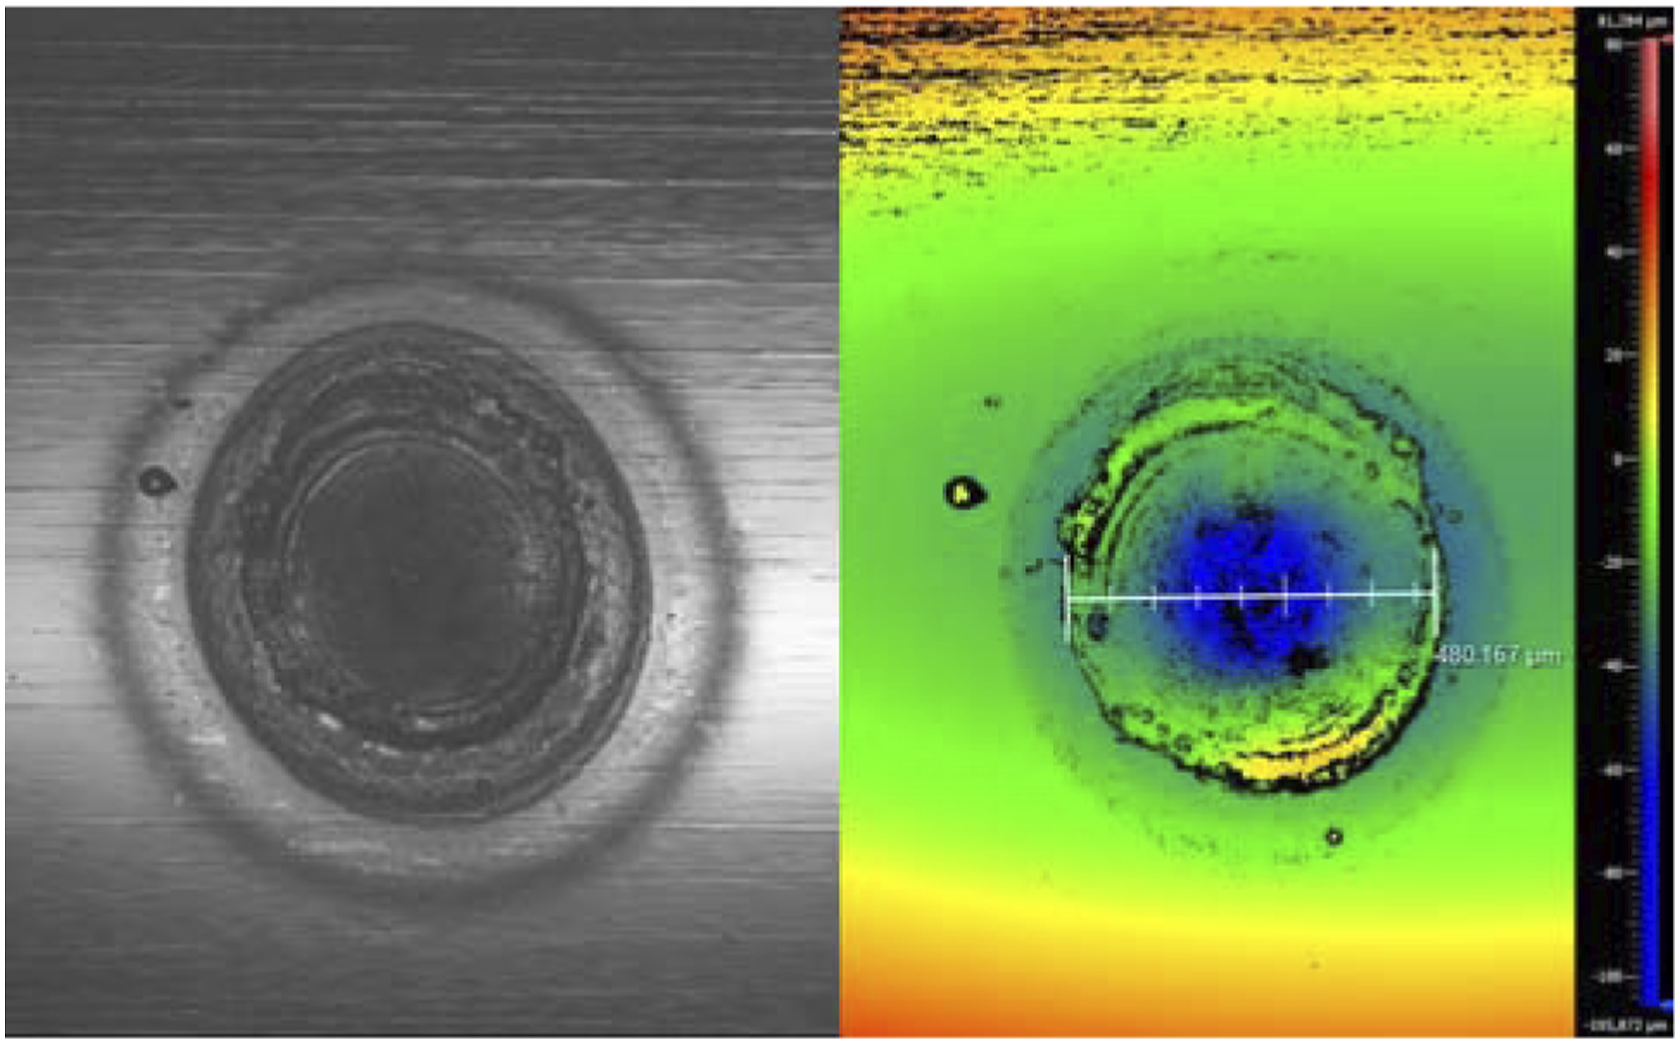
4. Initial studies
4.1 Definition of envelope demodulation methods
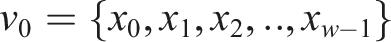
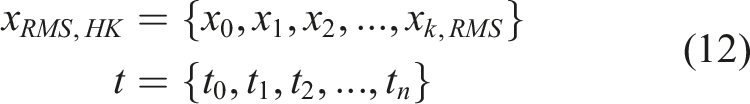
A discrete data set is available from a vibration measurement. The data set is described by

With the sampling rate of the vibration signal
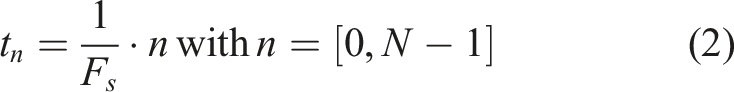
The time

The measured vibration signal can be plotted over the time. These data sets act as initial situation for the envelope demodulation.
4.1.1. Peak-envelope
With the Peak-envelope, the peak value of the signal is observed. The peak value is defined by a window size


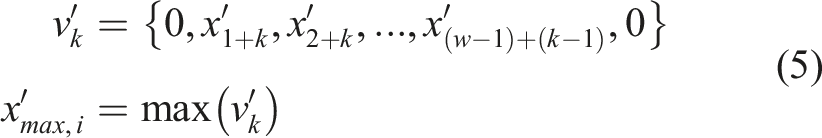
To determine whether the maximum value in the copied window is a peak value

If this rule applies, the maximum value is a peak value. If the rule does not apply, the three compared values are monotonically decreasing or increasing values or a minimum. In this case, the maximum value is set to zero in the copied window and the maximum finding is repeated. The algorithm is repeated until there is a peak value or all values in the copied window are less than or equal to zero. If the last case occurs, there is no peak value in the original window.
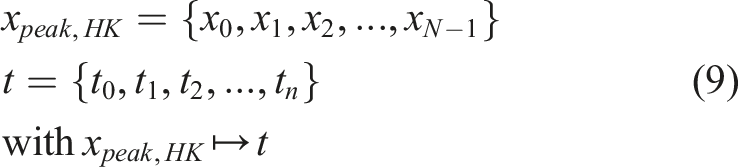
If the algorithm for peak value determination was carried out completely on the measured data set, a peak data set with the peak values and the associated peak times
In the work of Turley (2018) the procedure for the computation of a natural cubic spline interpolation with knot points, which have an unequal distance, is presented. There must be at least four interpolation points to set up a cubic spline interpolation with the “not-a-knot” boundary condition. The interpolated curve is evaluated at the time points of the measured signal in the respective interval. This creates the data set of the Peak-envelope Vibration signal of a defective rolling bearing with Peak-envelope.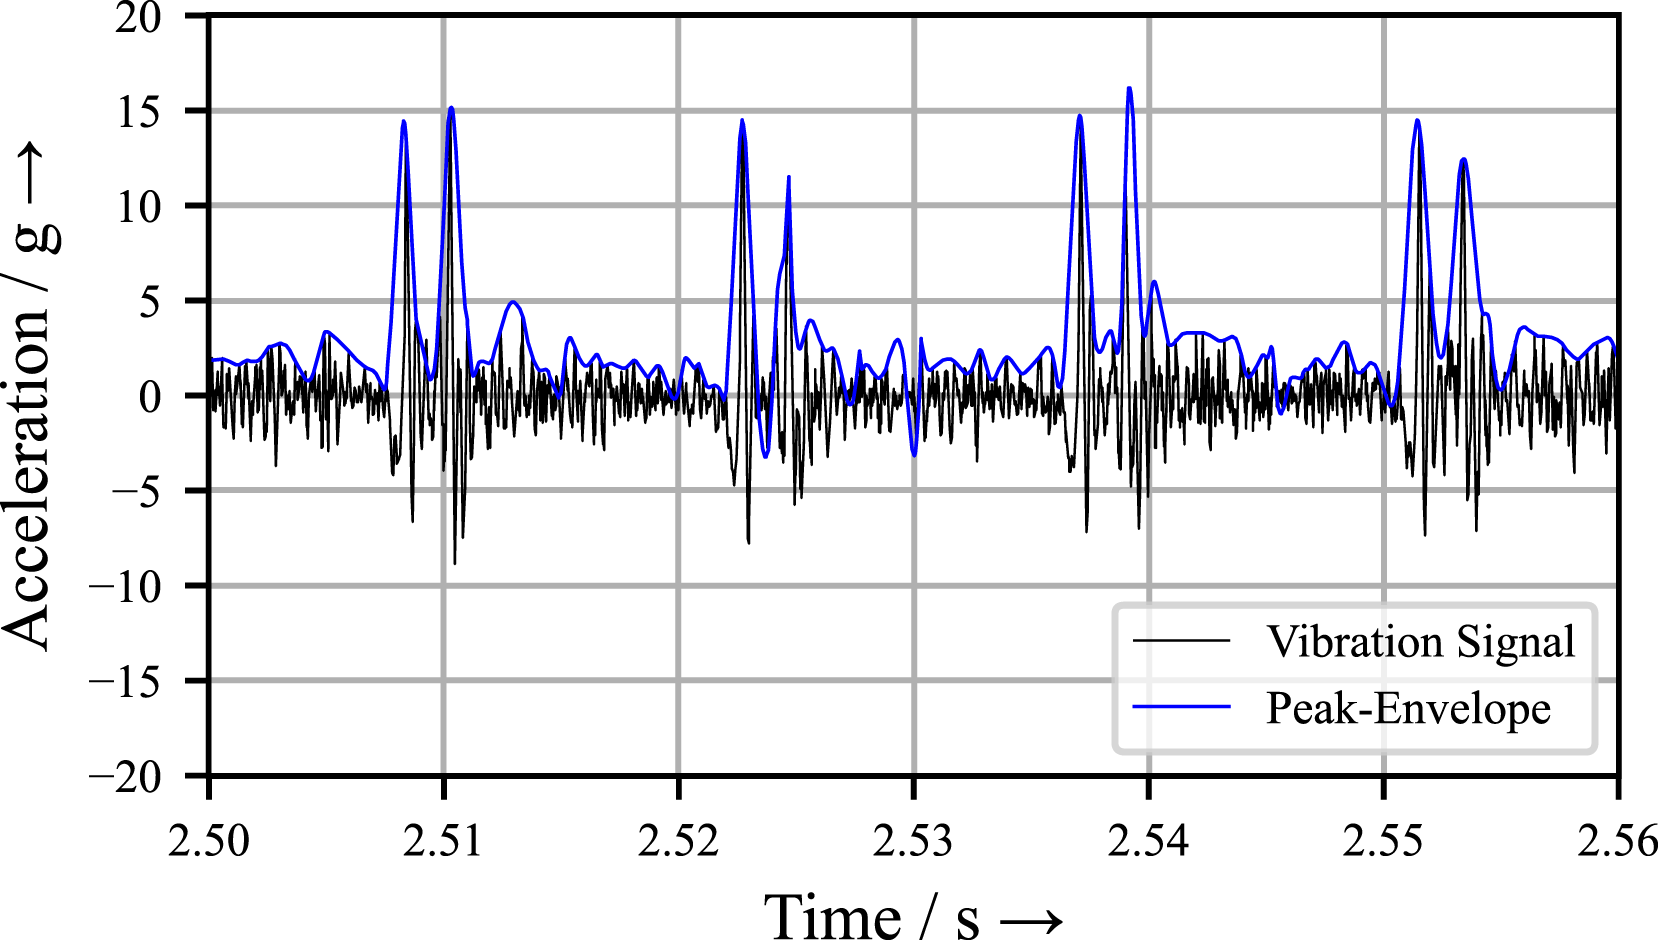
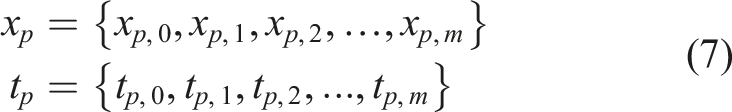
4.1.2. RMS-envelope
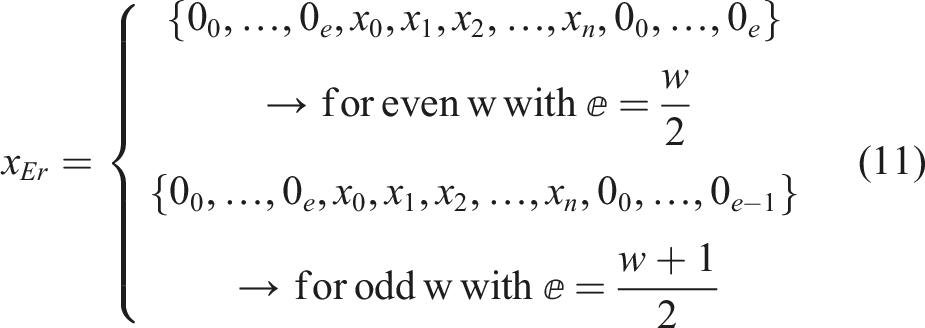
With the RMS-envelope the square average of a time range is observed. If the windowing of the output signal is constructed as described in equation (4), the window contains the measured values from
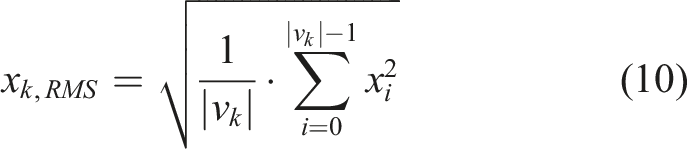
To be able to calculate the RMS in a logical way, the window must include at least two measured values. At most, the window can be as large as the size of the measured data set. For the correct assignment of the RMS value to the data set (3), a zero-value addition is performed on the measured vibration signal.
After the signal expansion, the windowing is carried out and the square mean value according to (10) is formed for each window. The window is shifted by one measured value as in (4) for
Each RMS value is assigned the data set (3) and the RMS-envelope Vibration signal of a defective rolling bearing with RMS-envelope.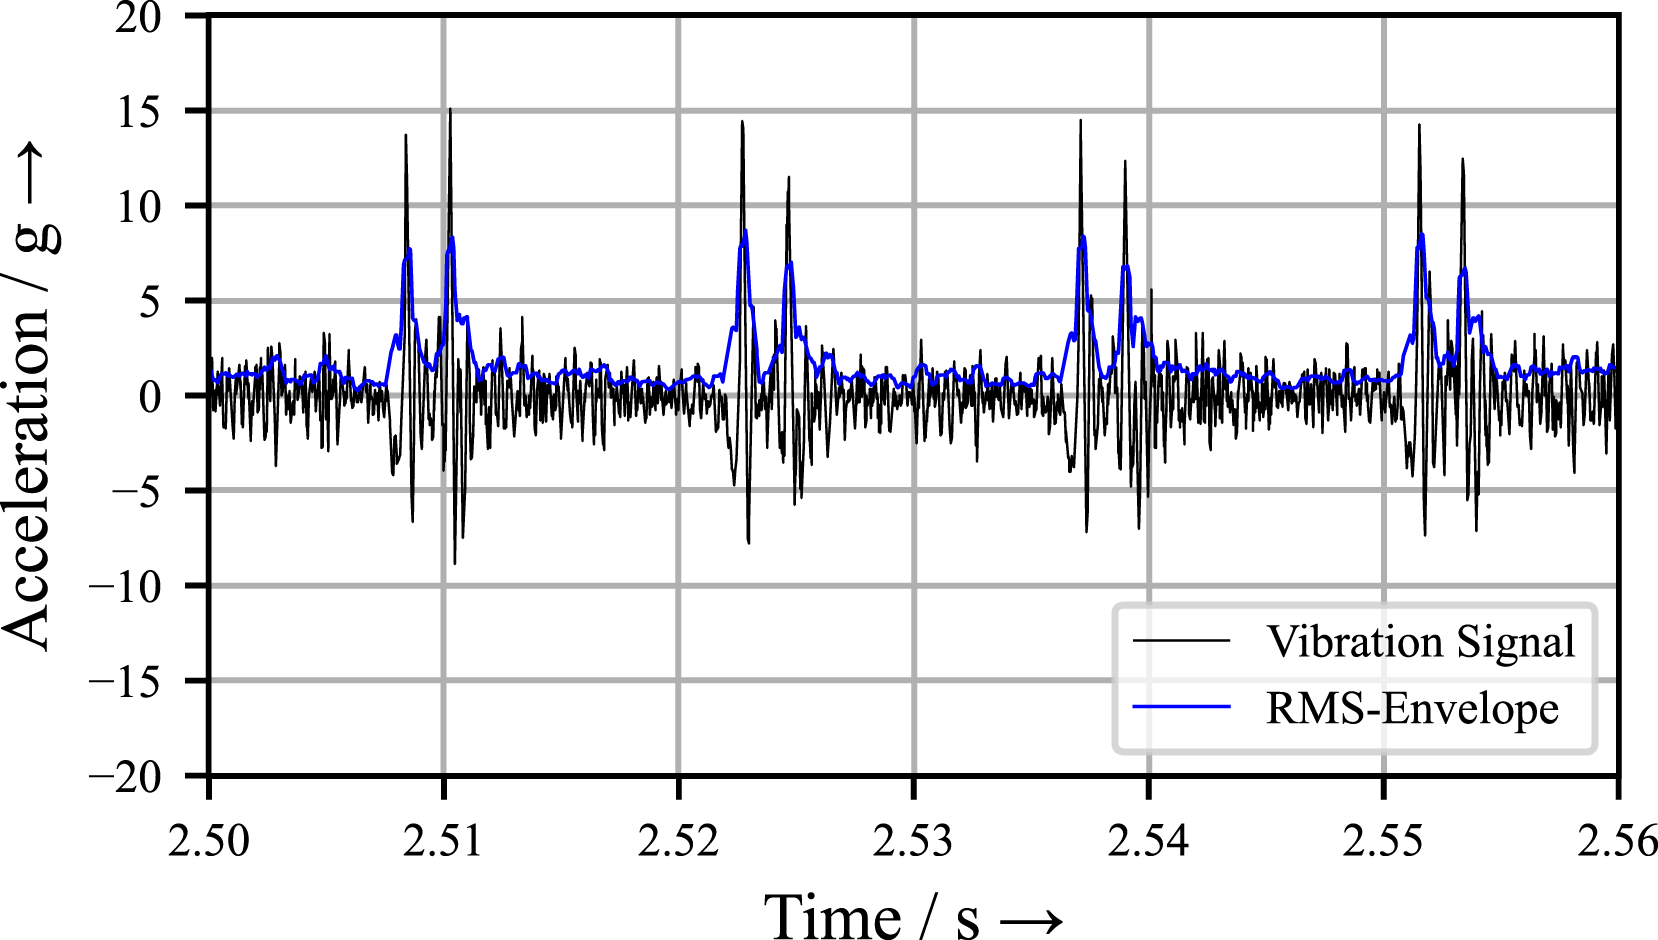

4.1.3. Hilbert-envelope
In comparison to the Peak- and RMS-envelope, there is no setting of the window size for the Hilbert envelope. The Hilbert-envelope is based on the Hilbert transformation. An analytical signal is calculated from the measured vibration data set and the Hilbert transform. The magnitude of the analytical signal forms the Hilbert-envelope (Figure 5). By using the Discrete Fourier transform, the Hilbert-envelope can be calculated most quickly (The SciPy community, 2021). Vibration signal of a defective rolling bearing with Hilbert-envelope.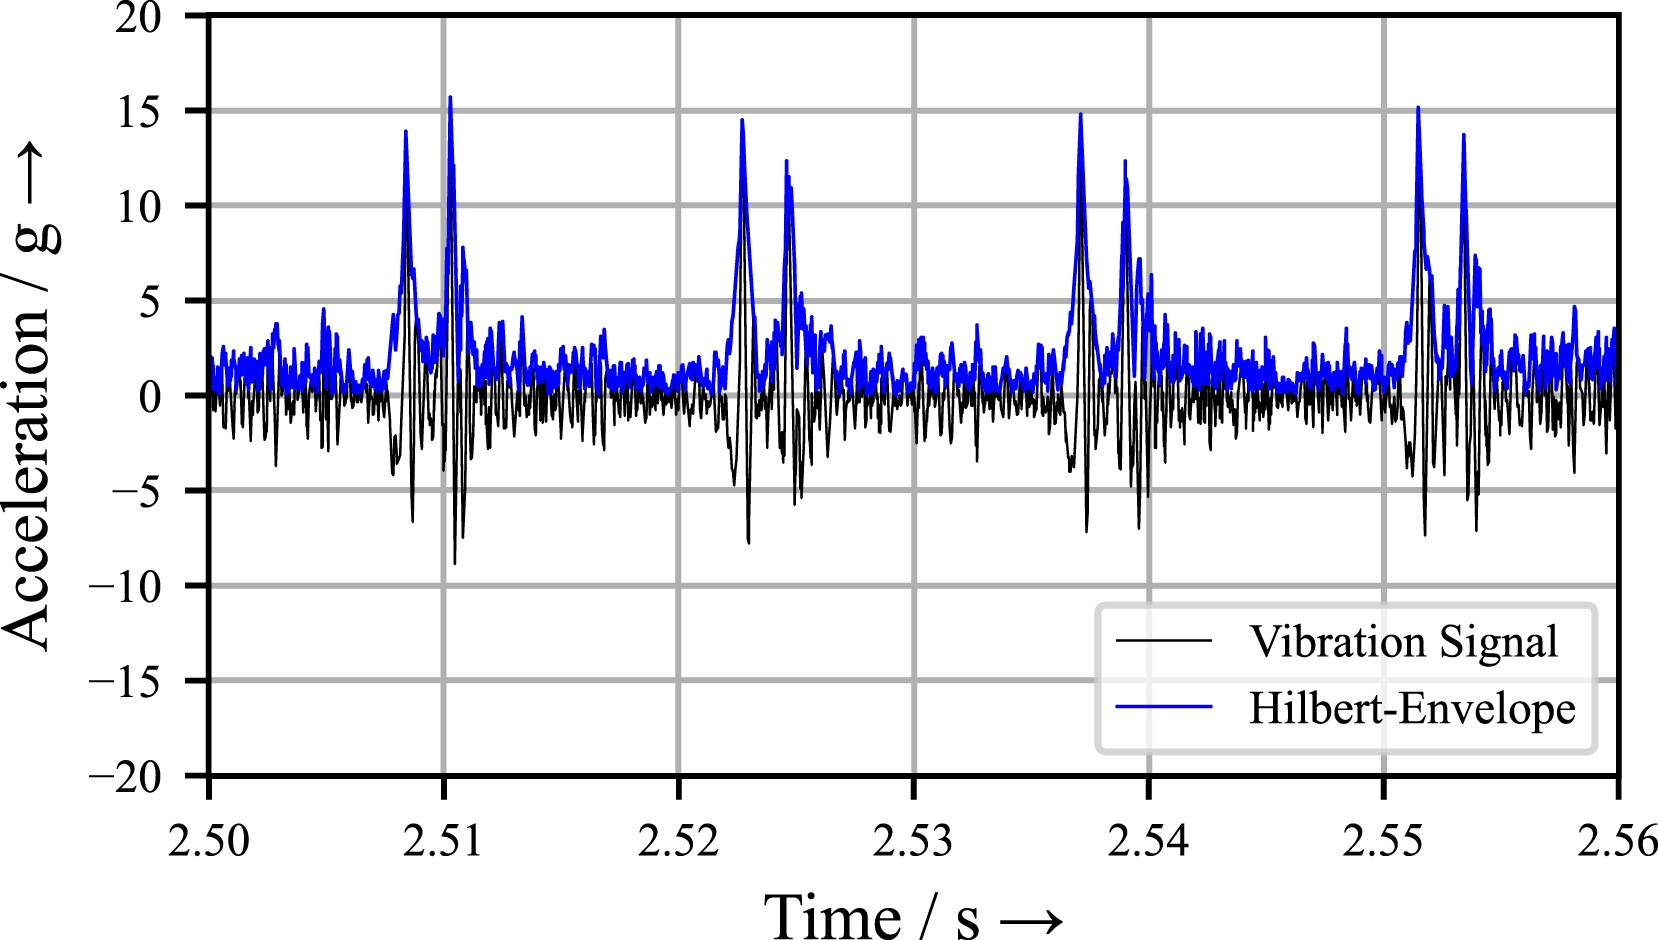
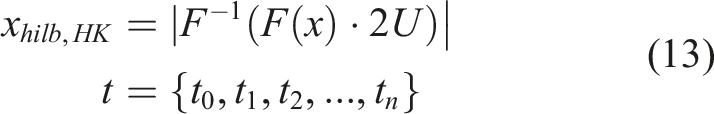
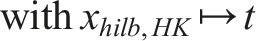
The Heaviside step function
4.2. Definition of the quality criteria and the efficiency
To enable a comparison between the individual envelope demodulation methods, the quality and efficiency of the demodulation methods must be defined in a measurable way. Here, the quality describes the accuracy of the amplitude reproduction, the efficiency, and the speed of the calculation.
4.2.1. Noise-damage amplitude ratio
With the noise-damage amplitude ratio
Signal components in the range of negative RMS
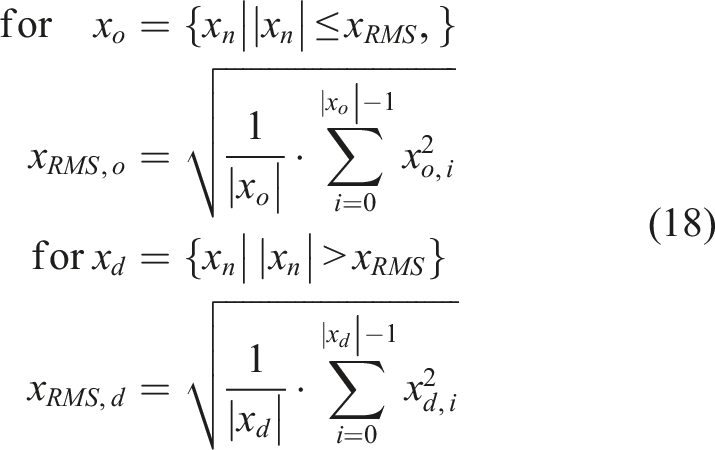
This calculates the RMS value of the noise amplitudes Calculation of the noise-damage amplitude ratio.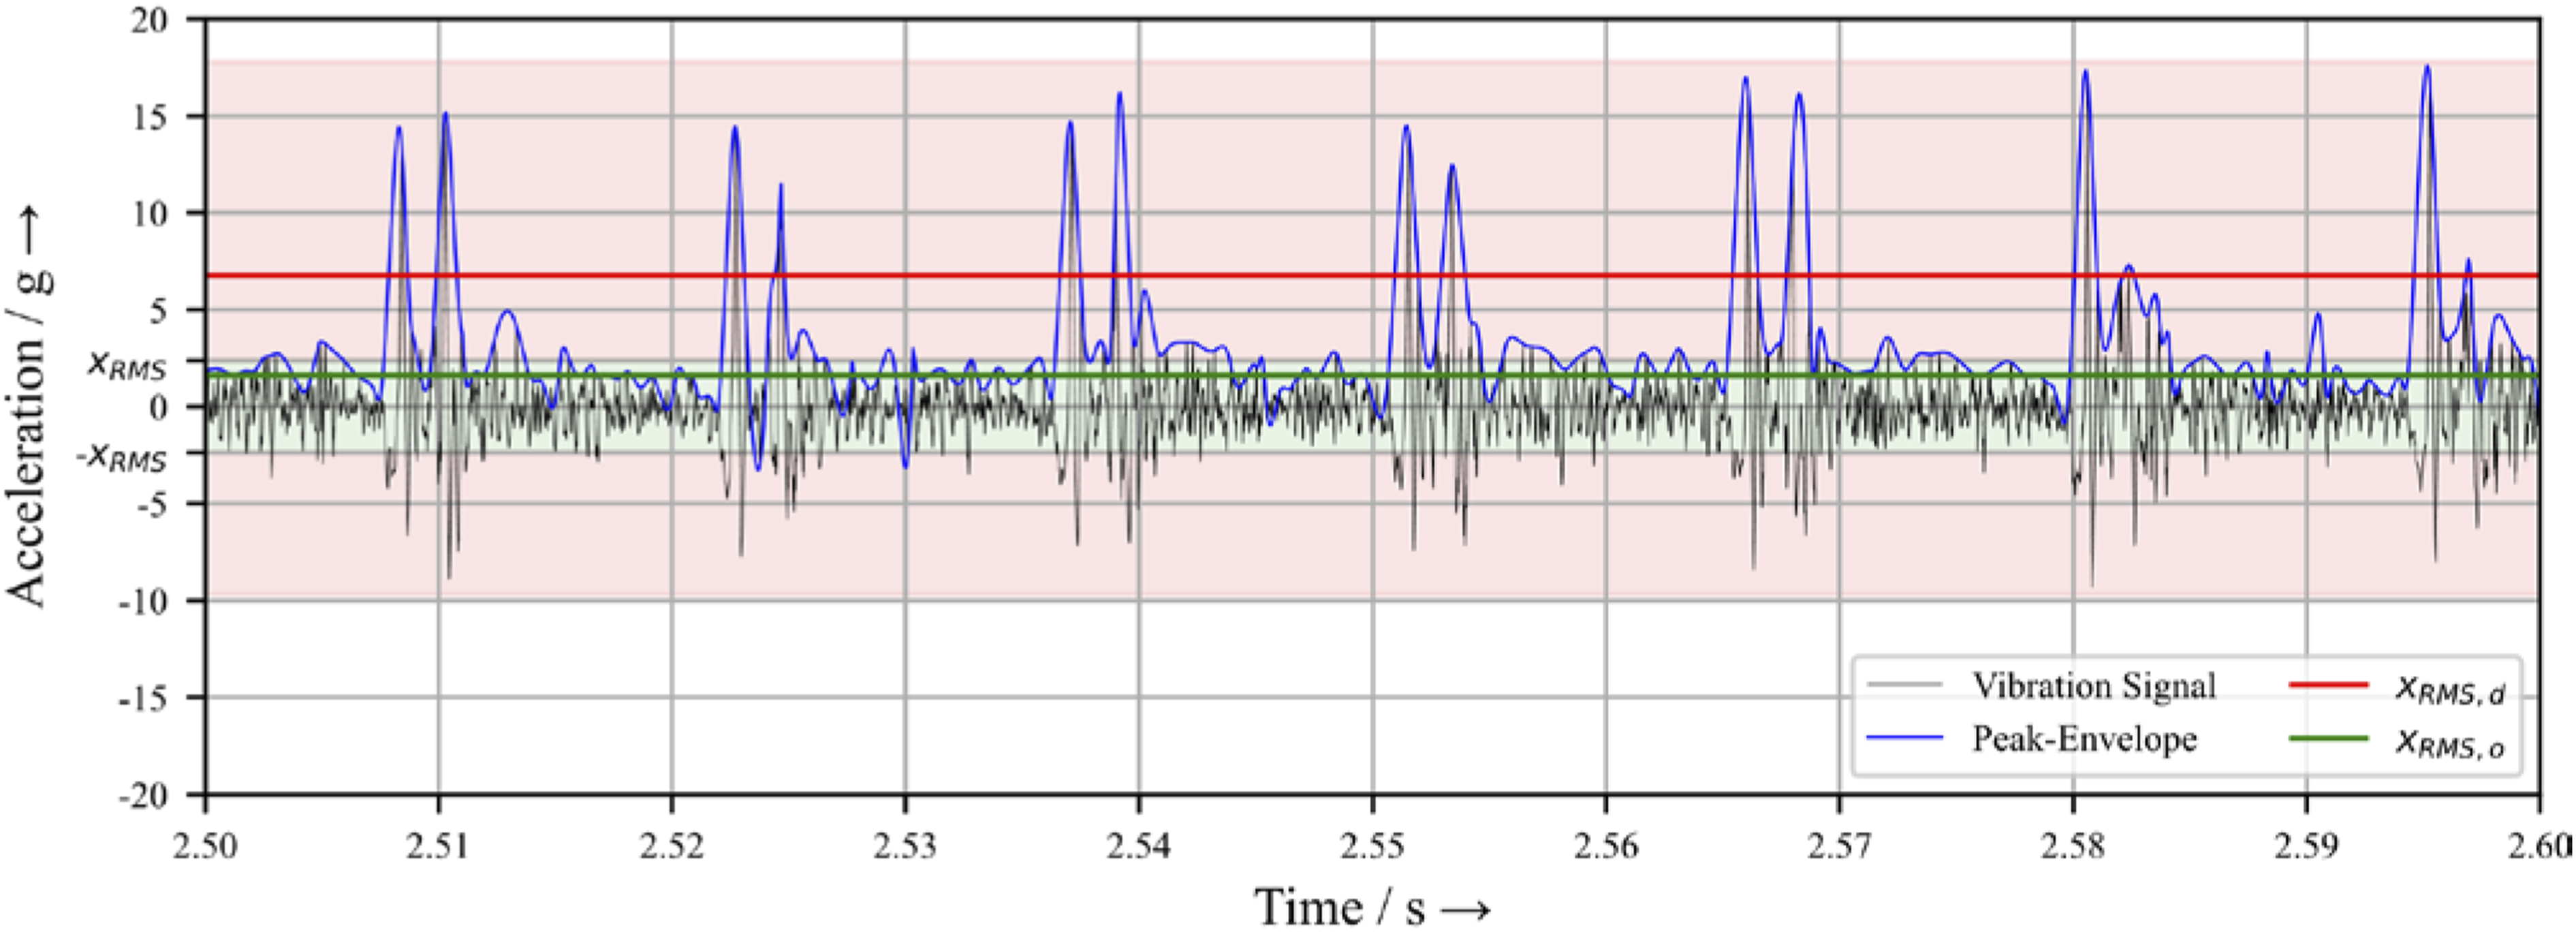
The noise-damage amplitude ratio can assume values between zero and one. If the damage component is clearly distinguished from the noise component in the envelope, the ratio assumes small values. If the differentiation of the damage component from the noise component in the envelope signal is not clear, the ratio assumes large values. If only the damage amplitudes relate to each other in the envelope of the vibration signal, the ratio approaches the value zero. This is not allowed, because then in the frequency spectrum of the envelope signal no more damage frequencies are recognizable.
4.2.2. Amplitude loss
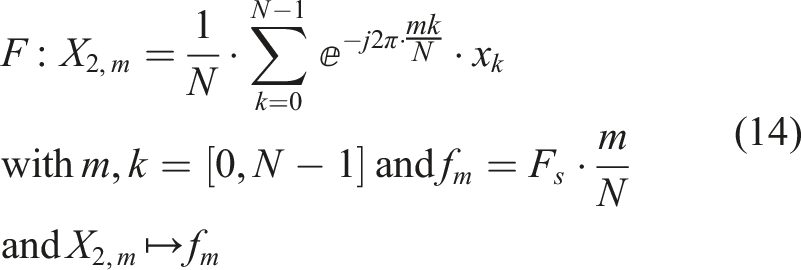
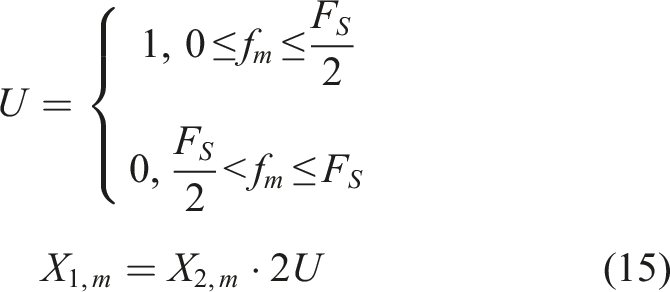
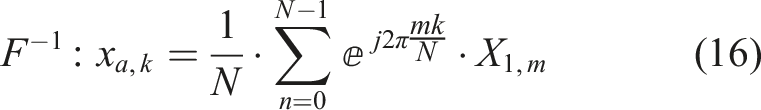
The main objective of demodulation is to separate the damage frequency from the interference and noise frequencies. To detect the damage in a bearing, the envelope
The Heaviside step function from (15) is used to calculate the one-sided frequency spectrum
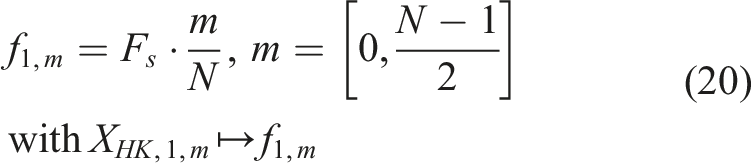
In the one-sided frequency spectrum of the envelope, the damage of the bearing at the damage frequency and its harmonic multiples become visible. The amplitudes at the damage frequencies are significantly higher with sufficient damage pulse and stand out from the interference and noise frequencies. Depending on the chosen envelope demodulation method, the expression of the amplitude height differs. Using the Discrete Fourier transform, an amplitude is separated into individual harmonic vibrations with different amplitudes, frequencies and phase shifts. The sum of all decomposed harmonic oscillations results in the original signal. When considering bearing damage, the damage frequency as well as its harmonic is significant.
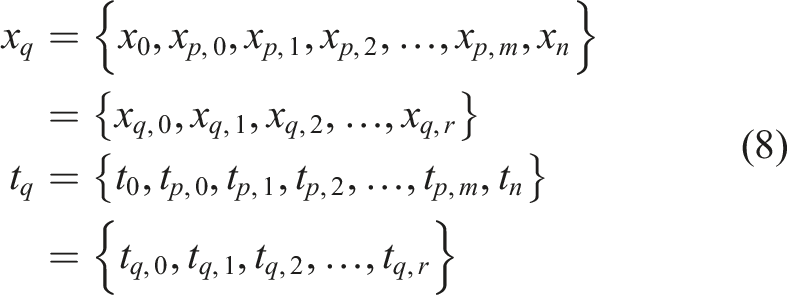
The envelope is reconstructed using the damage frequency and its harmonic multiples
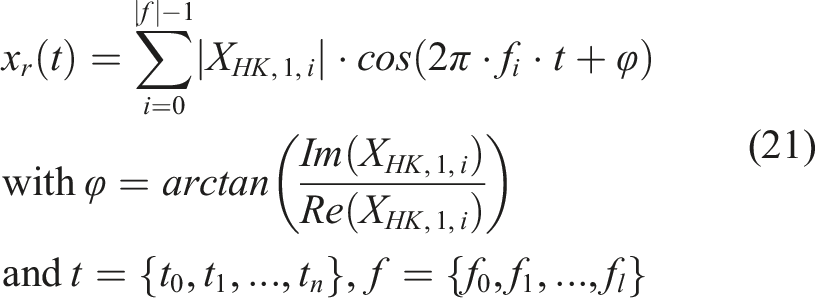
How many harmonic multiples are used for this depends on the measured vibration signal. For comparison, the number of selected frequencies should be kept constant for each envelope demodulation method. The reconstruction is evaluated for the same time interval as the measured signal.
For the determination of the percentage amplitude loss Calculation of the amplitude loss.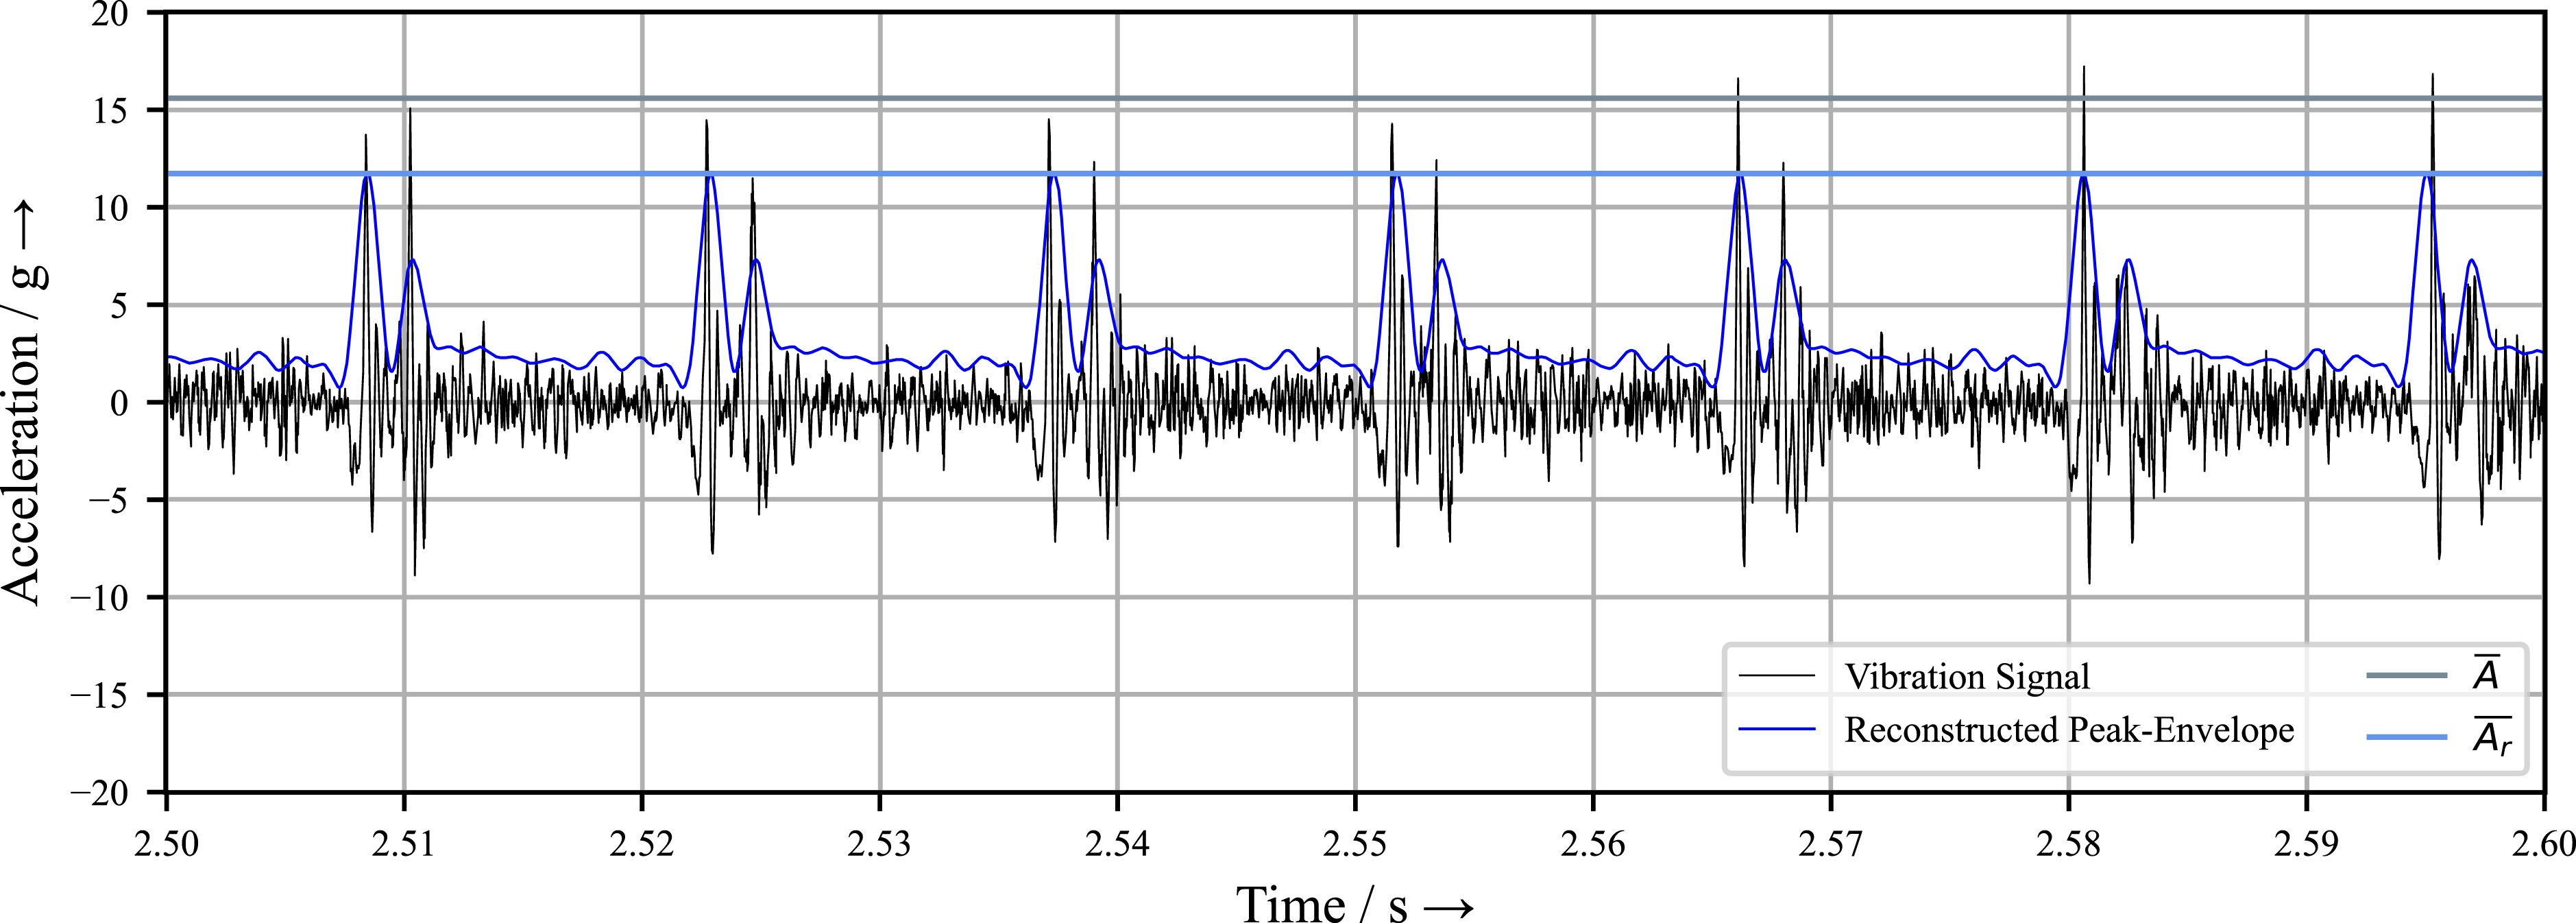
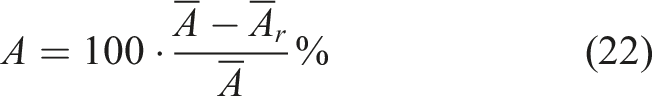
For comparison of the different envelope demodulation methods, the same time window is considered.
4.2.2. Calculation time
The calculation time is used to determine the efficiency of the envelope demodulation. For this purpose, the time required by the algorithm to calculate the envelope is determined. The time is used as a comparison parameter. For each envelope demodulation method, the average of five measurements are taken on different computers.
4.3. Definition of the window size for the peak- and RMS-envelope
By selecting the window size, the envelope of the measured vibration signal can be varied for the Peak- and RMS-envelope, in contrast to the Hilbert-envelope. This makes it possible to adapt the envelope to the measured vibration signal of the rolling bearing. The dimensions, the speed, the maximum damage frequency
4.3.1. Selection of the window size for the peak-envelope
The results of the calculation of the Peak-envelope frequency spectrum vary depending on the selected window size in the amplitude height of the damage frequency as well as the number of harmonic multiples. The rolling bearing under investigation (6006) is a deep groove ball bearing with outer ring damage. The damage on the outer ring is simulated by mechanical machining. The outer ring of the rolling bearing is fixed. The inner ring rotates at a speed of 1000 rpm.
In the frequency spectrum of the measured vibration signal in Figure 8, the maximum damage frequency can be seen with low amplitude height and the harmonic multiples. The maximum amplitude level is not at the damage frequency as expected. The envelope demodulation clearly highlights the damage frequency. Frequency spectrum of rolling bearing 6006 with discrete outer ring damage at 1000 1/min.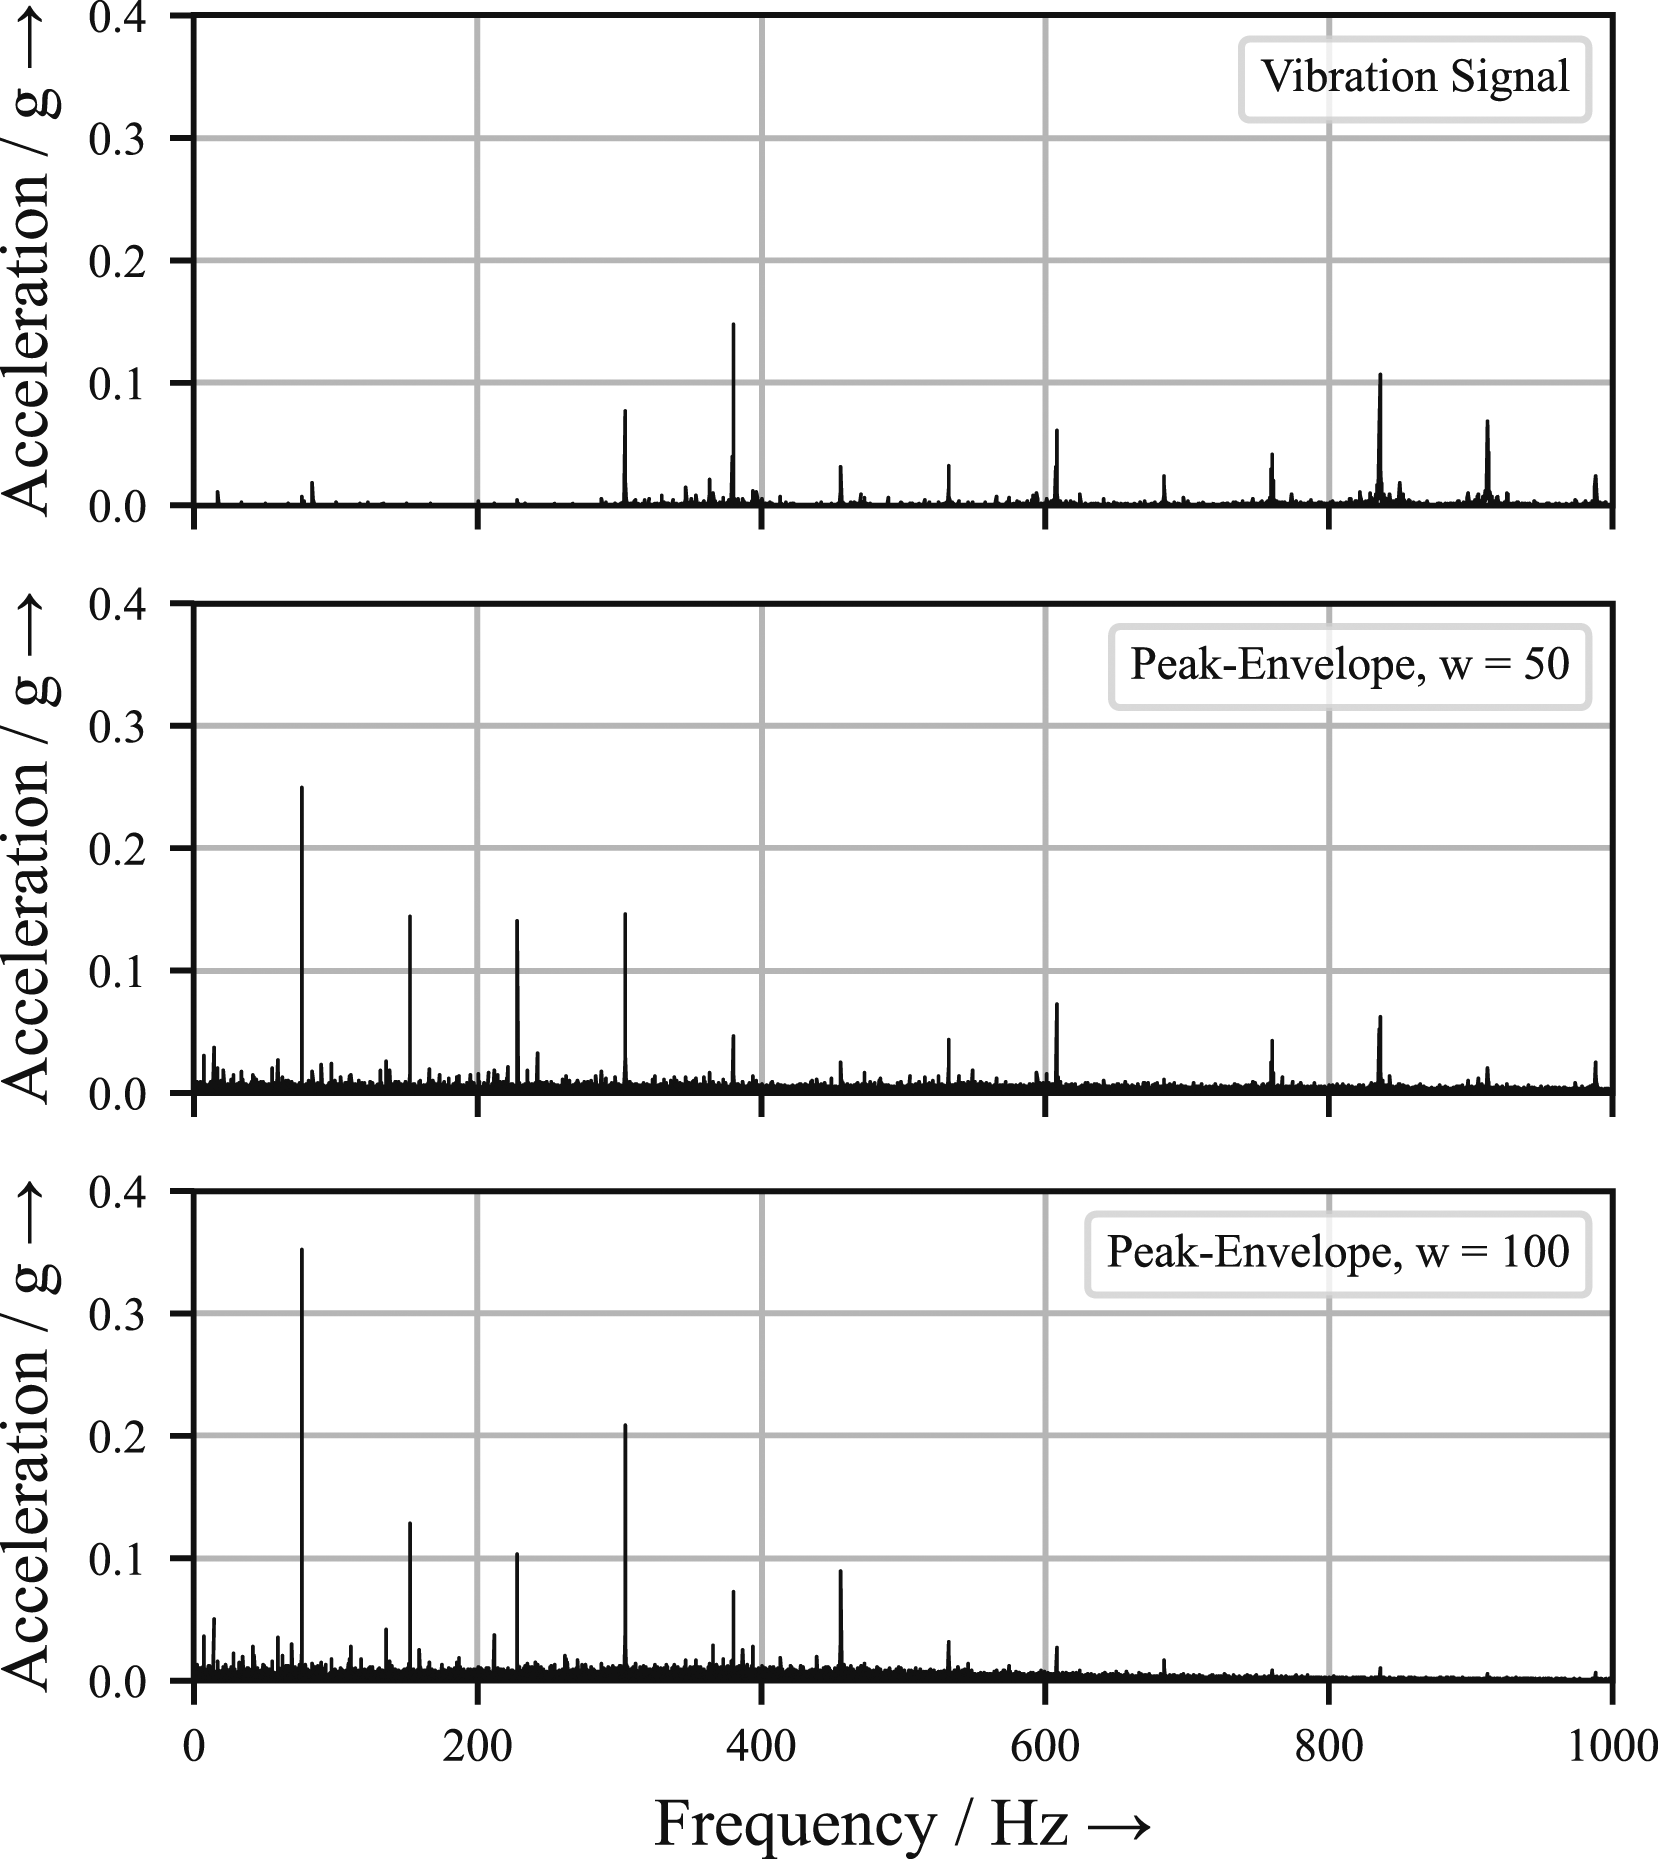
Figure 9 shows the Peak-envelope frequency spectra depending on the window size. The frequency spectrum shows the damage frequency and the harmonic multiples. With increasing window size, the amplitude height of the damage frequency increases and reaches the maximum at a window size of 500. After that, the amplitude height slowly decreases and completely disappears from a window size of 670. The number of harmonic multiples decreases as the window size increases. The amplitude of the damage frequency reaches the maximum when the amplitude of the first harmonic multiples decays. Peak-envelope frequency spectrum of rolling bearing 6006 with discrete outer ring damage at different window sizes.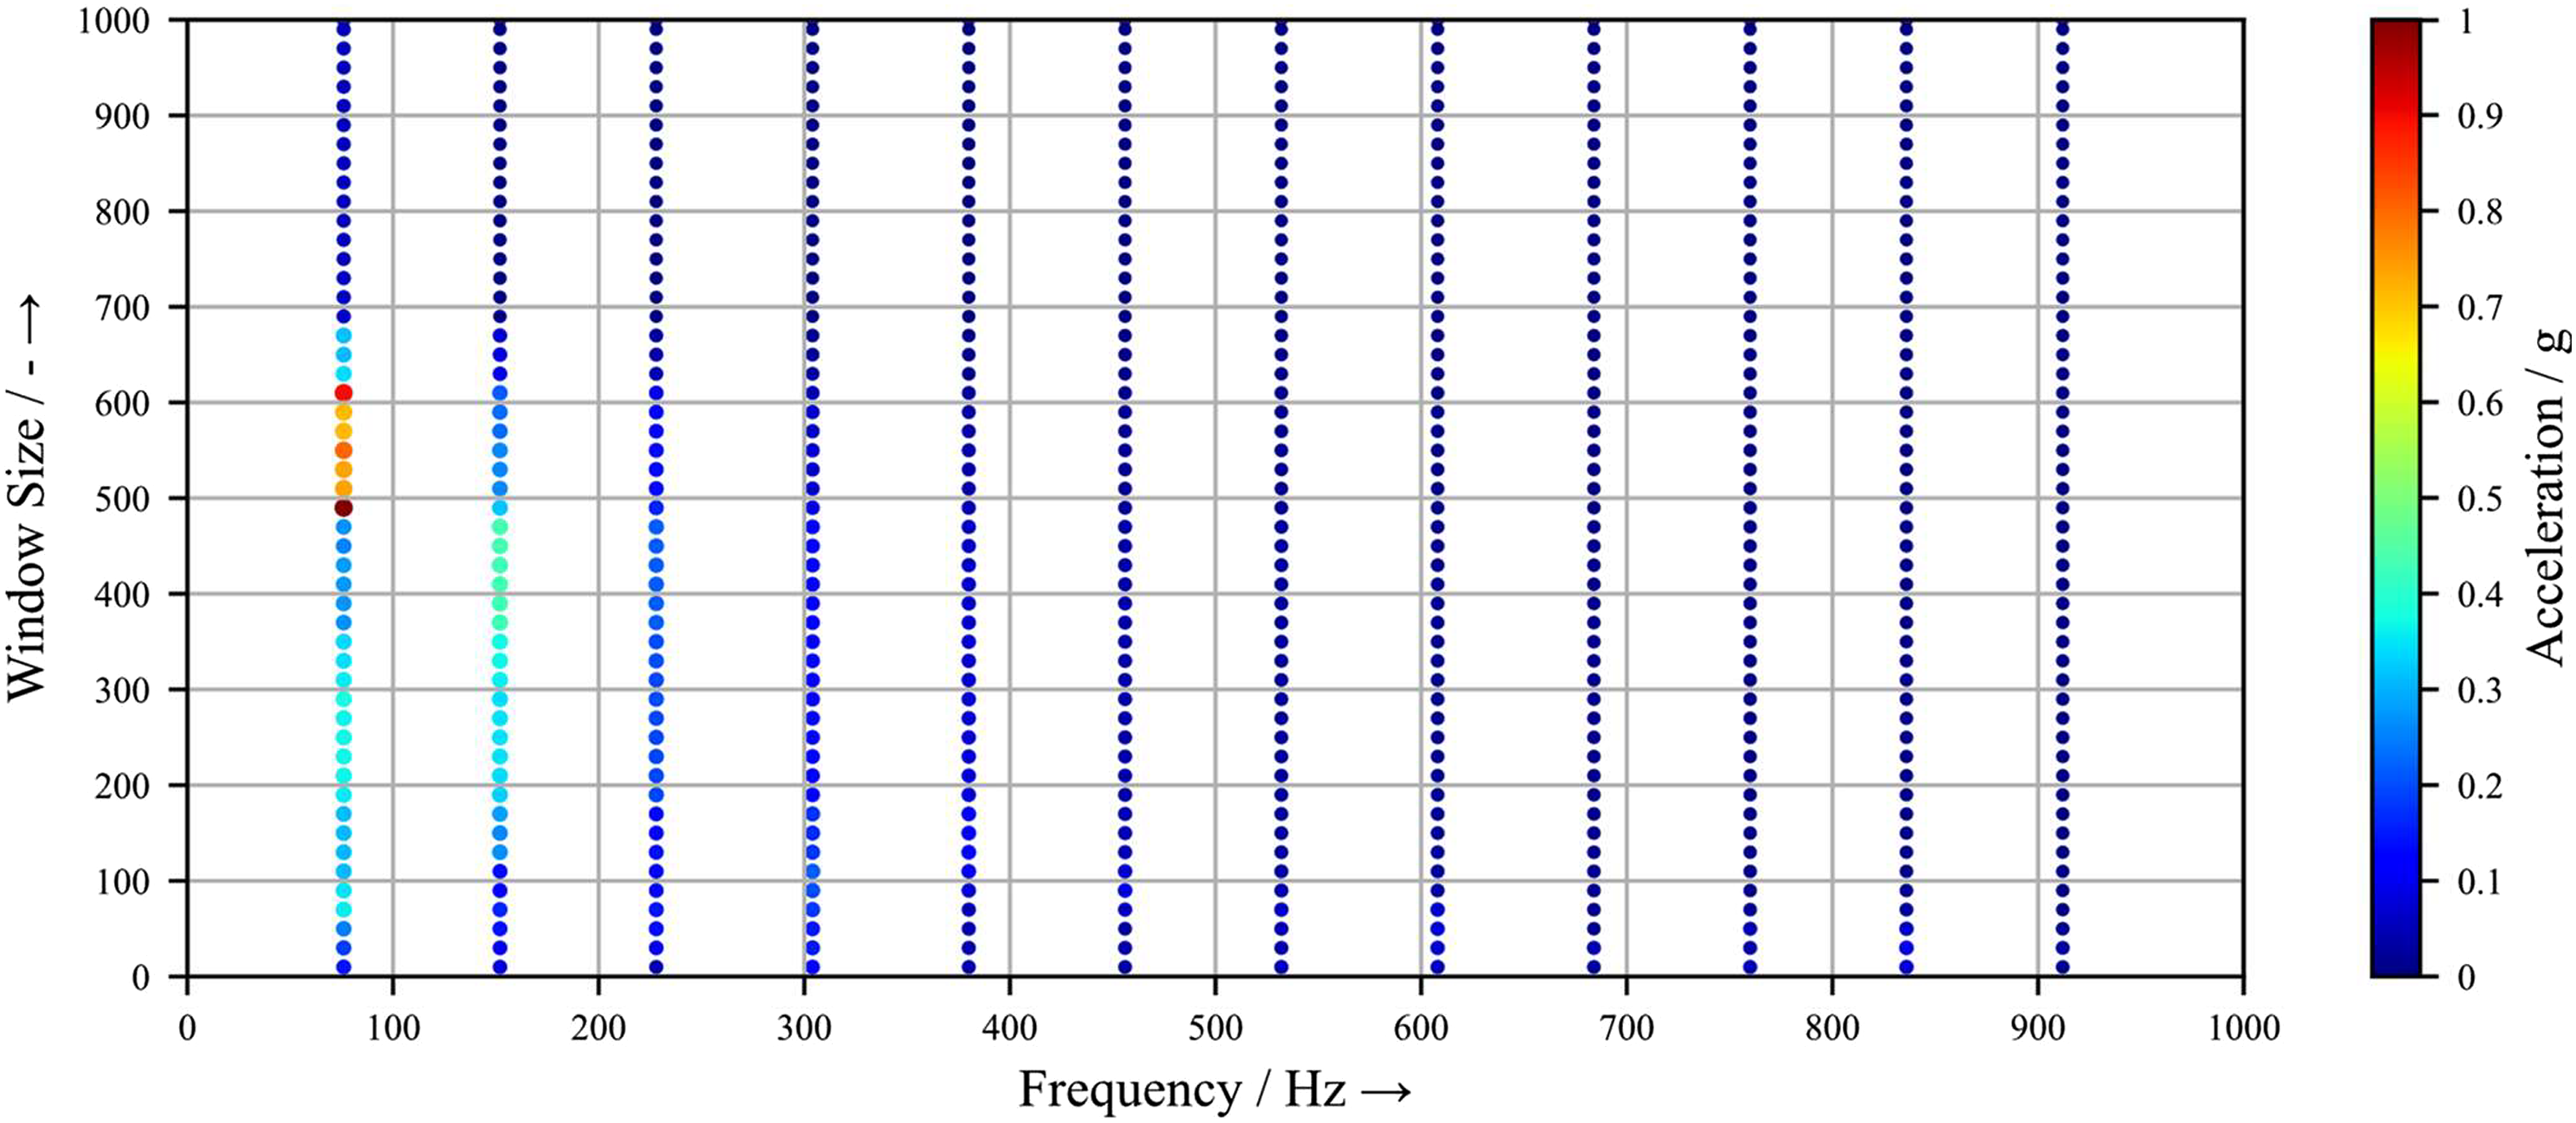
The windowing must be selected in a way that the measurement points of the damage amplitudes and a measurement point of the noise amplitudes between two successive damage amplitudes are detected. The determined measuring point at the noise amplitudes serves as a supporting point. If a natural cubic spline interpolation is carried out through the point selected in this way, the envelope curve oscillates between the damage amplitudes and the supporting points. Thus, only the frequency of the damage amplitude is demodulated by the Peak-envelope. Therefore, the damage amplitudes are maximized in the frequency spectrum. The average of the window size of the damage frequency and the window size of the first harmonic multiples forms a good approximation for determining the optimum window size.
The calculated window size forms a guide value for the Peak-envelope and is formulated as a recommendation for envelope demodulation.
4.3.2. Selection of the window size in the RMS-envelope
In the RMS-envelope, the selection of the window size has an influence on the amplitude heights of the damage frequencies and the number of harmonic multiples.
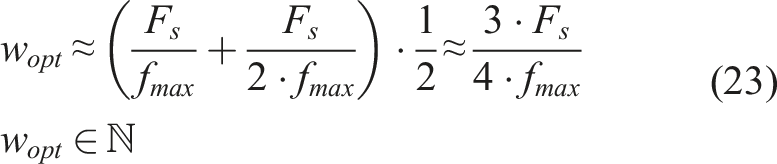
Figure 10 shows the RMS-envelope frequency spectra depending on the window size. Compared to the Peak-envelope frequency spectrum, the amplitude heights in the RMS-envelope frequency spectrum are lower. The highlighting of the harmonic frequencies and harmonic multiples reaches the maximum already at low window sizes. A definite ideal window size cannot be calculated. The choice of the window size depends on the sampling rate of the measured signal and has to be chosen appropriately. RMS-envelope frequency spectrum of rolling bearing 6006 with discrete outer ring damage at different window sizes.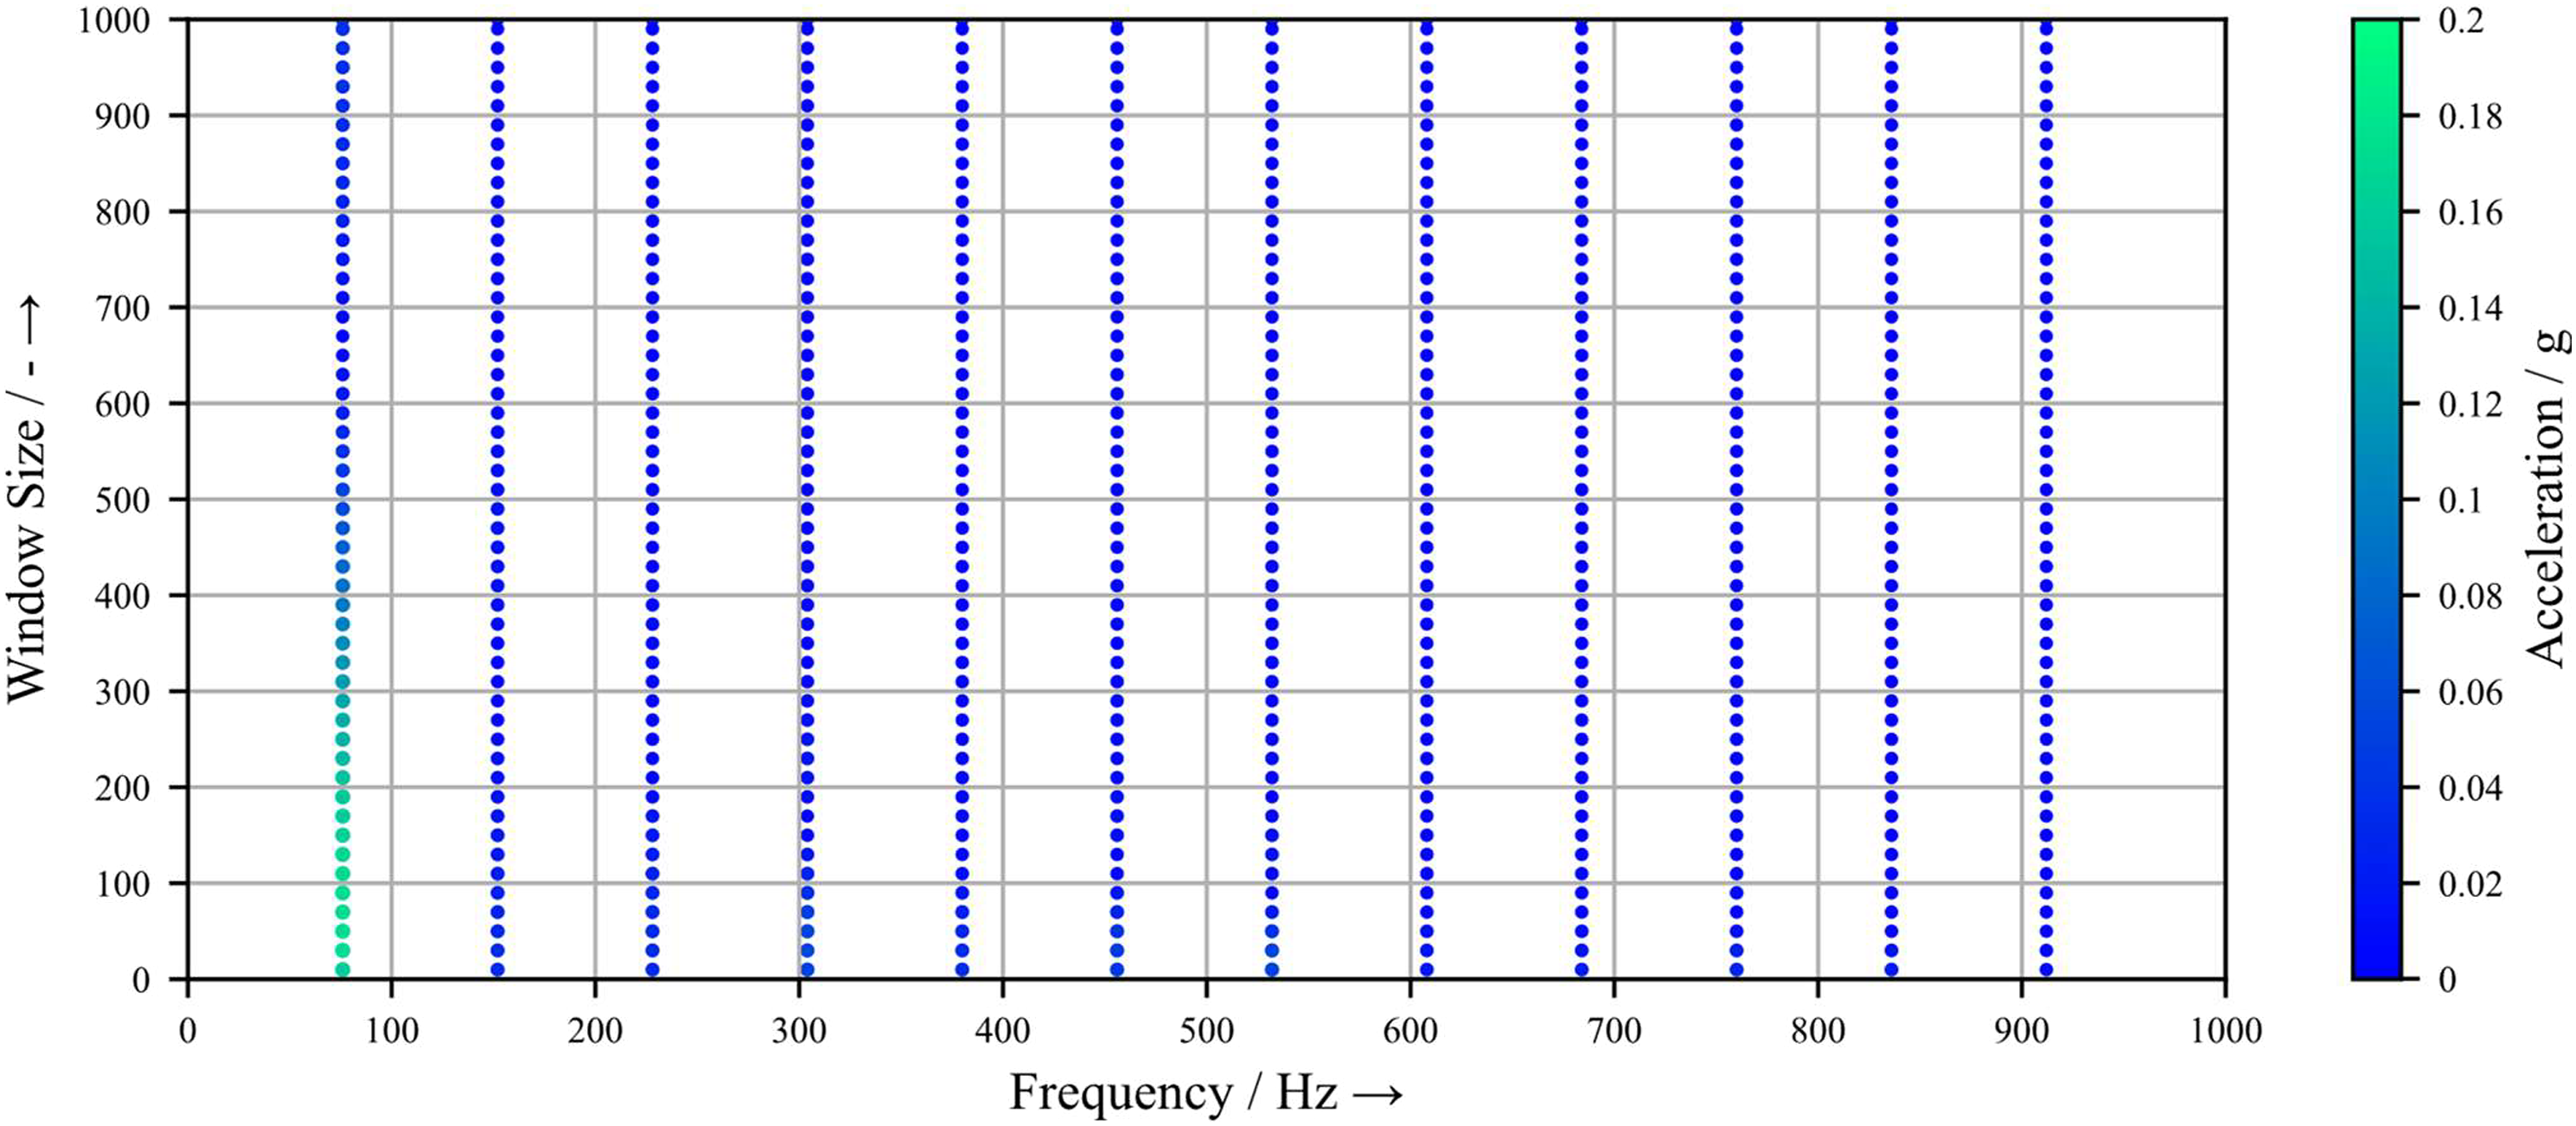
The RMS-envelope determines the effective value within the selected window size. Thus, the maximum damage amplitude cannot be reproduced, only the effective value of the damage in the window. The larger the window becomes, the more measured values outside the damage amplitude are recorded. This results in a decreasing damage amplitude with increasing window size. The damage amplitude is maximum at low window sizes. Window sizes in the range of 10 to 100 are adequate for demodulation of the measured vibration signal.
5. Discussion of Results
By comparing the values of noise-damage amplitude ratio, amplitude loss, and calculation time, the quality and efficiency of each method is discussed.
The quality of the envelope determines the detectability of damage on rolling bearings. This is visible in the noise-damage amplitude ratio (Figure 11). The Peak-envelope has very low values compared to the RMS- and Hilbert-envelope for all three investigated bearings. The Peak-envelope is more reliable in detecting damage amplitudes than the RMS-envelope. Noise-damage amplitude ratio of the envelope demodulation methods at defective rolling bearings.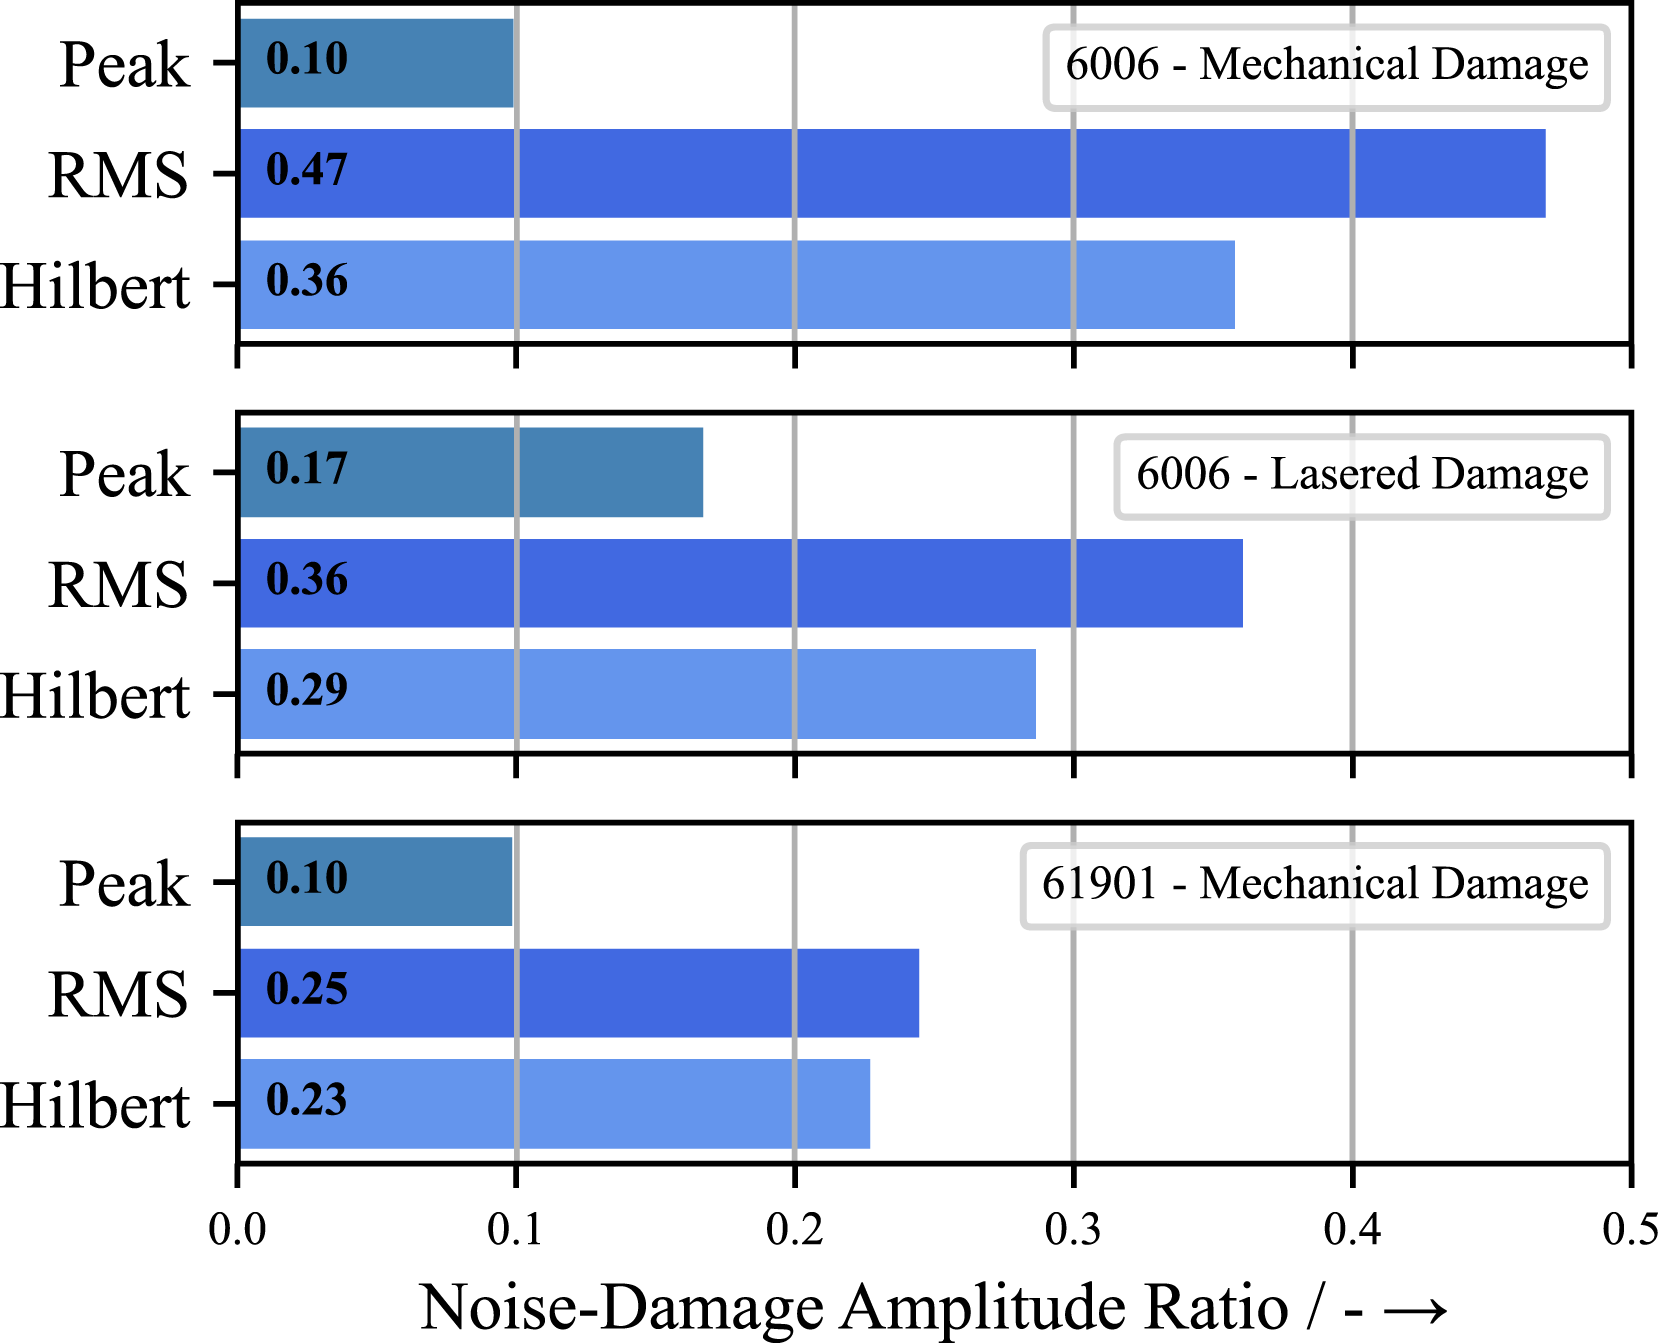
The expression of the amplitude height at the damage frequency and the harmonic multiples is different for each envelope demodulation method. Successful detection of damage to rolling bearings is ensured when the loss of amplitude height at the damage frequency is as small as possible. The amplitude loss of the three detection methods is shown in Figure 12. For the Peak-envelope, the loss of amplitude height is the lowest. Thus, the detection of rolling element bearing damage with the Peak-envelope is feasible with lower amplitude height losses compared to the RMS- and Hilbert-envelopes. The RMS-envelope has high amplitude height losses. Amplitude loss of the envelope demodulation methods at defective rolling bearings.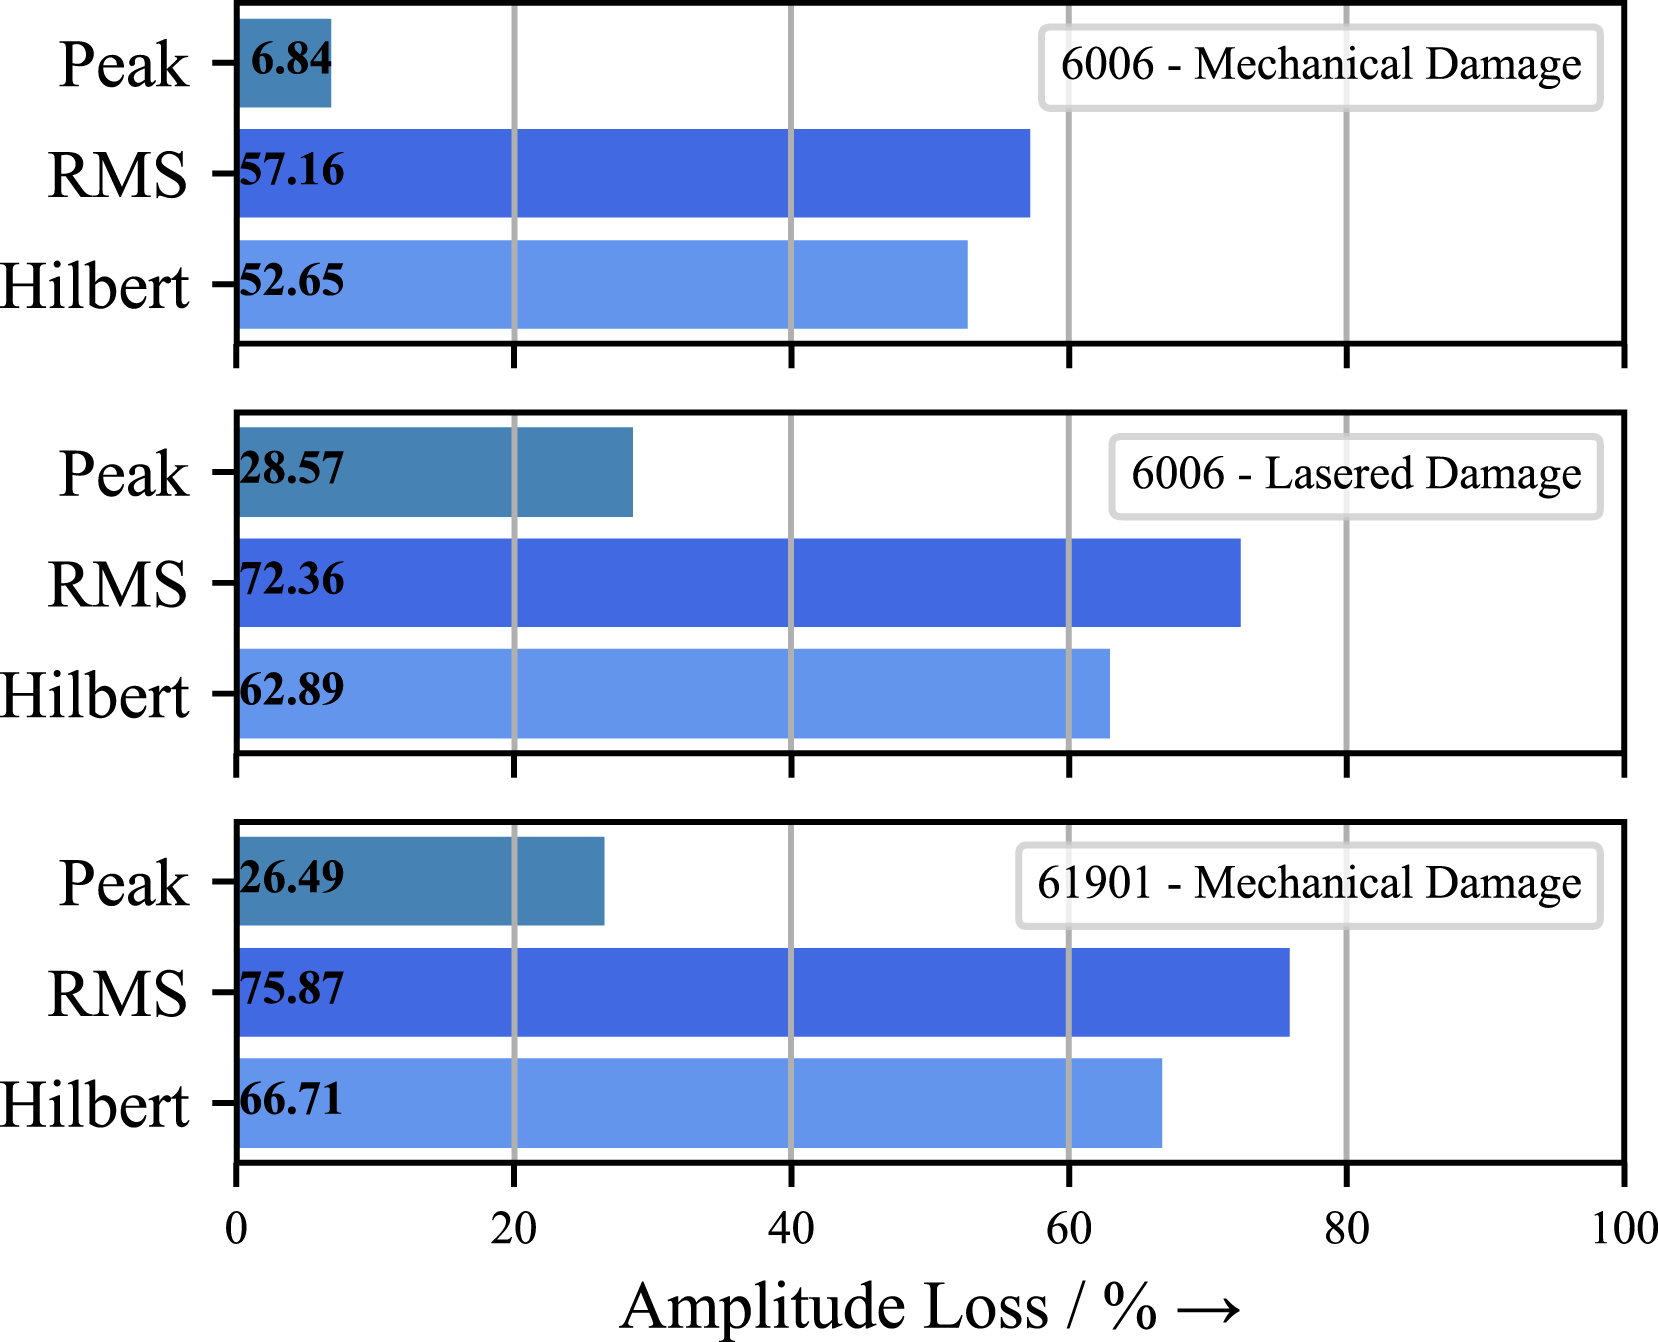
To understand the relationship between the noise-damage amplitude ratio and amplitude loss, the calculated values of the 6006 rolling bearing with mechanical damage and lasered damage are compared. The mechanical damage is more distinct with resulting high damage amplitudes. With lasered damage, the damage amplitudes are lower. The noise-damage amplitude ratio of the Peak-envelope is lower at mechanical damage than for lasered damage. This is also true for the amplitude loss. Comparing the values for the RMS-envelope, this is not the case. The noise-damage amplitude ratio is higher at mechanical damage than with lasered damage. But the amplitude loss of the RMS-envelope is lower for mechanical damage than for lasered damage. The magnitude of the damage amplitude and the salience of the damage amplitudes relative to the noise amplitudes are key elements that determine the quality of the envelope.
The noise-damage amplitude ratio quantifies the salience of the damage amplitudes relative to the noise amplitudes by the envelope. With the amplitude loss, the detectability of the damage amplitude from the envelope is quantified. Thus, both criteria determine the quality of the envelope curve. By comparing the two quality criteria, a suitable envelope can be determined based on the characteristics of the vibration signal.
The efficiency of the envelope calculation is determined over time and shown in Figure 13. The algorithm for calculating the Peak-envelope is very time consuming. The advantage that the Peak-envelope provides in terms of noise-damage amplitude ratio and amplitude loss is diminished by the high computation time. The Hilbert-envelope performs moderately on the noise-damage amplitude ratio and amplitude loss but requires very little computation time. Calculation time of the envelope demodulation methods at defective rolling bearings.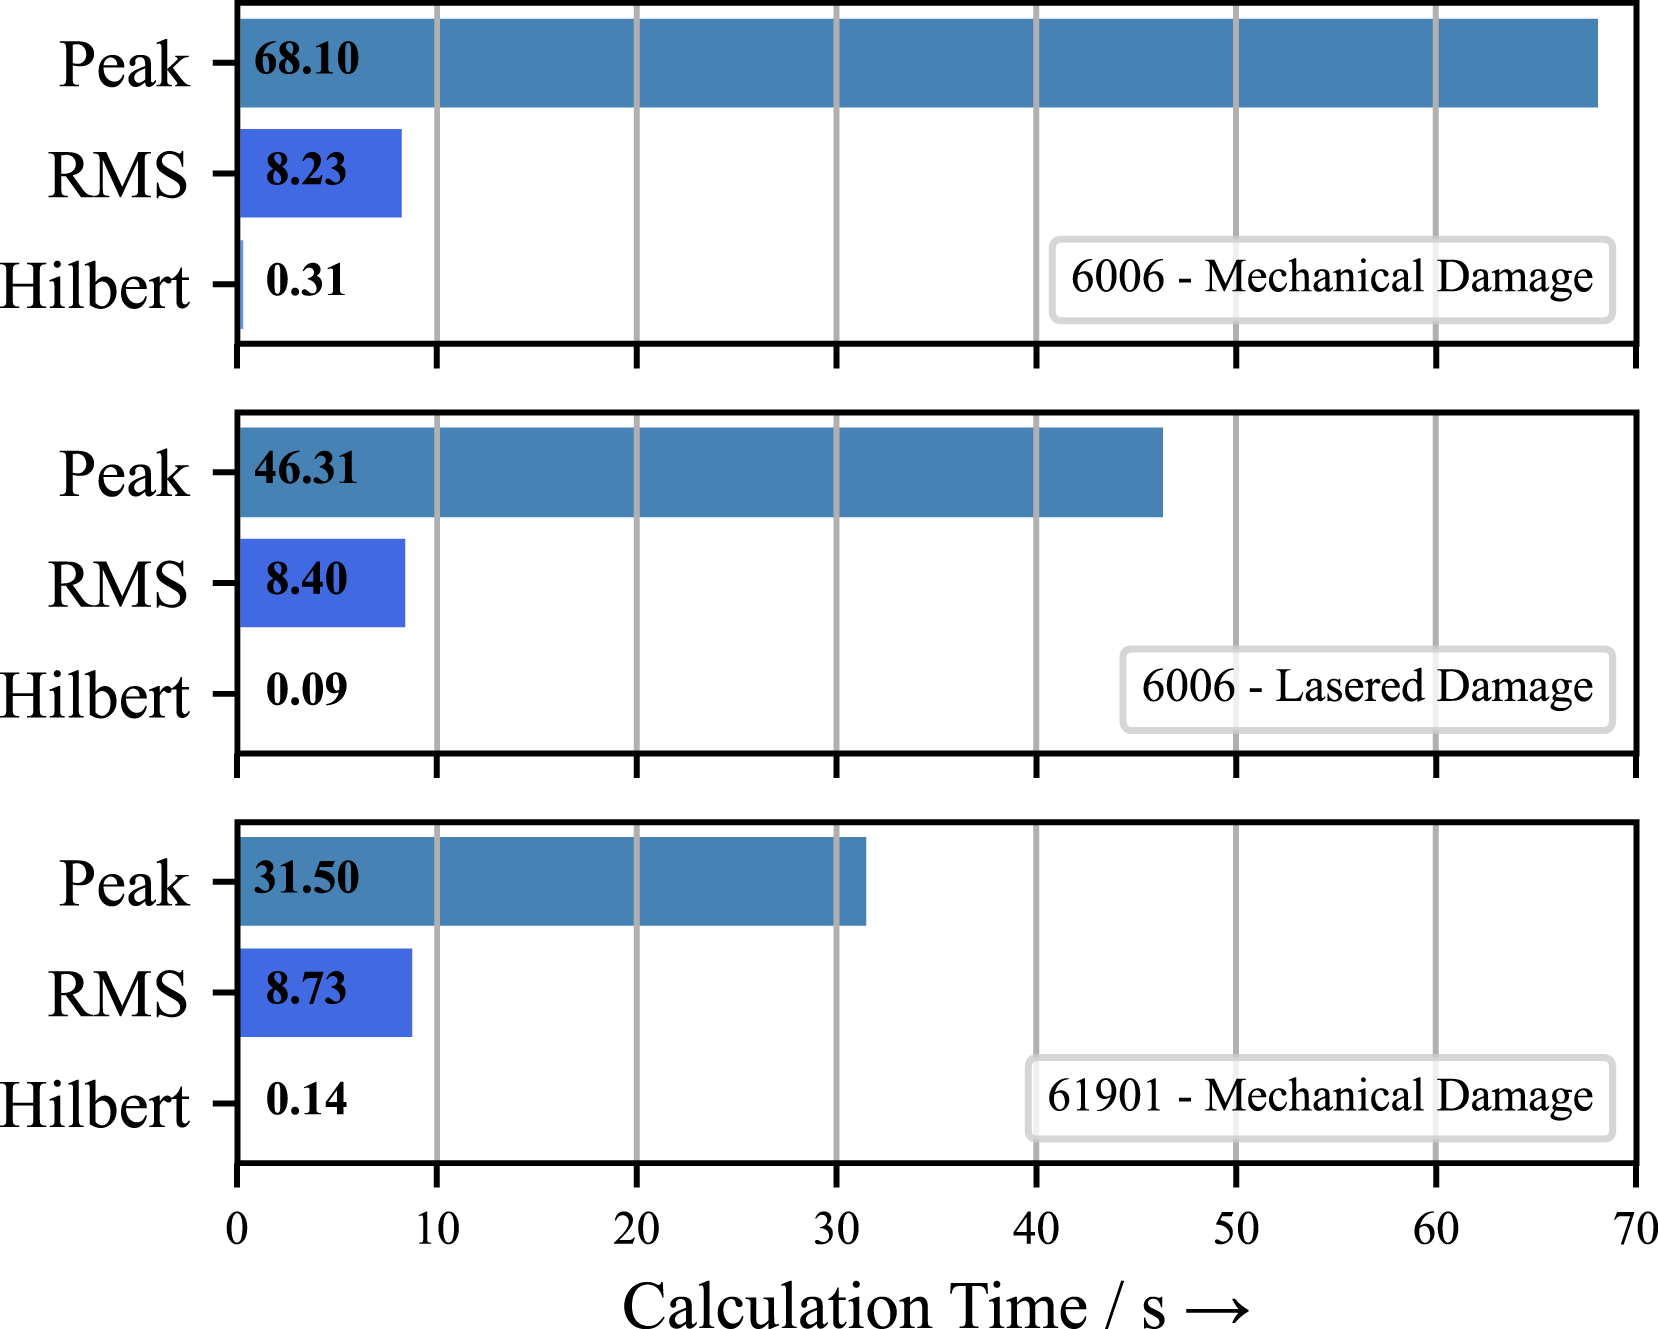
6. Method
Based on the results of the quality criteria, it can be stated that any envelope demodulation method is able to detect damage. However, depending on the application and requirements, certain envelope methods may provide more promising results than others. Based on these findings, the following decision tool for selecting an appropriate envelope demodulation method is developed. This is intended to help in the decision-making process to select the appropriate envelope.
The Peak-envelope is particularly suitable for bearing condition monitoring because the low noise-damage amplitude ratio clearly highlights the damage amplitudes over the noise amplitudes. Thus, damage amplitudes, especially high amplitudes, are detected particularly well. In addition, the amplitudes are precisely reproduced. There is only a small amplitude loss when using the Peak-envelope. The disadvantage here is a high computing time for the calculation of the Peak-envelope. Thus, measurements with high data sets are unsuitable for an evaluation with the Peak-envelope.
The RMS-envelope has a larger amplitude loss compared to the Peak-envelope. Although the calculation time is considerably less than those of the Peak-envelope, it cannot catch up with the efficiency of the Hilbert-envelope. Due to a very high noise-damage amplitude ratio, however, only more conspicuous damage can be detected here; for inconspicuous bearing damage, the RMS-envelope is more or less suitable.
In contrast to the Peak-envelope, a considerable amplitude loss is absorbed by the Hilbert-envelope during calculation and generation. Here, on the other hand, the execution is much more efficient, resulting in low computation time. As a result, this demodulation method can be applied to large amounts of data and when monitoring the condition of multiple bearings. With this method, like the RMS-envelope, more inconspicuous bearing damage with low amplitudes can be detected, which is expressed in the noise-damage amplitude ratio in the difference between mechanical and lasered damage.
Therefore, the decision tool was established as seen in Figure 14. If the amplitudes of the signal are particularly important in an evaluation, the Peak-envelope should be used, likewise with a high damage intensity. If a low damage intensity is present, the Hilbert-envelope can be used; however, the RMS-envelope is possible, but minimally inferior as far as the highlighting of the damage amplitudes is concerned. In case of high data sets and an associated high computing time, the Hilbert-envelope should be used. Developed decision tool for the selection of the envelope demodulation.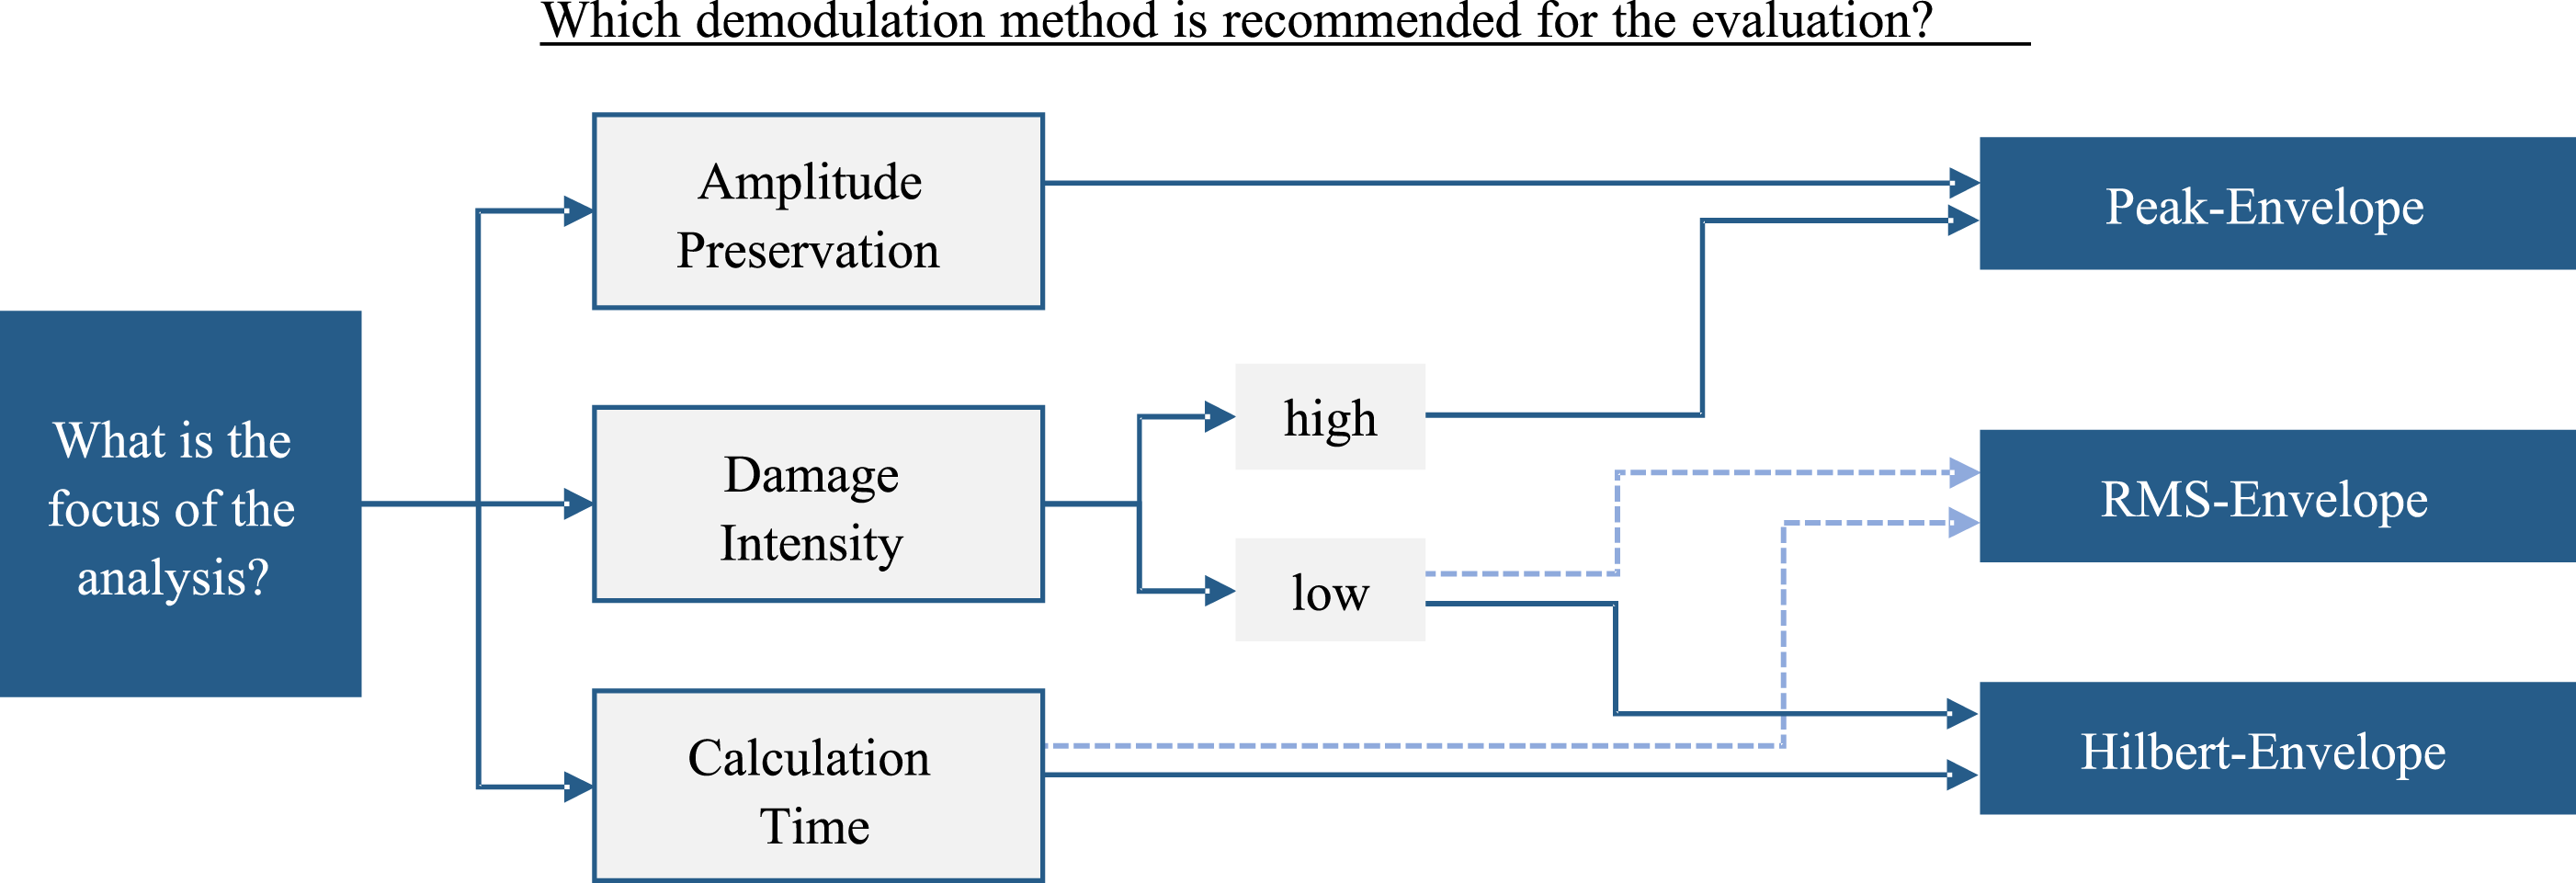
7. Conclusion
Envelope demodulation is an important tool in the analysis of rolling bearing damage. The calculation of the Peak- and RMS-envelope is more complex than the Hilbert-envelope. However, unlike the Peak- and RMS-envelope, the Hilbert-envelope cannot be fitted to the measured vibration signal.
The application of envelope demodulation methods to a vibration signal of a rolling bearing should be done systematically. By defining quality criteria, the three envelope demodulation methods are quantified, and the advantages and disadvantages are discussed. As a result, a decision tool is developed which shows that for each envelope demodulation method, a particularly suitable vibration signal characteristic can be assigned. With the right selection based on the decision tool, a high information extraction from the vibration signal of the rolling bearing is possible. This contributes to successful damage detection of rolling bearings.
To further validate the results presented here, further research on this topic will be conducted on a larger scale in the future using different data sets.
Footnotes
Declaration of conflicting interests
The author(s) declared no potential conflicts of interest with respect to the research, authorship, and/or publication of this article.
Funding
The author(s) received no financial support for the research, authorship, and/or publication of this article.